
Sequence stratigraphy and sediment distribution pattern … · 1 Sequence stratigraphy and sediment...
10
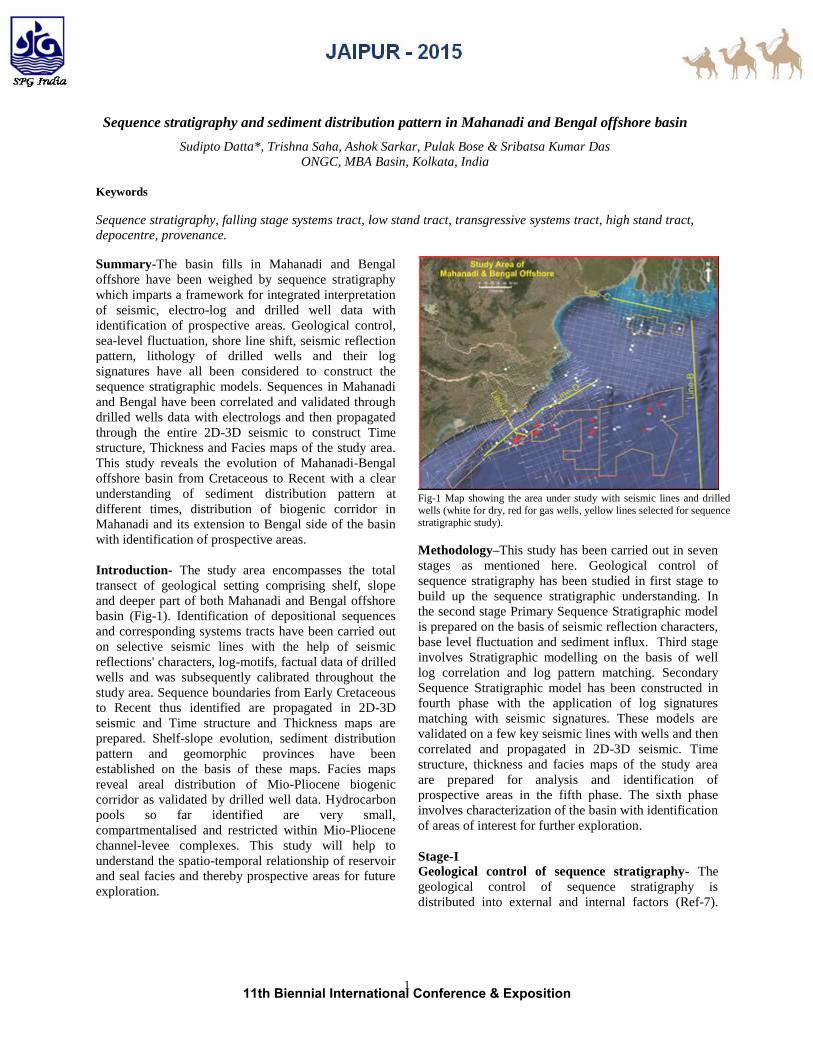
1 Sequence stratigraphy and sediment distribution pattern in Mahanadi and Bengal offshore basin Sudipto Datta*, Trishna Saha, Ashok Sarkar, Pulak Bose & Sribatsa Kumar Das ONGC, MBA Basin, Kolkata, India Keywords Sequence stratigraphy, falling stage systems tract, low stand tract, transgressive systems tract, high stand tract, depocentre, provenance. Summary-The basin fills in Mahanadi and Bengal offshore have been weighed by sequence stratigraphy which imparts a framework for integrated interpretation of seismic, electro-log and drilled well data with identification of prospective areas. Geological control, sea-level fluctuation, shore line shift, seismic reflection pattern, lithology of drilled wells and their log signatures have all been considered to construct the sequence stratigraphic models. Sequences in Mahanadi and Bengal have been correlated and validated through drilled wells data with electrologs and then propagated through the entire 2D-3D seismic to construct Time structure, Thickness and Facies maps of the study area. This study reveals the evolution of Mahanadi-Bengal offshore basin from Cretaceous to Recent with a clear understanding of sediment distribution pattern at different times, distribution of biogenic corridor in Mahanadi and its extension to Bengal side of the basin with identification of prospective areas. Introduction- The study area encompasses the total transect of geological setting comprising shelf, slope and deeper part of both Mahanadi and Bengal offshore basin (Fig-1). Identification of depositional sequences and corresponding systems tracts have been carried out on selective seismic lines with the help of seismic reflections' characters, log-motifs, factual data of drilled wells and was subsequently calibrated throughout the study area. Sequence boundaries from Early Cretaceous to Recent thus identified are propagated in 2D-3D seismic and Time structure and Thickness maps are prepared. Shelf-slope evolution, sediment distribution pattern and geomorphic provinces have been established on the basis of these maps. Facies maps reveal areal distribution of Mio-Pliocene biogenic corridor as validated by drilled well data. Hydrocarbon pools so far identified are very small, compartmentalised and restricted within Mio-Pliocene channel-levee complexes. This study will help to understand the spatio-temporal relationship of reservoir and seal facies and thereby prospective areas for future exploration. Fig-1 Map showing the area under study with seismic lines and drilled wells (white for dry, red for gas wells, yellow lines selected for sequence stratigraphic study). Methodology–This study has been carried out in seven stages as mentioned here. Geological control of sequence stratigraphy has been studied in first stage to build up the sequence stratigraphic understanding. In the second stage Primary Sequence Stratigraphic model is prepared on the basis of seismic reflection characters, base level fluctuation and sediment influx. Third stage involves Stratigraphic modelling on the basis of well log correlation and log pattern matching. Secondary Sequence Stratigraphic model has been constructed in fourth phase with the application of log signatures matching with seismic signatures. These models are validated on a few key seismic lines with wells and then correlated and propagated in 2D-3D seismic. Time structure, thickness and facies maps of the study area are prepared for analysis and identification of prospective areas in the fifth phase. The sixth phase involves characterization of the basin with identification of areas of interest for further exploration. Stage-I Geological control of sequence stratigraphy- The geological control of sequence stratigraphy is distributed into external and internal factors (Ref-7). 11th Biennial International Conference & Exposition
Transcript of Sequence stratigraphy and sediment distribution pattern … · 1 Sequence stratigraphy and sediment...
1
Sequence stratigraphy and sediment distribution pattern in Mahanadi and Bengal offshore basin
Sudipto Datta*, Trishna Saha, Ashok Sarkar, Pulak Bose & Sribatsa Kumar Das
ONGC, MBA Basin, Kolkata, India
Keywords
Sequence stratigraphy, falling stage systems tract, low stand tract, transgressive systems tract, high stand tract,
depocentre, provenance.
Summary-The basin fills in Mahanadi and Bengal
offshore have been weighed by sequence stratigraphy
which imparts a framework for integrated interpretation
of seismic, electro-log and drilled well data with
identification of prospective areas. Geological control,
sea-level fluctuation, shore line shift, seismic reflection
pattern, lithology of drilled wells and their log
signatures have all been considered to construct the
sequence stratigraphic models. Sequences in Mahanadi
and Bengal have been correlated and validated through
drilled wells data with electrologs and then propagated
through the entire 2D-3D seismic to construct Time
structure, Thickness and Facies maps of the study area.
This study reveals the evolution of Mahanadi-Bengal
offshore basin from Cretaceous to Recent with a clear
understanding of sediment distribution pattern at
different times, distribution of biogenic corridor in
Mahanadi and its extension to Bengal side of the basin
with identification of prospective areas.
Introduction- The study area encompasses the total
transect of geological setting comprising shelf, slope
and deeper part of both Mahanadi and Bengal offshore
basin (Fig-1). Identification of depositional sequences
and corresponding systems tracts have been carried out
on selective seismic lines with the help of seismic
reflections' characters, log-motifs, factual data of drilled
wells and was subsequently calibrated throughout the
study area. Sequence boundaries from Early Cretaceous
to Recent thus identified are propagated in 2D-3D
seismic and Time structure and Thickness maps are
prepared. Shelf-slope evolution, sediment distribution
pattern and geomorphic provinces have been
established on the basis of these maps. Facies maps
reveal areal distribution of Mio-Pliocene biogenic
corridor as validated by drilled well data. Hydrocarbon
pools so far identified are very small,
compartmentalised and restricted within Mio-Pliocene
channel-levee complexes. This study will help to
understand the spatio-temporal relationship of reservoir
and seal facies and thereby prospective areas for future
exploration.
Fig-1 Map showing the area under study with seismic lines and drilled
wells (white for dry, red for gas wells, yellow lines selected for sequence stratigraphic study).
Methodology–This study has been carried out in seven
stages as mentioned here. Geological control of
sequence stratigraphy has been studied in first stage to
build up the sequence stratigraphic understanding. In
the second stage Primary Sequence Stratigraphic model
is prepared on the basis of seismic reflection characters,
base level fluctuation and sediment influx. Third stage
involves Stratigraphic modelling on the basis of well
log correlation and log pattern matching. Secondary
Sequence Stratigraphic model has been constructed in
fourth phase with the application of log signatures
matching with seismic signatures. These models are
validated on a few key seismic lines with wells and then
correlated and propagated in 2D-3D seismic. Time
structure, thickness and facies maps of the study area
are prepared for analysis and identification of
prospective areas in the fifth phase. The sixth phase
involves characterization of the basin with identification
of areas of interest for further exploration.
Stage-I
Geological control of sequence stratigraphy- The
geological control of sequence stratigraphy is
distributed into external and internal factors (Ref-7).
11th Biennial International Conference & Exposition
Sequence stratigraphy and sediment distribution pattern of Mahanadi and Bengal offshore
First major external factor includes the concept of Plate-
tectonics which has got a major role in formation of east
coast of India vis a vis Mahanadi and Bengal basin. The
break-up of eastern Gondwana gave birth to Indian
plate. Subsequent rifting followed by drifting towards
north of Indian plate culminated with the collision of
Asian plate. This event gave rise to the Himalayas to
the north and Bay of Bengal to the south-east of India.
The interplay of NNW-SSE Gondwana trend, ENE-
WSW and NE-SW Eastern-Ghat trend and their
reactivation resulted in the present day tectonic set up
of the basin. General strike of the basin is NE-SW with
homoclinal dip towards southeast. Post rifting
sedimentation in the basin from Late Cretaceous to
recent has been controlled by three external agencies,
namely climate, provenance type and characteristic of
drainage basin which includes shelf width and gradient.
This third variable exhibits high or low relief,
provenance in proximity to marine basin, a small or big
drainage area and a narrow or broad shelf.
Internal factors include three agencies; namely, gradient
of the sea floor, confinement by channels or the
topography of the sea bed and nature of bed rock which
control sedimentation after sediment gravity flows have
left the shelf edge. The gradient control is explained by
the change from erosional to depositional settings and is
associated with a decrease in confinement i.e. confined
to weekly confined to distributaries. Nature of bed rock
i.e. soft or hard determines the channel or canyon path.
Stage-II
Primary Sequence Stratigraphic model- Primary
model is prepared for the prediction of facies away
from the control points. Following steps are undertaken
to carry out the study for building this sequence
stratigraphic model. Seismic facies analysis plays a
major role in understanding the sediment distribution or
stratal stacking pattern (Ref-2) and depositional
elements, the key factors of sequence stratigraphy.
A few key seismic lines are taken up to establish
systems tracts out of which three representative seismic
lines-A in Mahanadi ,B and C in Bengal offshore and
another seismic Line-D in strike are presented here with
interpreted systems tracts and sequence boundaries
(Fig-1). Reflection characters of different systems tracts
are within resolvable limit in Neogene. These are not
clear in Paleogene or Cretaceous sections. The facies
analysis of Neogene section suggests that the seismic
reflection characters on the shelfal side indicate
different types of prograding features of regressive-
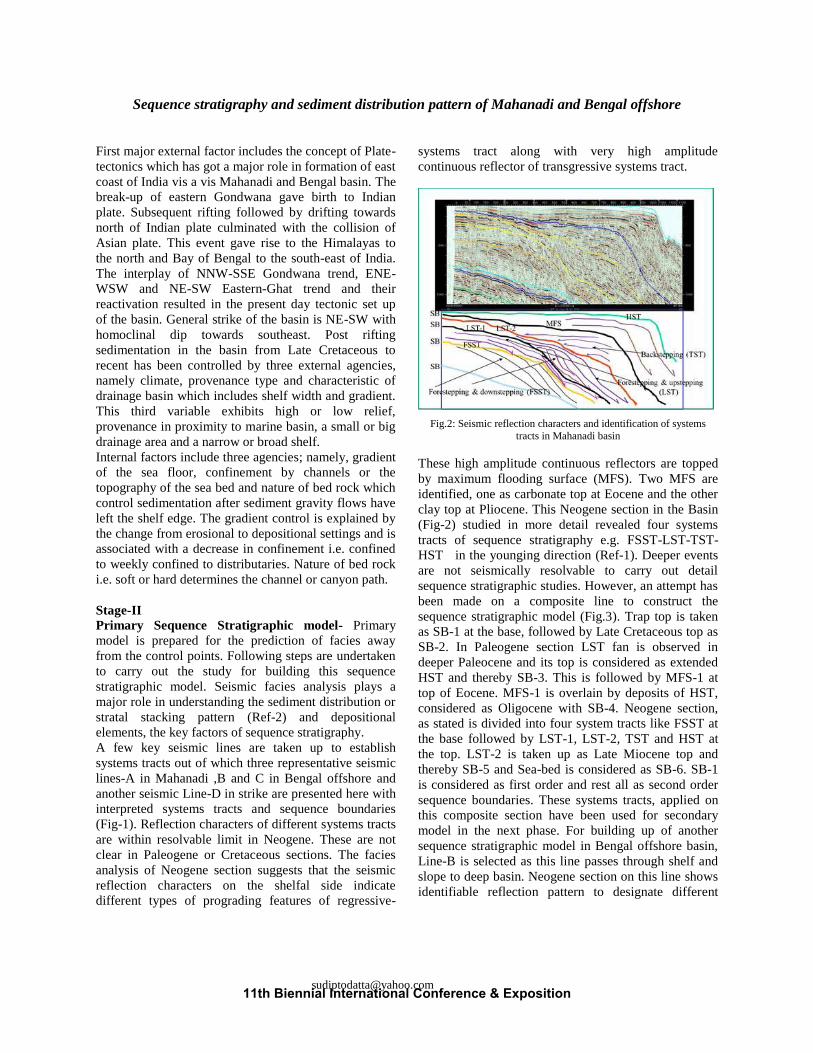
systems tract along with very high amplitude
continuous reflector of transgressive systems tract.
Fig.2: Seismic reflection characters and identification of systems
tracts in Mahanadi basin
These high amplitude continuous reflectors are topped
by maximum flooding surface (MFS). Two MFS are
identified, one as carbonate top at Eocene and the other
clay top at Pliocene. This Neogene section in the Basin
(Fig-2) studied in more detail revealed four systems
tracts of sequence stratigraphy e.g. FSST-LST-TST-
HST in the younging direction (Ref-1). Deeper events
are not seismically resolvable to carry out detail
sequence stratigraphic studies. However, an attempt has
been made on a composite line to construct the
sequence stratigraphic model (Fig.3). Trap top is taken
as SB-1 at the base, followed by Late Cretaceous top as
SB-2. In Paleogene section LST fan is observed in
deeper Paleocene and its top is considered as extended
HST and thereby SB-3. This is followed by MFS-1 at
top of Eocene. MFS-1 is overlain by deposits of HST,
considered as Oligocene with SB-4. Neogene section,
as stated is divided into four system tracts like FSST at
the base followed by LST-1, LST-2, TST and HST at
the top. LST-2 is taken up as Late Miocene top and
thereby SB-5 and Sea-bed is considered as SB-6. SB-1
is considered as first order and rest all as second order
sequence boundaries. These systems tracts, applied on
this composite section have been used for secondary
model in the next phase. For building up of another
sequence stratigraphic model in Bengal offshore basin,
Line-B is selected as this line passes through shelf and
slope to deep basin. Neogene section on this line shows
identifiable reflection pattern to designate different
11th Biennial International Conference & Exposition
Sequence stratigraphy and sediment distribution pattern of Mahanadi and Bengal offshore
systems tracts (Fig-4). Drilled well data could not be
used in application of sequence stratigraphy in Bengal
basin as all offshore wells were
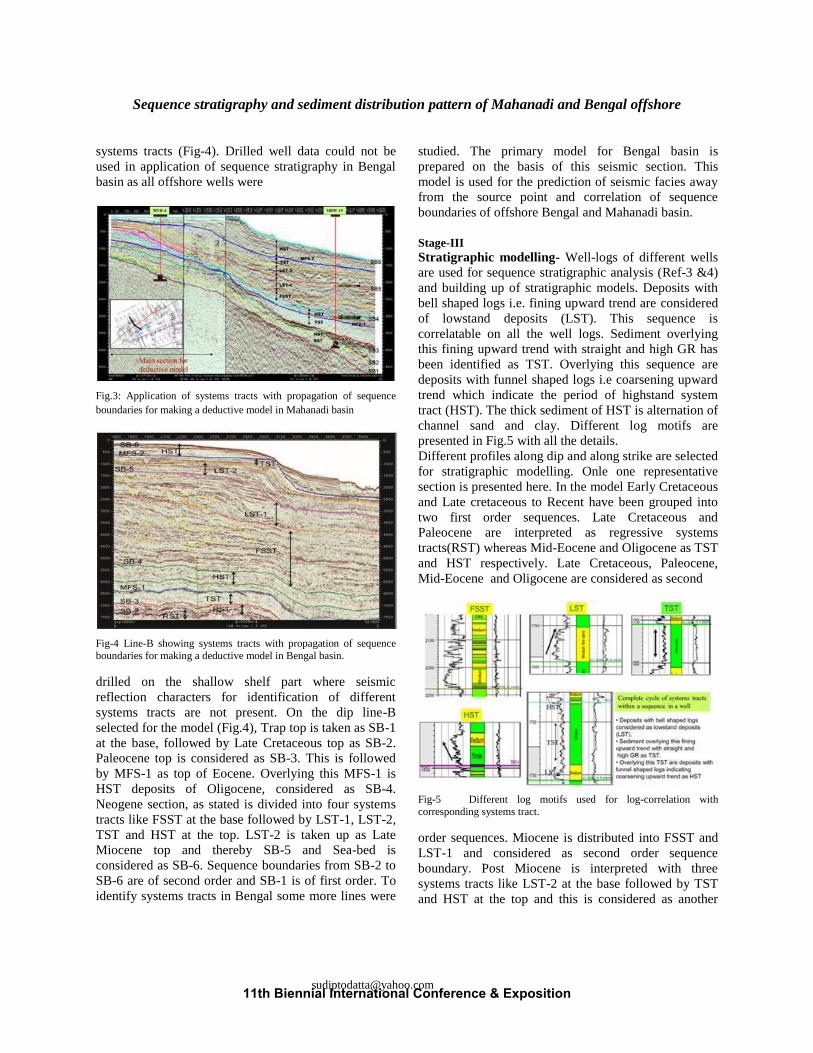
Fig.3: Application of systems tracts with propagation of sequence
boundaries for making a deductive model in Mahanadi basin
Fig-4 Line-B showing systems tracts with propagation of sequence
boundaries for making a deductive model in Bengal basin.
drilled on the shallow shelf part where seismic
reflection characters for identification of different
systems tracts are not present. On the dip line-B
selected for the model (Fig.4), Trap top is taken as SB-1
at the base, followed by Late Cretaceous top as SB-2.
Paleocene top is considered as SB-3. This is followed
by MFS-1 as top of Eocene. Overlying this MFS-1 is
HST deposits of Oligocene, considered as SB-4.
Neogene section, as stated is divided into four systems
tracts like FSST at the base followed by LST-1, LST-2,
TST and HST at the top. LST-2 is taken up as Late
Miocene top and thereby SB-5 and Sea-bed is
considered as SB-6. Sequence boundaries from SB-2 to
SB-6 are of second order and SB-1 is of first order. To
identify systems tracts in Bengal some more lines were
studied. The primary model for Bengal basin is
prepared on the basis of this seismic section. This
model is used for the prediction of seismic facies away
from the source point and correlation of sequence
boundaries of offshore Bengal and Mahanadi basin. Stage-III
Stratigraphic modelling- Well-logs of different wells
are used for sequence stratigraphic analysis (Ref-3 &4)
and building up of stratigraphic models. Deposits with
bell shaped logs i.e. fining upward trend are considered
of lowstand deposits (LST). This sequence is
correlatable on all the well logs. Sediment overlying
this fining upward trend with straight and high GR has
been identified as TST. Overlying this sequence are
deposits with funnel shaped logs i.e coarsening upward
trend which indicate the period of highstand system
tract (HST). The thick sediment of HST is alternation of
channel sand and clay. Different log motifs are
presented in Fig.5 with all the details.
Different profiles along dip and along strike are selected
for stratigraphic modelling. Onle one representative
section is presented here. In the model Early Cretaceous
and Late cretaceous to Recent have been grouped into
two first order sequences. Late Cretaceous and
Paleocene are interpreted as regressive systems
tracts(RST) whereas Mid-Eocene and Oligocene as TST
and HST respectively. Late Cretaceous, Paleocene,
Mid-Eocene and Oligocene are considered as second
Fig-5 Different log motifs used for log-correlation with
corresponding systems tract.
order sequences. Miocene is distributed into FSST and
LST-1 and considered as second order sequence
boundary. Post Miocene is interpreted with three
systems tracts like LST-2 at the base followed by TST
and HST at the top and this is considered as another
11th Biennial International Conference & Exposition
Sequence stratigraphy and sediment distribution pattern of Mahanadi and Bengal offshore
second order sequence boundary. There are altogether
five second order sequence boundaries identified with
in Mahanadi and Bengal basin. Mid Eocene and
Pliocene tops are identified as two maximum flooding
surfaces MFS-1 and MFS-2 respectively.
Fig-6. Location map with Profile-1 shown by green line connecting
wells T,Y,GG and FF.
Fig.7. Profile-1-Log correlation of sequences along dip in passive
margin basin with gas bearing objects marked as red dots.
Fig.8: Stratigraphic model based on Fig.5.c.3 showing log based
sequence straigraphic correlation of wells from Land to basin floor.
Identification of third order sequences are also
attempted and five sequences within Neogene section
are identified.
Profile-1(land-plarform-shelf-slope to basin floor)-
In Profile-I as shown in the map (fig-6) wells T on the
land, Y on the platform, GG on slope and FF in the
deeper basin are selected and GR-resistivity logs of
each well are plotted and correlated in line with
sequence stratigraphy (Fig.7). The stratigraphic model
based on this correlation is marked with all the systems
tracts, MFS and Formation boundaries in Fig.8.
Stage-IV
Secondary sequence stratigraphic model- This is
prepared after taking into consideration the electro logs
of the drilled wells and log-seismic correlation. Well-
logs of different wells are used for sequence
stratigraphic analysis. Synthetics are prepared for each
well to establish the Time-Depth relationship and the
wire line logs are plotted on seismic sections.
Thereafter, Log- seismic correlation is made to weigh
sequence stratigraphy against seismic reflection
characters. The multi-panel seismic dip lines for
primary model (Fig.3) pass through two wells-Z and
KK and log motiff calibration is carried out within
sequence stratigraphic framework. Logs of these two
wells are placed on this section and adjusted the
sequence boundaries already marked on the basis of
seismic reflection characters (Fig.9). The secondary
model thus prepared along dip has been presented in
Fig.10. The model shows detailing of second order
Fig.9: Composite seismic dip lines selected for primary model
weighed by logs of drilled wells Z & KK for log-seismic
correlation to prepare the secondary model.
11th Biennial International Conference & Exposition
Sequence stratigraphy and sediment distribution pattern of Mahanadi and Bengal offshore
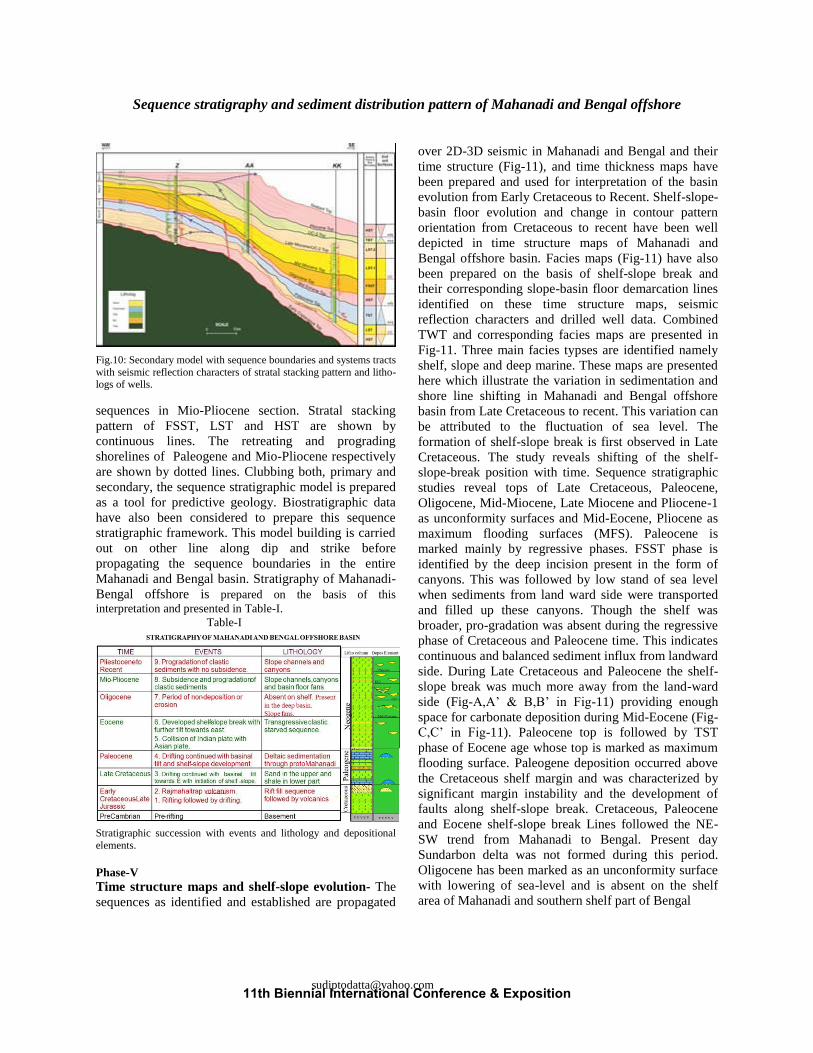
Fig.10: Secondary model with sequence boundaries and systems tracts
with seismic reflection characters of stratal stacking pattern and litho-logs of wells.
sequences in Mio-Pliocene section. Stratal stacking
pattern of FSST, LST and HST are shown by
continuous lines. The retreating and prograding
shorelines of Paleogene and Mio-Pliocene respectively
are shown by dotted lines. Clubbing both, primary and
secondary, the sequence stratigraphic model is prepared
as a tool for predictive geology. Biostratigraphic data
have also been considered to prepare this sequence
stratigraphic framework. This model building is carried
out on other line along dip and strike before
propagating the sequence boundaries in the entire
Mahanadi and Bengal basin. Stratigraphy of Mahanadi-
Bengal offshore is prepared on the basis of this
interpretation and presented in Table-I.
Table-I
Stratigraphic succession with events and lithology and depositional
elements.
Phase-V
Time structure maps and shelf-slope evolution- The
sequences as identified and established are propagated
over 2D-3D seismic in Mahanadi and Bengal and their
time structure (Fig-11), and time thickness maps have
been prepared and used for interpretation of the basin
evolution from Early Cretaceous to Recent. Shelf-slope-
basin floor evolution and change in contour pattern
orientation from Cretaceous to recent have been well
depicted in time structure maps of Mahanadi and
Bengal offshore basin. Facies maps (Fig-11) have also
been prepared on the basis of shelf-slope break and
their corresponding slope-basin floor demarcation lines
identified on these time structure maps, seismic
reflection characters and drilled well data. Combined
TWT and corresponding facies maps are presented in
Fig-11. Three main facies typses are identified namely
shelf, slope and deep marine. These maps are presented
here which illustrate the variation in sedimentation and
shore line shifting in Mahanadi and Bengal offshore
basin from Late Cretaceous to recent. This variation can
be attributed to the fluctuation of sea level. The
formation of shelf-slope break is first observed in Late
Cretaceous. The study reveals shifting of the shelf-
slope-break position with time. Sequence stratigraphic
studies reveal tops of Late Cretaceous, Paleocene,
Oligocene, Mid-Miocene, Late Miocene and Pliocene-1
as unconformity surfaces and Mid-Eocene, Pliocene as
maximum flooding surfaces (MFS). Paleocene is
marked mainly by regressive phases. FSST phase is
identified by the deep incision present in the form of
canyons. This was followed by low stand of sea level
when sediments from land ward side were transported
and filled up these canyons. Though the shelf was
broader, pro-gradation was absent during the regressive
phase of Cretaceous and Paleocene time. This indicates
continuous and balanced sediment influx from landward
side. During Late Cretaceous and Paleocene the shelf-
slope break was much more away from the land-ward
side (Fig-A,A’ & B,B’ in Fig-11) providing enough
space for carbonate deposition during Mid-Eocene (Fig-
C,C’ in Fig-11). Paleocene top is followed by TST
phase of Eocene age whose top is marked as maximum
flooding surface. Paleogene deposition occurred above
the Cretaceous shelf margin and was characterized by
significant margin instability and the development of
faults along shelf-slope break. Cretaceous, Paleocene
and Eocene shelf-slope break Lines followed the NE-
SW trend from Mahanadi to Bengal. Present day
Sundarbon delta was not formed during this period.
Oligocene has been marked as an unconformity surface
with lowering of sea-level and is absent on the shelf
area of Mahanadi and southern shelf part of Bengal
11th Biennial International Conference & Exposition
Sequence stratigraphy and sediment distribution pattern of Mahanadi and Bengal offshore
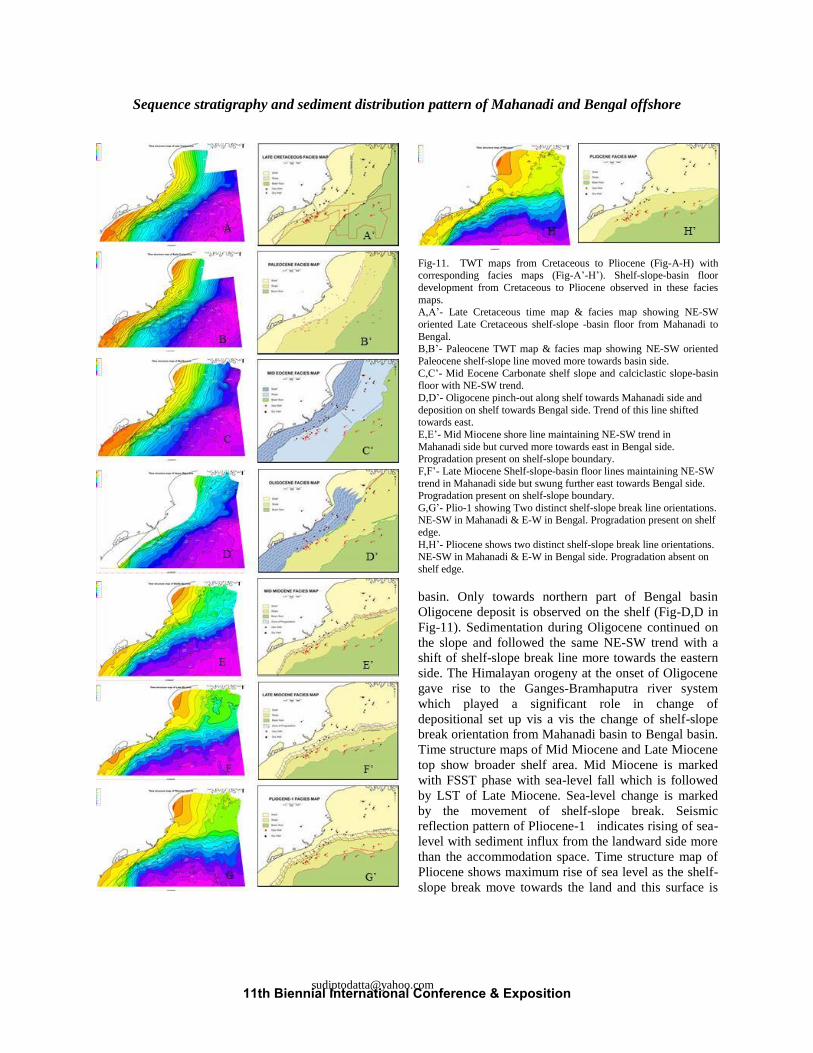
Fig-11. TWT maps from Cretaceous to Pliocene (Fig-A-H) with corresponding facies maps (Fig-A’-H’). Shelf-slope-basin floor
development from Cretaceous to Pliocene observed in these facies
maps. A,A’- Late Cretaceous time map & facies map showing NE-SW
oriented Late Cretaceous shelf-slope -basin floor from Mahanadi to
Bengal. B,B’- Paleocene TWT map & facies map showing NE-SW oriented
Paleocene shelf-slope line moved more towards basin side.
C,C’- Mid Eocene Carbonate shelf slope and calciclastic slope-basin floor with NE-SW trend.
D,D’- Oligocene pinch-out along shelf towards Mahanadi side and
deposition on shelf towards Bengal side. Trend of this line shifted towards east.
E,E’- Mid Miocene shore line maintaining NE-SW trend in
Mahanadi side but curved more towards east in Bengal side. Progradation present on shelf-slope boundary.
F,F’- Late Miocene Shelf-slope-basin floor lines maintaining NE-SW
trend in Mahanadi side but swung further east towards Bengal side. Progradation present on shelf-slope boundary.
G,G’- Plio-1 showing Two distinct shelf-slope break line orientations. NE-SW in Mahanadi & E-W in Bengal. Progradation present on shelf
edge.
H,H’- Pliocene shows two distinct shelf-slope break line orientations.
NE-SW in Mahanadi & E-W in Bengal side. Progradation absent on
shelf edge.
basin. Only towards northern part of Bengal basin
Oligocene deposit is observed on the shelf (Fig-D,D in
Fig-11). Sedimentation during Oligocene continued on
the slope and followed the same NE-SW trend with a
shift of shelf-slope break line more towards the eastern
side. The Himalayan orogeny at the onset of Oligocene
gave rise to the Ganges-Bramhaputra river system
which played a significant role in change of
depositional set up vis a vis the change of shelf-slope
break orientation from Mahanadi basin to Bengal basin.
Time structure maps of Mid Miocene and Late Miocene
top show broader shelf area. Mid Miocene is marked
with FSST phase with sea-level fall which is followed
by LST of Late Miocene. Sea-level change is marked
by the movement of shelf-slope break. Seismic
reflection pattern of Pliocene-1 indicates rising of sea-
level with sediment influx from the landward side more
than the accommodation space. Time structure map of
Pliocene shows maximum rise of sea level as the shelf-
slope break move towards the land and this surface is
11th Biennial International Conference & Exposition
Sequence stratigraphy and sediment distribution pattern of Mahanadi and Bengal offshore
considered as MFS. This is followed by another sea
level fall and the Present day shelf is the broadest
among all with numerous cuts. This receding sea level
allows the rivers from landward side to carry bed-load
down-dip and fill the channels with sediments down
dip. The huge sediment influx from Ganga-
Bramhaputra changed the earlier NE-SW trending coast
line in Bengal side to almost E-W trending coast line.
Total evolution of shelf-slope break position with
corresponding slope- basin floor positions are presented
here in the Fig-11 with individual facies maps prepared
on the basis of TWT structure maps and shelf- slope-
basin floor facies as observed in seismic sections.
Fig-12 Superimposition of shelf-slope boundaries on a map showing evolution of shore lines in Mahanadi and Bengal.
The superimposed gradual shifting of shelf from
Cretaceous till present day is presented in Fig- 12.
Phase-VI
Sediment distribution pattern in Mahanadi and Bengal
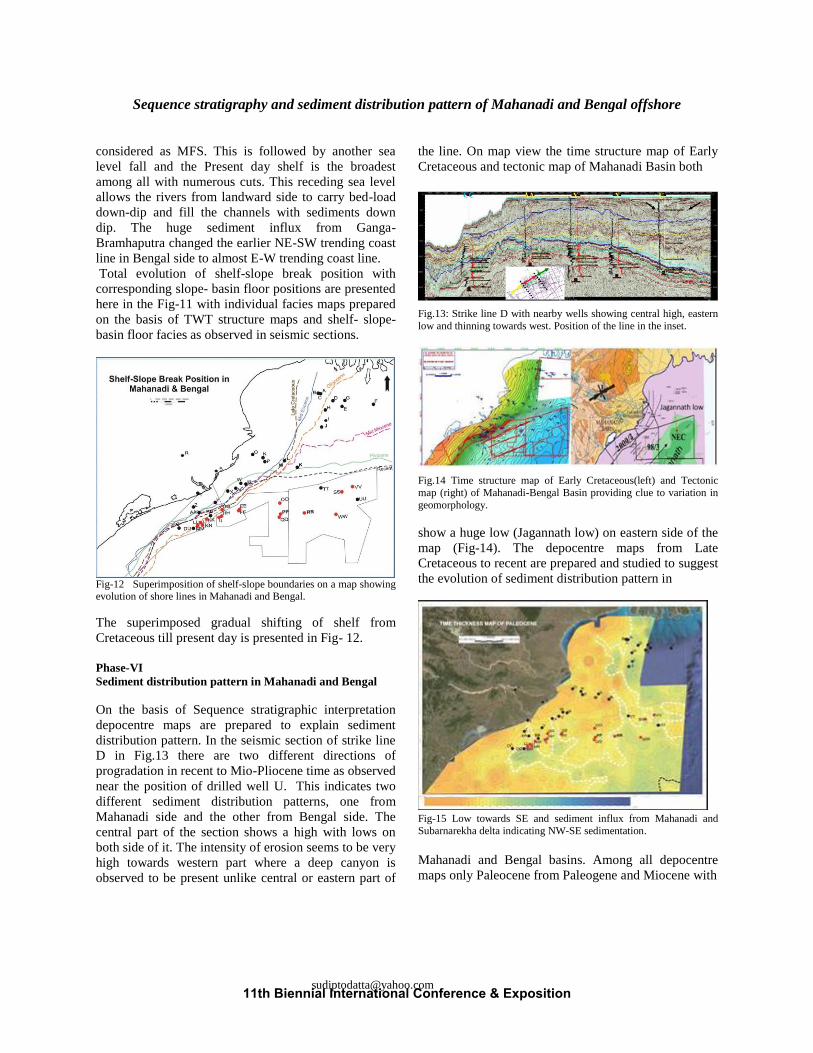
On the basis of Sequence stratigraphic interpretation
depocentre maps are prepared to explain sediment
distribution pattern. In the seismic section of strike line
D in Fig.13 there are two different directions of
progradation in recent to Mio-Pliocene time as observed
near the position of drilled well U. This indicates two
different sediment distribution patterns, one from
Mahanadi side and the other from Bengal side. The
central part of the section shows a high with lows on
both side of it. The intensity of erosion seems to be very
high towards western part where a deep canyon is
observed to be present unlike central or eastern part of
the line. On map view the time structure map of Early
Cretaceous and tectonic map of Mahanadi Basin both
Fig.13: Strike line D with nearby wells showing central high, eastern
low and thinning towards west. Position of the line in the inset.
Fig.14 Time structure map of Early Cretaceous(left) and Tectonic
map (right) of Mahanadi-Bengal Basin providing clue to variation in
geomorphology.
show a huge low (Jagannath low) on eastern side of the
map (Fig-14). The depocentre maps from Late
Cretaceous to recent are prepared and studied to suggest
the evolution of sediment distribution pattern in
Fig-15 Low towards SE and sediment influx from Mahanadi and
Subarnarekha delta indicating NW-SE sedimentation.
Mahanadi and Bengal basins. Among all depocentre
maps only Paleocene from Paleogene and Miocene with
11th Biennial International Conference & Exposition
Sequence stratigraphy and sediment distribution pattern of Mahanadi and Bengal offshore
Pliocene from Neogene are presented here (Fig-15-17)
as representative maps to show the sediment
distribution pattern. Paleocene depocentre map shows
sediment influx from Mahanadi and Subarnarekha delta
from NW giving rise to the NW-SE paleo-direction of
sedimentation. Channels or fans may be expected
within these NW-SE oriented lows. Depocentre map of
Late-Miocene suggest color filled parts as highs and the
corresponding lows reveal sediment distribution pattern
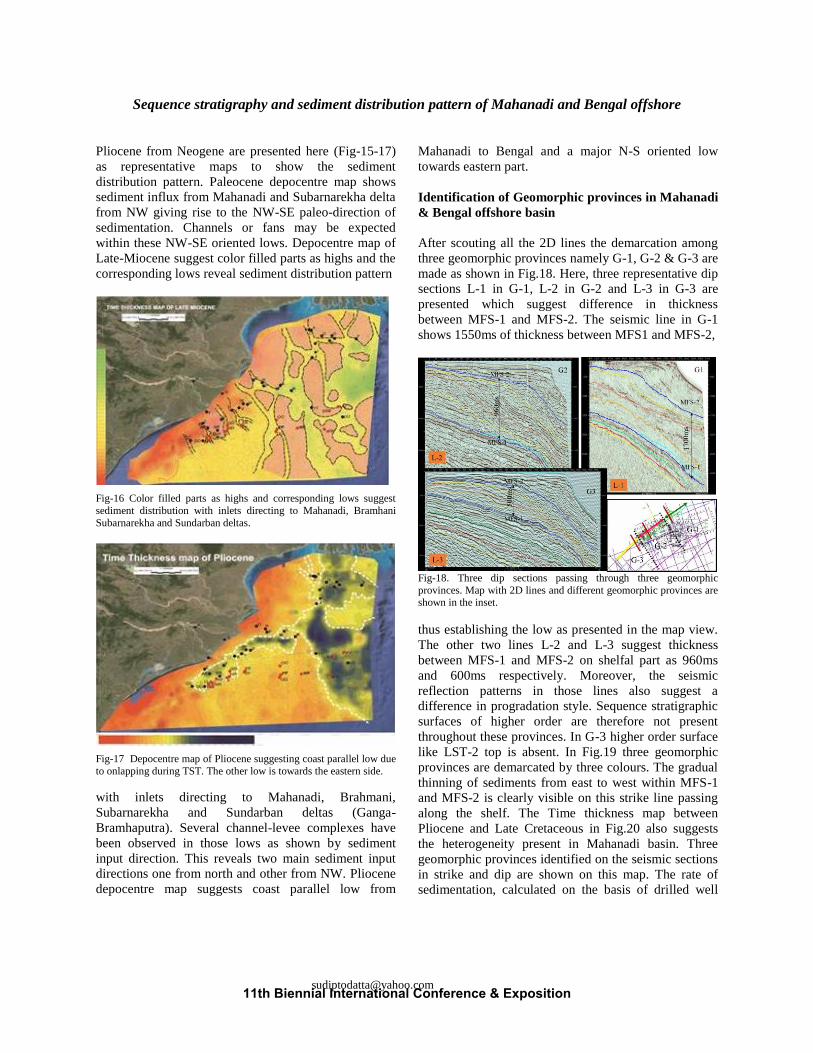
Fig-16 Color filled parts as highs and corresponding lows suggest
sediment distribution with inlets directing to Mahanadi, Bramhani
Subarnarekha and Sundarban deltas.
Fig-17 Depocentre map of Pliocene suggesting coast parallel low due
to onlapping during TST. The other low is towards the eastern side.
with inlets directing to Mahanadi, Brahmani,
Subarnarekha and Sundarban deltas (Ganga-
Bramhaputra). Several channel-levee complexes have
been observed in those lows as shown by sediment
input direction. This reveals two main sediment input
directions one from north and other from NW. Pliocene
depocentre map suggests coast parallel low from
Mahanadi to Bengal and a major N-S oriented low
towards eastern part.
Identification of Geomorphic provinces in Mahanadi
& Bengal offshore basin
After scouting all the 2D lines the demarcation among
three geomorphic provinces namely G-1, G-2 & G-3 are
made as shown in Fig.18. Here, three representative dip
sections L-1 in G-1, L-2 in G-2 and L-3 in G-3 are
presented which suggest difference in thickness
between MFS-1 and MFS-2. The seismic line in G-1
shows 1550ms of thickness between MFS1 and MFS-2,
Fig-18. Three dip sections passing through three geomorphic
provinces. Map with 2D lines and different geomorphic provinces are shown in the inset.
thus establishing the low as presented in the map view.
The other two lines L-2 and L-3 suggest thickness
between MFS-1 and MFS-2 on shelfal part as 960ms
and 600ms respectively. Moreover, the seismic
reflection patterns in those lines also suggest a
difference in progradation style. Sequence stratigraphic
surfaces of higher order are therefore not present
throughout these provinces. In G-3 higher order surface
like LST-2 top is absent. In Fig.19 three geomorphic
provinces are demarcated by three colours. The gradual
thinning of sediments from east to west within MFS-1
and MFS-2 is clearly visible on this strike line passing
along the shelf. The Time thickness map between
Pliocene and Late Cretaceous in Fig.20 also suggests
the heterogeneity present in Mahanadi basin. Three
geomorphic provinces identified on the seismic sections
in strike and dip are shown on this map. The rate of
sedimentation, calculated on the basis of drilled well
11th Biennial International Conference & Exposition
Sequence stratigraphy and sediment distribution pattern of Mahanadi and Bengal offshore
data also suggests the difference in three geomorphic
provinces. Sedimentation rate on the shelfal and deeper
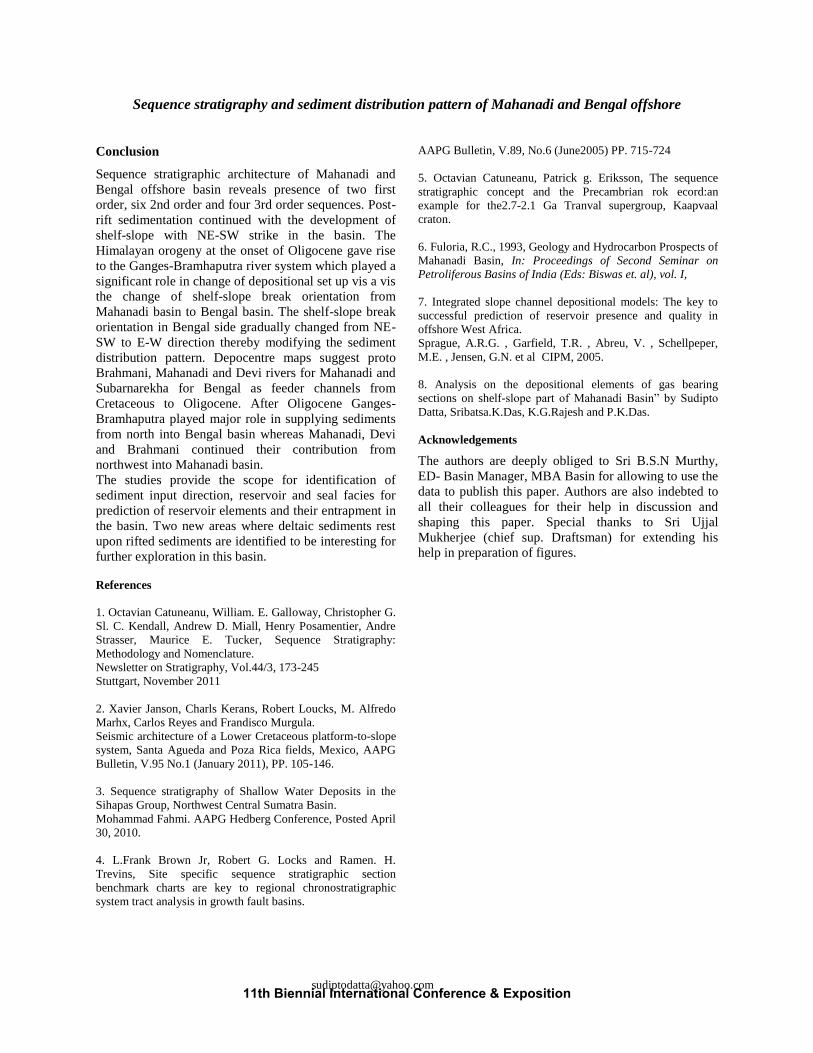
part is provided in the Fig.20. In G-1 the rate of
sedimentation on the shelf is maximum @6.3cm/1000yr
compared to 3.4cm/1000yr in G-2 and 2.6cm/1000yr in
G-3. In the deeper part of the basin rate of
sedimentation is more than double the rate in shelfal
part. The likely reason for this difference may be
attributed to these three parameters namely i) Influence
of Ganga-Bramhaputra river system from NE in G-1
and their absence in G-2 and G-3, ii) Influence of
Mahanadi and her Tributaries from NW only in G-2 and
iii) Influence of 85 degree East ridge not visible in this
map play a role only in G-3 which restricted the depth
of sedimentation. This influence is not present in G-1
and G-2.
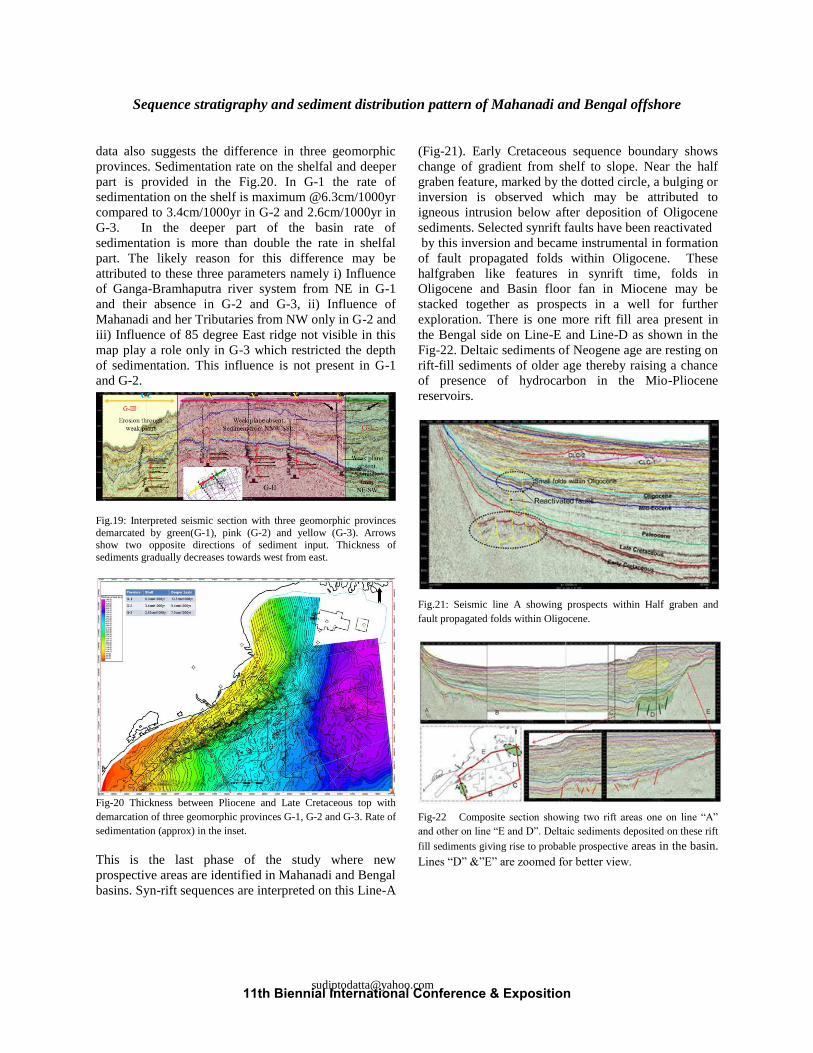
Fig.19: Interpreted seismic section with three geomorphic provinces
demarcated by green(G-1), pink (G-2) and yellow (G-3). Arrows show two opposite directions of sediment input. Thickness of
sediments gradually decreases towards west from east.
Fig-20 Thickness between Pliocene and Late Cretaceous top with
demarcation of three geomorphic provinces G-1, G-2 and G-3. Rate of
sedimentation (approx) in the inset.
This is the last phase of the study where new
prospective areas are identified in Mahanadi and Bengal
basins. Syn-rift sequences are interpreted on this Line-A
(Fig-21). Early Cretaceous sequence boundary shows
change of gradient from shelf to slope. Near the half
graben feature, marked by the dotted circle, a bulging or
inversion is observed which may be attributed to
igneous intrusion below after deposition of Oligocene
sediments. Selected synrift faults have been reactivated
by this inversion and became instrumental in formation
of fault propagated folds within Oligocene. These
halfgraben like features in synrift time, folds in
Oligocene and Basin floor fan in Miocene may be
stacked together as prospects in a well for further
exploration. There is one more rift fill area present in
the Bengal side on Line-E and Line-D as shown in the
Fig-22. Deltaic sediments of Neogene age are resting on
rift-fill sediments of older age thereby raising a chance
of presence of hydrocarbon in the Mio-Pliocene
reservoirs.
Fig.21: Seismic line A showing prospects within Half graben and
fault propagated folds within Oligocene.
Fig-22 Composite section showing two rift areas one on line “A”
and other on line “E and D”. Deltaic sediments deposited on these rift
fill sediments giving rise to probable prospective areas in the basin.
Lines “D” &”E” are zoomed for better view.
11th Biennial International Conference & Exposition
Sequence stratigraphy and sediment distribution pattern of Mahanadi and Bengal offshore
Conclusion
Sequence stratigraphic architecture of Mahanadi and
Bengal offshore basin reveals presence of two first
order, six 2nd order and four 3rd order sequences. Post-
rift sedimentation continued with the development of
shelf-slope with NE-SW strike in the basin. The
Himalayan orogeny at the onset of Oligocene gave rise
to the Ganges-Bramhaputra river system which played a
significant role in change of depositional set up vis a vis
the change of shelf-slope break orientation from
Mahanadi basin to Bengal basin. The shelf-slope break
orientation in Bengal side gradually changed from NE-
SW to E-W direction thereby modifying the sediment
distribution pattern. Depocentre maps suggest proto
Brahmani, Mahanadi and Devi rivers for Mahanadi and
Subarnarekha for Bengal as feeder channels from
Cretaceous to Oligocene. After Oligocene Ganges-
Bramhaputra played major role in supplying sediments
from north into Bengal basin whereas Mahanadi, Devi
and Brahmani continued their contribution from
northwest into Mahanadi basin.
The studies provide the scope for identification of
sediment input direction, reservoir and seal facies for
prediction of reservoir elements and their entrapment in
the basin. Two new areas where deltaic sediments rest
upon rifted sediments are identified to be interesting for
further exploration in this basin.
References
1. Octavian Catuneanu, William. E. Galloway, Christopher G.
Sl. C. Kendall, Andrew D. Miall, Henry Posamentier, Andre
Strasser, Maurice E. Tucker, Sequence Stratigraphy:
Methodology and Nomenclature.
Newsletter on Stratigraphy, Vol.44/3, 173-245
Stuttgart, November 2011
2. Xavier Janson, Charls Kerans, Robert Loucks, M. Alfredo
Marhx, Carlos Reyes and Frandisco Murgula.
Seismic architecture of a Lower Cretaceous platform-to-slope
system, Santa Agueda and Poza Rica fields, Mexico, AAPG
Bulletin, V.95 No.1 (January 2011), PP. 105-146.
3. Sequence stratigraphy of Shallow Water Deposits in the
Sihapas Group, Northwest Central Sumatra Basin.
Mohammad Fahmi. AAPG Hedberg Conference, Posted April
30, 2010.
4. L.Frank Brown Jr, Robert G. Locks and Ramen. H.
Trevins, Site specific sequence stratigraphic section
benchmark charts are key to regional chronostratigraphic
system tract analysis in growth fault basins.
AAPG Bulletin, V.89, No.6 (June2005) PP. 715-724
5. Octavian Catuneanu, Patrick g. Eriksson, The sequence
stratigraphic concept and the Precambrian rok ecord:an
example for the2.7-2.1 Ga Tranval supergroup, Kaapvaal
craton.
6. Fuloria, R.C., 1993, Geology and Hydrocarbon Prospects of
Mahanadi Basin, In: Proceedings of Second Seminar on
Petroliferous Basins of India (Eds: Biswas et. al), vol. I,
7. Integrated slope channel depositional models: The key to
successful prediction of reservoir presence and quality in
offshore West Africa.
Sprague, A.R.G. , Garfield, T.R. , Abreu, V. , Schellpeper,
M.E. , Jensen, G.N. et al CIPM, 2005.
8. Analysis on the depositional elements of gas bearing
sections on shelf-slope part of Mahanadi Basin” by Sudipto
Datta, Sribatsa.K.Das, K.G.Rajesh and P.K.Das.
Acknowledgements
The authors are deeply obliged to Sri B.S.N Murthy,
ED- Basin Manager, MBA Basin for allowing to use the
data to publish this paper. Authors are also indebted to
all their colleagues for their help in discussion and
shaping this paper. Special thanks to Sri Ujjal
Mukherjee (chief sup. Draftsman) for extending his
help in preparation of figures.
11th Biennial International Conference & Exposition


![[PPT]Introduction to Sequence Stratigraphy - Jackson … · Web viewStratigraphic Principles Types of Stratigraphy Focus on Modern Stratigraphy is Sequence-based History of Sequence](https://static.fdocuments.net/doc/165x107/5b0163197f8b9a0c028e2f8c/pptintroduction-to-sequence-stratigraphy-jackson-viewstratigraphic-principles.jpg)
