September- October 2001
22
September- October 2001 China Mobile (Hong Kong) Limited
Transcript of September- October 2001

September- October 2001
China Mobile (Hong Kong) Limited

FORWARD-LOOKING STATEMENTS
This presentation contains forward-looking statements.These forward-looking statements are subject to risks, uncertainties and assumptions, some of which are beyond our control. Actual results may
differ materially from those expressed or implied by these forward-looking statements. Because of these risks, uncertainties and assumptions, the forward-looking events and circumstances discussed in this presentation
might not occur in the way we expect, or at all. You should not place undue reliance on any forward-looking information.
I. Company Overview and Review of 2001 Interim Results

44
Overview of Our Company
CMHK is the leading mobile operator in China, the largest wireless market in the world
Our service area covers 13 of the most economically developed regions in China75% subscriber market share in our service area and 50% of all subscribers in China as of June 30, 2001
2nd largest mobile operator in the world in terms of subscribers
61.8 million subscribers as of August 2001
Significant growth (1997 - 2000)Revenue CAGR (61%)
EBITDA CAGR (66%)
55
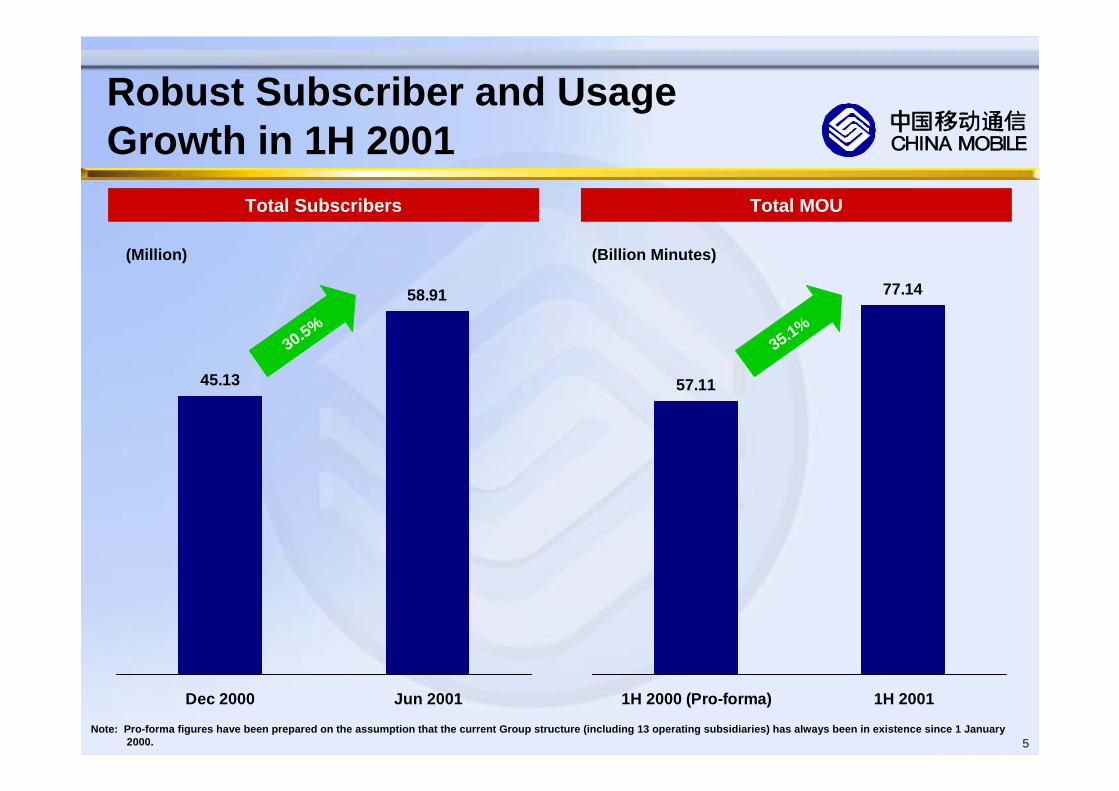
Robust Subscriber and Usage Growth in 1H 2001
Total Subscribers Total MOU
45.13
58.91
Dec 2000 Jun 2001
30.5%
57.11
77.14
1H 2000 (Pro-forma) 1H 2001
(Million) (Billion Minutes)
35.1%
Note: Pro-forma figures have been prepared on the assumption that the current Group structure (including 13 operating subsidiaries) has always been in existence since 1 January2000.

66
Strong Financial PerformanceRevenue EBITDA
Net Profit EPS
16,817
29,176
59.7%
58.2%
1H 2000 1H 2001
28,897
48,864
1H 2000 1H 2001
8,724
13,809
1H 2000 1H 2001
73%69%
58%
EBITDA Margin
(RMB Million) (RMB Million)
0.640.74
1H 2000 1H 2001
(RMB Million) (RMB)
16%

77
44,603
48,864
1H 2000 1H 2001
10%
Satisfactory Pro-Forma Growth after One-off Tariff Reduction
Revenue EBITDA
(RMB Million) (RMB Million)
25,269
29,176
1H 2000 1H 2001
15%
EBITDA Margin
56.7%
59.7%
(Pro-forma) (Pro-forma)

88
Major Achievements for the First Half of 2001
Strong fundamental business growth and financial performance
Enhanced product differentiation and customer service
Systematic implementation of Monternet Mobile Data Program and established business model of wireless data services
Successful entry into China’s domestic capital market with expanded channels of financing and wider investor base
Implementation of comprehensive training programs and management incentive scheme

II. Investor Focus and Outlook
1010
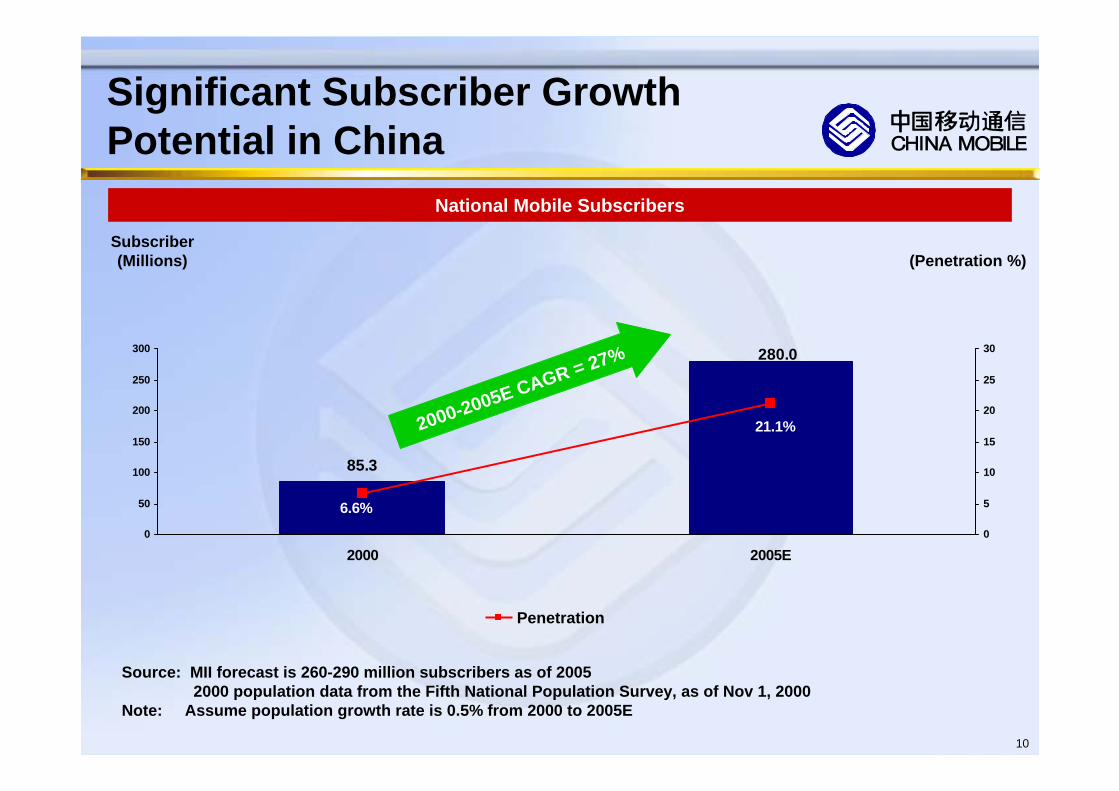
Significant Subscriber Growth Potential in China
National Mobile Subscribers
280.0
85.3
6.6%
21.1%
0
50
100
150
200
250
300
2000 2005E0
5
10
15
20
25
30
Subscriber(Millions)
Penetration
Source: MII forecast is 260-290 million subscribers as of 20052000 population data from the Fifth National Population Survey, as of Nov 1, 2000
Note: Assume population growth rate is 0.5% from 2000 to 2005E
2000-2005E CAGR = 27%
(Penetration %)

1111
16%
84%
18%
82%
Attractive Business Proposition of Prepaid
Contract Pre-paid
Revenue Total Minutes of Usage
Post-paid Call Traffic Volume Pre-paid Call Traffic Volume
Difference in Call Pattern between Contract and Prepaid Subscribers
Note: Above call pattern is the result of the survey carried out in one of the largest cities in Guangdong in April 2001.
0500
1000150020002500300035004000
00:0
0-1:
00
1:00
-2:0
0
2:00
-3:0
0
3:00
-4:0
0
4:00
-5:0
0
5:00
-6:0
0
6:00
-7:0
0
7:00
-8:0
0
8:00
-9:0
0
9:00
-10:
00
10:0
0-11
:00
11:0
0-12
:00
12:0
0-13
:00
13:0
0-14
:00
14:0
0-15
00
15:0
0-16
:00
16:0
0-17
:00
17:0
0-18
:00
18:0
0-19
:00
19:0
0-20
:00
20:0
0-21
:00
21:0
0-22
:00
22:0
0-23
:00
23:0
0-24
:00
Erl

1212
Steady Improvement of Operational Efficiency
247
200
158147122
92
ARPU AEPU
1H 2000(Pro-forma)
2H 2000(Pro-forma)
1H 2001
(RMB)
19%
17%21%
25%
Note: AEPU (Average expenses per user per month)

1313
-20%
-6%
8%
-25%
-20%
-15%
-10%
-5%
0%
5%
10%
Significant Price ElasticityEffect of One-off Tariff Reduction on MOU (1H2001)
20% - One-off tariff reduction in 4 provinces
– MOU reduction in 9 provinces without tariff reduction
– MOU increase in 4 provinces with tariff reduction
+14%Tariff
MOU

1414
Steady and Healthy Margin EBITDA Margin
59.7%
57.7%
55.9%
57.9%
50%
55%
60%
65%
1999 2000 1H 2001
Steady improvement of operational efficiency Effective control of bad debt
2.28% of revenue (2000) to 1.94% (1H 2001)
Optimization of network utilization
76% (2000) to 81% (1H 2001)Enhanced labor productivity
# of subs per employee 1,177 (EOY 2000) to 1,538 (Mid 2001)
Realization of significant synergy Actual Margin
1H 2001 notional margin without effect of decrease in leased line expense (RMB2,379) and one-time tariff reduction ( RMB3,522 - after adjustment for MOU increase due to one time tariff reduction )

1515
Solid Capital Structure
(RMB Million)
Cash and Cash Equivalent 39,906 45,135
Short Term Debt 13,100 7,337
Long Term Debt 24,369 31,674
Total Debt 37,469 39,011
Shareholders Equity 83,760 97,571
Total Book Capitalization 121,229 136,582
Net Cash Position 2,437 6,124
Total Debt/Total Book Capitalization 30.9% 28.6%
June 2001Dec 2000
1616
Our Goal: Maximization of Enterprise Value
Sustainable, long term healthy development of the Group
Steady and reasonable growth of EBITDA, net cash flow and net profit
Appropriate EBITDA margin

1717
Business Model of Monternet
Note: Above is an illustrative example
Message fees: service charges paid to service providers by users on either monthly basis or actual usage. Our
Company keeps 9%-15% of the total fees received
Service Provider downstream
communication fees: RMB 0.05 per message
Upstream users communication fees:
RMB0.10-0.15 per message
China Mobile (HK) Cell Phone Users Service Providers
Pre-deposit Account
100% 100%
85-91% 9-15%
RMB 0.10-0.15
RMB 0.05

1818
756.3
316.8
185.0120.369.856.6
0.2
60.7
6.51.6
0.1
165.9
Q1/2000 Q2/2000 Q3/2000 Q4/2000 Q1/2001 Q2/2001
Information on Demand and e-commerce SMS
Point-to-Point SMS
Promising Prospect of Wireless Data Services
Rapid Growth of Data Subscribers Tremendous Increase in SMS Usage
17.0
15.0
12.22000 Q4
2001 Q1
2001 Q2
Mobile Data Users (Million)
CQGR = 18%
(Million Messages)
CQGR = 74.7%
Note: CQGR = Compound Quarterly Growth Rate

1919
Why not CDMA?
CDMA - relatively more efficient utilization of spectrum resources, better network coverage and faster transmission speed; but call quality may deteriorate sharply in high call traffic areas
Roaming capability is far less robust than with GSM
No “always on” capability
High network build-out costs
Operating both GSM & CDMA networks may result in “Cannibalization”
Customer concerns: service quality and price, rather than technology standard

2020
Promoting Excellence in Corporate Governance
Implemented broad-based performance appraisal schemes for subsidiaries and staff
Comprehensive financial performance-based evaluationEvaluation results determine adjustment in management personnel
Major performance evaluation benchmarks include:EBITDA growth, Net profit growth, Revenue growth, EVA
Enhanced market-oriented, performance-based incentive scheme
Decrease the relative proportion of fixed salaryIncrease the relative proportion of performance-linked bonus and other compensationWider participation by staff in share option scheme

2121
Key Business Strategy Continue to take advantage of market opportunities to achieve further subscriber growth
Focus on service differentiation and stimulate usage to stabilize ARPU
Strengthen sales and distribution network with focused marketingstrategy
Improve operational efficiency to maintain healthy and sustainable margin
Capture opportunities in the data market and move up the value chain
Optimize capital structure and effective use of internal resources to seek growth opportunities
Promote excellence in corporate governance
Enhance investors communication program

2222
Further AcquisitionOpportunities
Core MobileBusiness
New Opportunities in the Broader Telecom
Market
Enhance Enterprise Value
A World-Class Global Wireless Multimedia Services Provider