SEPTEMBER 2018 GLOBAL DIRECTOR SURVEY REPORTgccbdi.org/Media/Survey Publications/IOD 011 GNDI Survey...
46
GLOBAL DIRECTOR SURVEY REPORT SEPTEMBER 2018 GLOBAL NETWORK OF DIRECTOR INSTITUTES
Transcript of SEPTEMBER 2018 GLOBAL DIRECTOR SURVEY REPORTgccbdi.org/Media/Survey Publications/IOD 011 GNDI Survey...

GLOBAL DIRECTOR
SURVEY REPORT
SEPTEMBER 2018
GLOBAL NETWORK OF DIRECTOR INSTITUTES
GNDI SURVEY PARTICIPANTS

CONTENTS
Foreword – from GNDI Chair 1
About this report 2
Summary of key findings 4
Section One: Global social and economic issues 6
Section Two: Business confidence 8
Section Three: External and internal areas of focus 93.1 Stakeholder trust and engagement 9
3.2 Engagement with employees 11
3.3 Shareholder engagement 12
3.4 Succession planning 14
3.5 Board evaluation 16
3.6 Board member development 18
3.7 Board recruitment and diversity 19
Section Four: Environmental, social and governance issues 204.1 Environmental, economic, and social issues and risks 20
4.2 Reporting frameworks 22
4.3 Disclosure and remuneration 23
Section Five: Technology and information governance 245.1 Cybersecurity 24
5.2 Technological disruptions 25
5.3 Data analytics in board decision making 26
5.4 Big Data in board decision making 27
5.5 Data privacy 28
Appendix 1: Detailed survey results 29Survey questions 29
Demographic questions 36
Appendix 2: About the GNDI 38
Appendix 3: References 39GNDI Perspectives Papers 39
Other reports 39

GLOBAL NETWORK OF DIRECTOR INSTITUTES 130,000 MEMBERS ACROSS THE GLOBE
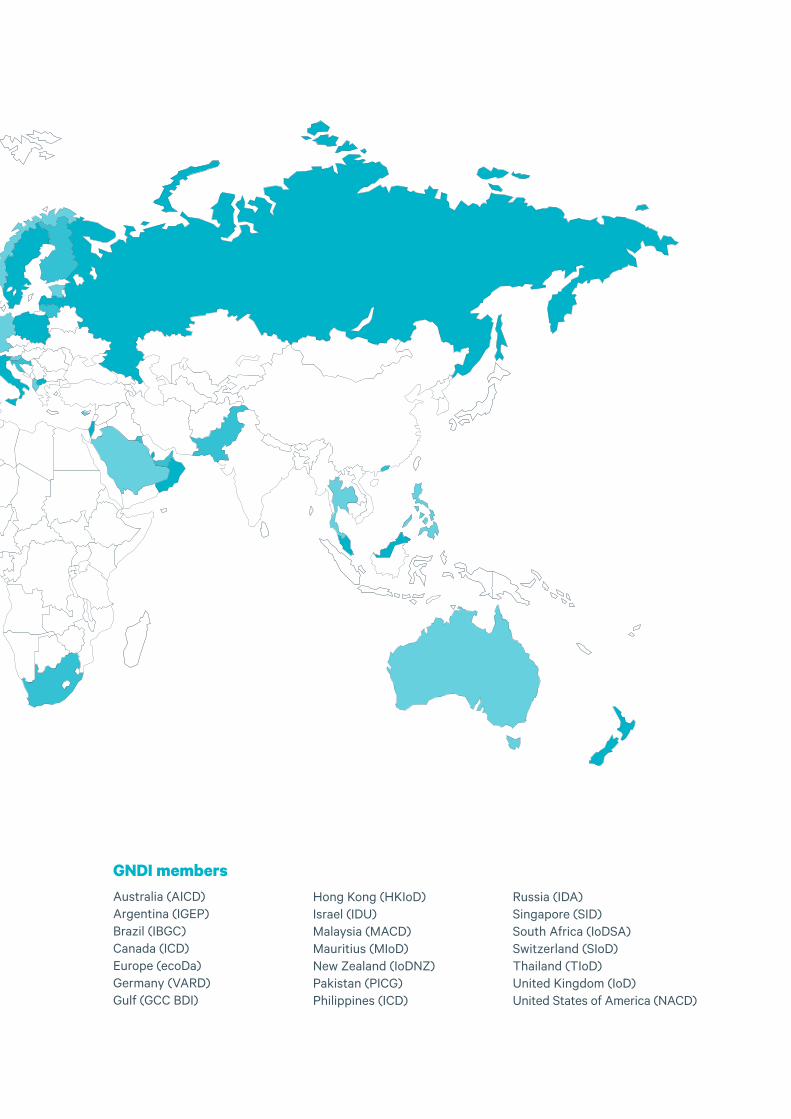
GNDI membersAustralia (AICD) Argentina (IGEP) Brazil (IBGC)Canada (ICD)Europe (ecoDa)Germany (VARD)Gulf (GCC BDI)
Hong Kong (HKIoD)Israel (IDU)Malaysia (MACD)Mauritius (MIoD) New Zealand (IoDNZ) Pakistan (PICG) Philippines (ICD)
Russia (IDA) Singapore (SID) South Africa (IoDSA) Switzerland (SIoD) Thailand (TIoD) United Kingdom (IoD) United States of America (NACD)


1
FOREWORD – FROM GNDI CHAIRI’m enormously proud to present our first Global Director Survey representing the views of directors from 17 of our Global Network of Director Institutes (GNDI). This has been a great collaborative project allowing us to explore and understand the global governance landscape and the range of challenges and opportunities facing directors now and for the future. It is if you like a snapshot in time for global governance.
The GNDI was established in 2012 and is an association of sovereign state director organisations who are recognised for their pre-eminence in board and director development globally. Together we represent 130,000 individual directors and governance professionals around the world and our goal is to use their collective wisdom and views to improve board professionalism through research, education, dialogue and advocacy.
As agents of good governance and the decision-makers that drive investment and growth, directors have a critical role in society. The governance landscape is increasingly complex and our survey provides insights for directors as they work with a broad range of organisations around the world.
As the global voice for directors it is essential that we build knowledge and understanding of what our directors see as opportunities and what keeps them awake at night. We believe that these insights are essential in helping our organisations and members remain current and relevant in a rapidly changing governance landscape.
This report provides interesting perspectives and ample food for thought. No doubt the results will provide stimulus for debate, discussion and innovative thinking as we continue our collaboration and quest to continually improve governance best practice. We believe this first global survey will provide you with rich information and also serve as a useful benchmark.
I would like to extend my appreciation to all the participating organisations and their members for sharing their perspectives and helping to make this report possible. I would also like to acknowledge the work of the Institute of Directors in New Zealand for leading this inaugural survey, and for analysing and presenting the findings that capture the current climate for global governance.
Angela CherringtonChair, Global Network of Director Institutes

2
ABOUT THIS REPORTThe inaugural GNDI Global Director Survey is designed to take the pulse of the international governance community. It provides high-level views sourced from a broad range of entities on economic, business and governance issues.
From 14 May to 30 June 2018, the GNDI conducted an online survey. The Institute of Directors in New Zealand (IoDNZ) designed and carried out the survey for the GNDI, and analysed findings and authored this report. A total of 2,159 respondents from 17 GNDI member organisations completed survey questions on regional social and economic issues, business confidence, general governance, environmental and social issues and risks, and technology and information governance. Demographic information provided by respondents included the type of organisation and headcount, number of governance roles, tenure, gender, and age. Respondents were sub-categorised according to geographical region, type of organisation, and headcount for question analysis.
Global regions include:
• Africa-Middle East, including GCC BDI, IDU, MIoD and IoDSA (8% of respondents)
• Americas, including IGEP, IBGC, ICD and NACD (37%)
• Asia-Pacific, including AICD, HKIoD, IoDNZ, PICG, ICD, SID, and TIoD (47%), and
• Europe, including SIoD and IDA (8%).
Thirty six per cent of respondents held their primary governance role with a privately owned company, 23% with a publicly listed company, 22% with a Not-for-profit (NFPs), including NGOs and charities, and 11% with a government or public sector organisation. Thirty nine per cent of all respondents had fewer than 100 employees working for their organisation, 35% had 100 – 999 employees, 20% had 1,000 – 9,999 employees, and 7% had more than 10,000 employees.
A detailed break-down of the survey responses, including percentages, is provided in Appendix 1. In the report, percentages have been rounded to whole numbers and may not add to 100%. Percentages may add up to more than 100% where respondents could select more than one answer. Data provided by respondents is reported in the aggregate results. The average time to complete the survey was 10m:16s.
DEMOGRAPHICS SNAPSHOTS
30% Female
69.6% Male
0.4% Gender diverse
Gender

3
Number of governance roles
0% 10% 20% 30% 40%
One 23%
Two 29%
Three 24%
Four 12%
Five or more 11%
Tenure on primary board
30% 40%0% 10% 20%
Two years or less 27%
Three to five years 33%
Six to ten years 21%
Ten years or more 19%
Age
0% 10% 20% 30% 40%
Under 35 years old 2%
75 years or older 3%
35 to 44 years old 9%
45 to 54 years old 28%
55 to 64 years old 38%
65 to 74 years old 21%
Subsidiary of a publicly listed company
Government organisation / public sector
Not-for-profit organisation / NGO / Charity
Publicly listed company
Privately owned company
Type of governance roles
0% 10% 20% 30% 40%
11%
4%
22%
23%
36%

4
SUMMARY OF KEY FINDINGSThis inaugural global director survey shows that directors around the world share common concerns and face similar challenges. It provides insights about business confidence; social, economic and environmental issues and risks; technology and data governance; core governance practices; and how boards can improve effectiveness and director capability.
Big Data scores as the top disruptor
Big Data is high on the global agenda with 63% of directors viewing it as the top technological disruption to their organisation. The challenges presented by the complexity, volume and variety of Big Data, also present opportunities for more effective use of Big Data to boost performance and mitigate risks.
While it is on their radar, many boards are not taking advantage of Big Data to improve organisational effectiveness, create value, and make better decisions. Only 28% agreed that they used Big Data for decision-making.
Big Data is an evolving term that describes any voluminous amount of data that has the potential to be mined for information, including structured data, such as spreadsheets and databases, and unstructured data, such as social media posts, audio, video, emails, PDFs, digital images, and GPS data. There is an opportunity for boards who are not already doing so to evaluate their data governance processes, and identify usable business insights, trends, and correlations, leveraging Big Data for better decisions and strategic objectives. Innovative tools with the ability to process and analyse Big Data are now more readily available.
Data privacy: still room for improvement
With increasing use of and reliance on data comes concerns about data privacy and protection. There are immense potential benefits from data and data analytics, alongside equally significant privacy risks. Sixty one per cent of directors have good or excellent understanding of their organisation’s data privacy practices, while 37% say they have limited or no understanding.
Boards have a key leadership and oversight role in data governance. Understanding and addressing data privacy issues as they arise
from evolving business models and technological advances is key to the board asking management the right questions and holding management to account. This allows organisations to derive value from data while also respecting their stakeholders’ privacy concerns.
Follow through on board evaluations critical to continuous improvement
An effective board assesses its own performance regularly and thoroughly. Regular board and director evaluations are about continuous quality improvement, ensuring the board works effectively and directors contribute positively. Forty two per cent of boards undertake formal board evaluations, with 46% informally appraising their performance. Despite many boards carrying out either / both formal and informal board evaluations, 20% do not.
Of the 80% of boards conducting formal or informal performance evaluations, 71% evaluate the full board, 55% evaluate individual directors, and 46% evaluate board committees. Forty per cent of boards very often or frequently take actions to address issues identified in board evaluations, while 26% never or occasionally attend to any concerns.
The board’s performance needs to be regularly assessed and appropriate actions taken to address any issues identified to hold the board to account and focus on continuous improvement. Improving board and director performance adds value and is in the best interests of organisations and their shareholders and stakeholders.
Succession planning is key to success
Board evaluations help create the right mix of directors now and for the future. Organisations are operating in a complex and rapidly changing world and they will require different skills and experience from their directors over time.

5
Regularly considering succession planning helps build a balanced mix of skills, experience and diversity to meet the needs of the organisation and underpins board quality, continuity and future success. Twenty two per cent of boards are proactively discussing full board succession planning and 35% are discussing it as part of strategic planning. However, 29% discuss succession planning only when there is a vacancy, and 23% are not discussing it at all, which is concerning.
A board work plan can assist in ensuring that sufficient attention is given to various board functions, such as succession planning and director development, which might otherwise be deferred or even overlooked because of other pressures.
Board recruitment and the importance of diversity
Fifty nine per cent of directors globally viewed skills as very important in their latest board recruitment. There was however some regional variation. More directors from the Americas and Asia-Pacific regions viewed skills as “very important” than directors based in the Africa-Middle East and European regions. Background and experience was rated as the most important attribute (62%), and half the respondents regarded gender as an important factor in their latest board appointment.
Board diversity helps to ensure that boards are composed of directors who have a variety of complementary skills and attributes, and can offer a range of perspectives, insights, and views in relation to the issues and opportunities that may affect organisations. Fostering a broader range of perspectives, insights, and views will help drive robust discussion, cooperation, and mutual respect.
Gender diversity in boards and executive teams are voluntarily disclosed by 38% of directors. Voluntary disclosure is higher in NFPs (49%) than in private companies (35%). Seventeen per cent are required to disclose their organisation’s board and executive gender breakdown, while 45% did not disclose this information. In recent years, many GNDI member organisations have seen developments in corporate governance codes
and requirements in their countries requiring greater disclosure of board composition, including gender balance. Stakeholder expectations on transparency in reporting have also increased.
Stakeholder engagement
Directors have a key role in maintaining and growing trust and confidence within their own organisation and within society. It is important that boards consider how they build and preserve stakeholder trust, and how they engage with shareholders and stakeholders, including employees.
With wider stakeholder engagement, 64% of boards had direct engagement with stakeholders through industry associations or partnerships, 51% through commercial relationships, and 50% through customer feedback tools. Thirty nine per cent of directors discuss stakeholder trust very often or frequently, with those in government / public sector roles more likely to discuss stakeholder trust frequently (19%) compared to private and listed company directors (11%).
Social and environmental issues
Ethical behaviour, health and safety, and employee engagement were the three most relevant environmental and social issues and risks for directors. Employee relations and engagement was the third most relevant (57%) issue globally. Eighty nine per cent of boards engage with employees through the CEO or Managing Director. The largest organisations have the highest engagement at site visits (65%) and on specific projects (45%). They also have the lowest employee representation on the board (8%).
Many environmental issues and risks were rated not at all or a little relevant for organisations, including resource scarcity and depletion (56%), climate change (57%), carbon-related issues (67%), and depletion of fossil fuels (70%). These wider environmental concerns can impact the sustainability of organisations in the long-term, and are becoming increasingly important as the Paris Accord and United Nations Sustainable Development Goals (SDGs) gain more attention.
6
SECTION ONE: GLOBAL SOCIAL AND ECONOMIC ISSUESPoverty and income inequality was the top concern for directors around the world, closely followed by taxation and government spending, and the cost of healthcare.
Key insights
• Poverty and income inequality was the top social and economic issue globally with 45% of directors considering it one of the top three issues facing their country. It was the top concern in Africa-Middle East (69%) and Asia-Pacific (56%), and the third highest issue in the Americas (33%). The distribution of income and wealth is increasingly unequal and poverty is a growing concern.
“No poverty” is number one of the SDGs. While there has been progress in reducing global poverty and inequality between countries with the number of people living in extreme poverty dropping by more than half between 1990 and 2015, income inequality within countries has increased by nearly 60%, and almost one third of global poverty is attributable to this1.
Taxation and government spending is the second highest social and economic issue for global directors (41%), and the highest for the Americas (66%). National debt in developing economies is around 104% of GDP with interest rates taking up a growing proportion of government spending and less available funds to invest in infrastructure and social services, such as education, health and housing2. Fiscal issues, such as government spending and tax-based plans, are on the radar for many jurisdictions. Directors have a core role to monitor developments in their operating environments, and certainty and clarity are important for business sustainability and success.
Thirty eight per cent of respondents are concerned about the cost of healthcare, with this being the top issue in Europe (71%), the second highest issue in the Americas (44%), and the third highest social and economic issue globally. Mounting healthcare costs are trending in the developed world as aging populations need more healthcare and the cost of delivering complex healthcare treatments becomes more expensive. In most developed countries, spending on healthcare is rising faster than incomes, and this raises questions about how countries will pay for their future healthcare needs3.
Regions
• Directors in Africa-Middle East are also concerned about unemployment and labour issues (66%) and corruption (60%).
• Housing (54%) and infrastructure (44%) are the second and third highest issues in the Asia-Pacific region.
• European directors identified regulations (57%) and immigration (32%) as being in their top three social and economic issues after the cost of healthcare.
1 www.worldbank.org/en/topic/poverty, July 20182 Finance & Development, March 2018, Vol. 55, No. 1, International Monetary Fund3 www.oecd.org/health/healthdata, July 2018

7
Which are the top three social and economic problems facing your country of residence?
Regulations
20%12%
17%57%
19%
Infrastructure
34%10%
33%
16%44%
Housing
34%24%
16%54%
12%
Taxation and government
spending
41%23%
31%25%
66%
Poverty / income inequality
45%69%
33%56%
12%
Cost of healthcare
10% 20% 30% 40% 50% 60% 70% 80%0%
Global
Africa-Middle East
Americas
Asia-Pacific
Europe
Unemployment and labour issues
22%66%
20%16%
15%
Cost of education
10%8%
12%9%10%
Corruption
19%60%
20%11%
10%
38%13%
32%71%
44%
Immigration
13%1%
11%12%
32%
Political instability
12%
14%10%
5%
18%

8
5% Not at all confident
14% A little confident
36% Moderately confident
34% Mostly confident
11% Very confident
SECTION TWO:BUSINESS CONFIDENCE
The majority (81%) of global directors are at least moderately confident about growth in their organisations in 2019, with 45% of them being mostly or very confident.
How confident are you about the prospects for growth in your organisation for next year (2019) compared to this year (2018)?
Key insights
• Forty five per cent of global directors are mostly or very confident about the prospects for growth in their organisation in the upcoming year. There were notable contrasts with this figure between the types and sizes of organisations:
• Private and listed companies were more confident about organisational growth than NFPs and government organisations with 52% (private companies) and 53% (publicly listed companies) being mostly or very confident compared to 43% (NFP and government / public sector).
• Larger organisations were more confident than smaller organisations with 51 – 55% of organisations with 1,000 or more employees reporting that they were mostly or very confident regarding business growth, compared to 47 – 48% of organisations with under 1,000 employees.
Regions
• Directors in Europe were more confident about their organisation – 59% were mostly or very confident, and only 2% were not at all confident.
• Business confidence was lower in Africa-Middle East with 44% being mostly or very confident and 9% being not at all confident.
• While just 4% of directors in the Americas said they were not at all confident, 53% were only a little or moderately confident.
• The Asia-Pacific region was close to the median for all confidence levels.

9
SECTION THREE:EXTERNAL AND INTERNAL AREAS OF FOCUS
3.1 STAKEHOLDER TRUST AND ENGAGEMENT
6% Never
26% Occasionally
30% Fairly often
27% Very often
12% Frequently
How frequently does your board discuss stakeholder trust in your organisation?
Stakeholder trust and confidence, and social license to operate are attracting increasing attention globally. According to the Edelman Trust Barometer (2018), “trust is a predictor of whether stakeholders will find you credible in the future, will embrace new innovations you introduce and will enthusiastically support or defend you. For these reasons, trust is a valuable asset for all institutions, and ongoing trust-building activities should be one of the most important strategic priorities for every organisation.”
Key insights
• Thirty nine per cent of respondents discuss stakeholder trust very often or frequently.
• Directors in government / public sector roles had the highest rates with 19% actively discussing stakeholder trust frequently. Eleven per cent of private and listed company directors indicated the same, with 7% of private directors never discussing it compared to 5% across other sectors.
Regions
• Directors in the Americas had more stakeholder conversations (45% very often or frequently) compared to 34% in the Africa-Middle East region, and two-fifths of Asia-Pacific and Europe directors.
Directors have a key role in maintaining and growing trust and confidence in business and its role in society. It is important that boards consider how they build and preserve stakeholder trust.
10
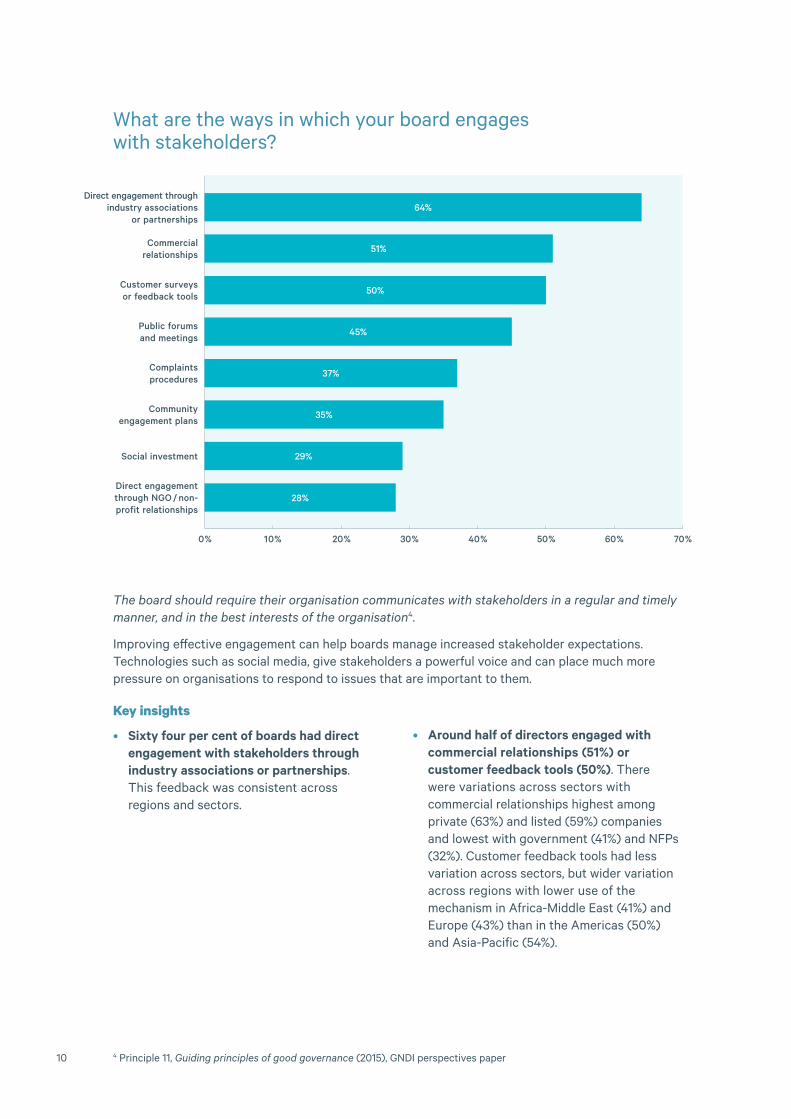
What are the ways in which your board engages with stakeholders?
The board should require their organisation communicates with stakeholders in a regular and timely manner, and in the best interests of the organisation4.
Improving effective engagement can help boards manage increased stakeholder expectations. Technologies such as social media, give stakeholders a powerful voice and can place much more pressure on organisations to respond to issues that are important to them.
Direct engagement through NGO / non-profit relationships
28%
Complaints procedures
37%
Customer surveys or feedback tools
50%
Commercial relationships
51%
Direct engagement through industry associations
or partnerships
10% 20% 30% 40% 50% 60% 70%0%
Public forums and meetings
45%
Social investment 29%
Community engagement plans
35%
64%
4 Principle 11, Guiding principles of good governance (2015), GNDI perspectives paper
Key insights
• Sixty four per cent of boards had direct engagement with stakeholders through industry associations or partnerships. This feedback was consistent across regions and sectors.
• Around half of directors engaged with commercial relationships (51%) or customer feedback tools (50%). There were variations across sectors with commercial relationships highest among private (63%) and listed (59%) companies and lowest with government (41%) and NFPs (32%). Customer feedback tools had less variation across sectors, but wider variation across regions with lower use of the mechanism in Africa-Middle East (41%) and Europe (43%) than in the Americas (50%) and Asia-Pacific (54%).

11
3.2 ENGAGEMENT WITH EMPLOYEESHow does your board engage with employees?
Engagement with employees is an important part of setting the cultural and ethical tone for the organisation. The board’s role in organisational culture is to codify its expectations of acceptable business practices for directors, senior executives and employees, and ensure that strategies and policies are developed to embed ethical behaviour in the organisation5.
Key insights
• It is not surprising to see that the majority of boards (89%) engage with employees through the CEO or Managing Director (MD), and this figure was consistent across the regions. Core functions of the CEO / MD role are leading, motivating and overseeing employees, and understanding the talent needs of the organisation. Boards holding management to account on organisational culture and talent strategy is crucial to long-term sustainability.
• Site visit engagement varies considerably across organisation size with higher levels of visits for larger organisations, ranging from 43% (under 100 employees), 54% (100 – 999), to 65% (1,000 – 9,999 and 10,000+).
• Employee engagement through conferences, work events and social events also varies. Directors of larger organisations with 10,000+ employees (53%) and 1,000 – 9,999 employees (55%) report slightly higher engagement than those with fewer than 100 employees (50%).
• The largest organisations have the highest engagement at site visits (65%) and on specific projects (45%). They also have the lowest employee representation on the board (8%).
• Organisations with 100 – 9,999 employees have the highest employee representation on board committees (17%) and at strategic planning meetings (60%).
5 Principle 2, Guiding principles of good governance (2015), GNDI perspectives paper
On specific projects 39%
At conferences and work events, including
social events49%
At site visits 50%
At strategic planning meetings
51%
Through the CEO / Managing Director
20% 40% 60% 80% 100%0%
89%
By employee representation on board
10%
By employee representation on board
committees15%

12
Directors / board attend meetings with a range of major shareholders
52%
The chair discusses governance and strategy with major shareholders
56%
The organisation sends regular communications (electronic
or print) to shareholders59%
3.3 SHAREHOLDER ENGAGEMENT
10% Not actively engaged
36% Occasionally engaged
55% Actively engaged
What are the ways in which your board engages with shareholders?
10% 20% 30% 40% 50% 60% 70%0%
The organisation conducts investor
roadshows44%
How engaged is your board with shareholders?

13
Regular dialogue between significant shareholders and the board should be encouraged, not only around the annual general meeting, but also throughout the course of the year6.
Boards play an important role in bridging the actions of the company to the interests of shareholders. The board needs to engage in shareholder communications, and can do so in a number of different ways. Boards should be encouraged to be innovative in how they engage with investors, even though their primary responsibility remains to oversee the communications handled by management on behalf of the company.
Keeping shareholders informed and engaged in this rapidly evolving digital climate can be a challenge organisations face. It is important that boards remain open and responsive to requests for face-to-face meetings with shareholders7. Virtual-only AGMs continue to receive objections from investors, and many organisations use hybrid meetings and technology to make meetings more effective and inclusive. It is important to keep up with technological developments and opportunities to engage more broadly with shareholders in new ways.
Key insights
• Fifty five per cent of directors surveyed report their boards are actively engaged with shareholders. There is noticeable differentiation among sectors with stronger responses reported in private companies (69%), government (54%), and NFP (50%) than for listed companies (43%).
• Fifty nine per cent of organisations send regular communications to shareholders and 44% conduct investor roadshows. For listed companies, these figures are 63% and 72% respectively. This was the most common method of engagement in the Americas (65%) and Asia-Pacific (62%).
• In addition, governance and strategy is discussed with major shareholders by 56% of directors (59% listed companies). This was the highest engagement strategy with Europe (70%).
• Fifty two per cent of directors (44% publicly listed companies) attend face-to-face meetings with major shareholders. This was the most common method of shareholder engagement in Africa-Middle East (61%) compared to 40% in the Americas.
6 Board/shareholder communications (2013), GNDI perspectives paper7 Board/shareholder communications (2013), GNDI perspectives paper
Shareholders want direct engagement with boards, including on the strategic decisions boards make. Effective communication of strategy supports shareholders to make more informed decisions about capital allocation and risk. There is an opportunity for increased engagement with shareholders across all regions.

14
3.4 SUCCESSION PLANNINGHow has your board addressed succession planning for the following roles within the past two years?
Executive director
28%
28%
33%
17%
Chair
29%
25%
33%
20%
25%
30%
35%
40%
45%
20%
15%
10%
5%
0%Full board
23%
29%
35%
22%
Non-executive director
24%
32%
32%
20%
Chief Executive Officer
19% 21
%
40%
28%
There has been no or minimal discussion on board succession planning
When there is a vacancy
Discussions as part of strategic planning
Proactively with a formal planning process and regular review

15
Board composition is a major consideration for the effectiveness and performance of the board, and there is an opportunity for directors to be more proactive and not be limited to only addressing individual director vacancies as they arise.
The skills and behavioural qualities the board determines it needs should be a primary input into its performance management and succession planning process, including the recruitment of new and / or replacement directors8.
Regular, and ongoing, succession planning is important to ensure the current and future needs of the organisation and board are met.
8 Renewing the board (2015), GNDI perspectives paper
Key insights
• Regularly considering succession planning ensures a balanced mix of skills, experience and diversity to meet the needs of the organisation and underpin board quality, continuity and future success. Twenty two per cent of boards are proactively discussing full board succession planning and 35% are discussing it as part of strategic planning. However, 29% discuss succession planning only when there is a vacancy, and of concern, 23% are not discussing it at all.
• CEO succession planning is a critical component of risk management and is essential to organisational performance and sustainability, and boards need to be actively involved. Forty per cent discussed CEO succession planning as part of strategic planning, and 28% have a formal planning and review process.
• The chair’s role is a critical leadership role and 33% of boards include chair succession planning in strategic discussions, and 20% discuss formally. Twenty nine per cent of directors have had minimal or no discussion on chair succession planning.
• Around one third of directors consider non-executive and executive directors strategically, with 17 – 20% having formal succession planning reviews, but of concern again 24 – 28% have no or minimal discussion on succession planning for these roles, and around 30% only discuss it when there is a vacancy.
• Directors in the Americas are more proactive on succession planning, rating the highest across all roles for discussions as part of strategic planning or as part of proactive and formal discussions.

16
Individual 55%
Board committees 46%
Informal discussions 46%
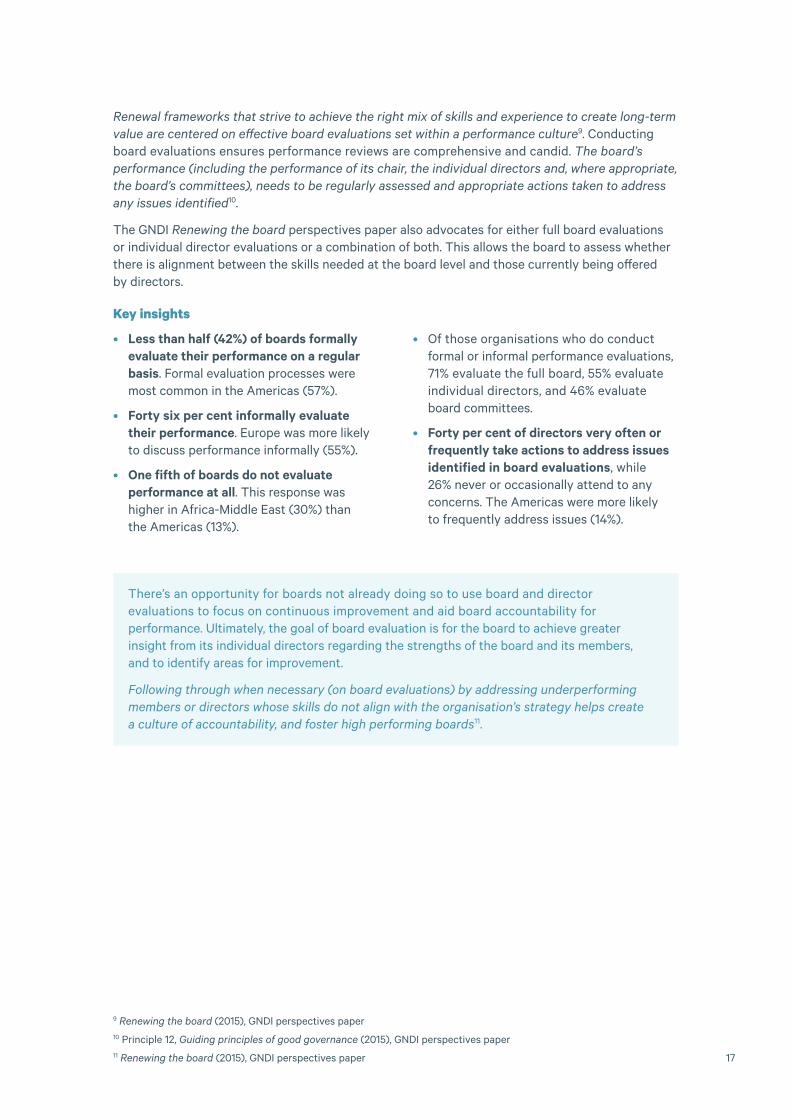
3.5 BOARD EVALUATION How does your board engage in evaluating board performance?
10% 20% 30% 40% 50%0%
Formal discussions and processes
42%
We do not discuss director or board
performance20%
What evaluations does your board perform?
Full board
10% 20% 30% 40% 50% 60% 70% 80%0%
71%
Where issues are identified in evaluations, how frequently are actions taken to address them?
2% Never
24% Occasionally
34% Fairly often
29% Very often
11% Frequently
17
9 Renewing the board (2015), GNDI perspectives paper10 Principle 12, Guiding principles of good governance (2015), GNDI perspectives paper11 Renewing the board (2015), GNDI perspectives paper
Renewal frameworks that strive to achieve the right mix of skills and experience to create long-term value are centered on effective board evaluations set within a performance culture9. Conducting board evaluations ensures performance reviews are comprehensive and candid. The board’s performance (including the performance of its chair, the individual directors and, where appropriate, the board’s committees), needs to be regularly assessed and appropriate actions taken to address any issues identified10.
The GNDI Renewing the board perspectives paper also advocates for either full board evaluations or individual director evaluations or a combination of both. This allows the board to assess whether there is alignment between the skills needed at the board level and those currently being offered by directors.
Key insights
• Less than half (42%) of boards formally evaluate their performance on a regular basis. Formal evaluation processes were most common in the Americas (57%).
• Forty six per cent informally evaluate their performance. Europe was more likely to discuss performance informally (55%).
• One fifth of boards do not evaluate performance at all. This response was higher in Africa-Middle East (30%) than the Americas (13%).
• Of those organisations who do conduct formal or informal performance evaluations, 71% evaluate the full board, 55% evaluate individual directors, and 46% evaluate board committees.
• Forty per cent of directors very often or frequently take actions to address issues identified in board evaluations, while 26% never or occasionally attend to any concerns. The Americas were more likely to frequently address issues (14%).
There’s an opportunity for boards not already doing so to use board and director evaluations to focus on continuous improvement and aid board accountability for performance. Ultimately, the goal of board evaluation is for the board to achieve greater insight from its individual directors regarding the strengths of the board and its members, and to identify areas for improvement.
Following through when necessary (on board evaluations) by addressing underperforming members or directors whose skills do not align with the organisation’s strategy helps create a culture of accountability, and foster high performing boards11.
18
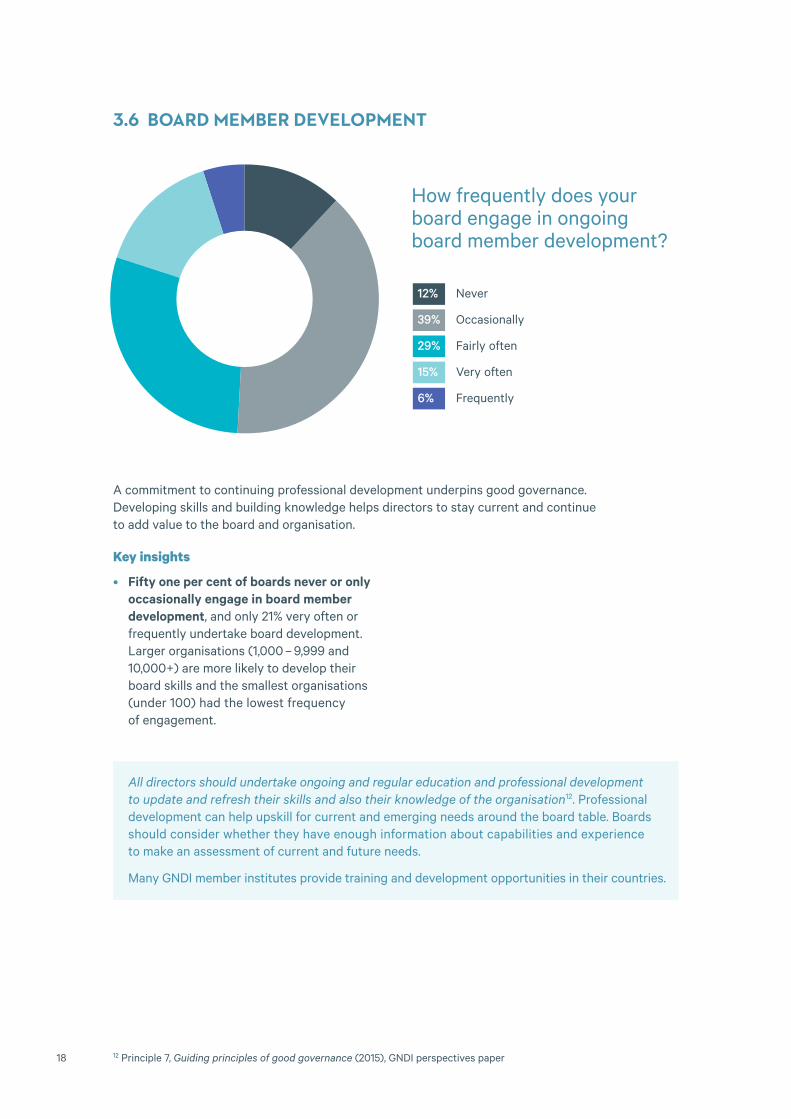
3.6 BOARD MEMBER DEVELOPMENT
A commitment to continuing professional development underpins good governance. Developing skills and building knowledge helps directors to stay current and continue to add value to the board and organisation.
Key insights
• Fifty one per cent of boards never or only occasionally engage in board member development, and only 21% very often or frequently undertake board development. Larger organisations (1,000 – 9,999 and 10,000+) are more likely to develop their board skills and the smallest organisations (under 100) had the lowest frequency of engagement.
12 Principle 7, Guiding principles of good governance (2015), GNDI perspectives paper
12% Never
39% Occasionally
29% Fairly often
15% Very often
6% Frequently
How frequently does your board engage in ongoing board member development?
All directors should undertake ongoing and regular education and professional development to update and refresh their skills and also their knowledge of the organisation12. Professional development can help upskill for current and emerging needs around the board table. Boards should consider whether they have enough information about capabilities and experience to make an assessment of current and future needs.
Many GNDI member institutes provide training and development opportunities in their countries.

19
3.7 BOARD RECRUITMENT AND DIVERSITY In the recruitment for candidates for the most recent vacancy on your board, how important were the following elements of diversity?
An effective and balanced board needs a broad mix of skills and experience. The meaning of board diversity varies around the world. While some countries and organisations have traditionally focused on gender diversity, diversity encompasses a much wider range of dimensions. It includes, but is not limited to, gender, ethnicity / race, nationality, religious beliefs, cultural or socio-economic background, and age13. Board diversity helps to ensure that boards are composed of directors who have a variety of complementary skills and offer a range of perspectives, insights, and views in relation to issues affecting the organisation; that is, they provide diversity of thought.
13 Board diversity (2013), GNDI perspectives paper
10%
12%
14%
21%
22%
15%
9%
20%
22%
14%
10%
8%
3%
62%
59%
16%
4%
7%
2%
2%
2%
31%
36%
51%
71%
3%
3%
18%
29%
18%
16%
20% 30% 40% 50% 60% 70% 100%80% 90%0%
Gender
Age
Ethnicity / race
Disability
Skills
Background / experience
By selecting diverse individuals, boards are drawing on the largest talent pool possible, rather than limiting themselves. Building a board that considers diverse perspectives in discussion and decision-making adds value to the organisation, helps combat groupthink, and is core to effective governance.
Not at all important
Slightly important
Important Fairly important
Very important
Key insights
• Skills were viewed as very important in their latest board recruitment by 59% of directors. There was wide regional variance in percentages with the Americas (70%) and Asia-Pacific (65%) at the higher end and Africa-Middle East (56%) and Europe (54%) at the lower end.
• Background / experience was the most important attribute (62%), with some geographic variance; the Americas were
above the median (68%) and Africa-Middle East below (52%).
• Gender was viewed as important, fairly important or very important by 51%, showing there is still a way to go in addressing gender balance around the board table. It was the third most important attribute in all regions excluding Africa-Middle East where ethnicity / race was the third most important (29%).

20
SECTION FOUR: ENVIRONMENTAL, SOCIAL AND GOVERNANCE ISSUES
4.1 ENVIRONMENTAL, ECONOMIC, AND SOCIAL ISSUES AND RISKS How relevant are the following environmental, economic, and social issues and risks to your organisation’s strategy and activities?
Ethi
cal b
ehav
iour
in o
ur o
rgan
isat
ion
Empl
oyee
hea
lth
and
safe
ty
Empl
oyee
rel
atio
ns a
nd e
ngag
emen
t
Con
sum
er p
rote
ctio
n, p
rodu
ct s
afet
y an
d qu
alit
y
Com
mun
ity
enga
gem
ent
Div
ersi
ty a
nd in
clus
ion
in o
ur o
rgan
isat
ion
Soci
ally
res
pons
ible
inve
stin
g w
ith
orga
nisa
tion
al r
esou
rces
Supp
ly c
hain
tra
nspa
renc
y
Hum
an r
ight
s (e
g in
sup
ply
chai
n,
labo
ur e
xplo
itat
ion)
Pollu
tion
, pac
kagi
ng, w
aste
and
rec
yclin
g
Clim
ate
chan
ge
Res
ourc
e sc
arci
ty a
nd d
eple
tion
Inco
me
disp
arit
y an
d pa
y pa
rity
Mea
suri
ng c
arbo
n, c
arbo
n em
issi
ons,
ca
rbon
foo
tpri
nt
Dep
leti
on o
f fo
ssil
fuel
s
50%
60%
70%
80%
90%
100%
40%
30%
20%
10%
0% 3% 3% 2%
13%
7%
12% 18
% 23%
24%
26% 30
%
28%
20%
38% 42
%
7% 8% 10%
13%
20%
23%
27% 25
% 26% 28
% 27%
28%
31%
29% 28
%
18% 24
%
32%
29%
37%
34%
31% 29
% 27% 26
% 25%
27%
34%
21% 18
%
65%
57%
46%
36% 32
% 24%
23%
22%
20% 17%
17% 14
%
13%
12%
72%
Not at all relevant A little relevant Somewhat relevant Very relevant

21
Social issues and risks are increasingly on boards’ agendas. Boards are giving increasing emphasis to environmental and social considerations, nonfinancial information and their relationship to long-term performance and value-creation. Underpinning this is understanding and responding to the evolving expectations of investors, consumers, staff and other stakeholders.
Best practice means that today’s boards need to be continually engaged in strategic matters to ensure the long-term sustainability of their organisations. It also means considering alternative future scenarios and balancing short-term and long-term thinking and needs.
Key insights
• Employee behaviour, health and safety and engagement were the three most relevant environmental and social issues and risks, showing the importance of employees, organisational culture and risks to boards.
• Ethical behaviour in organisations had the highest relevance at 72% but it is concerning that it was not at all relevant or a little relevant to 10% of directors across all regions. Within the global 72% Europe had the lowest response (58%) and the Americas the highest (78%). Unethical behaviour ultimately damages organisations and their personnel. Lost customers, employees and sales, and the loss of a hard-won good reputation can take years to rebuild. Some organisations may never recover. Conversely, running a company with consistent integrity and high ethical values is simply good business.
• Health and safety of employees was the second most relevant for directors globally (65%) and the top in Asia-Pacific (74%), considerably more relevant than in Europe (48%). New health and safety legislation in Australia and New Zealand will have
contributed to the high rate in Asia-Pacific.
• Employee relations and engagement was the third highest (57%) response for directors, more so in the Americas (62%) than in Europe (45%).
• Diversity and inclusion in their organisation were somewhat or very relevant to 66% of directors, a higher response than the board recruitment question (at section 3.7) where metrics of diversity had less importance (gender 30% fairly or very important, ethnicity and race 14%). Diversity and inclusion are important at all levels of an organisation.
• Income disparity and pay parity was very relevant to just 14% of organisations’ strategies and activities, yet poverty was the top economic and social issue across the globe for 45% of directors. There is a potential gap between concerns about national economic issues and the attention boards are giving to these issues.
• Many environmental issues and risks were rated not at all or a little relevant for organisations, including resource scarcity and depletion (56%), climate change (57%), carbon-related issues (67%), and depletion of fossil fuels (70%). These wider environmental concerns can impact the sustainability of organisations in the long-term.

22
4.2 REPORTING FRAMEWORKS What reporting frameworks does your organisation use?
This question provides a snapshot of global use of reporting frameworks. Future surveys may highlight trends influenced by global agreements, such as the Paris Accord signed in 2016 and the Sustainable Development Goals (SDGs) set by the United Nations in 2015. Organisations are being increasingly encouraged to be transparent about the wider impacts of their activities, advancing their reporting strategies to align with an evolving universe of reporting frameworks. There is a global trend for more holistic corporate reporting frameworks that goes beyond financial information. This includes reporting on selected ESG or sustainability metrics, or adopting one of the established frameworks, such as the Global Reporting Initiative (GRI) or Integrated Reporting, or against the SDGs.
Key insights
• Globally, the International Financial Reporting Standards framework (IFRS) is the most commonly used reporting framework (52%). Africa-Middle East had the highest response rate with 66% of directors reporting use of the IFRS framework. Europe had the lowest rate with 37%.
• The Africa-Middle East region also had the highest response rate for Integrated Reporting at 38%, likely influenced by the mandating of Integrated Reporting for listed companies in South Africa since 2010. The Americas had the lowest response rate at 9%.
• Stock exchange guidance on ESG reporting is used by 20% of directors in the Americas, and 13% of directors in Africa-Middle East.
• Europe had the highest use of UN Global Compact at 8%, with Asia-Pacific having the lowest at 3%.
• Nineteen per cent of directors reported their organisation did not use a reporting framework.
Acc
ount
ing
for
Sust
aina
bilit
y10
%
Sust
aina
ble
Dev
elop
men
t G
oals
11%
Inte
grat
ed R
epor
ting
15%
Stoc
k ex
chan
ge
guid
ance
on
ESG
18%
Non
e19
%
IFR
S fr
amew
ork
52%
50%
60%
40%
30%
20%
10%
0%
SASB
sta
ndar
ds5%
UN
Glo
bal C
ompa
ct5%
Glo
bal R
epor
ting
In
itia
tive
(G
RI)
12%

23
Executive team remuneration / compensation breakdown
15%
31%
54%
CEO/MD remuneration / compensation breakdown
16%
35%
49%
Director remuneration / compensation breakdown
21%
41%
38%
Gender breakdown of board and executive team
38%
17%
45%
50%
60%
40%
30%
20%
10%
0%
4.3 DISCLOSURE AND REMUNERATIONWhat does your organisation disclose?
14 OECD Corporate Governance Factbook (2017)
In a world of information, there are increasing expectations of reporting that is open and meaningful. Transparency and a level of consistency in governance reporting is important to the market, shareholders and stakeholders. Remuneration is an area of particular interest and scrutiny. The number of jurisdictions with regulatory requirements for public disclosure or corporate governance code recommendations regarding remuneration policies has increased post-Global Financial Crisis14.
Key insights
• Thirty eight per cent of organisations are required by a regulator to disclose director remuneration breakdown, and 35% are required to disclose CEO / MD remuneration. Forty one per cent do not disclose any director remuneration, and 54% do not disclose executive remuneration. Fifteen to twenty one per cent choose to disclose remuneration.
• Gender breakdown of the board and executive team is voluntarily disclosed by 38% of directors. There is noticeable differentiation among sectors with stronger responses reported in NFP (49%) and lower levels in private companies (35%).
• Africa-Middle East had the highest rates of choosing to disclose across all categories, while the Americas had the highest rates of required disclosure.
Chooses to Required by a regulator Does not disclose
24
The GNDI perspectives paper on Guiding Principles for Cybersecurity Oversight (2015) provides a framework of five principles to help boards monitor cyber-risk, develop strategies for seeking assurance and to oversee management.
1. Take a holistic approach. Directors should approach cybersecurity as an enterprise-wide risk management issue, not just an IT issue.
2. Understand the legislative environment. Directors should understand the legal implications of cyber-risk as they apply to the company’s specific circumstances.
3. Access expertise and put cybersecurity on the board agenda. Boards should have adequate access to cybersecurity expertise and discussions about cyber-risk management should be given regular and adequate time on the board meeting agenda.
4. Establish a framework. Directors should set the expectation that management will establish an enterprise-wide cyber-risk management framework with adequate staffing and budget.
5. Categorise the risks. Board-management discussions about cyber risk should include identification of which risks to avoid, accept, mitigate, or transfer through insurance, as well as specific plans associated with each approach.
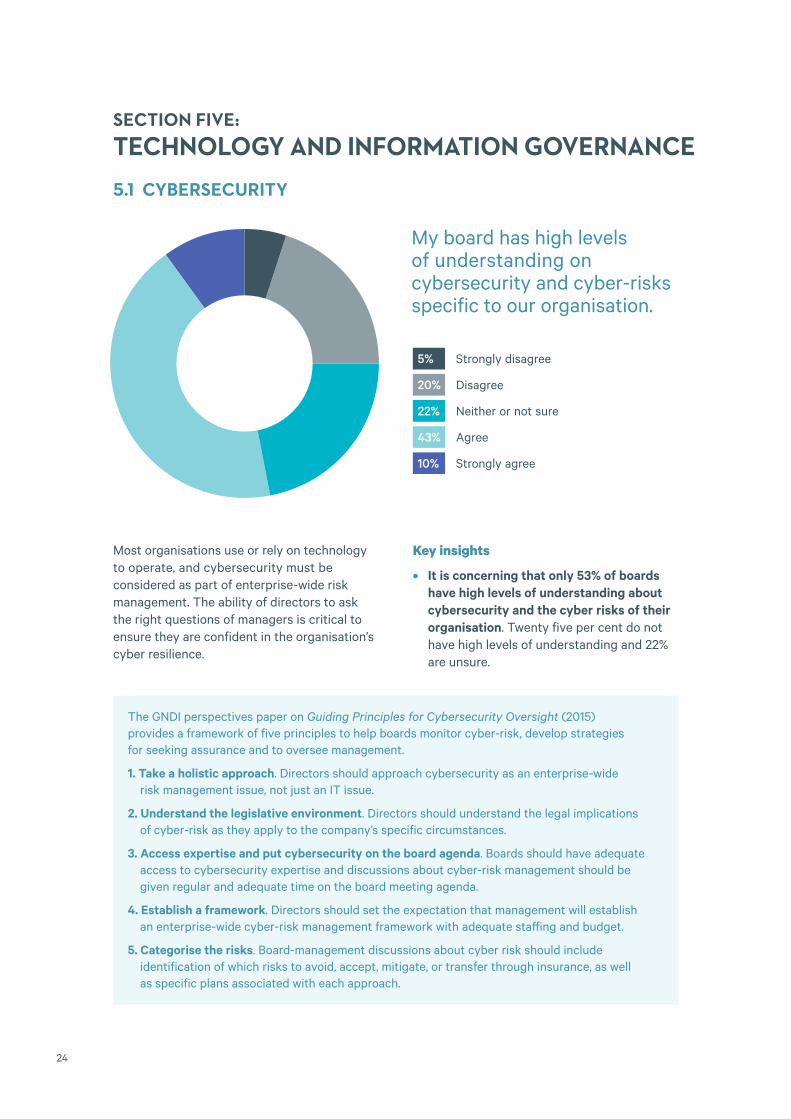
SECTION FIVE: TECHNOLOGY AND INFORMATION GOVERNANCE5.1 CYBERSECURITY
Most organisations use or rely on technology to operate, and cybersecurity must be considered as part of enterprise-wide risk management. The ability of directors to ask the right questions of managers is critical to ensure they are confident in the organisation’s cyber resilience.
5% Strongly disagree
20% Disagree
22% Neither or not sure
43% Agree
10% Strongly agree
My board has high levels of understanding on cybersecurity and cyber-risks specific to our organisation.
Key insights
• It is concerning that only 53% of boards have high levels of understanding about cybersecurity and the cyber risks of their organisation. Twenty five per cent do not have high levels of understanding and 22% are unsure.
25
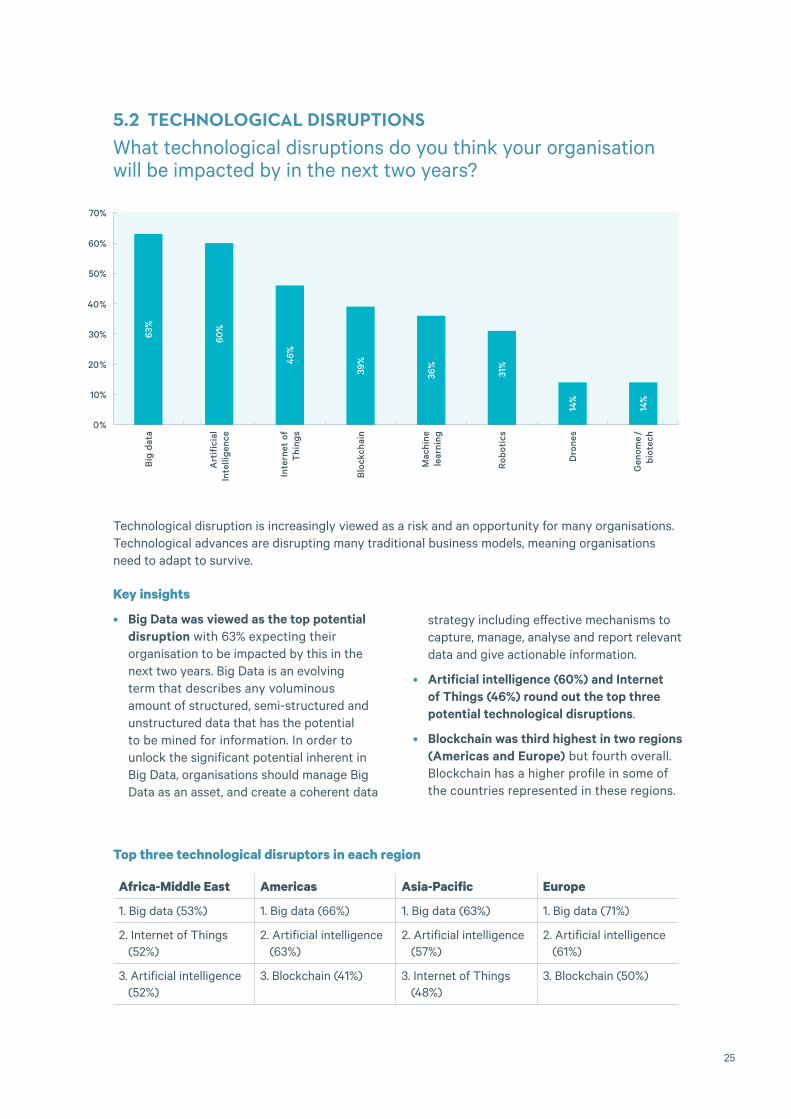
5.2 TECHNOLOGICAL DISRUPTIONS What technological disruptions do you think your organisation will be impacted by in the next two years?
Technological disruption is increasingly viewed as a risk and an opportunity for many organisations. Technological advances are disrupting many traditional business models, meaning organisations need to adapt to survive.
Top three technological disruptors in each region
Africa-Middle East Americas Asia-Pacific Europe
1. Big data (53%) 1. Big data (66%) 1. Big data (63%) 1. Big data (71%)
2. Internet of Things (52%)
2. Artificial intelligence (63%)
2. Artificial intelligence (57%)
2. Artificial intelligence (61%)
3. Artificial intelligence (52%)
3. Blockchain (41%) 3. Internet of Things (48%)
3. Blockchain (50%)
Rob
otic
s31
%
Mac
hine
le
arni
ng36
%
Blo
ckch
ain
39%
Inte
rnet
of
Thi
ngs
46%
Big
dat
a63
%
50%
60%
70%
40%
30%
20%
10%
0%
Art
ific
ial
Inte
llige
nce
Dro
nes
Gen
ome
/ bi
otec
h
60%
14%
14%
Key insights
• Big Data was viewed as the top potential disruption with 63% expecting their organisation to be impacted by this in the next two years. Big Data is an evolving term that describes any voluminous amount of structured, semi-structured and unstructured data that has the potential to be mined for information. In order to unlock the significant potential inherent in Big Data, organisations should manage Big Data as an asset, and create a coherent data
strategy including effective mechanisms to capture, manage, analyse and report relevant data and give actionable information.
• Artificial intelligence (60%) and Internet of Things (46%) round out the top three potential technological disruptions.
• Blockchain was third highest in two regions (Americas and Europe) but fourth overall. Blockchain has a higher profile in some of the countries represented in these regions.

26
5.3 DATA ANALYTICS IN BOARD DECISION MAKING
The ability to draw conclusions from data that organisations collect and maintain is an important strategic decision-making tool for directors. Predictive data analytics is increasingly contained within software, and being an analytics driven organisation from the top helps create long-term value, drive competitive advantage and manage risk.
Data is an asset that is massing exponentially and there is an opportunity for directors to develop their skills and knowledge in this area. By making the best use of the data their organisations have available, boards can use data analytics to detect, investigate and monitor patterns and transactions across the organisation.
7% Strongly disagree
21% Disagree
19% Neither or not sure
44% Agree
8% Strongly agree
My board uses data analytics in its decision making
Key insights
• Fifty two per cent of boards agree or strongly agree that they use data analytics in decision making.
• However, 28% of directors do not use data analytics in their governance decision making. Directors of smaller organisations with fewer than 1,000 employees were less likely to use data analytics (28%) than those of the largest organisations (22%).

27
5.4 BIG DATA IN BOARD DECISION MAKING
Key insights
• Big Data was the top technological disruption yet only 28% agree or strongly agree that they use Big Data in decision making. There was considerable variation across organisation size – 25% of those with under 100 employees were using Big Data compared to 35% of organisations with 10,000 + employees.
11% Strongly disagree
33% Disagree
28% Neither or not sure
24% Agree
4% Strongly agree
The value of Big Data turns on an organisation’s capacity to analyse and utilise it. Boards not already doing so should gain an understanding of how they can leverage Big Data and related analytics to create value.
The GNDI is developing and will publish at the end of 2018 the GNDI Guidelines on Data Governance.
My board uses big data in its decision making

28
5.5 DATA PRIVACY
With the European Union’s General Data Protection Regulation coming into force in May 2018, and many jurisdictions, including the United States, Canada and Australia, enacting some form of mandatory data breach reporting law, data privacy is an increasingly important issue globally. There is a growing concern about the collection, storage and use of private information by the public.
Key insights
• Sixty one per cent of directors have good or excellent understanding of their organisation’s data privacy practices. Of concern, 37% have limited or no understanding.
• Good or excellent understanding was highest in Europe (71%) and among organisations with 10,000+ employees (70%), and lowest in the Americas (57%) and organisations with fewer than 1,000 employees (61%).
1% Unsure
4% No understanding
33% Limited understanding
50% Good understanding
11% Excellent understanding
How would you rate the board’s understanding of the organisation’s data privacy practices?
With large scale data breaches occurring regularly, data privacy is a significant risk for organisations and their boards, and requires increasing oversight. There is an opportunity for boards to prioritise consideration of data privacy frameworks in light of the evolution of privacy and consumer expectations of how their personal data is treated.

29
APPENDIX 1: DETAILED SURVEY RESULTS
SURVEY QUESTIONS
SECTION ONE
Which are the top three social and economic problems facing your country of residence? Please select up to three.
Poverty / income inequality 977 45.36%
Taxation and government spending 889 41.27%
Cost of healthcare 818 37.98%
Infrastructure 729 33.84%
Housing 725 33.66%
Unemployment and labour issues 477 22.14%
Regulations 436 20.24%
Corruption 409 18.99%
Immigration 287 13.32%
Political instability 249 11.56%
Cost of education 210 9.75%
Other 198 9.19%
SECTION TWO
How confident are you about the prospects for growth in your organisation for next year (2019) compared to this year (2018)?
Not at all confident 112 5.25%
A little confident 295 13.84%
Moderately confident 757 35.51%
Mostly confident 729 34.19%
Very confident 239 11.21%
SECTION THREE
How frequently does your board discuss stakeholder trust in your organisation? A stakeholder is any person, organisation, social group, or society at large that has an interest in the activities of an organisation.
Never 117 5.55%
Occasionally 538 25.51%
Fairly often 629 29.82%
Very often 573 27.17%
Frequently 252 11.95%

30
What are the ways in which your board engages with stakeholders? Please select all that are relevant.
Direct engagement through industry associations or partnerships
1229 63.74%
Commercial relationships 985 51.09%
Customer surveys or feedback tools 962 49.90%
Public forums and meetings 861 44.66%
Complaints procedures 705 36.57%
Community engagement plans 668 34.65%
Social investment 553 28.68%
Direct engagement through NGO / non-profit relationships 542 28.11%
Other 136 7.05%
How does your board engage with employees? Select all that are relevant.
Through the CEO / Managing Director 1726 89.34%
At strategic planning meetings 988 51.14%
At site visits 963 49.84%
At conferences and work events, including social events 949 49.12%
On specific projects 753 38.98%
By employee representation on board committees 292 15.11%
By employee representation on board 201 10.40%
Other 136 7.04%
How engaged is your board with shareholders?
Not actively engaged 196 9.70%
Occasionally engaged 719 35.58%
Actively engaged 1106 54.73%
What are the ways in which your board engages with shareholders? Please select all that are relevant.
The organisation sends regular communications (electronic or print) to shareholders
1041 59.42%
The chair discusses governance and strategy with major shareholders
983 56.11%
Directors / board attend meetings with a range of major shareholders
910 51.94%
The organisation conducts investor roadshows 455 43.71%
Other 207 11.82%
31
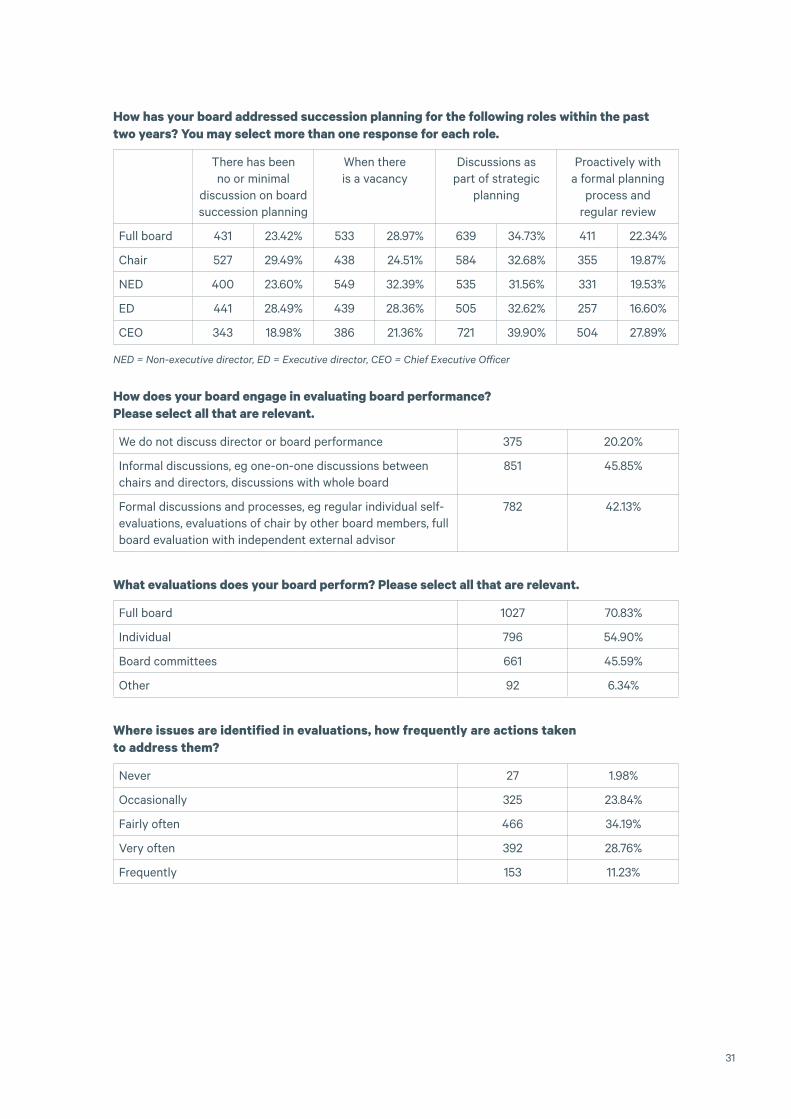
How has your board addressed succession planning for the following roles within the past two years? You may select more than one response for each role.
There has been no or minimal
discussion on board succession planning
When there is a vacancy
Discussions as part of strategic
planning
Proactively with a formal planning
process and regular review
Full board 431 23.42% 533 28.97% 639 34.73% 411 22.34%
Chair 527 29.49% 438 24.51% 584 32.68% 355 19.87%
NED 400 23.60% 549 32.39% 535 31.56% 331 19.53%
ED 441 28.49% 439 28.36% 505 32.62% 257 16.60%
CEO 343 18.98% 386 21.36% 721 39.90% 504 27.89%
NED = Non-executive director, ED = Executive director, CEO = Chief Executive Officer
How does your board engage in evaluating board performance? Please select all that are relevant.
We do not discuss director or board performance 375 20.20%
Informal discussions, eg one-on-one discussions between chairs and directors, discussions with whole board
851 45.85%
Formal discussions and processes, eg regular individual self-evaluations, evaluations of chair by other board members, full board evaluation with independent external advisor
782 42.13%
What evaluations does your board perform? Please select all that are relevant.
Full board 1027 70.83%
Individual 796 54.90%
Board committees 661 45.59%
Other 92 6.34%
Where issues are identified in evaluations, how frequently are actions taken to address them?
Never 27 1.98%
Occasionally 325 23.84%
Fairly often 466 34.19%
Very often 392 28.76%
Frequently 153 11.23%

32
How frequently does your board engage in ongoing board member development?
Never 224 11.98%
Occasionally 728 38.93%
Fairly often 537 28.72%
Very often 277 14.81%
Frequently 104 5.56%
In the recruitment for candidates for the most recent vacancy on your board, how important were the following elements of diversity?
Not at all important
Slightly important
Important Fairly important
Very important
Background / experience
44 2.46% 50 2.79% 216 12.05% 366 20.42% 1116 62.28%
Skills 34 1.89% 53 2.94% 255 14.17% 404 22.44% 1054 58.56%
Gender 562 31.45% 315 17.63% 377 21.10% 244 13.65% 289 16.17%
Age 907 51.30% 323 18.27% 257 14.54% 149 8.43% 132 7.47%
Ethnicity / race
632 35.65% 510 28.76% 396 22.34% 171 9.64% 64 3.61%
Disability 1227 70.72% 272 15.68% 156 8.99% 51 2.94% 29 1.67%

33
SECTION FOUR
How relevant are the following environmental, economic, and social issues and risks to your organisation’s strategy and activities?
Not at all relevant A little relevant Somewhat relevant
Very relevant
Ethical behaviour in our organisation
48 2.75% 115 6.59% 319 18.27% 1264 72.39%
Employee health and safety
44 2.53% 143 8.23% 425 24.45% 1126 64.79%
Employee relations and engagement
38 2.18% 168 9.62% 551 31.54% 990 56.67%
Consumer protection, product safety and quality
221 12.64% 229 13.10% 502 28.72% 796 45.54%
Community engagement
115 6.61% 353 20.30% 651 37.44% 620 35.65%
Diversity and inclusion in our organisation
203 11.66% 402 23.09% 586 33.66% 550 31.59%
Socially responsible investing with organisational resources
312 17.87% 469 26.86% 548 31.39% 417 23.88%
Supply chain transparency
393 22.65% 433 24.96% 509 29.34% 400 23.05%
Human rights (eg in supply chain, labour exploitation)
426 24.29% 461 26.28% 476 27.14% 391 22.29%
Pollution, packaging, waste and recycling
461 26.39% 481 27.53% 460 26.33% 345 19.75%
Climate change 528 30.22% 473 27.07% 442 25.30% 304 17.40%
Resource scarcity and depletion
483 27.85% 492 28.37% 466 26.87% 293 16.90%
Income disparity and pay parity
352 20.20% 548 31.44% 591 33.91% 252 14.46%
Measuring carbon, carbon emissions, carbon footprint
667 38.16% 500 28.60% 362 20.71% 219 12.53%
Depletion of fossil fuels
735 42.10% 491 28.12% 318 18.21% 202 11.57%

34
What reporting frameworks does your organisation use? Please select all that apply.
IFRS framework 898 51.73%
Stock exchange guidance on ESG 317 18.26%
Integrated Reporting (<IR>) 261 15.03%
Global Reporting Initiative (GRI) 204 11.75%
Sustainable Development Goals (SDG’s) 190 10.94%
Accounting for Sustainability 181 10.43%
SASB standards 85 4.90%
UN Global Compact 82 4.72%
Other 263 15.15%
None 333 19.18%
What does your organisation disclose?
Chooses to Required by a regulator
Does not disclose
Director remuneration / compensation breakdown
354 20.64% 659 38.43% 702 40.93%
CEO / MD remuneration / compensation breakdown
274 15.96% 608 35.41% 835 48.63%
Executive team remuneration /compensation breakdown
259 15.16% 535 31.30% 915 53.54%
Gender breakdown of board and executive team
652 38.22% 286 16.76% 768 45.02%
SECTION FIVE
Please rate your level of agreement with the following statement. My board has high levels of understanding on cybersecurity and cyber-risks specific to our organisation.
Strongly disagree 82 4.71%
Disagree 341 19.59%
Neither or not sure 390 22.40%
Agree 749 43.02%
Strongly agree 179 10.28%

35
What technological disruptions do you think your organisation will be impacted by in the next two years?
Big data 1048 63.13%
Artificial intelligence (AI) 993 59.82%
Internet of Things 757 45.60%
Blockchain 644 38.80%
Machine learning 595 35.84%
Robotics 513 30.90%
Genome / biotech 237 14.28%
Drones 229 13.80%
Other 121 7.29%
Please rate your level of agreement with the following statement. My board uses data analytics in its decision making.
Strongly disagree 129 7.44%
Disagree 367 21.15%
Neither or not sure 334 19.25%
Agree 768 44.27%
Strongly agree 137 7.90%
Please rate your level of agreement with the following statement. My board uses Big Data in its decision making.
Strongly disagree 189 10.91%
Disagree 577 33.29%
Neither or not sure 491 28.33%
Agree 413 23.83%
Strongly agree 63 3.64%
How would you rate the board’s understanding of the organisation’s data privacy practices?
Unsure 20 1.16%
No understanding 77 4.47%
Limited understanding 575 33.35%
Good understanding 857 49.71%
Excellent understanding 195 11.31%

36
DEMOGRAPHIC QUESTIONS
What type of organisation is your primary directorship / governance role with?
Privately owned company 617 35.79%
Publicly listed company 398 23.09%
Not-for-profit organisation / NGO / Charity 375 21.75%
Government organisation / public sector 183 10.61%
Subsidiary of a publicly listed company 67 3.89%
Other 84 4.87%
What is the total headcount of the above organisation?
10 – 99 employees 655 38.44%
100 – 999 employees 590 34.62%
1,000 – 9,999 employees 343 20.13%
more than 10,000 employees 116 6.81%
What position / s do you hold in your primary directorship / governance role? Please select all that apply.
Non-executive Director 644 37.46%
Chair of Committee 340 19.78%
Chair 334 19.43%
Managing Director (including CEO) 284 16.52%
Executive Director 217 12.62%
Deputy Chair 68 3.96%
Other 213 12.39%
How long have you served on the board of your primary directorship / governance role?
Two years or less 454 26.63%
Three to five years 563 33.02%
Six to ten years 361 21.17%
Ten years or more 327 19.18%

37
Including your primary directorship / governance role, how many directorships / governance roles do you have?
One 399 23.43%
Two 501 29.42%
Three 416 24.43%
Four 196 11.51%
Five or more 191 11.22%
What is your gender?
Male 1191 69.65%
Female 513 30.00%
Gender diverse 6 0.35%
What is your age?
Under 35 years old 29 1.70%
35 to 44 years old 146 8.54%
45 to 54 years old 472 27.60%
55 to 64 years old 654 38.25%
65 to 74 years old 364 21.29%
75 years or older 45 2.63%

38
APPENDIX 2:ABOUT THE GNDIGNDI is an international network of 21 director institutes and was established in December 2012 to foster closer cooperation between its members, who are each recognised as the primary institute for directors and governance in their respective country.
The following organisations are members of GNDI:
• Australian Institute of Company Directors (AICD)
• Instituto de Gobernanza Empresarial y Pública (IGEP), Argentina
• Brazilian Institute of Corporate Governance (IBGC)
• European Confederation of Directors Associations (ecoDa)
• GCC Board Directors Institute (GCC BDI)
• Hong Kong Institute of Directors (HKIoD)
• Independent Directors Association (IDA), Russia
• Institute of Corporate Directors (ICD), Canada
• Institute of Corporate Directors (ICD), Philippines
• Institute of Directors in New Zealand (IoDNZ)
• Institute of Directors in Southern Africa (IoDSA)
• Institute of Directors (IoD) in the United Kingdom
• Israel Directors Union (IDU)
• Malaysian Alliance of Corporate Directors (MACD)
• Mauritius Institute of Directors (MIoD)
• National Association of Corporate Directors (NACD), United States of America
• Pakistan Institute of Corporate Governance (PICG)
• Singapore Institute of Directors (SID)
• Swiss Institute of Directors (SIoD)
• Thai Institute of Directors (TIoD)
• Vereinigung der Aufsichtsräte in Deutschland e.V. (VARD)

39
APPENDIX 3: REFERENCESGNDI PERSPECTIVES PAPERS
These can be found at www.gndi.org
Perspectives Paper on Renewing the Board, November 2015
Guiding Principles for Cybersecurity Oversight, November 2015
Guiding Principles of Good Governance, May 2015
Board-Shareholder Communications, December 2013
Integrated Reporting, August 2013
Board Diversity, February 2013
OTHER REPORTS
Edelman Trust Barometer, www.edelman.com
OECD Corporate Governance Factbook (2017), OECD
© Copyright 2018 Institute of Directors in New Zealand (Inc)
Disclaimer: This communication contains general information only, and should not be used or relied upon as a substitute for proper professional advice or as a basis for formulating business decisions. The Global Network of Director Institutes and its member organisations and related entities shall not be responsible for any loss whatsoever sustained by any person or organisation who relies on this communication.
ISBN: 978-0-473-45584-2

GLOBAL NETWORK OF DIRECTOR INSTITUTES