September 2017 DRAFT Per- and Poly-Fluorinated Alkyl ...€¦ · September 2017 DRAFT Per- and...
22
September 2017 DRAFT PFAS CAP – Uses Chapter for external review (10/06/17). Do not cite or quote. 1 September 2017 DRAFT Per- and Poly-Fluorinated Alkyl Substances Chemical Action Plan (PFAS CAP) The Washington State departments of Ecology and Health prepared a draft of several PFAS CAP chapters for external review. This document is one chapter to a planned multi-chapter PFAS CAP. This material may be modified in response to comments and the content re-organized for the final Action Plan. The September 2017 Draft PFAS CAP includes: Health, Environment, Chemistry, Regulations – posted online by 09/20/2017 Uses, Intro – posted online by 10/06/2017 The draft chapters may include cross-references to other sections/chapters in the Draft PFAS CAP or notes where additional information will be provided in a later draft. The PFAS CAP Advisory Committee will discuss comments on these draft chapters at the November 1, 2017 meeting. Ecology and Health are asking interested parties to provide feedback. Comments on these draft documents are due to Ecology by October 20, 2017. Comments on all chapters will be accepted after October 20 th . Comments received by October 20 will be reviewed at the November 1 Advisory Committee meeting. Submit comments, suggestions, and questions to Kara Steward at [email protected] The Draft PFAS CAP documents are posted at https://www.ezview.wa.gov/?alias=1962&pageid=37105 (at the bottom of the webpage).
Transcript of September 2017 DRAFT Per- and Poly-Fluorinated Alkyl ...€¦ · September 2017 DRAFT Per- and...

September 2017 DRAFT PFAS CAP – Uses Chapter for external review (10/06/17). Do not cite or quote.
1
September 2017 DRAFT Per- and Poly-Fluorinated Alkyl Substances
Chemical Action Plan (PFAS CAP)
The Washington State departments of Ecology and Health prepared a draft of several PFAS CAP chapters
for external review. This document is one chapter to a planned multi-chapter PFAS CAP. This material
may be modified in response to comments and the content re-organized for the final Action Plan.
The September 2017 Draft PFAS CAP includes:
Health, Environment, Chemistry, Regulations – posted online by 09/20/2017
Uses, Intro – posted online by 10/06/2017
The draft chapters may include cross-references to other sections/chapters in the Draft PFAS CAP or
notes where additional information will be provided in a later draft.
The PFAS CAP Advisory Committee will discuss comments on these draft chapters at the November 1,
2017 meeting.
Ecology and Health are asking interested parties to provide feedback. Comments on these draft
documents are due to Ecology by October 20, 2017.
Comments on all chapters will be accepted after October 20th. Comments received by October 20 will be
reviewed at the November 1 Advisory Committee meeting.
Submit comments, suggestions, and questions to Kara Steward at [email protected]
The Draft PFAS CAP documents are posted at
https://www.ezview.wa.gov/?alias=1962&pageid=37105 (at the bottom of the webpage).

September 2017 DRAFT PFAS CAP – Uses Chapter for external review (10/06/17). Do not cite or quote.
2
PFAS USE and RELEASE
An overview of per- and poly-fluorinated alkyl substance (PFAS) production is provided in this chapter. Several references are provided that contain more details about historic PFAS production than is included in this PFAS CAP. PFAS manufacturing is not known to occur in Washington State. The discussion of PFAS use focuses on data and estimates for Washington State. A summary of several studies of PFAS in consumer products is included in this chapter.
PFAS Production
The process for producing PFAS was developed in the 1940s – a detailed discussion of PFAS chemistry is provided in the Chemistry chapter. Since 1950, PFAS compounds, surfactants and polymers have been widely used in numerous industrial and commercial applications.
PFAS are still being produced worldwide, but the production of long-chain PFAS has greatly declined over the past 15 years. Perfluorooctane sulfonate (PFOS), perfluorooctanoic acid (PFOA) and related long-chains are no longer produced or used by major manufacturers in the U.S., Europe, and Japan. Manufacturers in China, India and Russia continue to use long-chains under no existing regulation (Fluoro-Council 2017). There are no known manufacturers of PFAS in Washington State.
PFOS Production
The 3M Company began producing PFOS in the 1940s. Perfluorooctane sulfonyl fluoride (POSF) is used as an intermediate in the production of PFOS and PFOS derivatives, and the production of POSF can be used as an indicator of the total production of PFOS-related substances. POSF production reached a peak from 1970 through 2002 with an estimated total cumulative production of 96,000 metric tons (1 metric ton is equal to 1.10231 ton). From 1970 to 2002, the main end uses of the POSF-derived substances were (DEPA 2013, Paul 2009):
Carpet: 48,000 metric tons
Paper and packaging: 24,000 metric tons
Apparel: 12,500 metric tons
Performance chemicals (hydraulic fluids): 6,000 metric tons
AFFF: 10,000 metric tons
Reduction of PFOS production occurred in 2002 when 3M voluntarily discontinued production of PFOS and other long-chain PFAS. 3M was the major global manufacturer of PFOS. Additionally, in 2009 PFOS was included in the Stockholm Convention list of Persistent Organic Pollutants with restrictions on its use internationally. (Buck 2011) After 2002, 3M switched to less bioaccumulative short-chain PFAS (MDH 2012).

September 2017 DRAFT PFAS CAP – Uses Chapter for external review (10/06/17). Do not cite or quote.
3
After 2002, PFOS global production continued at an estimated 1,000 tons per year. PFOS and its derivatives are still manufactured in China, with a production of more than 200 tons of its precursor POSF in 2006 (Buck 2011).
PFOA and PFNA Production
The estimated global production of PFOA and ammonium perfluorooctanoate (APFO) from 1951-2004 is 3,600-5,700 metric tons, while the manufacturing of perfluorononanoic acid (PFNA) and ammonium perfluorononanoate (APFN) during the same period is estimated at 800-2,300 metric tons (Prevedouros et al., 2006). PFOA and its related compounds are mainly used as surfactants.
In 1999, global annual APFO production was approximately 260 metric tons. A 2009 Organization for Economic Co-operation and Development (OECD) survey reported manufacture of 5.5 metric tons of PFOA and related compounds (note: OECD PFAS surveys were completed in 2004, 2006 and 2009).
Reduction of PFOA production resulted from a 2006 stewardship agreement between EPA and eight leading global companies to reduce production and releases of PFOA, its precursors and higher homologs such as C9, C10, and C11. That agreement included a commitment to 95% reduction of global emissions and product content by 2010 and elimination by 2015. All participating companies reported that they met the stewardship goals (EPA 2014).Other national and international agreements also affected PFOA production (Buck 2011).
Fluorotelomer Production
Worldwide production of fluorotelomers for polymer production and surface coatings has been estimated at 11,000 to 13,000 tons per year (Lindstrom 2011, DEPA 2013). Five fluorotelomers that potentially may degrade to PFOA and PFNA were reported as present in products at 20 metric tons per year (OECD 2011). An analysis of the fluorochemical market predicts continued growth in fluoropolymer use in the electronic, construction and automotive industries (Grand View Research 2016).
US Production Data
Under the Toxic Substances Control Act, EPA gathers production data for chemical substances in commerce, including PFOS and PFOA. Table 1 lists the annual volumes of PFOS and PFOA reported to the EPA in the Chemical Reporting Database (EPA 2017). The reports to EPA include national production volume (in ranges), other manufacturing information, and processing and use information. Some information submitted to the EPA is withheld as confidential. The totals include both domestic production and imports. After 2002, no reports are recorded in the Chemical Reporting Database for perfluorobutanoic acid (PFBA), PFOS or PFOS potassium salt. PFOA and APFO data are recorded in the database as withheld from 2012 to 2015.

September 2017 DRAFT PFAS CAP – Uses Chapter for external review (10/06/17). Do not cite or quote.
4
Table 1 – Reported PFAS Production in the U.S. (thousands of pounds per year)
PFAS 1986 1990 1994 1998 2002 2006 2012-15
PFOA 10-500 NR 10-500 10-500 10-500 <500 Withheld
APFO 10-500 10-500 10-500 10-500 500-1000 <500 Withheld
PFBA 10-500 NR NR NR NR NR NR
PFOS NR NR 10-500 NR 10-500 NR NR
PFOS potassium salt
10-500 10-500 10-500 10-500 10-500 NR NR
NR – no reports (EPA 2017, ATSDR 2015)
EU Production Data
The OECD conducts surveys on production and releases of PFAS and published several lists of PFAS. The 2006 survey identified 960 PFOS, PFAS, PFOA and perfluoroalkyl carboxylic acids (PFCA) substances, of which 623 substances are included in the list of pre-registered substances under the European Union Registration, Evaluation, Authorization and Restriction of Chemicals (REACH) (ECHA, 2012b). Many side-chain-fluorinated polymers on the OECD 2007 list are not registered under REACH.
In 2013, REACH registrations included 23 PFAS. The total registered tonnage of PFOS, PFOA, APFO production under REACH is in the range of 15-150 ton/yr. The total consumption of PFAS with end-uses, considering global production, is likely in the 2,000-4,000 ton per year range (DEPA 2013) – see Table 2.
Table 2 – Estimated PFAS Use in the EU in 2011 (tons per year)
Substance group Estimated EU consumption in 2011
Use
PFOS and related substances
2-10 ton/yr
Metal plating industry (81%) Photographic industry Semiconductor industry Hydraulic fluids in aviation industry
PFOA and APFO 25-50 ton/yr Fluoropolymer production (majority) Photographic industry Semiconductor industry
Longer chained PFCA and related substances
No data
Short-chain PFAS 30-130 ton/yr
Limited data: Surfactants, reactive processing aids
Fluorotelomers No registrations

September 2017 DRAFT PFAS CAP – Uses Chapter for external review (10/06/17). Do not cite or quote.
5
Substance group Estimated EU consumption in 2011
Use
Side-chain-fluorinated polymers
2,000-4,000 ton/yr Probably same as world market: Textiles and apparel (50%) Carpet and carpet care products Coatings, including those for paper products
(DEPA 2013, DEPA 2016)
PFAS Uses
Due to their unique physical and chemical properties, PFAS are used in a variety of industrial applications and consumer products. PFAS have been used to provide non-stick surfaces on cookware and waterproof coatings for textiles and paper products. They serve as high performance surfactants in numerous products that must flow freely, including paints, cleaning products, fire-fighting foams used to fight fuel-based fires, and engineering coatings used in semiconductor production (EPA 2015b). PFOS and PFOA were used in the United States in carpets, leathers, textiles, upholstering, paper packaging, coating additives, and as a waterproofing or stain resistant agent (EPA 2016b, 2016c).
PFOS has been used as a surfactant in many different applications, most notably in aqueous film-forming foam (AFFF)1 to extinguish flammable liquid fires and in fume suppressants used in metal plating processes and in the semiconductor industry. PFOS was a major component of AFFF manufactured by 3M. Limited uses of PFOS-related chemicals are allowed for which alternatives are not yet available, including use in aviation fluid, photomicrolithography, film processing, as an etchant, and for metal plating and finishing (40 CFR §721.9582).
PFOA has been used in a variety of consumer products and in the production of fluoropolymers, and is generated as a degradation product of other perfluorinated compounds. PFOA was used in the United States primarily as an aqueous dispersant agent in the manufacture of fluoropolymers and in a variety of water-, oil-, and stain-repellant products. PFOA is resistant to environmental degradation and biotransformation. It is used to make fluoropolymer substances that impart valuable properties such as fire resistance and oil and water repellency. It is used in numerous applications such as in cooking surfaces, food containers and contact paper, toothpaste, shampoos, polishes and waxes, electronics, lubricants, stain repellants on carpets and upholstered furniture, flame repellants, firefighting foams, paints, emulsifiers, and plumbing tape. The United States production of PFOA has been phased out but it is produced in other countries (EPA 2016a).
The OECD 2009 survey results showed that PFAS continue to have a wide range of uses. The 2009 OECD survey sought information on the production and use of PFAS with chain lengths of
1 AFFF are chemical mixtures developed to extinguish and prevent re-ignition of hydrocarbon fuel-based fires.
PFOS was a commonly used fluorosurfactant in AFFFs (before phase-out in 2002)

September 2017 DRAFT PFAS CAP – Uses Chapter for external review (10/06/17). Do not cite or quote.
6
6 carbons or more. The survey includes information about PFAS release to the environment during manufacturing and formulation of products (there is no manufacturing of PFAS or PFAS products in Washington, so those ‘release’ estimates are not applicable). Responses to the OECD survey referred to general uses for the PFAS in products, such as ‘processing agents’ or ‘manufacturing intermediates.’ The survey included a report of PFAS concentrations in the products, generally ranged between 0.1 part per million (ppm) and 80,000 ppm (equal to 8 percent). The total amount of these chemicals present as residues in products was nearly 45 metric tons. Several perfluorinated chemicals were reported to be present only as impurities with no specific use in products being reported. PFAS have been employed in hundreds of other applications across almost all industrial sectors, some of which are highlighted in Table 3.
Table 3 – Product Categories and PFAS Use
Product category PFAS use in products
Automotive low friction bearings and seals, lubricants, tubing, seals, wire insulation, metal plating, wire plating and other equipment, fuel additives, surfactants, emulsifiers, hydraulic fluid
Aviation, Aerospace & Defense
hydraulic fluid additives, insulators, solder
Biocides plant growth, insecticides, pesticides, insect repellant
Cable & wiring coating for weathering, flame and soil resistance, surface treatments
Construction additives in paints and coatings, varnishes, adhesives, and sealants, plumbing tape and paste
Electronics flame retardants, insulators, solder
Energy solar collector film
Firefighting foams for petroleum fires for aerospace, oil transport, and oil refineries; firefighting equipment
Food Packaging and Processing
paper coatings for fast food and candy wrappers, microwave popcorn and pizza box liners; fabrication materials
Homes and Businesses carpet and carpet care products, cleaning products, outdoor and upholstered furniture, cookware coated with PTFE; stain/water repellants on clothing, bedding materials, upholstered furniture, carpets; waxes, floor polishes, printing inks,
Industrial electronics, semiconductor, aerospace, automotive, pesticides, photography, oil & mining (surfactants)
Medical equipment, surgical patches, cardiovascular grafts, implants, surgical drapes/gowns (stain/water repellant), fluoropolymer or Teflon tubing
Personal products toothpaste, shampoo, cosmetics, sunblock, moisturizers, hand creams, textiles and apparel, outdoor clothing and equipment
Planes upholstery, carpet, tubing, seals, wire insulation, metal plating, wire plating and other equipment, fuel additives, lubricants,
September 2017 DRAFT PFAS CAP – Uses Chapter for external review (10/06/17). Do not cite or quote.
7
Product category PFAS use in products
surfactants, emulsifiers, hydraulic fluid, stain/water repellants on upholstery and carpets
Textiles, leather & apparel
porous fabrics, oil and water repellant, stain release
In 2015, there were 237,538 businesses registered in Washington State. Table 4 lists the number of establishments identified in a potentially related North American Industry Classification System code (ESD 2017). The food manufacturing industry includes subcategories of businesses that may use PFAS treated food packaging paper. Not all of the businesses in each code category are assumed to use PFAS chemicals in their operations.
Table 4 List of businesses in Washington (2016)
NAICS Code Industry Total WA Businesses
311 Food manufacturing 993
313 Textile mills 21
314 Textile product mills 148
315 Apparel manufacturing 90
316 Leather and allied product manufacturing 26
322 Paper manufacturing 99
323 Printing and related support activities 497
324 Petroleum and coal products manufacturing 56
325 Chemical manufacturing 284
326 Plastics and rubber products manufacturing 201
332 Fabricated metal product manufacturing 1,115
333 Machinery manufacturing 433
334 Computer and electronic product manufacturing 394
335 Electrical equipment and appliance mfg. 129
336 Transportation equipment manufacturing 482
337 Furniture and related product manufacturing 406
339 Miscellaneous manufacturing 788
Total number of businesses 6,162
PFAS Product Use
The amount of PFAS in consumer products in Washington State is difficult to estimate. One way to create a Washington estimate is to scale the global estimate of the use of PFAS in products (see the beginning of this chapter) to Washington State.

September 2017 DRAFT PFAS CAP – Uses Chapter for external review (10/06/17). Do not cite or quote.
8
The US comprises 24 percent of the global economy, Washington State is 2.55 percent of the US economy. Applying that ratio to the PFAS production/use estimates of 96,000 metric tons of PFOS/POSF and 8,000 metric tons of PFOA and related compounds results in a very rough estimate of PFAS in Washington State products (Table 5). The use of PFOS included inks, varnishes, waxes, fire-fighting foams, metal plating and cleaning, coating formulations, lubricants, water and oil repellents for leather, paper and textiles (Paul et al., 2009).
For example: Global use of POSF in carpet from 1970-2002 was 48,000 metric tons, the Washington state proportion of that total is 294 metric tons (324 tons). The annual use of POSF in carpet in Washington could be 10 ton/year (over the 32 year period from 1970-2002). The 10.1 tons of POSF per year in carpet used in Washington could emit 4.5 tons of POSF and PFOS each year (using the consumer use/disposal emission rates in Table 1 of Paul 2009).
Table 5 – Estimated Washington State PFAS Uses and Releases
Product PFAS in WA Products PFAS Emissions
Carpet 10.1 ton/yr 4.5 ton/yr
Paper and packaging 5.1 ton/yr 0.1 ton/yr
Apparel 2.6 ton/yr 2.7 ton/yr
Performance chemicals 1.3 ton/yr 0.0 ton/yr
AFFF 2.1 ton/yr 2.0 ton/yr
Surfactants 1.0 ton/yr 0.5 ton/yr
TOTAL 22.2 ton/yr 9.8 ton/yr Note: estimated values were converted from metric tons to U.S. tons.
Global PFAS emission estimates during consumer use and disposal are applied to the estimates of PFAS in Washington products in Table 5. It has been reported that 85% of PFAS emissions are a result of consumer use of a PFAS treated product. Emissions during use of consumer products include losses from stain repellant treated carpet, waterproof apparel, and AFFF. This would occur differently over the lifetime of the product use and differ between product types (like carpet versus treated paper). (Paul 2009)
Table 5 focuses on historic consumption of PFAS products in Washington State. Due to the reduction in PFOS and PFOA production, more recent estimates are needed to reflect current PFAS consumption. A recent estimate from Denmark indicates a total quantity of PFAS products to be in the range from 14 to 34 metric tons per year. The major products in this estimate were textiles/apparel (taking up 50% of global production), carpets, packaging and other articles.
Washington State is larger than Denmark in area, population and gross domestic production. Using the ratio of gross domestic production between Washington and Denmark, a current estimate of PFAS product consumption would be 16 to 38 tons per year (converted from metric tons).

September 2017 DRAFT PFAS CAP – Uses Chapter for external review (10/06/17). Do not cite or quote.
9
Fire-fighting foams - Class-B (flammable liquid) fire-fighting foams include AFFF, Fluoroprotein (FP), and film forming fluoroprotein foam (FFFP). PFAS-based class B fire- fighting foams have been used since the 1970s for vapor suppression, firefighting and fire-fighting training at airports, refineries, bulk storage terminals and other facilities handling large volumes of flammable liquid hydrocarbon. PFAS are used in fire foam products because of their ability to produce a foam that will wet the surface of liquid hydrocarbon, resulting in a much faster foam spreading rate than is possible using only hydrocarbon-based surfactants. AFFF is released directly into the environment when used – for training or fire suppression. Fire-fighting foam containing >0.001 PFOS (by weight) have been banned for use in the EU since 2011, disposal is required by high-temperature incineration. Several studies have identified fire training as a high potential source for PFAS contamination in groundwater. (DEPA 2014, Concawe 2016)
Potential sources of PFAS contamination related to AFFF use are distributed across Washington State based on the location of airports, military sites, fire training centers and locations where foam has been used to extinguish petroleum fires. AFFF storage and use may also occur at petroleum refineries, petroleum transportation areas, and specific manufacturing installations where fire suppression is installed in a facility.
Fire departments and fire training - According to the Washington State Fire Marshalls office
there is no comprehensive list of all of the fire-training facilities in the state. Several fire training
sites are listed below.
Big Bend Community College Air Rescue Fire Fighting Training, Moses Lake
North Bend Fire Training Academy, North Bend
City of Seattle Joint Training Facility, Seattle
Spokane Fire Department – Training, Spokane
Tacoma Fire Department Training Division, Tacoma
Yakima Training Center Fire Department, Yakima
Kent Fire Department – Fire Training Center
Airports - Other areas where fire activities (training or fire suppression) may occur include
airports. The 11 airports certified by the FAA to handle aircraft rescue and firefighting are listed
below (FAA 2017). In addition to those listed below, there are 150 general aviation, reliever,
and private airports and airstrips around the state (WSDOT 2017).
Bellingham International, Bellingham
Snohomish County (Paine Field), Everett
Grant County International, Moses Lake
Tri-Cities, Pasco
Pullman/Moscow Regional, Pullman
Boeing Field/King County International, Seattle
Seattle-Tacoma International, Seattle
Spokane International, Spokane
Walla Walla Regional, Walla Walla

September 2017 DRAFT PFAS CAP – Uses Chapter for external review (10/06/17). Do not cite or quote.
10
Pangborn Memorial, Wenatchee
Yakima Air Terminal (McAllister Field), Yakima
The Department of Defense inventoried fire and crash training sites where the military is
assessing the risk of groundwater contamination from firefighting foam (DOD 2014). This
inventory identified 5 sites in Washington State where PFAS use or releases may have occurred.
Those sites are listed below. There are other active and inactive military installations located
around Washington State.
Four Lakes Communications Air Guard Station (closed), Cheney – 1 research site
Fairchild Air Force Base, Spokane – 2 training areas
Joint Base Lewis-McChord, Tacoma - 6 training areas and 2 spill locations
Naval Air Station Whidbey Island, Whidbey Island – 4 sites
Yakima Training Center, Yakima – 1 fire training area
Petroleum transport, storage, and refining occurs around Washington State. Several
petroleum and biodiesel facilities are located in Washington. Petroleum refineries are located
along Puget Sound: British Petroleum Phillips, Tesoro, Shell, and US Oil. These petroleum
refineries process, on average, about 24.3 million gallons daily. The crude oil and refined
product is transported by tanker, barge, railcar and pipeline. In 2013, 8.5 billion gallons of oil
were imported into Washington State by vessel, pipeline and rail, nearly 70 percent by vessel.
The volume of petroleum product stored, processed and transported is projected to increase.
(Ecology 2015). A conceptual model of the movement of oil into and out of Washington State is
shown in Figure 2. The conceptual model includes current and potential future transport should
the full build-out and expansion of proposed facilities in Puget Sound, Grays Harbor, and the
Lower Columbia River occur.
Figure 1 - Oil Movement Conceptual Model (Ecology 2015)

September 2017 DRAFT PFAS CAP – Uses Chapter for external review (10/06/17). Do not cite or quote.
11
Public safety risks exist due to the potential for fires and explosions related to spills from railcar,
tanker, pipeline, or refinery. Sixteen crude-by-rail accidents occurred in the US and Canada
between 2013 and 2015, nine involved fire (Ecology 2015). On June 3, 2016, sixteen oil
containing railcars derailed from a 96-car train, several caught on fire near Mosier Oregon.
Approximately 47,000 gallons of oil were spilled or consumed in the fire. Fire-fighting foam AR-
AFFF was used to extinguish the fire and water was used to cool tank cars (OOEM 2016).
Figure 2 - Oil train derailment, June 3, 2016, near Mosier, Oregon (OOEM 2016).
Ecology uses grant funding to stage oil spill response equipment caches around the state and provide spill training local responders how to safely and effectively deploy the equipment. The equipment has been used a number of times since the equipment was deployed, and has effectively limited the spreading and environmental damage of spills and has reduced the time and costs associated with oils spill cleanup.
Biosolids - Washington regulations (Chapter 173-308 WAC-Biosolids Management) differentiate between wastewater solids that meet the regulatory standards, classified as “biosolids”, and those solids not meeting the standards which are defined as “sewage sludge.” Washington law requires that biosolids be land applied to the greatest extent possible and sewage sludge be disposed in a landfill. Biosolids are land applied for their nutrient and soil amending properties. Land application of biosolids is conducted almost exclusively in conjunction with commercial farming operations across the state.
Currently, about 85-90 percent of biosolids generated in Washington are land applied. Biosolids are applied to less than 1 percent of the state’s farmland on an annual basis. Most fields in Washington do not have biosolids applied annually. On wheat/fallow rotations applications are made every other year at most and commonly every 4th year.
Figure 1 Oil spill response caches

September 2017 DRAFT PFAS CAP – Uses Chapter for external review (10/06/17). Do not cite or quote.
12
The chemistry of biosolids is often reflective of the chemistry of our daily lives (Hundal 2011). PFAS substances are not specifically regulated by the federal or state rules that apply to wastewater treatment residuals. The concentration of PFOS/PFOA in biosolids has been reported from a variety of sources outside of Washington State with PFOS often being the most abundant (Loganathan 2007, Sepulvado 2011, Venkatesan 2013, Zareitalabad 2013, Ulrich 2016, Arvaniti 2015).
Industrial sources of PFAS can influence concentrations of these compounds in biosolids when a wastewater treatment plant receives influent directly from industries that work with fluorotelomer compounds. Washington State does not have commercial PFAS production facilities. Industrial discharges are separated from domestic wastewater treated at the 300 + wastewater treatment plants in the state that produce biosolids for land application.
Archived samples of biosolids from the EPA National Sewage Sludge Survey in 2001 were combined into 5 composite samples and analysis showed concentrations of PFOS at 403 +/- 127 μg/kg, and PFOA at 34 +/- 22 μg/kg (Venkatesan 2013). These data represented 94 waste water treatment plants in 32 states, but did not include Washington State. No known concentration data for PFOS/PFOA in Washington biosolids is currently available. PFOS/PFOA analysis of water effluent from four waste water treatment plants in Washington did not include an analysis of biosolids for these compounds (Ecology 2010) (refer to the Environment chapter for more information).
Metal plating industry uses PFOS (an allowed use under REACH – see Regulations Chapter) as a mist suppressant, specifically in hard chrome plating. Emissions of PFOS in this industry occurs mainly in the wastewater and chromium sludge. Emissions to air are considered to be low. PFOS in wastewater depends on the installation and process. Levels range from 0.3 to 1 part per million. PFOS in chromium sludge analyses found 3.1 to 3.8 parts per million. Wastewater treatment technologies at the metal plating plants removed 88 to 99 percent of the PFOS from the waste stream. (DEPA 2013)
PFAS Reporting
Several Washington regulations require businesses to track, manage and report on the import, use and disposal of chemicals, products, and waste. Reporting occurs under the Children’s Safe Products Reporting Rule (Chapter 173-334 Washington Administrative Code (WAC)) and the Dangerous Waste Rule (Chapter 173-303 WAC).
Children’s Safe Products Reporting Rule requires manufacturers to report the use of 66 chemicals in children’s products offered for sale in Washington State. PFOS is one of the chemicals required to be reported when present in children’s products. Since 2012, manufacturers have submitted a total of 45,918 reports into the Children’s Safe Products Reporting database for all of the 66 chemicals. There are five manufacturer reports of PFOS present in 35 categories of children’s products. These reports indicated the presence of PFOS in
September 2017 DRAFT PFAS CAP – Uses Chapter for external review (10/06/17). Do not cite or quote.
13
shoes, socks, clothing, art accessories, and games at concentrations ranging from less than 100 ppm (34 reports) and 100 to 500 ppm (1 report) (Ecology 2017).
Dangerous Waste Regulation requires businesses to properly manage, store and dispose of hazardous waste. Under Washington’s regulations halogenated organic compounds that are persistent and present in a waste above 100 ppm are considered “dangerous waste” (WAC 173-303-040). Wastes that meet these definitions must be properly managed. Fire-related wastes have been reported to Ecology under the Dangerous Waste regulation. The wastes reported are summarized in Table 6.
Table 6 – Fire related dangerous wastes reported to Ecology (pounds)
Row Labels 2010 2011 2012 2013 2014 2015 2016
AFFF 2,760 14,912 1,975 2,052 3,369 12,437 89,597
Fire debris 2,902 1,592 1,688 19,039 16,864 1,112 3,430
Suppressant 4291 13,477 5,391 57,131 209,493 6,321 TOTAL 9,953 29,981 9,054 78,222 229,726 19,870 93,027
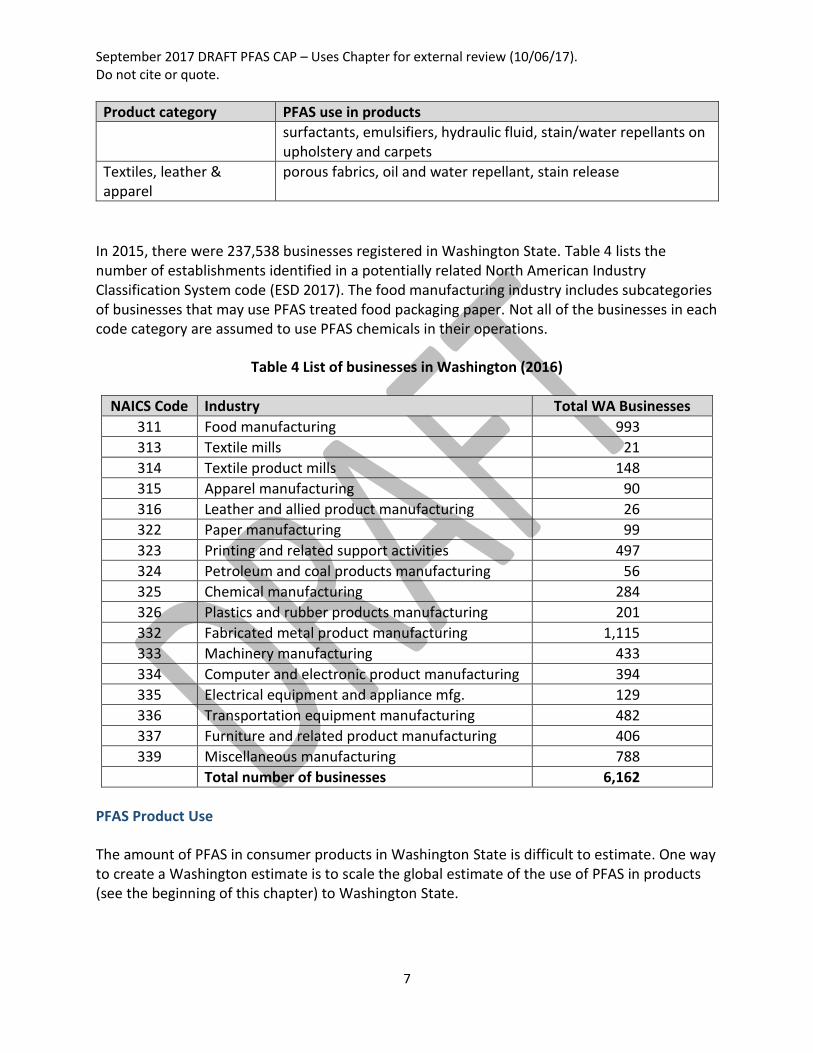
Table 7 details the companies that reported disposal of firefighting foam or suppressant in the TurboWaste database.
Table 7 – Firefighting foam or suppressant disposal reports from 2010 -2016
Reporting Entity Foam or suppressant (pounds)
BNSF Railway Company Spokane 42
Boeing North Boeing Field 89,769
Burlington Environmental LLC Kent 233,802
General Dynamics Ordnance and Tactical Systems 18
Joint Base Lewis McChord 2,173
Jorgensen Forge Corp 1,835
King County Fire Dist 28 4,587
Naval Base Kitsap at Bangor 7,244
Redmond Fire Department 650
Shell Oil Products US Seattle Terminal 59,052
Stabbert Yacht and Ship LLC 1,000
US ARMY HQ I Corps & Fort Lewis 17,910
US Army Yakima Training Center 58
US Navy Puget Sound Naval Shipyard 595
WA DOT Eagle Harbor Repair Facility 300
Western States Fire Protection 4,170

September 2017 DRAFT PFAS CAP – Uses Chapter for external review (10/06/17). Do not cite or quote.
14
Spills of oil or other hazardous substances are required to be reported to Ecology. Releases of other materials are reported on a voluntary basis and tracked in the Environmental Response Tracking System – this information is accessible by local jurisdictions. Since 2007, 29 reports of firefighting foam releases have been entered into the system (Table 8). Most of these reports were related to fires that occurred on or near water or the firefighting foam entered a waterway. The reported quantities are not verified.
Table 8 – Firefighting incidents reported to Ecology
Year Number of reported incidents Released gallons of fuel, water, AFFF
2007 1 20
2009 3 8
2010 3 4
2011 4 504
2012 2 9,025
2013 3 652
2014 2 4
2015 1 10
2016 9 311,072
TOTAL 28 321,299
PFAS Waste Estimates
Releases of PFAS can be estimated based on use and disposal of products treated with PFAS. Two Washington waste characterization studies provide estimates of annual disposal of carpet and coatings (Ecology 2010; 2016). Calculations of PFAS content in Washington’s waste carpet and coatings is based on PFOS analysis conducted in 2010 by the European Commission and a Danish waste stream analysis (EC 2011, DEPA 2013).
Carpets are a major application area for PFAS; between 50 and 90 percent of carpet were impregnated with PFOS (DEPA 2013). Carpets used in the home and office last 10 to 12 years before disposal. PFAS treatments are lost each year through vacuuming, steam cleaning, and eventual disposal. PFAS from carpet is widely dispersed in areas where carpeting is popular, like North America. Treated carpets have been reported to have a PFOS content of 88 mg/kg (DEPA 2013). A mix of treated and non-treated carpets are reported to have a PFOS content of 75 mg/kg. Continued release of PFOS occurs in the landfill after disposal.
Carpet disposal documented in two waste characterization studies indicates that about 105,000 tons of carpet are landfilled each year (Ecology 2010 and 2016). Using the 75 parts per million concentration, an estimated 788 tons of PFOS could have been annually disposed in the landfills in Washington. Based on the 12-year lifespan for carpet and the reduction in PFOS use in 2002, PFOS-treated carpet from homes or businesses should have all been disposed by 2014.

September 2017 DRAFT PFAS CAP – Uses Chapter for external review (10/06/17). Do not cite or quote.
15
Coatings is the third largest category of PFAS treated consumer products, which includes upholstery, apparel and paper packaging.
Until 2002, leather and upholstered furniture would have been treated with PFOS. Furniture has an average lifespan of 10 years before disposal. PFOS-treated leather furniture was reported to contain 80 parts per million of PFOS (DEPA 2013). For all upholstered furniture a PFOS concentration was estimated at 2.4 parts per million. The two waste sort studies indicate an average annual disposal of 78,731 tons of furniture. Using the 2.4 part per million concentration, an estimated 189 tons of PFOS could have been annually disposed in Washington landfills. Based on the 10-year lifespan for furniture, PFOS treated furnishings from homes or businesses should have all been disposed by 2012.
Textile disposal from the two waste sort studies indicate an average annual disposal of 303,697 tons of textiles. PFAS concentrations in textiles have been reported at levels of 10,683 μg/m2 fluorotelomer alcohol (FTOH) to 400 μg/m2 PFCA to 100 μg/m2 PFOS related compounds (DEPA 2013). An estimate of PFOS disposal from textiles is not possible with this information. Textiles average a 3 to 5 year lifespan, PFOS treated textiles from homes or businesses should have all been disposed by 2007.
Paper, cardboard and packaging has a very short lifespan from use to disposal. Treated food packaging is generally limited to a one-time use. Recent studies of food contact materials identified over 115 PFAS substances from EU, USA and China in the industrial blends. Food contact material testing indicated PFAS present in the food at concentrations ranging from parts per billion to parts per million (for popcorn at 0.2 – 0.7 parts per million or mg/kg). (DEPA 2013) The data from the waste sort reports are not sufficiently detailed to identify the annual volume of treated paper and packaging disposed in Washington landfills.
PFAS in Consumer Products
Summary results from five consumer product testing studies are provided in Table 9. These studies were published between 2009-2017. The studies investigated products known to be manufactured or treated with PFAS. In general, the studies found PFAS compounds in the products tested. Each study investigated a different suite of PFAS compounds. Table 9 identifies some of the high levels of PFAS reported in each category of tested products.
Table 9 – Consumer Products Study Summary
Product Category Highest Concentration PFAS Study
Firefighting foam
AFFF 776,600 μg/L FTS Herzke 2012
Older AFFF 568,000 μg/L PFOS Herzke 2012
Older AFFF 901,300 μg/L PFHpS Herzke 2012
Older AFFF 370,000 μg/L PFHxS Herzke 2012
Older AFFF 253,700 μg/L PFBS Herzke 2012

September 2017 DRAFT PFAS CAP – Uses Chapter for external review (10/06/17). Do not cite or quote.
16
Product Category Highest Concentration PFAS Study
Textiles
Apparel 772 μg/kg PFCA EPA 2009
Apparel membrane 343 μg/kg PFCA EPA 2009
Apparel membrane 1,509 μg/kg FTOH Liu 2015
Awning cloth 10.9 μg/m2 PFOA Kotthoff 2015
Outdoor textiles 41 μg/m2 PFOA Kotthoff 2015
Outdoor textiles 35.4 μg/m2 PFOS Kotthoff 2015
Gloves 76.1 μg/kg PFPA Kotthoff 2015
Textile 42,900 μg/kg FTOH Liu 2015
Shoe leather 21.1 μg/m2 PFOS Herzke 2012
Leather 241.8 μg/m2 PFBA Kotthoff 2015
Mattress pad 2,270 μg/kg PFCA EPA 2009
Medical garment 3,070 μg/kg PFCA EPA 2009
Medical garment 1,460 μg/kg FTOH Liu 2015
Office furniture leather 38 μg/m2 PFOS Herzke 2012
Cleaners
Car wheel cleaner 573 μg/kg PFCA EPA 2009
Cleaners 547,100 μg/kg 8:2 FTOH Kotthoff 2015
Cleaners 81,900 μg/kg 6:2 FTOH Kotthoff 2015
Cleaners 38,700 μg/kg 10:2 FTOH Kotthoff 2015
Carpet Products
Carpet 1.04 μg/m2 PFOS Herzke 2012
Carpet 4,010 μg/kg FTOH Liu 2015
Carpet 26.8 μg/m2 PFBS Kotthoff 2015
Carpet-care liquid 105,000 μg/kg 6:2 FTOH Liu 2015
Commercial carpet care product 47,200 μg/kg PFCA EPA 2009
Pretreated carpet 1,830 μg/kg PFCA EPA 2009
Household carpet care 8,430 μg/kg PFCA EPA 2009
Personal Care Products
Compounding agent 35,000 μg/kg PFCA Fujii 2013
Dental floss 96.7 μg/kg PFCA EPA 2009
Sunscreen 19,000 μg/kg PFCA Fujii 2013
Talc 2,500 μg/kg PFCA Fujii 2013
Foundation cosmetic 5,900 μg/kg PFCA Fujii 2013
Food contact paper
Food contact paper 12,200 μg/kg PFCA EPA 2009
Food contact paper 4,640 μg/kg PFOA EPA 2009
Food contact paper 25,200 μg/kg FTOH Liu 2015
Food contact paper (2010) 658.1 μg/kg PFOA Kotthoff 2015
Food contact paper (2010) 489.4 μg/kg PFDA Kotthoff 2015
Food contact paper (2010) 182.8 μg/kg PFHxA Kotthoff 2015
Sealants

September 2017 DRAFT PFAS CAP – Uses Chapter for external review (10/06/17). Do not cite or quote.
17
Product Category Highest Concentration PFAS Study
Nanospray/impregnation 28.9 μg/kg PFOA Kotthoff 2015
Nanospray/impregnation 719,300 μg/kg 8:2 FTOH Kotthoff 2015
Nanospray/impregnation 440,000 μg/kg 6:2 FTOH Kotthoff 2015
Nanospray/impregnation 369,000 μg/kg 10:2 FTOH Kotthoff 2015
Nanospray/impregnation 329,000 μg/kg 4:2 FTOH Kotthoff 2015
Waterproofing agent 330,800 μg/L FTOH Herzke 2012
Waterproofing agent 208 μg/L PFOA Herzke 2012
Floor wax/stone sealant 423,000 μg/kg FTOH Liu 2015
Stone sealant 12,300 μg/kg PFCA EPA 2009
Stone sealant 3,720 μg/kg PFOA EPA 2009
Seal tape 3,540 μg/kg PFCA EPA 2009
Seal tape 3,490 μg/kg PFOA EPA 2009
Thread sealant tape/paste 1,220 μg/kg FTOH Liu 2015
Other/Miscellaneous
Paint 5.8 μg/kg PFOS Herzke 2012
Printed circuit boards 0.40 μg/kg PFOS Herzke 2012
Nonstick cookware 1.09 μg/m2 PFCA EPA 2009
Nonstick cookware 415 μg/kg PFOS Herzke 2012
Ski wax 2,033 μg/kg PFOA Kotthoff 2015
Ski wax 1,840 μg/kg PFHxA Kotthoff 2015
Ski wax 1,737 μg/kg PFDoDA Kotthoff 2015
EPA 2009 - In 2009, the EPA tested 116 articles of commerce for perfluoropentanoic acid (PFPeA), perfluorohexanoic acid (PFHxA), perfluoroheptanoic acid (PFHpA), PFOA, PFNA, perfluorodecanoic acid (PFDA), perfluoroundecanoic acid (PFUnDA), and perfluorododecanoic acid (PFDoDA). The study investigated products that may contribute to indoor source of PFCA in house dust. The products were purchased from retail outlets, in stores and online, in the US from 2007 to 2008. (EPA 2009)
Herzke 2012 - A study of 30 consumer products from Norway and Sweden were analyzed for 24 PFAS compounds including: PFCA, perfluorooctane sulfonic acid (PFSA), 6:2 fluorotelomer sulfonate (6:2 FTS), Perfluorooctanesulfonamide (PFOSA) and FTOH (Herzke et al., 2012).
Fujii 2013 – Twenty-eight personal care products and compounding agents collected between 2007 and 2012 primarily from Japan and a few from France, Korea, and the United States were analyzed for PFHxA, PFHpA, PFOA, PFNA, PFDA, PFUnDA, PFDoDA, perfluorotridecanoic acid (PFTrDA), and perfluorotetradecanoic acid (PFTeDA) (Fujii et al, 2013).
Liu 2015 – Between 2011 and 2013, the EPA analyzed 54 consumer products for 6:2 FTOH, 8:2 FTOH, and 10:2 FTOH, which are the precursors to PFCA (Liu et al., 2015).

September 2017 DRAFT PFAS CAP – Uses Chapter for external review (10/06/17). Do not cite or quote.
18
Kotthoff 2015 - A total of 82 samples were analyzed for PFAA compounds and 59 samples were analyzed for FTOH (Kotthoff et al, 2015). The PFAA compounds consisted of 11 PFCA and 5 PFSA.
Schaider 2017 – A sixth study of 407 food packaging items from fast food restaurants across the United States were screened for fluorinated chemicals using particle-induced gamma ray emission spectroscopy (Schaider et al. 2017). Particle-induced gamma ray emission screens for total fluorine in the sample and does not differentiate between organic and inorganic fluorine. Samples were collected from 2014 to 2015 and from 6 product categories: food contact paper like wrappers and bags (248), food contact paperboards (80), paper cups (30), other beverage containers (25), non-contact paper like the outer bags (15), and miscellaneous samples like lids and food containers (9). These screening results are not included in Table 9.

September 2017 DRAFT PFAS CAP – Uses Chapter for external review (10/06/17). Do not cite or quote.
19
REFERENCES
Venkatesan, A and R Halden. 2013. National inventory of perfluoroalkyl substances in archived U.S. biosolids from the 2001 EPA National Sewage Sludge Survey, Journal of Hazardous Materials. May 2013, 413-418;
Agency for Toxic Substances and Disease Registry (ATSDR) 2015. Toxicological Profile for Perfluoroalkyls. Production, Import, Use, and Disposal. August 2015. Available from https://www.atsdr.cdc.gov/toxprofiles/TP.asp?id=1117&tid=237#bookmark09
Buck, R.C., Franklin J, Berger U, Conder JM, Cousins IT, de Voogt P, Jensen AA, Kannan K, Mabury SA, van Leeuwen SP. Perfluoroalkyl and polyfluoroalkyl substances in the environment: terminology, classification, and origins. Integrated Environmental Assessment and Management, 2011. 7(4): p. 513-41.
Concawe. Environmental fate and effects of poly and perfluoroalkyl substances (PFAS). Report 8/16. Prepared by ARCADIS for the Concawe Soil and Groundwater Taskforce. June 2016. Available at https://www.concawe.eu/publication/environmental-fate-and-effects-of-poly-and-perfluoroalkyl-substances-pfas-report-no-816/
Danish Environmental Protection Agency (DEPA). 2013. Survey of PFOS, PFOA and other perfluoroalkyl and polyfluoroalkyl substances. Part of the LOUS-review. Environmental Project No. 1475, 2013. The Danish Environmental Protection Agency
Department of Defense (DOD). 2014. DoD inventory of Fire/Crash Training Area Sites as of the end of FY 2014. Available at https://www.documentcloud.org/documents/2755131-List-of-military-fire-and-crash-training-sites.html
Employment Security Department (ESD) Washington State. 2017. Establishment size data for 2016 Quarter 1. Accessed at: https://esd.wa.gov/labormarketinfo/establishment-size
Ecology 2015. Washington State 2014 Marine and Rail Oil Transportation Study. Pub 15-08-010. March 1, 2015. Available from https://fortress.wa.gov/ecy/publications/documents/1508010.pdf
Ecology 2017. Children’s Safe Products Reporting Database. Accessed 8/1/2017: searched for PFOS reports. https://fortress.wa.gov/ecy/cspareporting/Default.aspx
Ecology, 2010. Perfluorinated Compounds in Washington Rivers and Lakes, Ecology Publication 10-03-034, August 2010;
Ecology. 2010. 2009 Washington Statewide Waste Characterization Study. June 25, 2010. Pub 10-07-023

September 2017 DRAFT PFAS CAP – Uses Chapter for external review (10/06/17). Do not cite or quote.
20
Ecology. 2016. 2015-2016 Washington Statewide Waste Characterization Study. October 31, 2016. Pub 16-07-032
US Environmental Protection Agency (EPA) 2002a. Federal Register, 40 CFR Part 721 - Perfluoroalkyl Sulfonates; Significant New Use Rule; Final Rule and Supplemental Proposed Rule. March 11, 2002. https://www.gpo.gov/fdsys/pkg/FR-2002-03-11/pdf/02-5746.pdf
EPA 2002b, Federal Register, 40 CFR Part 721 - Perfluoroalkyl Sulfonates; Significant New Use Rule, Final Rule. December 9, 2002 https://www.gpo.gov/fdsys/pkg/FR-2002-12-09/pdf/02-31011.pdf
EPA 2007, Federal Register, 40 CFR Part 721 - Perfluoroalkyl Sulfonates; Significant New Use Rule, Final Rule. October 9, 2007. https://www.gpo.gov/fdsys/pkg/FR-2007-10-09/pdf/E7-19828.pdf
EPA. 2009. Perfluorocarboxylic acid content in 116 articles of commerce. Washington, DC, EPA/600/R09/033, 2009.
EPA. 2014. Assessing and managing chemicals under TSCA. Fact Sheet: 2010/2015 PFOA Stewardship Program. 2014 Annual Progress. Available at: https://www.epa.gov/assessing-and-managing-chemicals-under-tsca/20102015-pfoa-stewardship-program-2014-annual-progress
EPA 2015a. Federal Register, 40 CFR Part 721 - Long-Chain Perfluoroalkyl Carboxylate and Perfluoroalkyl Sulfonate Chemical Substances; Significant New Use Rule, January 21, 2015. https://www.federalregister.gov/documents/2015/01/21/2015-00636/long-chain-perfluoroalkyl-carboxylate-and-perfluoroalkyl-sulfonate-chemical-substances-significant
EPA 2015b. Perfluorooctanoic acid (PFOA) and fluorinated telomers: Frequent questions. 2015 [cited 2015 March 9]; Available from: http://www.epa.gov/oppt/pfoa/pubs/faq.html.
EPA 2016a. Assessing and managing chemicals under TSCA. Fact Sheet: 2010/2015 PFOA Stewardship Program. Accessed July 28. https://www.epa.gov/assessing-and-managingchemicals-under-tsca/fact-sheet-20102015-pfoa-stewardship-program
EPA 2016b. Drinking Water Health Advisory for Perfluorooctanoic Acid (PFOA). 2016, Environmental Protection Agency: Washington, D.C. p. 103. EPA 822-R-16-005. May.
EPA 2016c. Drinking Water Health Advisory for Perfluorooctane Sulfonate (PFOS). Office of Water. EPA 822-R-16-004. May.
EPA 2017. 2016 Chemical Data Reporting Results. Accessed July 28, 2017. https://www.epa.gov/chemical-data-reporting

September 2017 DRAFT PFAS CAP – Uses Chapter for external review (10/06/17). Do not cite or quote.
21
European Commission (EC). 2010. Regulation (EU) No 757/2010 of 24 August 2010, amending Regulation (EC) No 850/2004 of the European Parliament and of the Council on persistent organic pollutants as regards Annexes I and III. Official Journal of the European Union:25.08.2010
European Commission (EC) 2011. Expert Team to Support Waste Implementation. Final Report Study on waste related issues of newly listed POPs and candidate POPs. No ENV.G.4/FRA/2007/0066. Located at http://ec.europa.eu/environment/waste/studies/pdf/POP_Waste_2010.pdf
Federal Aviation Administration (FAA). 2017. Aircraft Rescue and Fire Fighting Airports. Available at https://www.faa.gov/airports/airport_safety/aircraft_rescue_fire_fighting/
FluoroCouncil, 2017a. PFAS in Carpet and Furniture Applications DTSC Workshop. 2017: Sacramento, California.
Fujii, Y; Harada, K; and Koizumi, A, 2013. Occurrence of perfluorinated carboxylic acids ( PFCA) in personal care products and compounding agents. Chemosphere 93: 538-544.
Grand View Research. 2016. Fluorochemicals Market Analysis by Product (Fluorocarbons, Fluoropolymers, Inorganics & Specialties) By Application (Refrigeration, Aluminum Production, Blowing Agents, Components) And Segment Forecasts To 2024. January 2016. Report summary accessed at http://www.grandviewresearch.com/industry-analysis/fluorochemical-market
Herzke, D; Olsson, E; and Posner, S, 2012. Perfluoroalkyl and polyfluoroalkyl substances (PFAS) in consumer products in Norway – A pilot study. Chemosphere 88: 980-987.
Hundal, LS, K. Kuman, N. Basta and AE Cox. 2011 Evaluating Exposure Risk to Trace Organic Chemicals in Biosolids, BioCycle, August, 2011;
Kotthoff, M; Müller, J; Jürling, H; Schlummer, M; and Fiedler, D. 2015. Perfluoroalkyl and polyfluoroalkyl substances in consumer products. Environmental Science and Pollution Reserach. 22: 14,546-14,559.
Lindstrom, A.B., M.J. Strynar, and E.L. Libelo, Polyfluorinated compounds: Past, present, and future. Environmental Science Technology, 2011. 45(19): p. 7954-7961.
Liu, X; Guo, Z; Folk IV, E; and Roache, N, 2015. Determination of fluorotelomer alcohols in selected consumer products and preliminary investigation of their fate in the indoor environment. Chemosphere 129: 81-86.
Loganathan B, K. S. Sajwan, E. Sinclair, K. S. Kumar, K. Kannan. 2007. Perfluoroalkyl sulfonates and perfluorocarboxylates in two wastewater treatment facilities in Kentucky and Georgia, Water Research, Vol. 41, Issue 20, December 2007;

September 2017 DRAFT PFAS CAP – Uses Chapter for external review (10/06/17). Do not cite or quote.
22
Minnesota Department of Health (MDH), 2012. Public health assessment final release perfluorochemical contamination in Southern Washington County, Northern Dakota County, and Southeastern Ramsey County, Minnesota. 2012.
Arvaniti. O and A. Stasinakis. 2015. Review of the occurrence, fate and removal of perfluorinated compounds during wastewater treatment, Science of the Total Environment, 2015, 81-92;
Organisation for Economic Co-operation and Development (OECD). 2011. PFCs: Outcome of the 2009 survey. Survey on the production, use and release of PFOS, PFAS, PFOA PFCA, their related substances and products/mixtures containing these sub-stances. OECD Environment, Health and Safety Publications, Series on Risk Management, No. 24.
Oregon Office of Emergency Management (OOEM). 2016. 2016 Mosier Rail Incident State Agency Response After-Action Report. November 10, 2016 http://www.oregon.gov/oem/Documents/MosierRail_StateAgency_AAR.pdf
Paul, A.G., Jones, K.C. and Sweetman A.J. 2009. A first global production, emission, and environmental inventory for perfluorooctane sulfonate. Environmental Science and Technology. Jan 15;43(2):386-92.
Schaider, L; Balan, S; Blum, A; Andrews, D; Strynar, M; Dickinson, M; Lunderberg, D; Lang, J; and Peaslee, G, 2017. Fluorinated Compounds in U.S. Fast Food Packaging. Environ. Sci. Technol. Lett. 4: 105111.
Sepulvado, JG, AC Blaine, LS Hundal, and CP Higgins. 2011. Occurrence and Fate of Perfluorochemicals in Soil Following the Land Application of Municipal biosolids, Environmental Science & Technology 2011, Vol. 45, 8106-8112;
Ulrich, H, KP Freier, and M Gierig. 2016. Getting on with persistent pollutants: Decreasing trends of perfluoroalkyl acids (PFAAs) in sewage sludge, Chemosphere 161, 2016, 527-535;
Washington State Department of Transportation (WSDOT). 2017. All Washington State Airports – online map. Available http://www.wsdot.wa.gov/aviation/AllStateAirports/
Zareitalabad, P, J Siemens, M Hamer, and W Amelung. 2013. Perfuorooctanoic acid (PFOA) and perfluorooctanesulfonic acid (PFOS) in surface waters, sediments, soils, and wastewater—A review on concentrations and coefficients, Chemosphere 91, 2013, 725-732;