Separation Report -- Reversed Phase Chromatography Column ...... · structure. In general, reversed...
25
Separation Report No. 111 Reversed Phase Chromatography Column for Biomolecule Separation TSKgel Protein C4-300 1. Introduction 1 2. Features 1 3. Basic Properties 4 3-1. List of Properties 4 3-2. Standard Separation Conditions 4 3-3. Separation Behavior of Proteins 5 3-4. Separation Behavior of Peptides 6 3-5. Effect of Gradient Time 7 3-6. Effect of Flow Rate 8 3-7. Changes in Selectivity due to Separation Conditions 10 3-8. Effect of Ion-paired Reagents 12 3-9. Effect of Temperature 13 3-10. Effect of Sample Load 15 3-11. Quantification 15 3-12. Comparison with Other TSKgel RPC Columns 17 3-13. Comparison of Commercially Available RPC Columns for Protein Analysis 19 4. Applications 20 4-1. High-Throughput Analysis 20 4-2. Peptide Mapping 21 4-3. PEGylated Proteins 22 4-4. Monoclonal Antibodies (IgG) 23 5. Conclusion 24 Table of Contents Page
Transcript of Separation Report -- Reversed Phase Chromatography Column ...... · structure. In general, reversed...

Separation Report No. 111
Reversed Phase Chromatography Column for Biomolecule Separation TSKgel Protein C4-300
1. Introduction 1
2. Features 1
3. Basic Properties 4 3-1. List of Properties 4 3-2. Standard Separation Conditions 4 3-3. Separation Behavior of Proteins 5 3-4. Separation Behavior of Peptides 6 3-5. Effect of Gradient Time 7 3-6. Effect of Flow Rate 8 3-7. Changes in Selectivity due to Separation Conditions 10 3-8. Effect of Ion-paired Reagents 12 3-9. Effect of Temperature 13 3-10. Effect of Sample Load 15 3-11. Quantification 15 3-12. Comparison with Other TSKgel RPC Columns 17 3-13. Comparison of Commercially Available RPC Columns for Protein Analysis 19
4. Applications 20 4-1. High-Throughput Analysis 20 4-2. Peptide Mapping 21 4-3. PEGylated Proteins 22 4-4. Monoclonal Antibodies (IgG) 23
5. Conclusion 24
Table of Contents Page
1. IntroductionRecently, with the robust development of
biopharmaceuticals in which proteins and peptides, etc., are
used, there is an increasing need for analytical techniques
capable of uncovering the characteristics of these products.
Separation methods frequently used in liquid chromatography
for proteins and peptides include size-exclusion
chromatography (SEC), ion exchange chromatography (IEC),
hydrophobic interaction chromatography (HIC), as well as
reversed phase chromatography (RPC).
In this report, we introduce the TSKgel Protein C4-300, an
RPC column developed for the purpose of high-speed/high-
resolution analysis of proteins, and describe its basic
characteristics, the effects of separation conditions on
separation, comparisons with other RPC columns, and
application examples.
2. Features1 ) Pore size of 30 nm suitable for
separation of proteinsThe pore size that would be suitable for separation differs
depending on what is being analyzed. If the pore size is
smaller than the size of the molecule you want to analyze, the
molecules will not diffuse through the pores, and inadequate
resolution will therefore be obtained. Conversely, if the pore
size is too large, the relative surface area of the packing
material decreases, in other words, the volume of the
stationary phase involved in separation decreases, and
separation will be poor. As a result, good resolution requires
selection of a pore size appropriate to the size of the
molecules.
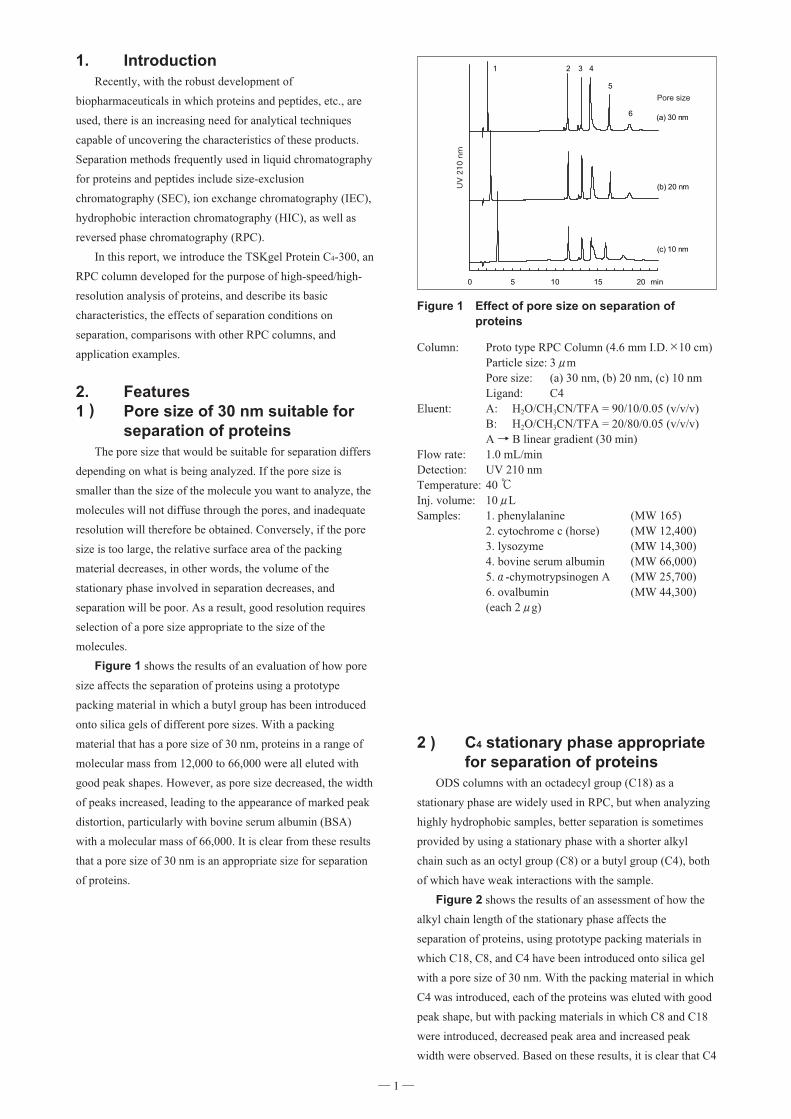
Figure 1 shows the results of an evaluation of how pore
size affects the separation of proteins using a prototype
packing material in which a butyl group has been introduced
onto silica gels of different pore sizes. With a packing
material that has a pore size of 30 nm, proteins in a range of
molecular mass from 12,000 to 66,000 were all eluted with
good peak shapes. However, as pore size decreased, the width
of peaks increased, leading to the appearance of marked peak
distortion, particularly with bovine serum albumin (BSA)
with a molecular mass of 66,000. It is clear from these results
that a pore size of 30 nm is an appropriate size for separation
of proteins.
2 ) C4 stationary phase appropriatefor separation of proteins
ODS columns with an octadecyl group (C18) as a
stationary phase are widely used in RPC, but when analyzing
highly hydrophobic samples, better separation is sometimes
provided by using a stationary phase with a shorter alkyl
chain such as an octyl group (C8) or a butyl group (C4), both
of which have weak interactions with the sample.
Figure 2 shows the results of an assessment of how the
alkyl chain length of the stationary phase affects the
separation of proteins, using prototype packing materials in
which C18, C8, and C4 have been introduced onto silica gel
with a pore size of 30 nm. With the packing material in which
C4 was introduced, each of the proteins was eluted with good
peak shape, but with packing materials in which C8 and C18
were introduced, decreased peak area and increased peak
width were observed. Based on these results, it is clear that C4
― 1―
Figure 1 Effect of pore size on separation ofproteins
Column: Proto type RPC Column (4.6 mm I.D.×10 cm)Particle size: 3μmPore size: (a) 30 nm, (b) 20 nm, (c) 10 nmLigand: C4
Eluent: A: H2O/CH3CN/TFA = 90/10/0.05 (v/v/v)B: H2O/CH3CN/TFA = 20/80/0.05 (v/v/v)A → B linear gradient (30 min)
Flow rate: 1.0 mL/minDetection: UV 210 nmTemperature: 40 ℃Inj. volume: 10μLSamples: 1. phenylalanine (MW 165)
2. cytochrome c (horse) (MW 12,400)3. lysozyme (MW 14,300)4. bovine serum albumin (MW 66,000)5.α-chymotrypsinogen A (MW 25,700)6. ovalbumin (MW 44,300)(each 2μg)

is a stationary phase that is suitable for analyzing proteins
with high recovery, with low levels of protein adsorption.
Figure 3 shows the results of an evaluation of how
protein separation is affected by the quantity of butyl groups
introduced onto the silica gel. With the prototype packing
materials (c) and (d) that have a carbon content of 3.8 % or
more after the introduction of butyl groups and end capping,
tailing of the BSA peak (Peak 3) increased, and the peak area
decreased.
In addition, with the prototype packing material (a), which
has a carbon content of 2.3 %, although BSA peak shape was
good, the durability in acidic eluents has been inadequate.
Based on the results of these investigations, the quantity of
butyl groups introduced in the TSKgel Protein C4-300 has
been adjusted to attain a carbon content of 3 %, allowing good
resolution and recovery to be combined with excellent column
durability.
― 2―
Figure 2 Effect of alkyl chain length on stationaryphase on separation of proteins
Column: Proto type RPC Column (4.6 mm I.D.× 10 cm)Particle size: 3μmPore size: 30 nmLigand: (a) C4, (b) C8, (c) C18
Eluent: A: H2O/CH3CN/TFA = 90/10/0.05 (v/v/v)B: H2O/CH3CN/TFA = 20/80/0.05 (v/v/v)A →B linear gradient (30 min)
Flow rate: 1.0 mL/minDetection: UV 210 nmTemperature: 40 ℃Inj. volume: 10μLSamples: 1. phenylalanine (MW 165)
2. cytochrome c (horse) (MW 12,400)3. lysozyme (MW 14,300)4. bovine serum albumin (MW 66,000)5.α-chymotrypsinogen A (MW 25,700)6. ovalbumin (MW 44,300)(each 2μg)
Figure 3 Effect of carbon content on separation ofproteins
Column: Proto type RPC Column (4.6 mm I.D.×10 cm)Particle size: 3μmPore size: 30 nmLigand: C4Carbon content:(a) 2.3 %, (b) 3.3 %, (c) 3.8 %, (d) 4.5 %
Eluent: A: H2O/CH3CN/TFA = 90/10/0.05 (v/v/v)B: H2O/CH3CN/TFA = 20/80/0.05 (v/v/v)A →B linear gradient (30 min)
Flow rate: 1.0 mL/minDetection: UV 210 nmTemperature: 40℃Inj. volume: 10μLSamples: 1. cytochrome c (horse) (MW 12,400)
2. lysozyme (MW 14,300)3. bovine serum albumin (MW 66,000)4.α-chymotrypsinogen A (MW 25,700)5. ovalbumin (MW 44,300)(each 2μg)

3 ) Excellent durability in acidiceluents containing TFA
Excellent durability is realized with the TSKgel Protein
C4-300, by introducing butyl groups in a polymeric form that
is not prone to hydrolysis, and by performing highly efficient
end capping on the residual silanol.
Column durability was evaluated in acidic eluents
containing trifluoroacetic acid (TFA), which is commonly
used in protein analysis by RPC. An eluent containing TFA at
a higher than normal concentration (0.2 %) was run through
the TSKgel Protein C4-300 (4.6 mm I.D.×15 cm) for 1,000 h
at a flow rate of 1.0 mL/min, and the naphthalene retention
time and theoretical plates for phenol were tracked, the results
of which are shown in Figures 4 and 5. Naphthalene
retention time decreased gradually as cycles increased, but
even after 1,000 h, retention time was maintained at 90 % or
more of initial one. In addition, no change in the theoretical
plates for phenol was observed before and after cycling. The
TSKgel Protein C4-300, with its excellent stationary phase
chemical stability and the physical stability of the packing
layer, thus allows highly reproducible analysis even with
long-term use.
― 3―
Figure 4 Change of retention time of naphthalenein acidic eluent
Column: TSKgel Protein C4-300 (4.6 mm I.D.×15 cm)Eluent: H2O/CH3CN/TFA = 70/30/0.2 (v/v/v)Flow rate: 1.0 mL/minDetection: UV 254 nmTemperature: 40 ℃Inj. volume: 10μLSample: naphthalene
Figure 5 Change of theoretical plates of phenol inacidic eluent
Column: TSKgel Protein C4-300 (4.6 mm I.D.×15 cm)Eluent: H2O/CH3CN/TFA = 70/30/0.2 (v/v/v)Flow rate: 1.0 mL/minDetection: UV 254 nmTemperature: 40℃Inj. volume: 10 μLSample: phenol

3. Basic Properties3-1 List of Properties
The specifications of the TSKgel Protein C4-300 are
shown in Tables 1 and 2. The 4.6 mm I.D. column is
appropriate for conventional analysis, and the 2.0 mm I.D.
column for microanalysis and LC/MS (/MS). The TSKgel
guardgel Protein C4, a cartridge type of guard column, can be
used with both the 4.6 mm I.D. and 2.0 mm I.D. columns to
protect the analytical columns from strongly adsorbent
contaminants (requires a separately available cartridge
holder).
3-2 Standard Separation ConditionsTable 3 shows the standard separation conditions when
analyzing proteins and peptides using the TSKgel Protein C4-
300. When constructing a method of analysis, after
confirming the elution pattern of a sample under standard
separation conditions, we recommend investigating separation
conditions while consulting the descriptions in Sections 3-3
through 3-11 below.
― 4―
Table 1 Properties of TSKgel Protein C4-300packings
Table 2 Product line of TSKgel Protein C4-300Column
Table 3 Standard separation conditions

3-3 Separation Behavior of ProteinsFigure 6 shows a chromatogram of standard proteins.
Generally, it can be seen that retention tends to become strong
as the molecular mass of the sample increases. However, for
example, although lactoferrin has a large molecular mass of
approximately 90,000, it is eluted earlier than α-
chymotrypsinogen A and carbonic anhydrase, which have
smaller molecular mass. Lactoferrin presumably has a weaker
hydrophobic interaction with the C4 stationary phase than
other proteins, due to factors such as its amino acid
composition, posttranslational modification, and higher-order
structure.
In general, reversed phase chromatography (RPC) is
characterized by higher resolution when separating proteins
than other modes of separation that involve different
mechanisms, such as size-exclusion chromatography (SEC),
ion exchange chromatography (IEC), and hydrophobic
interaction chromatography (HIC).
On the other hand, because ion-paired reagents and
organic solvents used as eluents in RPC have a strong
denaturing effect on proteins, RPC is not appropriate when
proteins are fractionated for the purpose of analyzing their
structure and function.
― 5―
Figure 6 Chromatograms of standard proteins
Column: TSKgel Protein C4-300 (4.6 mm I.D.×15 cm)Eluent: A: H2O/CH3CN/TFA = 90/10/0.05 (v/v/v)
B: H2O/CH3CN/TFA = 20/80/0.05 (v/v/v)A →B linear gradient (45 min)
Flow rate: 1.0 mL/minDetection: UV 215 nmTemperature: 40 ℃Inj. volume: 10μLSamples: 1. cytochrome c (horse) (MW 12,400)
2. cytochrome c (bovine) (MW 12,300)3. lysozyme (MW 14,300)4. lactoferrin(human) (MW 90,000)5.α-chymotrypsinogen A (MW 25,700)6. carbonic anhydrase (MW 29,000)(each 1 μg)

3-4 Separation Behavior of PeptidesFigure 7 shows a chromatogram of standard peptides. As
with proteins, there are peptides that show weak retention
despite large molecular mass, and peptides that have strong
retention despite small molecular mass, which suggests that
differences in hydrophobic interaction are occurring due to
the amino acid composition.
With regard to the separation of peptides by RPC, for a
long time attempts have been made to calculate
hydrophobicity based on the amino acid sequence, and predict
separation behavior using an ODS column. Figure 8 shows
the relationship between the hydrophobicity of peptides
calculated using the hydrophobicity retention coefficient1)
reported by Sasagawa et al., for 39 types of peptide samples,
and retention times as measured with the TSKgel Protein C4-
300 (4.6 mm I.D.×5 cm). Correlations between the estimated
hydrophobicity of the peptides and retention times with the
TSKgel Protein C4-300 were observed, and it was confirmed
that stronger retention occurred with higher hydrophobicity of
the peptide. Secondary retention mechanisms (such as the
interaction with residual silanol groups) in the TSKgel Protein
C4-300 and ODS columns are believed to differ, so it is
believed that separation behavior can be estimated with even
more accuracy by optimizing the amino acid retention
coefficient and approximation formula for the TSKgel Protein
C4-300.
― 6―
Column: TSKgel Protein C4-300 (4.6 mm I.D.×5 cm)Eluent: A: H2O/CH3CN/TFA = 90/10/0.05 (v/v/v)
B: H2O/CH3CN/TFA = 20/80/0.05 (v/v/v)0 % B →75 % B linear gradient (11.25 min)
Flow rate: 1.0 mL/minDetection: UV 215 nmTemperature: 40 ℃Inj. volume: 10μL
Figure 7 Chromatogram of standard peptides
Column: TSKgel Protein C4-300 (4.6 mm I.D.×15 cm)Eluent: A: H2O/CH3CN/TFA = 90/10/0.05 (v/v/v)
B: H2O/CH3CN/TFA = 20/80/0.05 (v/v/v)A → B linear gradient (45 min)
Flow rate: 1.0 mL/minDetection: UV 215 nmTemperature: 40 ℃Inj. volume: 10μL
Samples: 1.δ-sleep-inducing peptide (MW 849)2. methionine-enkephalin (MW 574)3. bradykinin (MW 1,060)4. eledoisin related peptide (MW 707)5. angiotensin I (MW 1,297)6. substance P (MW 1,348)7. somatostatin (MW 1,638)8.β-endorphin (MW 3,465)9. insulin (MW 5,808)
10. gastrin I (MW 2,098(each 0.25μg)
Figure 8 Plot of hydrophobicity and retention timeof peptides predicted by amino acidsequence

3-5 Effect of Gradient TimeFigure 9 shows how resolution is affected when the
gradient time is changed under constant flow rate conditions.
As gradient time increased, although there was an
improvement in resolution between proteins with close
retention times (between cytochrome c (bovine) and
cytochrome c (equine); and between α-chymotrypsinogen A
and carbonic anhydrase), the separation-improving effect
gradually decreased. Comparing the effect of gradient time in
columns of different lengths (4.6 mm I.D.×15 cm, 4.6 mm
I.D. ×5 cm) showed that although higher resolution was
obtained with the 4.6 mm I.D.×15 cm column when analysis
was conducted with a long gradient time, this differences in
resolution due to column length decreased when the gradient
time was short. Based on these results, when the objective is
high resolution, it is advisable to use the long column with a
long gradient time; and when the objective is high-throughput
analysis, using the short column with a short gradient time
would be preferable.
Peak capacity calculated using peptide samples
(PC: maximum number of peaks that can be separated
when resolution Rs = 1)2) yielded results similar to those with
proteins (Fig. 10).
― 7―
Figure 9 Effect of gradient time on separation ofproteins
Column: TSKgel Protein C4-300 (4.6 mm I.D.×15 cm),TSKgel Protein C4-300 (4.6 mm I.D.×5 cm)
Eluent: A: H2O/CH3CN/TFA = 90/10/0.05 (v/v/v)B: H2O/CH3CN/TFA = 20/80/0.05 (v/v/v)A →B linear gradient (5~120 min)
Flow rate: 1.0 mL/minDetection: UV 215 nmTemperature: 40 ℃Inj. volume: 10μLSamples: (a) cytochrome c (horse),
cytochrome c (bovine)(b)α-chymotrypsinogen A ,
carbonic anhydrase(each 1 μg)
Figure 10 Effect of gradient time on separation ofpeptides
Column: TSKgel Protein C4-300 (4.6 mm I.D.×15 cm)Eluent: A: H2O/CH3CN/TFA = 90/10/0.05 (v/v/v)
B: H2O/CH3CN/TFA = 20/80/0.05 (v/v/v)A →B linear gradient (15~120 min)
Flow rate: 1.0 mL/minDetection: UV 215 nmTemperature: 40 ℃Inj. volume: 10μLSamples: δ-sleep-inducing peptide, methionine-
enkephalin,bradykinin, eledoisin related paptide,angiotensin I, substance P,somatostatin, β-endorphin, insulin,gastrin I (each 0.25μg)
Calculation formula of peak capacity (Pc)
tG: gradient timew0.5: average of peak half width of
10 peptides measured
Pc=1+tG
1.7・w0.5

3-6 Effect of Flow RateFigure 11 shows how resolution is affected when the
flow rate is changed under constant gradient time conditions.
The resolution between proteins with close retention times
(between cytochrome c (bovine) and cytochrome c (equine);
and between α-chymotrypsinogen and carbonic anhydrase)
improved as flow rate increased, but the flow rate effect
diminished at flow rates of 1.0 mL/min or more (linear
velocity of 6 cm/min or more), and virtually the same
resolution was produced. Peak capacity calculated using
peptide samples yielded results similar to those with proteins
(Fig. 12). Based on these results, a flow rate of about 1.0
― 8―
Figure 11 Effect of flow rate on resolution ofproteins
Column: TSKgel Protein C4-300 (4.6 mm I.D.×15 cm),TSKgel Protein C4-300 (4.6 mm I.D.×5 cm)
Eluent: A: H2O/CH3CN/TFA = 90/10/0.05 (v/v/v)B: H2O/CH3CN/TFA = 20/80/0.05 (v/v/v)A → B linear gradient45 min (4.6 mm I.D.×15 cm),15 min (4.6 mm I.D. # 5 cm)
Flow rate: 0.25~2.0 mL/minDetection: UV 215 nmTemperature: 40 ℃Inj. volume: 10μLSamples: (a) cytochrome c (horse),
cytochrome c (bovine) (b)α-chymotrypsinogen A ,
carbonic anhydrase(each 1 μg)
Figure 12 Effect of flow rate on separation ofpeptides
Column: TSKgel Protein C4-300 (4.6 mm I.D.×15 cm)Eluent: A: H2O/CH3CN/TFA = 90/10/0.05 (v/v/v)
B: H2O/CH3CN/TFA = 20/80/0.05 (v/v/v)A →B linear gradient (45 min)
Flow rate: 0.25 ~2.0 mL/minDetection: UV 215 nmTemperature: 40℃Inj. volume: 10μLSamples: δ-sleep-inducing peptide, methionine-
enkephalin,bradykinin, eledoisin related paptide, angiotensin I, substance P,somatostatin, β-endorphin, insulin, gastrin I(each 0.25 μg)
Calculation formula of peak capacity is the same as in Fig. 10

mL/min would be appropriate with the 4.6 mm I.D. column,
and about 0.2 mL/min with the 2.0 mm I.D. column. When
gradient analysis is conducted at a low flow rate, depending
on the system used, there is a risk that separation performance
and reproducibility can decrease as a result of diffusion
outside the flow pathway of the column (injector, tubing,
detector), or insufficient gradient precision. Under these
circumstances, separation may be improved by increasing the
flow rate within a range that does not exceed the maximum
pressure of the column when used during analysis.
― 9―

3-7 Changes in Selectivity due toSeparation Conditions
In general, in reversed phase chromatography under
isocratic conditions, there is an almost linear relationship
between the concentration of organic solvent of the eluent Φ
and the retention log k' of the sample (k': retention
coefficient), and the value of this slope S (isocratic parameter)
is known to differ depending on the sample. As a result, when
samples of different S values are analyzed under isocratic
conditions, varying the concentration of the organic solvent of
the eluent will change the separation factor α=k'2/k'1.
Similarly, when performing gradient analysis, by changing
factors that affect the gradient slope of the organic solvent
concentration (gradient time, flow rate, column length),
separation selectivity changes and the peak elution pattern is
altered. Figure 13 shows changes to a chromatogram of
standard peptides under varying gradient times (a) and flow
rates (b).
For the sake of convenience, the scales of the horizontal
axes were adjusted so that the elution positions of bradykinin
(Peak 2), somatostatin (Peak 6) and gastrin I (Peak 9), would
line up with each other. Nevertheless, peaks of differing
selectivity can be seen when either the gradient time or flow
rate is changed. Here arrows are used to draw attention to the
changes for insulin (Peak 8).
If the objective is to change the separation conditions
while maintaining selectivity, it is necessary to set up the
separation conditions so that tG F/V0ΔФ remains constant
(tG: gradient time; F: flow rate; V0: column void volume; ΔФ:
amount of change in the concentration of the organic solvent
from the start point and end point of the gradient). Examples
are shown in Figure 14. As in Figure 13, the scales of the
horizontal axes were adjusted so that elution positions of
somatostatin (Peak 2) and gastrin I (Peak 5) would line up
with each other. When the value of tG F/V0ΔФ is constant
(upper and lower chromatograms in both (a) and (b)), it is
clear that the selectivity of the other peaks remains
unchanged. Here, arrows are used to draw attention to
changes in insulin (Peak 4). For details please see L.R.
Snyder, J.L. Glajch, J.J. Kirkland, Practical HPLC Method
Development (Japanese translation), A Takahashi, S Araki, p.
154, Tokyo Kagakudojin (1992).
― 10 ―
Column: TSKgel Protein C4-300 (4.6 mm I.D.×15 cm)Eluent: A: H2O/CH3CN/TFA = 90/10/0.05 (v/v/v)
B: H2O/CH3CN/TFA = 20/80/0.05 (v/v/v)A →B linear gradient (a) 30~120 min,
(b) 45 minFlow rate: (a) 1.0 mL/min, (b) 0.5~2.0 mL/minDetection: UV 215 nmTemperature: 40 ℃Inj. volume: 10μL
Samples: 1.δ-sleep-inducing peptide2. methionine-enkephalin3. bradykinin4. eledoisin related paptide5. angiotensin I6. substance P7. somatostatin8. β-endorphin9. insulin
10. gastrin I(each 0.25 μg)
Figure 13 Change of selectivity of peptides by separation condition

― 11 ―
Figure 14 Control of selectivity
Column: TSKgel Protein C4-300Eluent: A: H2O/CH3CN/TFA = 90/10/0.05 (v/v/v)
B: H2O/CH3CN/TFA = 20/80/0.05 (v/v/v)A →B linear gradient
Detection: UV 215 nmTemperature: 40 ℃Inj. volume: 10μL
Samples: 1. substance P2. somatostatin3. β-endorphin4. insulin5. gastrin I(each 0.25 μg)
※ These objects, column size, gradient time and flow rate are described in the graph above.

3-8 Effect of Ion-paired ReagentsWhen separating proteins with RPC, generally an eluent is
used to which trifluoroacetic acid (TFA) has been added as an
ion-paired reagent.
Figures 15 and 16 show how separation is affected by
the concentration of TFA in the eluent. Good separation was
obtained with both proteins and peptides in a TFA
concentration range of 0.02 % to 0.1 %. With the peptide
samples, changes in selectivity due to differences in TFA
concentration are observed. If the TFA concentration is less
than 0.01 %, marked leading or tailing of the peaks of some
proteins is observed. With peptides, although leading/tailing
of the peaks was not observed, peak width increased to some
degree, and peak capacity (Pc) decreased. TFA concentrations
above 0.1 % should not be used, as this can cause a reduction
in sensitivity in LC/MS and deterioration of the column.
Based on these results, a TFA concentration range around
0.02 % to 0.1 % would be considered appropriate when
analyzing proteins and peptides.
― 12 ―
Figure 15 Effect of TFA concentration on separationof proteins
Column: TSKgel Protein C4-300 (4.6 mm I.D.×15 cm)Eluent: A: H2O/CH3CN/TFA =
90/10/0.005~0.1 (v/v/v)B: H2O/CH3CN/TFA =
20/80/0.005~0.1 (v/v/v)A →B linear gradient (45 min)
Flow rate: 1.0 mL/minDetection: UV 215 nmTemperature: 40 ℃Inj. volume: 10μLSamples: 1. cytochrome c (horse)
2. cytochrome c (bovine)3. lysozyme 4. lactoferrin(human)5.α-chymotrypsinogen A6. carbonic anhydrase(each 1 μg)
Figure 16 Effect of TFA concentration on separationof peptides
Column: TSKgel Protein C4-300 (4.6 mm I.D.×15 cm)Eluent: A: H2O/CH3CN/TFA =
90/10/0.005~0.1 (v/v/v)B: H2O/CH3CN/TFA =
20/80/0.005~0.1 (v/v/v)A → B linear gradient (45 min)
Flow rate: 1.0 mL/minDetection: UV 215 nmTemperature: 40℃Inj. volume: 10 μLSamples: 1.δ-sleep-inducing peptide
2. methionine-enkephalin3. bradykinin4. eledoisin related paptide5. angiotensin I6. substance P7. somatostatin8.β-endorphin9. insulin
10. gastrin I(each 0.25 μg)
Calculation formula of peak capacity is the same as in Fig. 10

Perchloric acid or phosphoric acid can be used as an ion-
paired reagent instead of TFA. Applications are shown in
Figure 17. Because perchloric acid and phosphoric acid have
low levels of absorbence at short wave lengths, baseline
variations and decreased ghost peaks can be expected when
analysis is performed using ultraviolet detection. On the other
hand, because these reagents are non-volatile, they are not
suitable for use in LC/MS or in detection using evaporative
light scattering detectors.
3-9 Effect of TemperatureFigures 18 and 19 show how column temperature
affects separation in analyses performed using the TSKgel
Protein C4-300 (4.6 mm I.D.×15 cm). In a range of 27 ℃ to
50 ℃, protein peaks become sharper as the column
temperature increases, and separation between the peaks of
impurities eluting near the main peaks of cytochrome c and
α-chymotrypsinogen A is improved. This is believed to be
due to the fact that as the temperature rises, the diffusion
coefficient increases, with the sample going in and out of the
pores more rapidly. Based on these results, a column
temperature in the vicinity of 40 to 50 ℃ in general would be
appropriate when analyzing proteins. However, caution is
necessary with long-term use under high temperatures, which
can lead to column deterioration.
― 13 ―
Figure 17 Comparison of chromatograms ofproteins in mobile phases with differention pair reagent
Column: TSKgel Protein C4-300 (4.6 mm I.D.×15 cm)Eluent: (a) A: H2O/CH3CN/TFA = 90/10/0.05 (v/v/v)
B: H2O/CH3CN/TFA = 20/80/0.05 (v/v/v)(b) A: 5 mmol/L HClO4 in H2O/CH3CN =
90/10 (v/v)B: 5 mmol/L HClO4 in H2O/CH3CN =
20/80 (v/v)(c) A: H2O/CH3CN/H3PO4 = 90/10/0.2 (v/v/v)
B: H2O/CH3CN/H3PO4 = 20/80/0.2 (v/v/v)A →B linear gradient (45 min)
Flow rate: 1.0 mL/minDetection: UV 210 nmTemperature: 40℃Inj. volume: 10μLSamples: 1. cytochrome c (horse)
2. lysozyme 3. bovine serum albumin4.α-chymotrypsinogen A 5. ovalbumin (each 2 μg)
Figure 18 Effect of column temperature on peak halfwidth of proteins
Column: TSKgel Protein C4-300 (4.6 mm I.D.×15 cm)Eluent: A: H2O/CH3CN/TFA = 90/10/0.05 (v/v/v)
B: H2O/CH3CN/TFA = 20/80/0.05 (v/v/v)A →B linear gradient (45 min)
Flow rate: 1.0 mL/minDetection: UV 215 nmTemperature: 27, 40, 50 ℃Inj. volume: 10μLSamples: cytochrome c (horse),
lysozyme,bovine serum albumin,α-chymotrypsinogen A (each 2 μg)

― 14 ―
Figure 19 Effect of column temperature onseparation of impurities in protein sample
Separation conditions are the same as Figure18

3-10 Effect of Sample LoadFigure 20 shows the relationship between sample load
and peak width when proteins were separated on TSKgel
Protein C4-300 (4.6 mm I.D.×15 cm). With protein samples,
peak width is essentially stable with a load around 3μg, but
increased peak width was observed due to overload as the
load was increased over 3μg. In addition, with peptide
samples, peak width increased at smaller loads in comparison
to proteins, and it can be seen that as the hydrophobicity of
samples decreases and retention weakens, the effect of the
overload tended to be more readily displayed.
3-11 QuantificationFigure 21 shows the relationship between sample load
and peak area when peptides and proteins were separated on
TSKgel Protein C4-300 (4.6 mm I.D.×15 cm). For peptides
and protein samples of comparatively small molecular mass,
the calibration curve shows linearity passing through the
origin in a range of 10 to 1000 ng, and quantification was
good. On the other hand, with BSA and lactoferrin, which
have large molecular masss, the calibration curve passes
below the origin, and determination was not possible at loads
of 30 ng and below. Techniques to consider when performing
microanalysis of samples such as BSA and lactoferrin, which
are observed to be adsorbed in the stationary phase, include:
(1) controlling adsorption by changing the separation
conditions (column temperature, concentration and type of
ion-paired reagent, etc.); (2) changing to a shorter column
with a smaller internal diameter; and (3) using an RPC
column that has a larger pore size than the TSKgel Protein C4-
300 (such as the TSKgel Phenyl-5PW RP) or a non-porous
RPC column that uses a packing material with a small surface
area (such as the TSKgel Octadecyl-NPR).
― 15 ―
Figure 20 Effect of sample load on peak width
Column: TSKgel Protein C4-300 (4.6 mm I.D.×15 cm)Eluent: A: H2O/CH3CN/TFA = 90/10/0.05 (v/v/v)
B: H2O/CH3CN/TFA = 20/80/0.05 (v/v/v)A →B linear gradient (45 min)
Flow rate: 1.0 mL/minDetection: UV 245 nmTemperature: 40 ℃Inj. volume: 100μLSamples: methionine-Enkephalin (MW 574)
insulin (MW 5,808)lysozyme (MW 14,300)α-chymotrypsinogen A (MW 25,700)carbonic anhydrase (MW 29,000)bovine serum albumin (MW 66,000)(each 0.3~100 μg)

― 16 ―
Figure 21 Plots of sample load and peak area
Column: TSKgel Protein C4-300 (4.6 mm I.D.×15 cm)Eluent: A: H2O/CH3CN/TFA = 90/10/0.05 (v/v/v)
B: H2O/CH3CN/TFA = 20/80/0.05 (v/v/v)A → B linear gradient (45 min)
Flow rate: 1.0 mL/minDetection: UV 215 nmTemperature: 40 ℃Inj. volume: 100μL
Samples: (a) insulin (MW 5,808)(b) cytochrome c (bovine) (MW 12,300)(c) ribonuclease A (MW 13,700)(d) lysozyme (MW 14,300)(e) α-chymotrypsinogen A (MW 25,700)(f) carbonic anhydrase (MW 29,000)(g) bovine serum albumin (MW 66,000)(h) lactoferrin (MW 90,000) (each 10~1000 ng)

3-12 Comparison with Other TSKgelRPC Columns
The separation of standard proteins and standard peptides
was compared using 6 types of TSKgel RPC columns which
employ different functional groups, particle sizes, pore sizes,
and base materials (Table 4). Figure 22 shows
chromatograms produced by analyzing 6 standard proteins
under the same conditions. The best separation was obtained
using the TSKgel Protein C4-300. In addition, depending on
the column, large discrepancies in the peak areas of some
proteins can be seen (especially, lactoferrin), but higher
recovery is clearly obtained with the TSKgel Protein C4-300
compared to the other TSKgel RPC columns, with no visible
decrease in peak area. Both the TSKgel Protein C4-300 and
the TSKgel ODS-100V 3μm are RPC columns in which the
base material is a silica gel with a particle size of 3μm.
However, with the TSKgel Protein C4-300, peaks are eluted
more sharply, so differences in functional groups and pore
size clearly play a major role in the separation of proteins.
― 17 ―
Figure 22 Comparison of chromatograms ofproteins
Column: (a) TSKgel Protein C4-300(4.6 mm I.D. 15 cm) ,
(b) TSKgel ODS-100V 3μm(4.6 mm I.D. 15 cm) ,
(c) TSKgel ODS-120T(4.6 mm I.D. 15 cm) ,
(d) TSKgel Octadecyl-4PW(4.6 mm I.D. 15 cm) ,
(e) TSKgel Octadecyl-NPR(4.6 mm I.D. 3.5 cm) ,
(f) TSKgel Phenyl-5PW RP(4.6 mm I.D. 7.5 cm)
Eluent: A: H2O/CH3CN/TFA = 90/10/0.05 (v/v/v)B: H2O/CH3CN/TFA = 20/80/0.05 (v/v/v)A → B linear gradient (45 min)
Flow rate: 1.0 mL/minDetection: UV 215 nmTemperature: 40 ℃Inj. volume: 10μLSamples: 1. cytochrome c (horse)
2. cytochrome c (bovine)3. lysozyme 4. lactoferrin (human) 5.α-chymotrypsinogen A6. carbonic anhydrase(each 1 μg)
Table4 TSKgel RPC columns

Figure 23 shows chromatograms produced when 10
standard peptides were analyzed under the same conditions.
The sharpest peaks were obtained using the TSKgel Protein
C4-300 and TSKgel ODS-100V 3μm; on the other hand, the
broadest peaks resulted when the 3 polymer columns were
used. It can also be seen that in some cases the elution order
of the peptides was reversed, and depending on the column,
differences in the separation selectivity of the peptides were
noted.
Comparing the TSKgel Protein C4-300 and TSKgel ODS-
100V 3μm chromatograms, because retention of the δ-sleep-
inducing compound (Peak 1) is weak with the TSKgel Protein
C4-300, when analyzing oligopeptides of small molecular
mass and low hydrophobicity, better separation tends to be
obtained with the TSKgel ODS-100V 3μm. On the other
hand, with the TSKgel ODS-100V 3μm, the Gastrin I (Peak
10) peak area is small, so when analyzing large-molecular
mass, highly hydrophobic peptides, higher recovery tends to
be obtained with the TSKgel Protein C4-300.
― 18 ―
Figure 23 Comparison of chromatograms ofpeptides
Column: (a) TSKgel Protein C4-300(4.6 mm I.D.×15 cm)
(b) TSKgel ODS-100V 3μm(4.6 mm I.D.×15 cm)
(c) TSKgel ODS-120T (4.6 mm I.D.×15 cm) (d) TSKgel Octadecyl-4PW
(4.6 mm I.D.×15 cm) (e) TSKgel Octadecyl-NPR
(4.6 mm I.D.×3.5 cm) (f) TSKgel Phenyl-5PW RP
(4.6 mm I.D.×7.5 cm) Eluent: A: H2O/CH3CN/TFA = 90/10/0.05 (v/v/v)
B: H2O/CH3CN/TFA = 20/80/0.05 (v/v/v)A →B linear gradient (45 min)
Flow rate: 1.0 mL/minDetection: UV 215 nmTemperature: 40℃Inj. volume: 10μLSamples: 1.δ-sleep-inducing peptide
2. methionine-enkephalin3. bradykinin4. eledoisin related paptide5. angiotensin I6. substance P7. somatostatin8.β-endorphin9. insulin
10. gastrin I(each 0.25 μg)

3-13 Comparison of CommerciallyAvailable RPC Columns forProtein Analysis
Figure 24 shows the results of a comparison of 6 types
of commercially available RPC columns used for protein
analysis and the TSKgel Protein C4-300, with respect to
separation of standard proteins. Higher resolution was
obtained with the TSKgel Protein C4-300 than the other
commercially available columns. In addition, as shown in
Figure 25, the peak area obtained with the TSKgel Protein
C4-300 was similar to that of the other columns, and the
recovery was good.
― 19 ―
Column: TSKgel Protein C4-300(3μm, 4.6 mm I.D.×15 cm)
commercial RPC (C4) Column A(5μm, 4.6 mm I.D.×15 cm)
commercial RPC (C4) Column B(5μm, 4.6 mm I.D.×15 cm)
commercial RPC (C4) Column C(3.5μm, 4.6 mm I.D.×15 cm)
commercial RPC (C4) Column D(5μm, 4.6 mm I.D.×15 cm)
commercial RPCColumn E(3μm, 4.6 mm I.D.×15 cm)
commercial RPC (C4) Column F(3μm, 4.6 mm I.D.×10 cm)
Eluent: A: H2O/CH3CN/TFA = 90/10/0.05 (v/v/v)B: H2O/CH3CN/TFA = 20/80/0.05 (v/v/v)A → B linear gradient
(45 min, Column F ; 30 min)Flow rate: 1.0 mL/minDetection: UV 210 nmTemperature: 40℃Inj. volume: 10μLSamples: 1. cytochrome c (horse)
2. lysozyme 3. bovine serum albumin4.α-chymotrypsinogen A5. ovalbumin(each 2 μg)
Figure 25 Comparison of peak area of proteins between commercial RPC columns for protein separation
Figure 24 Comparison of chromatograms of proteins between commercial RPC columns for protein separation

4. Applications4-1 High-Throughput Analysis
In high throughput analysis, which demands shortened
analysis time, it is effective to use a short column (5 cm) and
to set the flow rate as high as possible within a range that does
not exceed the maximum pressure during use, and adjust the
gradient so that the required separation can be attained.
Figure 26 shows chromatograms resulting when 6
standard proteins were separated within 2 minutes using the
TSKgel Protein C4-300 (2.0 mm I.D.×5 cm). Compared to a
commercially available wide pore RPC column (packing
material: 5μm surface porous (core shell) particles; column
size: 2.1 mm I.D.×7.5 cm), it is clear that with the TSKgel
Protein C4-300 sharp peaks are obtained with little tailing, and
that superior resolution is achieved even in high-throughput
analysis.
Furthermore, because peak widths become very small in
high-throughput analysis, in order to obtain the best results, it
is necessary to pay careful attention to decreased diffusion
outside the column, detector response, and data acquisition
intervals, etc.
― 20 ―
Figure 26 High speed separation of standardproteins
Column: (a) TSKgel Protein C4-300(3μm, 2.0 mm I.D. 5 cm)
(b) commercial RPC Column G(5μm core-shell, 2.1 mm I.D. 7.5 cm)
Eluent: A: H2O/CH3CN/TFA = 90/10/0.05 (v/v/v)B: H2O/CH3CN/TFA = 20/80/0.05 (v/v/v)25 % B →75 % B linear gradient (2 min)
Flow rate: 0.8 mL/minDetection: UV 215 nmTemperature: 40 ℃Inj. volume: 10μLSamples: 1. cytochrome c (horse)
2. cytochrome c (bovine)3. lysozyme 4. lactoferrin (human) 5.α-chymotrypsinogen A6. carbonic anhydrase(each 1 μg)

4-2 Peptide Mapping"Peptide mapping" is a technique in which proteins are
cleaved by a method such as trypsin digestion, after which the
resulting peptide fragments are separated by RPC, and the
amino acid sequences are analyzed. Because peptide mapping
requires high resolution to enable the separation of tens to
hundreds of types of peptide fragments, it is effective to
conduct analyses using a long column (15 cm) with a shallow
gradient slope.
Figure 27 shows chromatograms produced by separating
trypsin digests of BSA, using the TSKgel Protein C4-300 (4.6
mm I.D.×15 cm). By superimposing chromatograms of two
samples with different digestion times, it is clear that the
height of each peak changes as digestion progresses.
Figure 28 shows changes in peak capacity due to
gradient time. When analyzing complex peptide mixtures, it
becomes possible to separate many peaks by increasing the
gradient time.
― 21 ―
Figure 27 Separation of tryptic digest from BSA
Column: TSKgel Protein C4-300 (4.6 mm I.D.×15 cm)Eluent: A: H2O/CH3CN/TFA = 90/10/0.05 (v/v/v)
B: H2O/CH3CN/TFA = 20/80/0.05 (v/v/v)A → B linear gradient (45 min)
Flow rate: 1.0 mL/minDetection: UV 215 nmTemperature: 40 ℃Inj. volume: 10μL
Samples: tryptic digest from BSA(reaction time:1 h, 24 h)(each 20 μg)
Calculation formula of Peak Capacity (Pc)
tR: Retention time of undigested BSAt0: Dead time
(Time to which eluent pass through the column)w0.5: Average peak width of peptide fragments with 5 highest
peak height
Pc=1+tR-t0
1.7・w0.5
Figure 28 Change of peak capacity by gradient time

4-3 PEGylated ProteinsBonding polyethylene glycol (PEG) to a protein is known
to have the effect of reducing the immunogenicity of the
protein, and suppressing hydrolysis by enzyme. PEGylation of
proteins with the objective of diminishing toxicity and
improving pharmacokinetics is already being applied in
several biopharmaceuticals.
Lysozymes bonded to PEG with an average molecular
mass of 5,000 and 30,000 were separated by molecular size
by SEC (Fig. 29), and the fractions obtained were analyzed
on TSKgel Protein C4-300 (Fig. 30). The PEGylated
lysozymes were retained in the column more strongly than the
unmodified lysozymes, and retention time clearly varied
depending on the molecular mass of PEGs and the number of
PEGs bonded per lysozyme molecule. Although peak width
was broader with the PEGylated lysozymes than with the
unmodified lysozymes, this was expected because PEG
bonded to lysozymes have molecular mass distribution.
― 22 ―
Figure 29 Separation of PEGylated lysoxyme bySEC (TSKgel SuperSW3000)
Column: TSKgel SuperSW3000(4.6 mm I.D.×30 cm×2)
Eluent: 0.2 mol/L phosphate buffer+0.05% NaN3
(pH 6.7) Flow rate: 0.35 mL/minDetection: UV 280 nmTemperature: 25℃Inj. volume: 50μLSamples: A. PEGylated lysozyme (PEG MW:5,000)
(5 g/L)B. PEGylated lysozyme (PEG MW:30,000)
(5 g/L)
Figure 30 Separation of PEGylated lysozyme byRPC (TSKgel Protein C4-300)
Column: TSKgel Protein C4-300 (4.6 mm I.D.×15 cm)Eluent: A: H2O/CH3CN/TFA = 90/10/0.05 (v/v/v)
B: H2O/CH3CN/TFA = 20/80/0.05 (v/v/v)A → B linear gradient (45 min)
Flow rate: 1.0 mL/minDetection: UV 215 nmTemperature: 40 ℃Inj. volume: 100μLSamples: Underivatized lysozyme (0.1 g/L),
SEC fraction 1~4
SEC fraction 1
SEC fraction 2
SEC fraction 3
SEC fraction 4
Underivatized lysozyme

4-4 Monoclonal Antibodies (IgG)With monoclonal antibodies (IgG), which are being put
into practical use as antibody drugs, it is known that
heterogeneities in the amino acid sequence, sugar chain
structure, and disulfide bonds, etc., can occur during
manufacturing processes and in storage. Molecular species
produced due to heterogeneity can affect drug efficacy and
safety, so heterogeneity verification testing is extremely
important in the development and quality control of
biopharmaceuticals. Shown here are examples of analysis of
heterogeneous IgG with the TSKgel Protein C4-300.
Figure 31 shows a chromatogram of H- and L-chains
obtained by reduction treatment of IgG by dithiothreitol on
TSKgel Protein C4-300. One L chain and 2 H chain peaks can
be observed. It is presumed that in this IgG, some change
occurred in the amino acid sequence that forms the H chain,
or there are differences in the sugar chain structure bonded on
the H chain.
IgG derived from sources different from the ones
described above were cleaved into Fab fragments and Fc
fragments by papain digestion, then fractions corresponding
to molecular mass of 50,000 and 100,000 were separated by
SEC (Fig. 32), and the fractions obtained were separated on
TSKgel Protein C4-300 (Fig. 33). The Fab fragment and Fc
fragment are presumed to be contained in the 50,000
molecular mass fraction, but they separated into 5 peaks when
separated by RPC on TSKgel Protein C4-300. This suggests
heterogeneity is present in this IgG, in either the amino acid
sequence or the sugar chain structure.
― 23 ―
Figure 31 Separation of IgG reduced bydithiothreitol
Column: TSKgel Protein C4-300 (4.6 mm I.D.×15 cm)Eluent: A: H2O/CH3CN/TFA = 90/10/0.05 (v/v/v)
B: H2O/CH3CN/TFA = 20/80/0.05 (v/v/v)A →B linear gradient (45 min)
Flow rate: 1.0 mL/minDetection: UV 215 nmTemperature: 50 ℃Inj. volume: 100μLSamples: reduced monoclonal IgG (mouse)
Figure 32 Separation of papain digest of IgG by SEC(TSKgel SuperSW3000)
Column: TSKgel SuperSW3000 (4.6 mm I.D.×30 cm)Eluent: 0.2 mol/L phosphate buffer +
0.05 % NaN3 (pH 6.7) Flow rate: 0.35 mL/minDetection: UV 280 nmTemperature: 25 ℃Inj. volume: 100μLSamples: papain digest of monoclonal IgG (mouse)

5. ConclusionAs described above, the RPC column TSKgel Protein C4-
300 has separation characteristics that are suitable for high-
speed, high-resolution analysis of proteins.
With the TSKgel Protein C4-300, in which butyl groups
have been introduced onto the surface of a porous silica gel
with a particle size of 3μm and a pore size of 30 nm, high-
molecular-mass and highly hydrophobic proteins that have
been difficult to analyze with conventional RPC columns can
be separated with good peak shape and recovery.
The market for biopharmaceuticals is expected to expand
further in the future, and purity and heterogeneity testing in
the development and quality control of these drugs is
indispensible; the TSKgel Protein C4-300 provides a powerful
analytical technique for performing these tests.
Reference1. Sasagawa, T. et al., J. Chromatogr., 240, 329-340 (1982)
2. Neue, U., D., J. Chromatogr. A, 1184, 107-130 (2008)
― 24 ―
Figure 33 Separation of papain digest of IgG by RPC(TSKgel Protein C4-300)
Column : TSKgel Protein C4-300 (4.6 mm I.D.×15 cm)Eluent : A : H2O/CH3CN/TFA = 90/10/0.05 (v/v/v)
B : H2O/CH3CN/TFA = 20/80/0.05 (v/v/v)A → B linear gradient (45 min)
Flow rate : 1.0 mL/minDetection : UV 215 nmTemperature :50 ℃Inj. volume : 100μLSamples : SEC fraction 1, 2