Separation and Purification Section : summary of ...
84
A11101 QQ0fil7 i
Transcript of Separation and Purification Section : summary of ...

A11101 QQ0fil7
i


A UNITED STATES
DEPARTMENT OF
COMMERCEPUBLICATION
*=-! Bureau ofStandards
FEB 6 1970
\
NBS TECHNICAL NOTE 509
National Bureau of StandartJs
JUL 2 8 1972
4
/DO
Separation and Purification
Section:
Summary of Activities
July 1968 to June 1969
U.S. DEPARTMENT OF COMMERCENATIONAL BUREAU OF STANDARDS

UNITED STATES DEPARTMENT OF COMMERCEMaurice H. Stans, Secretary
NATIONAL BUREAU OF STANDARDS • Lewis M. Branscomb, Director
NBS TECHNICAL NOTE 509ISSUED FEBRUARY 1970
Nat. Bur. Stand. (U.S.), Tech. Note 509, 73 pages (Feb. 1970)CODEN: NBTNA
Separation and Purification
Section:
Summary of Activities
July 1968 to June 1969
Edited by David H. Freeman
andWalter L Zielinski, Jr.
Separation and Purification Section
Analytical Chemistry Division
Institute for Materials Research
National Bureau of Standards
Washington, D.C. 20234
NBS Technical Notes are designed to supplement the
Bureau's regular publications program. They provide a
means for making available scientific data that are of
transient or limited interest. Technical Notes may be
listed or referred to in the open literature.
For sale by the Superintendent of Documents, U.S. Government Printing Office, Washington, D.C, 20402(Order by SD Catalog No. CI 3.46:509), Price 70 cents.


FOREWORD
The Analytical Chemistry Division was established as a
separate division at the National Bureau of Standards on
September 1, 1963, and became part of the Institute for
Materials Research in the February 1, 1964, reorganization.
It consists at present of nine sections and about 100 tech-
nical personnel encompassing some 57 different analytical
competences from activation analysis and atomic absorption to
vacuum fusion and x-ray spectroscopy. These competences, and
in turn the sections which they comprise, are charged' with
research at the forefront of analysis as well as awareness of
the practical sample, be it standard reference material or
service analysis. In addition it is their responsibility to
inform others of their efforts.
Formal publication in scientific periodicals is a highly
important output of our laboratories. In addition, however,
it has been our experience that informal, annual summaries of
progress describing efforts of the past year can be very valu-
able in disseminating information about our programs. A word
is perhaps in order about the philosophy of these yearly
progress reports. In any research program a large amount of
information is obtained and techniques developed which never
find their way into the literature. This includes the
"negative results" which are so disappointing and unspectacu-
lar but which can often save others considerable work. Of
importance also are the numerous small items which are often
explored in a few days and which are not important enough to
warrant publication—yet can be of great interest and use to
specialists in a given area. Finally there are the experimen-
tal techniques and procedures, the designs and modifications
of equipment, etc., which often require months to perfect and
yet all too often must be covered in only a line or two of a
journal article.
in
Thus our progress reports endeavor to present this infor-
mation which we have struggled to obtain and which we feel
might be of some help to others. Certain areas which it
appears will not be treated fully in regular publications are
considered in some detail here. Other results which are
being written up for publication in the journal literature
are covered in a much more abbreviated form.
At the National Bureau of Standards publications such as
these fit logically into the category of a Technical Note.
We plan to issue these summaries for all of our sections.
The following is the third annual report on progress of the
Separation and Purification Section.
W. Wayne Meinke, ChiefAnalytical Chemistry Division
iv

PREFACE
The year of activity in the pages to follow marks an
important transition in the growth of this, the Separation and
Purification Section. We now begin our fourth year. The past
year involved being on a frontier that was challenging, diffi-
cult, and rewarding.
The highlights are the accomplishments of which we are
proud. The Section completed its first certification of a
Standard Reference Material, an ion exchange microstandard for
calcium in the 0.01 to 1 nanogram range. We shared in being
among the first groups, our own and one in Czechoslovakia, to
detect and measure crosslinking in organic ion exchange net-
works. We have obtained the best separation to date of the
divinylbenzene isomers. We studied copolymer swelling kinetics
on beads as small as 10 microns (urn) in diameter.
The frustrations we experienced provide some insight as to
problems needing more concerted effort. High pressure liquid
chromatography is potentially the most important single analyt-
ical tool for organic separations, but we have found the pre-
diction of selectivity to be a subject of confounding difficulty
The provision of purified chemical reagents is in serious need
for a suitable container—one free from reactivity, diffusion,
brittleness, and impregnated particulates, among other problems.
There is a need for development of inorganic microstandard
matrices for better sample simulation, this is relevant for
geological and possibly for air pollution analysis. There is
uncharted territory concerning the chemical applications of
homogeneous solid solutions with mixed counterions that are
needed as microstandards
.
The most difficult challenge was the effort to introduce
at NBS a high pressure and high resolution liquid chromato-
graphic discipline, and simultaneously apply it toward the
characterization of purity and the separation and measurement
of contaminants in clinical Standard Reference Materials. The
v
chromatography of bilirubin remains perplexing as an unsolved
problem of much concern.
The citation of any commercial materials and equipment in
this document is occasionally made only to specify procedures
which were used, and does not imply recommendation or endorse-
ment by the National Bureau of Standards; nor does it imply
the use of such material and equipment as the only suitable
sources for the purpose at hand.
Mrs. Janice Hurst, our Section secretary, eased the task
of preparing this report and we gratefully acknowledge her
patient skills in translating penscript, some of it legible.
David H. Freeman, ChiefSeparation and Purification Section
VI
TABLE OF CONTENTS
PAGE
I. ION EXCHANGE MICROSTANDARDS 1
A
.
Introduction 1
B. Preparation 2
C. Casting 3
D. Stripping 4
E. Analysis 5
P. Other Measurements 7
G. Measurement, Transfer and Packaging 9
H. Certification 10
II. ION EXCHANGE SUBSTRATES 13
A. Introduction 13B. Preparation 13
1. Synthesis of Copolymer Beads 132. Sulfonation of Copolymer Beads 14
C. Characterization 18
1. Infrared Spectrophotometry ofCopolymers 18
2. Infrared Spectrophotometry ofSulfonated Copolymers 24
3- Swelling Studies 25
III. COPOLYMER AND ION EXCHANGE MICROSCOPY ...... 30
A. Introduction 30B. Characterization of Copolymer Beads 30C. Characterization of Ion Exchange Beads .... 32D. The Microscopy Laboratory Facility 34
IV. CHROMATOGRAPHY 35
A. Gas Chromatography 351. Divinylbenzene , 35
(a) Separations on Bentone-34 35(b) Separations on Liquid Crystals .... 35(c) Vinyl Toluene 38
2. Other 39(a) Sulfolane 39(b) 2-Methoxy Ethanol 40(c) Ortho-Fluorobenzoic Acid 42
3. Gas Chromatography-Mass Spectrometry ... 43(a) The Quadrupole Mass Spectrometer ... 43(b) The GC-MS Interface 44
B. Liquid Chromatography 461. Introduction 46
vii
TABLE OF CONTENTS (Con't)
PAGE
2. Instrument Design ^7
3. Clinical Standard ReferenceMaterials - Bilirubin ^8
V. REAGENTS 53
A. Introduction 53B. Ultra Pure Reagents Service 54C. Ultra Pure Reagent Synthesis 56D. Container Purification 56
VI. PERSONNEL AND ACTIVITIES 58
A. Personnel Listing 58B. Talks 59C. Publications 60
VII. REFERENCES 6l
LIST OF TABLES
TABLE NO. • PAGE
I. Network Equivalent Weight (E^) Measurements ... 8
II. Copolymer Beads with Known DVB Crosslinking ... 15
III. Gas Chromatographic Separation of DVBComponents in Mixed DVB 39
IV. Number of Units of Ultra Pure ReagentsDispensed in FY 1969 55
viii
LIST OP FIGURES
FIGURE NO. PAGE
1. Sodium Ion Selective Electrode Used forMonitoring Exchanger Effluent Stream 3
2. Analysis of Exchanger Loadings byActivation Analysis 5
3. Effect of Bead Size Upon CalciumAnalysis by the X-Ray Microprobe 7
4. Clean Room Facility for Casting andPackaging of Microstandards 9
5. Polyethylene Clean Room 10
6. First Micro standard Certificate:Calcium H
7. Copolymer Sulfonation of Pre-SizedBeads 16
8. Surface Sulfonation of Copolymer Beads 17
9- Preparation of 100% Pure Sulfuric Acidby Slow Crystallization at 9 °C 17
10. Grating Infrared Spectrophotometer ...'.... 19
11. Infrared Spectrum of Polystyrene 20
12. Infrared Spectrum of Poly (s tyrene/0.16 p-DVB) 20
13. Infrared Spectrum of Poly (styrene/0.16 m-DVB) 21
14. Infrared Spectrum of Poly (styrene/0.16 technical DVB) -. . 21
15. High Resolution Spectra of Polystyreneand Poly (styrene/DVB) Copolymers 22
16. Absorbance Ratio of m-DVB Band Relationto Mole Fraction of m-DVB (Base LineMethod) 23
17. Cal Comp Plot of Poly (styrene/0 . 08 p-DVB)Unresolved and Computer Resolved Doublet .... 24
ix
LIST OF FIGURES (Con't)
FIGURE NO. PAGE
18. Preliminary Testing of Design Circuitryfor Automatic Digitizing Device 25
19. Capacity Relative to Adsorption for the1408 cm1 ! Band of Sulfonated Copolymers .... 26
20. Mole Fraction of DVB Isomers Relative toSwelling Fraction (}> [<J>
= (Q-l)/Q, whereQ = swollen bead/dry bead diameter ratio] ... 27
21. Log-Log Plot of Swelling Time Relativeto Dry Bead Diameter Showing Homogeneousand Heterogeneous Swelling 28
22. Photomicrograph Showing HeterogeneousSwelling 29
23. Comparator Used for Measurement ofParticle Diameters and Particle SizeDistribution 31
24. Microscope with Ocular Micrometer,Counting Cells, and Stop Watch forSwelling Studies 32
25. Microscope with Micromanipulator andSpecimen Mounts for MicrostandardParticles 33
26. Separation of DVB Components on Bentone-34 ... 36
27. Separation of DVB Components on DHABLiquid Crystal 37
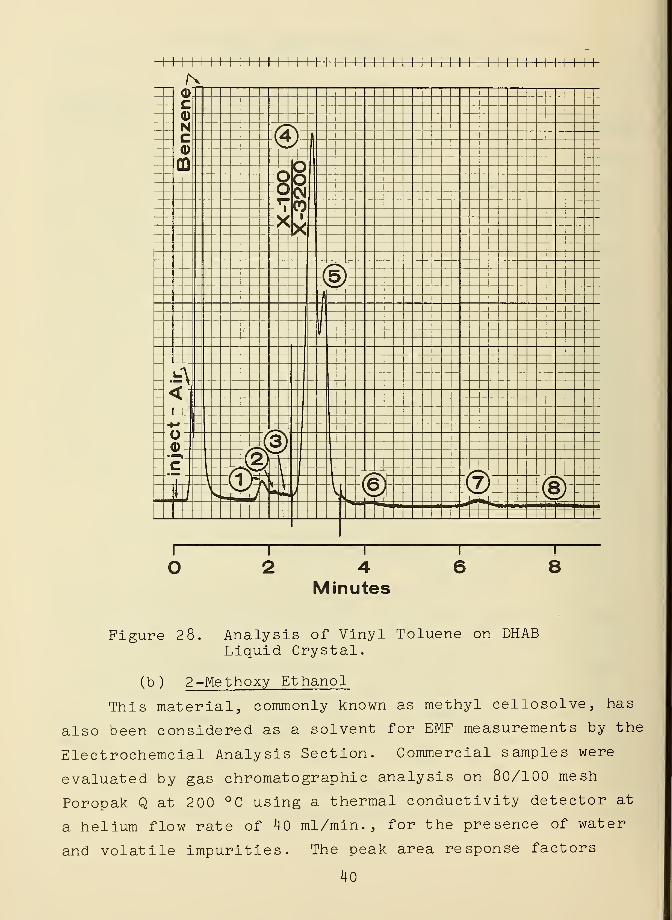
28. Analysis of Vinyl Toluene on DHAB LiquidCrystal 40
29. Determination of Water in Sulfolane 41
30. Separation of Volatiles on Porapak Q h2
31. Quadrupole Filtering Schematic 43
32. The GC-Mass Spectrometer System 45
33. Schematic of GC-MS Interface 45

LIST OP FIGURES (Con't)
FIGURE NO. PAGE
34. Sample Inlet System for Septum Injection .... 48
35. Connection from Column Exit to Detector .... 49
36. Preliminary Ion Exchange ChromatographicSystem 50
37. Schematic of Ion Exchange ChromatographicSystem 51
38. Analysis of an Impure Bilirubin Sampleby Ion Exchange Chromatography 52
39. Microturbidimetric Measurement ofParticulate Matter Content 54
40. Effect of Boiling Nitric Acid in Removalof Container Contaminants 57
XI
SEPARATION AND PURIFICATION SECTION: SUMMARY OP ACTIVITIES
JULY 1968 to JUNE 1969
Edited by David H. Freeman and
Walter L. Zielinski, Jr.
ABSTRACT
This is the annual progress report on the Separation and
Purification Section activities. The major task of developing
a certified ion exchange microstandard as a Standard Reference
Material is presented in terms of the preparative and charac-
terizational work involved. Fundamental studies of ion
exchange substrates includes the application of quantitative
analytical infrared spectrophotometry to measure crosslinking
in the copolymer network, and to determine the degree of
sulfonation. Optical microscopy is applied to the study of
swelling kinetics for single copolymer particles. Analytical
gas chromatography is applied to the isomers of divinylbenzene
.
The recently acquired quadrupole mass spectrometer is described.
Liquid chromatography at high pressures and with high resolu-
tion has been begun recently. The activities of a project
dealing exclusively with ultrapure reagents is described
including the problems of contamination free storage.
Key words
:
Gas chromatography; ion exchange; infrared analysis;
liquid chromatography; purification; separation; styrene/
divinylbenzene; ultra-pure reagents.
xii
I. ION EXCHANGE MICROSTANDARDS
A . Introduction
A broad range of chemical entities exist in the form of
a single element, or combinations of elements, which can be
loaded onto ion exchange beads. Following suitable prepara-
tion, beads are isolated one at a time. For each given bead,
the mass of the element (counterion) in question is determined
by measurement of the bead diameter. Bead homogeneity is
likewise determined, so that the accuracy of the mass of the
element is also known within a well-defined, and rather small,
uncertainty. The happiest aspect to emerge from this effort
is an important and unique capability for the encapsulation
of quantities of matter that are otherwise unweighable . The
quantities are sufficiently small to permit novel experiments
and calibration of chemical measurement systems, especially
those designed for handling very small samples.
Several adaptations of this technique have evolved by
acceptance into other laboratories. Thus, the preparation of
micro sources of radioactivity has been carried out by Paul B.
Hahn at the Northeastern Radiological Health Laboratory
(HEW-PHS). Dr. Lynus Barnes (Analytical Mass Spectrometry
Section, NBS) has developed a method of standard addition that
permits quantitative mass spectrometric analysis at the nanogram
level. The combined co-calibration of the electron microprobe
for magnification and for elemental ratio (counterion to sulfur)
has been worked out by Robert Myklebust and Dr. Kurt Heinrich
(Spectrochemical Analysis Section, NBS). The results of all of
these studies will be made public at the forthcoming Eastern
Analytical Symposium (New York, New York, November 1969). The
observation that these and other disciplines are engaged in
extending the feasibility of using these standards, coupled
with the continuing improvement of detector sensitivity limits,
indicates their growing potential to a broad spectrum of
chemical microanalysis.
1

In the previous annual report [1], we outlined the
general capability of ion exchange micro standards . A full
description of their preparation and testing is planned for
publication in the near future so that a duplication of this
information will not be given here. The following section
will provide coverage of the highlights of the past year's
activities in this area. A separate project involves the
development of larger particles that are to be used in the
nanogram to microgram mass range, and these efforts are
described in Section II of this report.
B. Preparation
Ion exchangers have the obvious capability for exchanging
ions. The preparation of an ion exchange standard depends
upon two important requirements. The placement of the ions
must be done uniformly. Once placed, the ion composition
must be locked against accidental change. The former depends
upon access to an intrinsically homogeneous ion exchange
network. These conditions are not obtained without special
care in synthesis, and the proof of homogeneity involves an
experimental effort that we have approached comprehensively.
The preparative methods are monitored both for com-
pletion of ion placement and for possible contamination. In
column operations, we may start with a sodium form exchanger,
since this can be monitored using the sodium selective electrode,
shown in Figure 1. The prepared exchanger is tested for traces
of residual sodium content using flame photometry.

Figure 1. Sodium Ion Selective Electrode Used forMonitoring Exchanger Effluent Stream.
C. Casting
The exchanger in its prepared form is washed with solvents
that deswell the network and the material is dried. The dry
exchanger is then immersed in a pure, inert and nonswelling
liquid, such as cyclohexane. The bead clusters are dispersed
ultrasonically and a dilute suspension is cast onto glass
slides. Pretreatment of the glass microscope slides involves
exhaustive leaching to extract potentially exchangeable
Impurities from the glass surface. while glass is not the
best possible choice of container, as we have reported in a
recent summary [2], It does offer the advantage of providing
just enough electrostatic attraction to hold small beads in
place once they are carried by the hydrocarbon liquid onto
the surface. This was tested in some detail since we had to
show that such beads, once cast onto a surface and then sold
as Standard Reference Materials , would remain in place. In
routine tests, the beads adhered to the glass despite repeated
drop tests from an altitude of three meters above the floor.
D . Stripping
To function as a microstandard, the adsorbed element
must be released from the matrix of the ion exchange bead.
If the matrix is not to be destroyed per se , the problem is
one of eluting (stripping) a micro ion exchange system;
understanding that the procedure would be the same as for a
macro system. In the case of nanogram quantities on micron-
size beads either too large a volume of extracting agent or
too lengthy an extraction process would hamper the utility
of a microstandard and the potential for loss would likewise
become extreme.
For simple monovalent ions, stripping presents no
difficulty; water alone Is sufficient, so much so that high
room humidity can cause loss through leaching. With multivalent
ions stripping becomes more difficult; the ions are adsorbed
so strongly that a small amount of water cannot effect complete
removal.
Other possible methods of elution include washing with
complexing agents, or oxidation-reduction of the ion while it
is adsorbed on the resin.
The first microstandard where stripping became a problem
was chromium, adsorbed as Cr (III). Nelson, et_ al. [3] have
indicated that either concentrated or dilute hydrochloric
acid could effect stripping. Qualitative tests showed
however, that though results could be achieved using con-
centrated acid, the process was a lengthy one with complete
extraction not assured. EDTA showed the same behavior.
More satisfactory results were obtained by oxidizing the
adsorbed chromium with alkaline hydrogen peroxide. In a
matter of seconds the yellow color of the chromate ion could
4
be seen in solution. Preliminary quantitative measurements
indicate complete removal of the chromium from the resin.
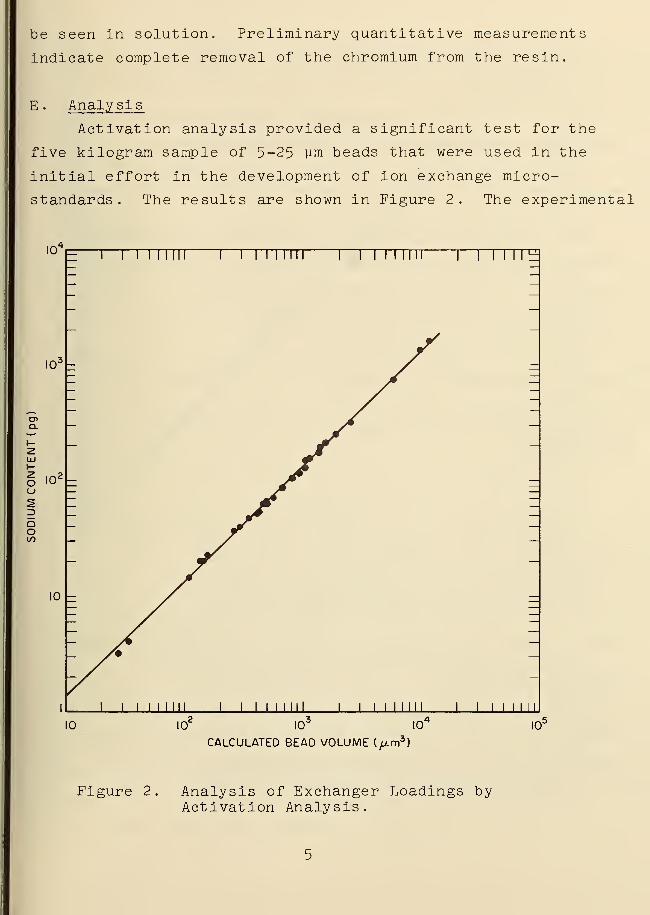
E . Analysis
Activation analysis provided a significant test for the
five kilogram sample of 5-25 um beads that were used in the
initial effort in the development of ion exchange micro-
standards. The results are shown in Figure 2. The experimental
I04,=r
I I Mill I I INI 1—I I I I MM I I I I I l~E
Q.
UJI—
O
QOCO
I03 -
10*-
i i i miI
'II I I I I MM I
I i i i in
10 10 10 10
CALCULATED BEAD VOLUME (/im3 )
io-
Figure 2. Analysis of Exchanger Loadings byActivation Analysis.
particulars will be discussed in detail elsewhere, but it has
become obvious that the measured sodium content revealed a
direct uniform variation of counter! on content with the
microscopically measured bead volume. The variations do not
extend appreciably beyond the anticipated measurement error.-4
It is significant to note that these results involve 10 -fold
smaller quantities of matter than reported previously when this
type of test was first announced.
The electron microprobe analysis of the Ca-form ion
exchange beads showed a stable Ca/S ratio for the respective
K x-rays. The microprobe results as reported [4], imply
suitability of the beads as correspondence standards between
signal ratio and absolute elemental ratio.
The effect of particle size upon microprobe x-ray signal
was quite informative. The result for Ca is shown logarith-
mically in Figure 3- The results for S were identical in
trend, as expected. The slope of two indicates the
relationship
(Ca) or (S) « d2
(1)
where d is particle diameter. This is the same as the
predicted behavior for an electron (or x-ray) opaque bead
in which penetration toward the bead core is slight. In
terms of the need to measure possible bead heterogeneity
however, shallow penetration is desirable for the following
reason. Given the independent network heterogeneity
determination provided by activation analysis, the major
possible source of heterogeneity should be traceable to
surface loss by ion exchange. Electron microprobe analysis
therefore, offers a significant contribution by narrowing
its search to this important region of the bead.

14.0
12.0- CALCIUM vs SULFUR
CALCIUM
Ka
INTENSITY
2.0 3.0 4.0 5.0
SULFUR Ka INTENSITY
7.0
p
Figure 3. Effect of Bead Size Upon Calcium Analysisby the X-Ray Microprobe
.
Other Measurements
It should be noted that other contributions to this
project have been carried out and will be reported elsewhere
The determinations of (a) ion exchange capacity, (b ) matrix
element measurements and (c) the anhydrous exchanger density
have been performed with the cooperation of R. A. Paulson
(Microchemical Analysis Section, NBS). Measurements of
counterions using polarographic [5] and flame photometric
methods have also been carried out [6].
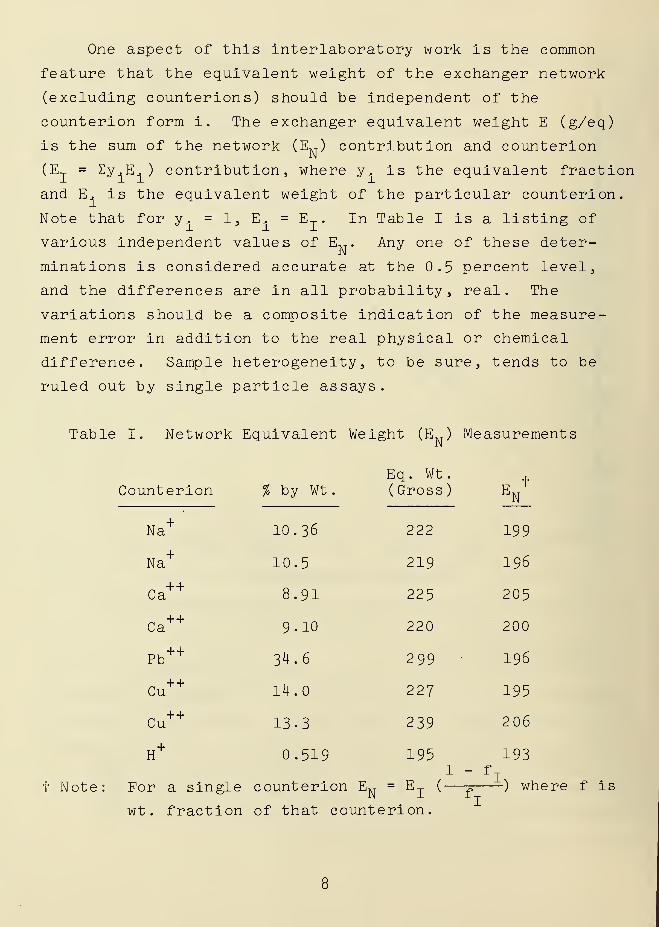
One aspect of this interlaboratory work is the common
feature that the equivalent weight of the exchanger network
(excluding counterions) should be independent of the
counterion form i. The exchanger equivalent weight E (g/eq)
is the sum of the network (E,,) contribution and counterion
(E-j. = Ey.E.) contribution, where y. is the equivalent fraction
and E. is the equivalent weight of the particular counterion.
Note that for y. = 1, E. = E T . In Table I is a listing of° 1 3 1 I to
various independent values of E„. Any one of these deter-
minations is considered accurate at the 0.5 percent level,
and the differences are in all probability, real. The
variations should be a composite indication of the measure-
ment error in addition to the real physical or chemical
difference. Sample heterogeneity, to be sure, tends to be
ruled out by single particle assays.
Table I. Network Equivalent Weight (E„) Measurements
Counterion
ha
Na+
Ca++
Ca+ +
Pb++
Cu+ +
Cu++
H+
% b^' Wt
.
10. 36
10 5
8. 91
9- 10
34. 6
14.
13 3
519
Eq. Wt.( Gross
)
222
219
225
220
299
227
239
195
tEN
199
196
205
200
196
195
206
1931 - f
It Note: For a single counterion E^ = E-j. (
—
j_ ) where f is
wt . fraction of that counterion.

G. Measurement, Transfer and Packaging
From independent efforts, we know that liquid water
contains a small amount of electrolyte. This can result from
water hydrolysis, or from reactions following the adsorption
of atmospheric gases such as carbon dioxide. For these
reasons, a microscopic amount of water condensation is suf-
ficient to cause ion exchange, and that of course would tend
to ruin a given microstandard. To minimize this possibility,
we have maintained a practice of restricting the humidity to
less than 50 percent of relative humidity at temperatures
near 23° C.
The elimination of atmospheric dust is an equally
desirable condition. For that reason, we have carried out
our operations in a specially constructed clean room facility
(Figure 4) which Is used for casting and packaging operations
^%
I
* '4
\
Figure 4. Clean Room Facility for Casting andPackaging of Microstandards
.

for the issuance of the ion exchange beads as Standard
Reference Materials. In Figure 5 is a photograph of a less
elegant, but similar facility in which the room has been con-
structed out of polyethylene. Inside the room is a laminar
flow clean bench. The air in the room is principally recir-
culated by an air dehumidifier/air conditioner.
H. Certification
The first microstandard to be completed is that for
calcium in the region of 0.01 to 1 nanogram. This exciting
and uniquely minute encapsulation of the alkaline earth
cation is prepared as castings upon the microscope slides.
A minimum of one hundred isolated beads are adherent to the
glass surface. The beads are readily picked up on a clean
fine-tipped probe.
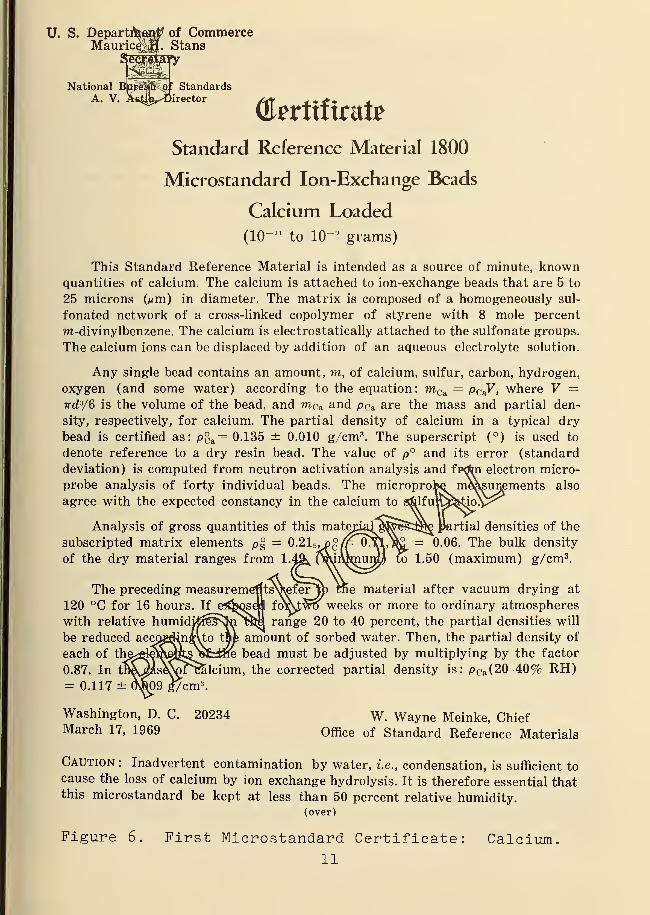
It is of interest to include the first certificate which
has been issued for these individual ion exchange bead micro-
standards. The certificate is displayed in Figure 6.
Fig. 5- PolyethyleneClean Room.
10
U. S. Departfbfi^ of CommerceMauric^Ji. Stans
Seip^ayy
A. V.
National BiplSj&s^)' Standardsirector
(Untxitint?
Standard Reference Material 1800
Microstandard Ion-Exchange Beads
Calcium Loaded
(1011
to 10~ J grams)
This Standard Reference Material is intended as a source of minute, knownquantities of calcium. The calcium is attached to ion-exchange beads that are 5 to
25 microns (^m) in diameter. The matrix is composed of a homogeneously sul-
fonated network of a cross-linked copolymer of styrene with 8 mole percent
ra-divinylbenzene. The calcium is electrostatically attached to the sulfonate groups.
The calcium ions can be displaced by addition of an aqueous electrolyte solution.
Any single bead contains an amount, m, of calcium, sulfur, carbon, hydrogen,
oxygen (and some water) according to the equation: wCa = PaY, where V =ird :i/6 is the volume of the bead, and mCa and p Ca are the mass and partial den-
sity, respectively, for calcium. The partial density of calcium in a typical dry
bead is certified as: pca= 0.135 ± 0.010 g/cm 3
. The superscript (°) is used to
denote reference to a dry resin bead. The value of p° and its error (standard
deviation) is computed from neutron activation analysis and frdm electron micro-
probe analysis of forty individual beads. The microprobe meAsurjements also
agree with the expected constancy in the calcium to s&lfun^&tio:1
Analysis of gross quantities of this matej
subscripted matrix elements p§ = 0.21 5,o£/£ 0?
of the dry material ranges from 1.44k (wAknui
trtial densities of the
= 0.06. The bulk density
1.50 (maximum) g/cm3.
The preceding measuremerits^feFjb fcfie material after vacuum drying at
120 °C for 16 hours. If eiSjsoselfl fo^^ro weeks or more to ordinary atmospheres
with relative humidi^l^shj^a range 20 to 40 percent, the partial densities will
be reduced accogjiingUo tftfe amount of sorbed water. Then, the partial density of
each of the^giemMas/»fciwe bead must be adjusted by multiplying by the factor
0.87. In tfte^se^pFralcium, the corrected partial density is: p Ca (20-40% RH)= 0.117 ± o5p9 gVcm 3
.
Washington, D. C.
March 17, 1969
20234 W. Wayne Meinke, ChiefOffice of Standard Reference Materials
Caution: Inadvertent contamination by water, i.e., condensation, is sufficient to
cause the loss of calcium by ion exchange hydrolysis. It is therefore essential thatthis microstandard be kept at less than 50 percent relative humidity.
(over)
Figure 6. First Microstandard Certificate
11
Calcium.
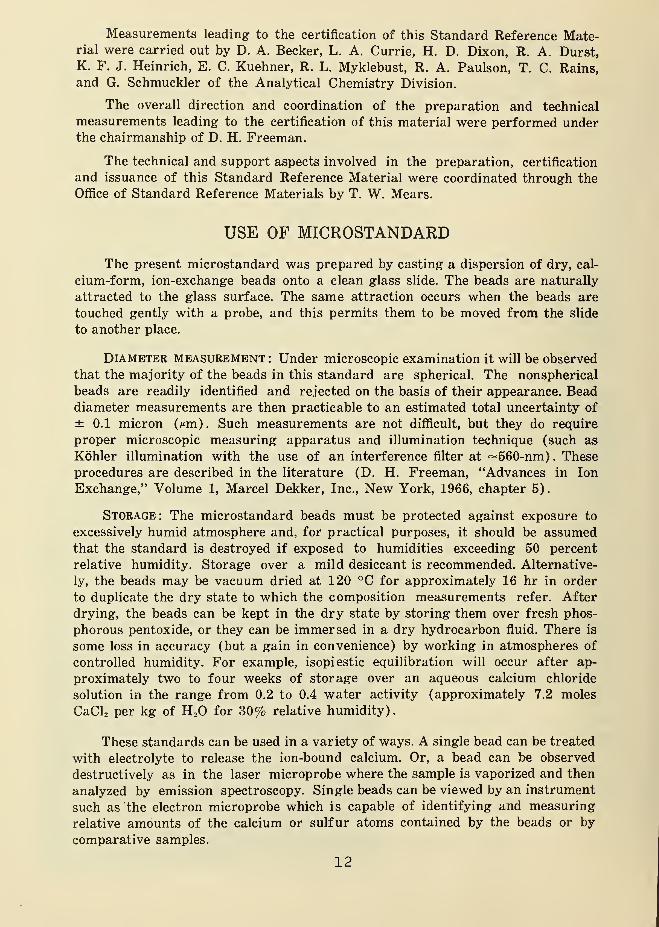
Measurements leading to the certification of this Standard Reference Mate-rial were carried out by D. A. Becker, L. A. Currie, H. D. Dixon, R. A. Durst,K. F. J. Heinrich, E. C. Kuehner, R. L. Myklebust, R. A. Paulson, T. C. Rains,and G. Schmuckler of the Analytical Chemistry Division.
The overall direction and coordination of the preparation and technical
measurements leading to the certification of this material were performed underthe chairmanship of D. H. Freeman.
The technical and support aspects involved in the preparation, certification
and issuance of this Standard Reference Material were coordinated through the
Office of Standard Reference Materials by T. W. Mears.
USE OF MICROSTANDARD
The present microstandard was prepared by casting a dispersion of dry, cal-
cium-form, ion-exchange beads onto a clean glass slide. The beads are naturally
attracted to the glass surface. The same attraction occurs when the beads are
touched gently with a probe, and this permits them to be moved from the slide
to another place.
Diameter measurement : Under microscopic examination it will be observed
that the majority of the beads in this standard are spherical. The nonspherical
beads are readily identified and rejected on the basis of their appearance. Beaddiameter measurements are then practicable to an estimated total uncertainty of
± 0.1 micron (/*m). Such measurements are not difficult, but they do require
proper microscopic measuring apparatus and illumination technique (such as
Kohler illumination with the use of an interference filter at «560-nm) . These
procedures are described in the literature (D. H. Freeman, "Advances in Ion
Exchange," Volume 1, Marcel Dekker, Inc., New York, 1966, chapter 5).
Storage: The microstandard beads must be protected against exposure to
excessively humid atmosphere and, for practical purposes, it should be assumedthat the standard is destroyed if exposed to humidities exceeding 50 percent
relative humidity. Storage over a mild desiccant is recommended. Alternative-
ly, the beads may be vacuum dried at 120 °C for approximately 16 hr in order
to duplicate the dry state to which the composition measurements refer. After
drying, the beads can be kept in the dry state by storing them over fresh phos-
phorous pentoxide, or they can be immersed in a dry hydrocarbon fluid. There is
some loss in accuracy (but a gain in convenience) by working in atmospheres of
controlled humidity. For example, isopiestic equilibration will occur after ap-
proximately two to four weeks of storage over an aqueous calcium chloride
solution in the range from 0.2 to 0.4 water activity (approximately 7.2 moles
CaCl 2 per kg of H 2 for 30% relative humidity)
.
These standards can be used in a variety of ways. A single bead can be treated
with electrolyte to release the ion-bound calcium. Or, a bead can be observed
destructively as in the laser microprobe where the sample is vaporized and then
analyzed by emission spectroscopy. Single beads can be viewed by an instrument
such as the electron microprobe which is capable of identifying and measuring
relative amounts of the calcium or sulfur atoms contained by the beads or by
comparative samples.
12

II. ION EXCHANGE SUBSTRATES
A. Introduction
The . microstandards issued recently [1,7] are based on
the availability of stable, reproducible and accurately
characterized poly[styrene/divinylbenzene] beads. These
copolymer beads serve as precursors for a wide variety of
possible ion exchange derivatives. In the case of micro-
standards, we have employed sulfonated beads. The properties
of the gel network are dependent upon the careful control of
the synthetic conditions, including monomer composition.
Specifically, both monomers should be pure, and their con-
centrations should be accurately known. Other conditions,
such as the bead size-range and the polymerization rates are
equally important. The subsequent reaction on the network
(sulfonation) likewise requires careful control. It has been
shown that such conditions can be achieved [8],
The researcher faced with using ordinary ion exchange
materials may show small or large variations in the properties
of different batches of supposedly identical networks. To
illustrate, the ion-exchange capacity will vary from batch to
batch, and it seldom approaches its ideal value. In this area
in particular, simple definitive tests are lacking to evaluate
the substrate properties.
With such considerations in mind, three areas of investi-
gation were undertaken; viz . the synthesis, the characterization,
and the structure of sulfonated poly[styrene/divinylbenzene]
and its parent copolymers. These studies are more fully
described below.
B. Preparation
1. Synthesis of Copolymer Beads
The first problem in this area lies in obtaining pure
monomers. Styrene presents no difficulty, but either meta-
or para-divinylbenzene (DVB) is difficult to purify [9].
13
Purification procedures, analytical methods and procurement
channels have been determined [10]. One experienced manu-
facturing firm in the copolymer synthesis field (Ionac
Chemical Co., New Brunswick, New Jersey), agreed to prepare
beads to meet our specifications* using standard methods [11]
with purified divinylbenzenes . Accordingly, a stock of poly
[s tyrene/DVB] copolymers was synthesized for analytical and
structural studies. The crosslinking was varied according
to isomer (meta- or para-DVB) type and concentration, with
all other synthetic conditions held constant. The copolymers
are listed in Table II. Among those listed is 8 mole-percent
meta-divinylbenzene crosslinked copolymer (poly[styrene/0 . 08
m-DVB] ) which on sulfonation is the substrate for the ion
exchange microstandards
.
In order to compare the pure copolymers with commercial
samples, a synthetic investigation is in progress with
Dr. A. H. Greer (Ionac Chemical Co.) to determine which of
several experimental variables relate to the swelling behavior
which has been observed. This closely coordinated synthetic
approach is expected to provide structural insight for the
evaluation of fundamental ion-exchange properties. Similar
approaches have been used by other workers [8,12].
2 . Sulfonation of Copolymer Beads
Careful control of copolymer sulfonation is a necessary
prerequisite in the development of reliable cation exchange
networks. One type of experiment using pre-sized beads suggests
that sulfonation may be a two-step process as indicated in
*These specifications require the use of pure DVB (suppliedby us) within + 2 percent concentration accuracy; styrene ofthe same concentration accuracy; specified particle sizerange; and the production of optically clear, strain-free,spherical beads.
14

Table II
Copolymer Beads with Known DVB Crosslinklng
Ident. Mole % DVBNumber Comments Met a Para
1-19 Poly(Styrene/DVB) 1.0
1-20 Poly(Styrene/DVB) 2.0
1-21 Poly(Styrene/DVB) 4.0
1-22 Poly(Styrene/DVB) 8.0
1-23 Poly(Styrene/DVB) 16 .
1-25 Poly(Styrene/DVB) 1.5
1-110 Poly(Styrene/DVB) 2.0
1-111 Poly(Styrene/DVB) 4.0
1-112 Poly(Styrene/DVB) 8.0
1-24 Poly(Styrene/DVB) 16 .
1-11 Microfine Poly(Styrene/DVB
)
8.0
1-126 Poly(Vlnyl toluene/DVB) 8.0
1-127 Solvent Modified 10% Xylene,Poly(Styrene/DVB) 8.0
1-128 Solvent Modified 50$ Xylene,Poly(Styrene/DVB) 8.0
1-129 Poly(Styrene/DVB) 5-6 2.4
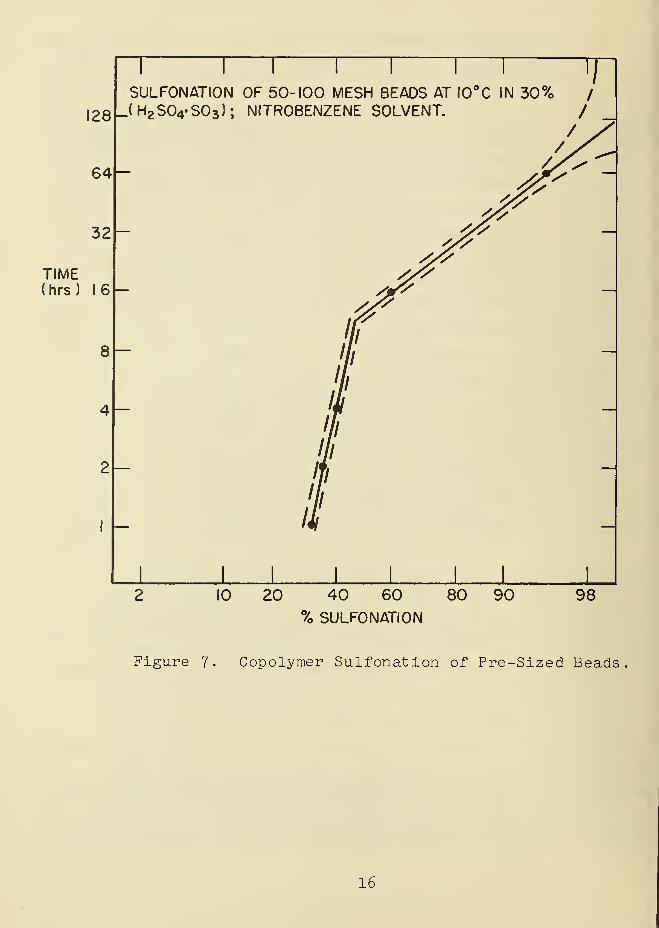
Figure 7 . These data imply that the final few percent of
sulfonation occur in weeks as compared to hours for major
sulfonation of the beads. Other results have demonstrated
that oleum (HpSOj. + SCO under mild conditions is a rapid
sulfonating agent when the proper solvent system is used [13]-
For certain purposes, surface sulfonation Is desirable.
Figure 8 indicates the result obtained in such an instance.
High purity reagents and careful control of concentrations
are most essential. A technique for preparing pure (100
percent) sulfuric acid is illustrated in Figure 9.
A single literature reference (Pepper et_ al. [14]) has
indicated that ideal sulfonation (one sulfonic acid group
15
SULFONATION OF 50-100 MESH BEADS AT IO°C IN 30% /
I28M H2S04-S0 3 ); NITROBENZENE SOLVENT. //
/
64
32
TIME(hrs) 16
8
10 20 40 60 80 90
% SULFONATION
98
Figure 7. Copolymer Sulfonation of Pre-Sized Beads
16
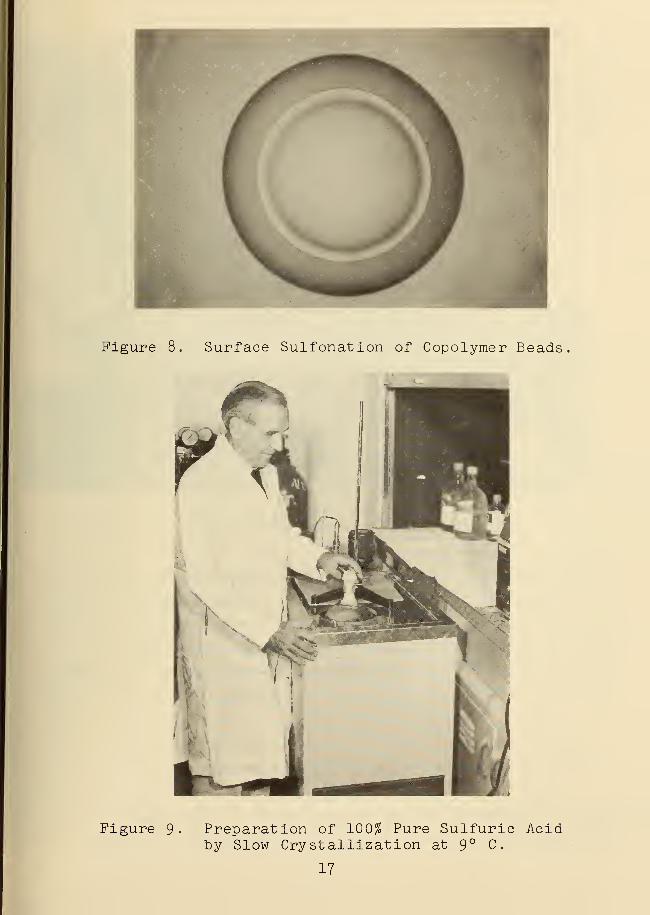
Figure 8. Surface Sulfonation of Copolymer Beads
Figure 9- Preparation of 100% Pure Sulfuric Acidby Slow Crystallization at 9° C.
17
per aromatic residue) of the copolymer is attainable. Other
workers claim this achievement is not possible [15]. Employing
the same catalyst (silver ion) as Pepper, we have found that
Pepper's conclusion is valid, even though our sulfonation
system was not HpSOj,, but oleum.
This result permits a greater accuracy in preparing
beads of high capacity and low variability; a factor of great
importance in the preparation of beads for microstandards
in the micro- and nano-gram range.
C . Characterization
1. Infrared Spectrophotometry of Copolymers
Beads prepared with pure DVB (Table II) were used to
evaluate qualitatively and semi-quantit at ively the crosslinking
with respect to both DVB isomer type and mole percent from
IR spectral analysis. Polystyrene* was used as a reference
standard.
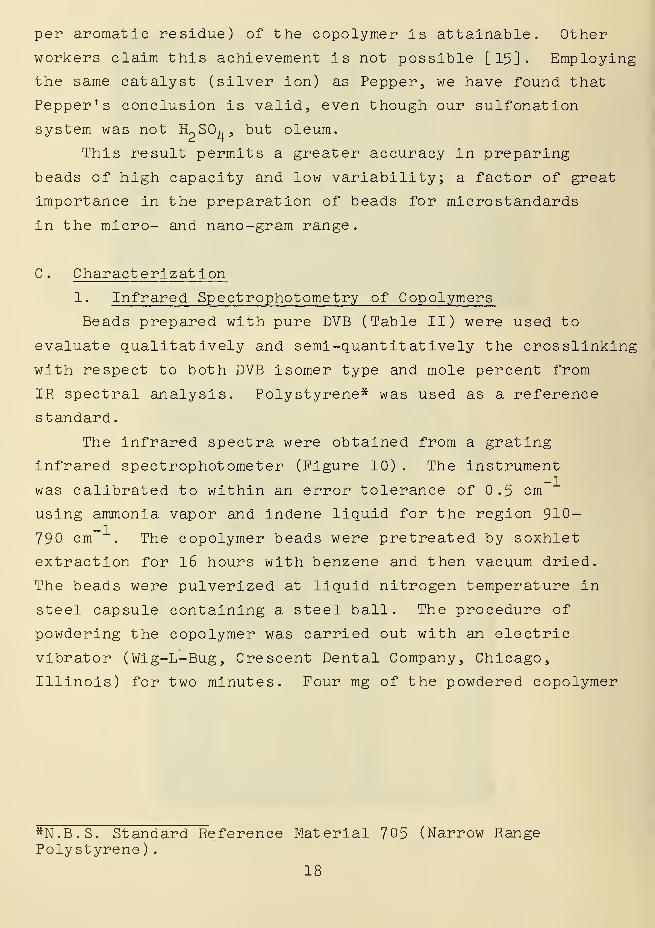
The infrared spectra were obtained from a grating
infrared spectrophotometer (Figure 10) . The instrument
was calibrated to within an error tolerance of 0.5 cm
using ammonia vapor and indene liquid for the region 910-
790 cm . The copolymer beads were pretreated by soxhlet
extraction for 16 hours with benzene and then vacuum dried.
The beads were pulverized at liquid nitrogen temperature in
steel capsule containing a steel ball. The procedure of
powdering the copolymer was carried out with an electric
vibrator (Wig-L-Bug, Crescent Dental Company, Chicago,
Illinois) for two minutes. Four mg of the powdered copolymer
*N.B.S. Standard Reference Material 705 (Narrow RangePolystyrene )
.
18
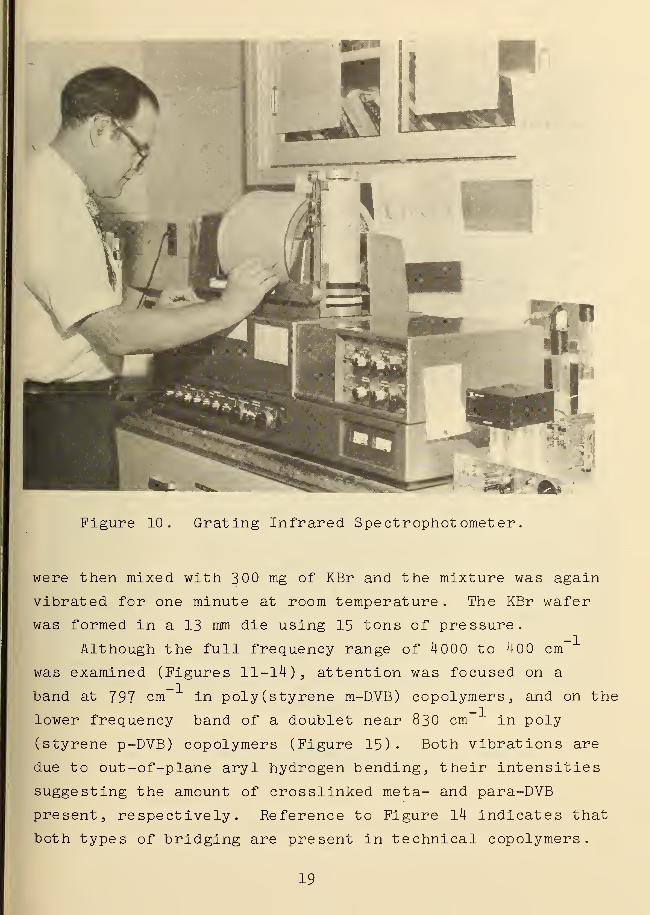
Figure 10. Grating Infrared Spectrophotometer,
were then mixed with 3 00 mg of KBr and the mixture was again
vibrated for one minute at room temperature . The KBr wafer
was formed in a 13 mm die using 15 tons of pressure.
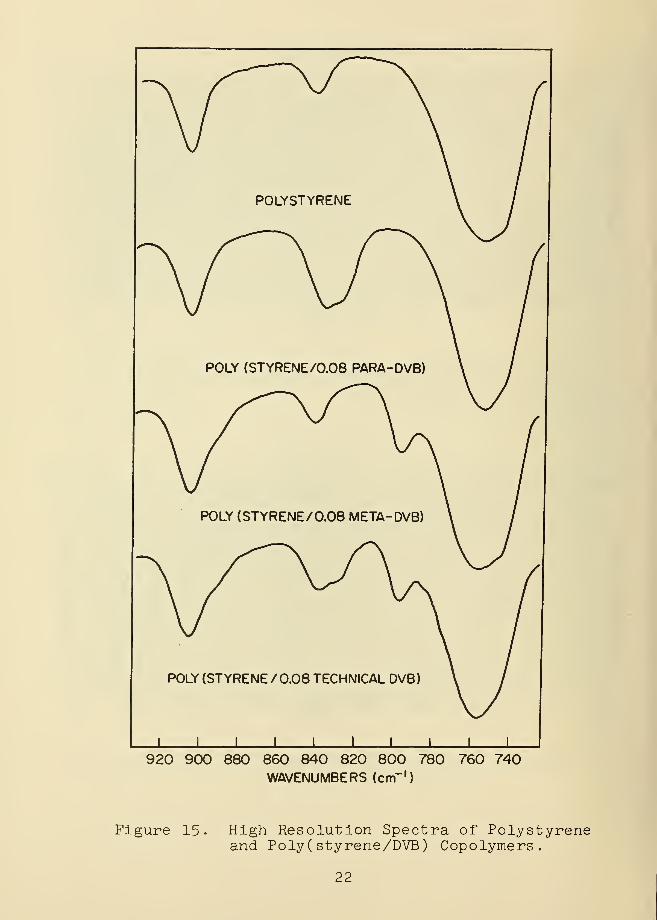
Although the full frequency range of 4 000 to 400 cm
was examined (Figures 11-14) , attention was focused on a
band at 797 cm in poly(styrene m-DVB) copolymers, and on the
lower frequency band of a doublet near 830 cm in poly
(styrene p-DVB) copolymers (Figure 15) • Both vibrations are
due to out-of-plane aryl hydrogen bending, their intensities
suggesting the amount of crosslinked meta- and para-DVB
present, respectively. Reference to Figure 14 indicates that
both types of bridging are present in technical copolymers.
19

3 i .
i 1
i
5
WAVELENGTH (MICRONS)
6 7. , i . . . . i . . , i . .
.
1
1
(1 9 10 12 15 20
inn - i «« ido 1(0
'^ r /\ A f\ A n /I
\ / \rr A f a f\<
ftn - _ r 8
\ V X •\ / l\ \ , , J'. i
Ai— -L J A /
j 1zLU a
i /
,
H
M
iVi ,
uI \ f
¥ II T\ |
LUa. AO - j
\o
1» \ (
Tt
/u 1 1
JL. | |
z1 i - - | |<
\~ AC) - | - - i > 1 ) 1
HI A- l
toZ II
U
<P? 90 - ; 9 ; | |
|_ £\J[ \' V
- — -!- 4- r—
3000 2500 2000 1800 1600 ,1400 1200 1000 800 600
WAVENUMBER (CM')
Figure 11. Infrared Spectrum of Polystyrene.
3i 1 .
I \
t
WAVELENGTH (MICRONS)
6 7 i5. 1.. .
? 10 12 15 2
100 no 100 !<
f\/IS \ A J \ A i
'A
r-.r'S \r r-> VL /
!
/l
|
JZ-4- i A_ 80i—
Ro / / so /I ^l^tu r\s\ ,//
f 3--tr'z ^ \1t 1 j
u ^* r 1 1 /
1
\f / I
111
£ 60 \1
V T1
, V \ J J'
m
1111 \ A V V i
fLUu f
:
M I/ u vl V
Jz A\<
t 40 i * J "\LZ _.. J5
to l|^ ...:r::
ZLU A -t<
g£ 20in i
i20 r
J .
/r
|f
I
1
1
1
3000 2500 2000 1800 1600 „ 1400WAVENUMBER (CM
1
)
1200 1000 800 600
Figure 12. Infrared Spectrum of Poly (styrene/0.16 p-DVB)
.
20

3i .
i I
i i
>
1
WAVELENGTH (MICRONS)
6 7. . i , , . . i . , , i .
i
,
I i 9 10 12 15 20
inn |i $ l( D
A * A
CE
(PERCENT)
88
*>
\ / y <\ A ^$/\ / \ \ V" ! ^ /\ /\
t V \ V ,./1
8»nV
I 1 s;/
fi
J1
j V A Jw
1 -v II f f A
/ « ' ' /IN V 6J «
T "1\ 1 1
U1 If1
\
,1 . \ ' 1
Z \~ r<£ 40
Inn .; 4 ,Y
nn
2V fl
i
Z 7 ""
| 20 J 3n SI a
II
1 I
u 11 1
T^iu I
1 L3 1 1
3000 2500 2000 1800 1600,
1400WAVENUMBER (CM'')
1200 1000 800 600
Figure 13. Infrared Spectrum of Poly ( styrene/0, 16 m-DVB)
.
3.
2 .
1
i
WAVELENGTH (MICRONS)
6 7 {1 9 10, , 1
12 15 2i.i.i,
« Q 100 II
IUUs *\
// \ rs
/&9 \
/"\l \cw\^\ (A- A £ 3
h- VV \
'11
flzI
/*"\
A \»l 1
J] /
||ui
/ V 1/ /l/vUJ
1 9 !,/ /J
I
V1)
IJ /^V /
i_J V
/v>I
»
\ /UJ(J
rr' \Z If
i 1
<£ 40 ID 1-4 4 J j \
M fl V1/5
'
zj<
02 9n || 3 ) a f)
l_ zu1
V
j
r\
3000 2500 2000 1800 1600, ,1400 1200 1000 800 600
WAVENUMBER (CM')
Figure 14. Infrared Spectrum of Poly ( styrene/0.16 technical DVB)
.
21
POLY (STYRENE / 0.08 TECHNICAL DVB)
_L _L 1 -L _L J_
920 900 880 860 840 820 800 780 760 740WAVENUMBERS (cm-1 )
Figure 15. High Resolution Spectra of Polystyreneand Poly ( styrene/DVB ) Copolymers.
22

Indeed, the technical DVB often employed In copolymer synthesis
usually contains less than 50 percent meta- and para-DVB (in
an approximate 2.5:1 ratio); where gas chromatographic analysis
reveals the presence of meta- and para-ethylvinylbenzene , at
least three other vinyl aromatic compounds, and two dozen other
impurities [16,17].
The relationship of infrared absorbance intensity
relative to an increasing concentration of meta-DVB in
authentic poly(styrene m-DVB) copolymers is shown in Figure 16.
No such simple relationship exists for para-DVB copolymers
however, owing to the overlapping of the aryl hydrogen out
-
of-plane band of para-DVB bridges with a band of a similar
vibrational mode due to the polystyrene chain. Computer
analysis of the digitized doublet indicated resolved bands
at 838.5 cm for the polystyrene band, and at 826.2 cm
for the para-DVB band. The correlation study of para-DVB
l 797
905
0.8
1 1 1
-
0.6 - -
0.4 ^* -
0.2
<. 1
-
0.05 0.10
MOLE FRACTION m-DVB
0.15
Figure 16 Absorbance Ratio of m-DVB Band Relationto Mole Fraction of m-DVB (Base LineMethod)
.
23

content in poly(styrene p-DVB) copolymers with infrared
absorbance intensity, will continue. The resolved doublet
curve is given in the Cal Comp plot of Figure 17. A device
for automatic digitization of infrared spectra is being
designed in our Section (Figure 18)
.
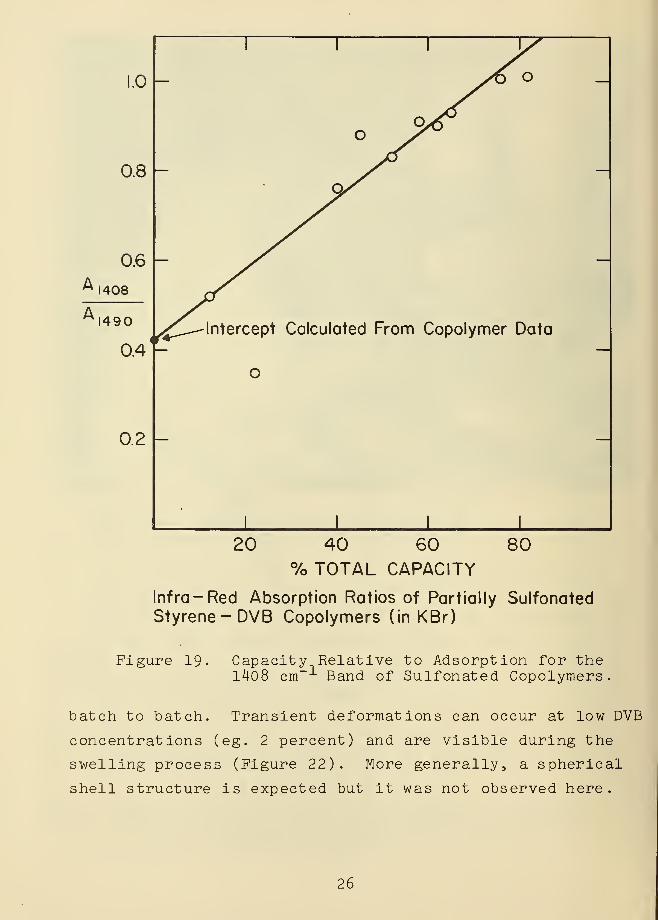
2 . Infrared Spectrophotometry of Sulfonated Copolymers
Using techniques similar to those described above, it
was found possible to quantitate the 1408 cm peak of the
spectra in partially sulfonated samples [18,19]. The
resulting curve of percent sulfonation versus absorption
(Figure 19) shows a non-zero intercept, as also noted for
m-DVB copolymers above (Figure 16 )
.
870 860 850 840 830
WAVENUMBERSfcrrr 1
)
820 810 800
Figure 17- Cal Comp Plot of Digitized Poly( styrene/0.0 8 p-DVB) Unresolved and ComputerResolved Doublet.
24
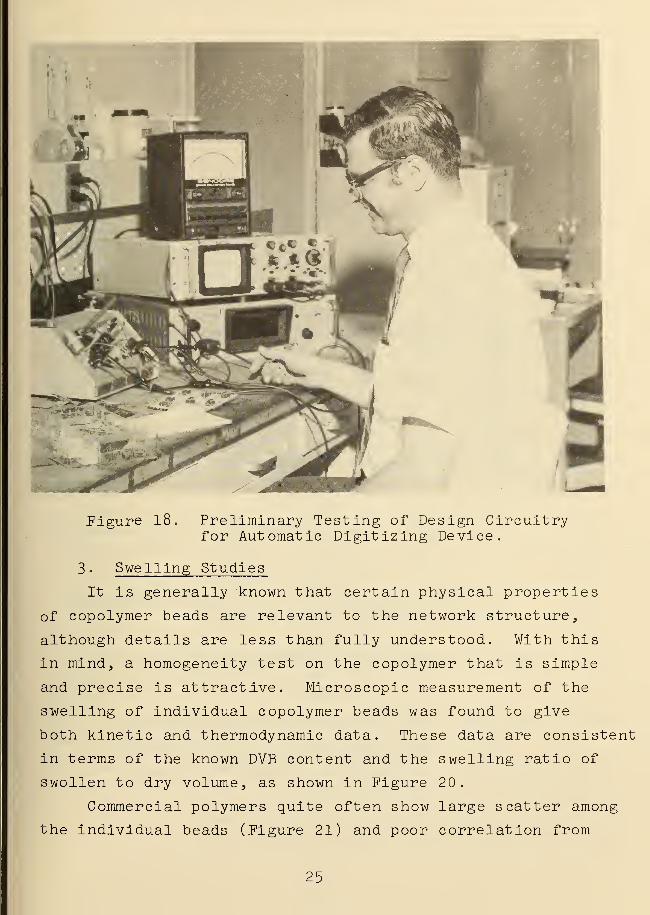
Figure 18. Preliminary Testing of Design Circuitryfor Automatic Digitizing Device.
3 . Swelling Studies
It is generally known that certain physical properties
of copolymer beads are relevant to the network structure,
although details are less than fully understood. With this
in mind, a homogeneity test on the copolymer that is simple
and precise is attractive. Microscopic measurement of the
swelling of individual copolymer beads was found to give
both kinetic and thermodynamic data. These data are consistent
in terms of the known DVB content and the swelling ratio of
swollen to dry volume, as shown in Figure 20.
Commercial polymers quite often show large scatter among
the individual beads (Figure 21) and poor correlation from
25
.0 -
0.8
0.6 -
A 1408
1490
0.4
0.2 -
—
1111/>6 o
O y/^
—
Of
—— Intercept Calculated From Copolymer Data
o
—
—
_L _L _L _L
—
20 40 60% TOTAL CAPACITY
80
Infra- Red Absorption Ratios of Partially SulfonatedStyrene-DVB Copolymers (in KBr)
Figure 19. Capacity Relative to Adsorption for the1408 cm-1 Band of Sulfonated Copolymers.
batch to batch. Transient deformations can occur at low DVB
concentrations (eg. 2 percent) and are visible during the
swelling process (Figure 22). More generally, a spherical
shell structure is expected but it was not observed here.
26

1.0
1
• m
1
Tol jene _
0.8*P gc
•P ococ
0.6 • m
•P m+p»• m
0.4 —
•P
0.2 —
1 1I _L
2% DVB
8
Swelling Data in Toluene' Volume Fraction of
Swelling <£=(q-l)/q versus Mole % DVBp=para , m = meta, c = commercial
Figure 20. Mole Fraction of DVB Isomers Relative toSwelling Fraction $ [<j> = (Q-l)/Q, whereQ = swollen bead/dry bead diameter ratio]
27

Log(too)120
1 I I T
Heterogeneous
Sample 0-119
4-C/toluene
o
o o
6>
x*
XX*
xxx^c o/ oo
Homogeneous
Sample I- II
I
4- m /toluene
1 J L
1.7 1.9 2.1 2.3
LOG BEAD DIAMETER (/im)
Figure 21. Log-Log Plot of Swelling Time Relativeto Dry Bead Diameter Showing Homogeneousand Heterogeneous Swelling.
28

Figure 22. Photomicrograph Showing HeterogeneousSwelling.
29
III. COPOLYMER AND ION EXCHANGE MICROSCOPY
A. Introduction
With the advent of the use of ion exchange particles as
carriers for chemical microstandards (see Section I), the
technological problems of observance and manipulation of
microscopic particles have demanded satisfactory solution.
It would be obvious that in order to satisfy such objec-
tives, special equipment is required and special techniques
must be employed if reliable Ion Exchange Microstandards are
to be obtained.
This section describes some of the techniques and equip-
ment which have been used in the microscopy laboratory to
obtain satisfactory results with microstandard particles.
No attempt however, is made here to explain treatment of the
materials before they arrive or after they depart this
laboratory
.
B
.
Characterization of Copolymer Beads
One of the principal functions of the microscopy laboratory
is the careful scrutinization of the various copolymer materials
as they are received from various sources. Microscopic
examinations are performed in order to determine their suit-
ability and acceptance for further research or for use as ion
exchange base material.
Photomicrographs of the materials are prepared using either
normal transmitted or polarized light. A Control Number is
assigned to each material, and all pertinent information and
observations are entered into a Control Catalog for future
reference
.
The criteria normally used to reject materials from further
study are (1) the entrappment of foreign particles in the
network, (2) non spherical or broken particles, and
(3) particles containing voids (holes) in the network. Once
a material has been accepted for further study it is separated
30
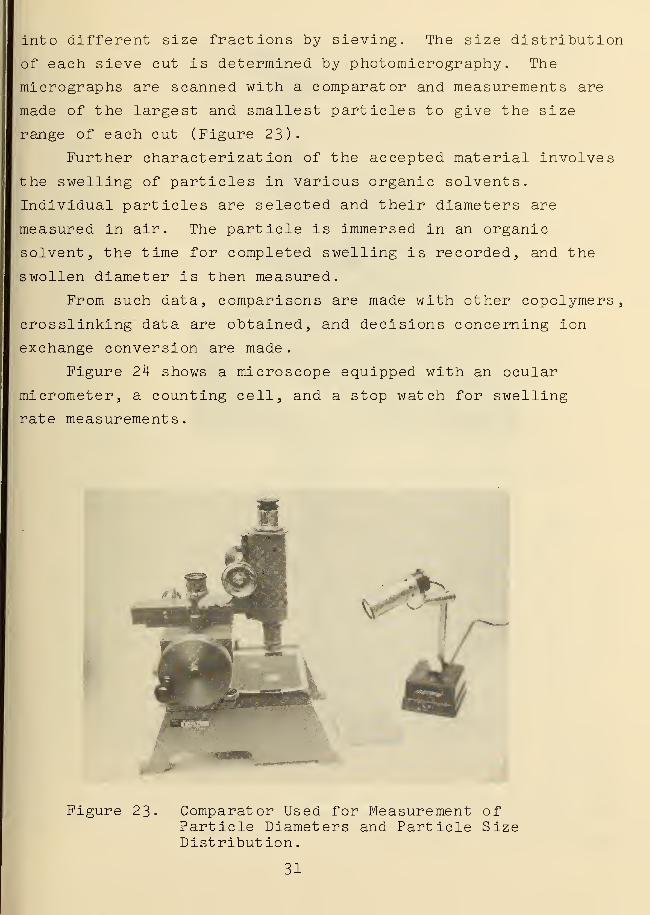
into different size fractions by sieving. The size distribution
of each sieve cut is determined by photomicrography. The
micrographs are scanned with a comparator and measurements are
made of the largest and smallest particles to give the size
range of each cut (Figure 23).
Further characterization of the accepted material involves
the swelling of particles in various organic solvents.
Individual particles are selected and their diameters are
measured in air. The particle is immersed in an organic
solvent, the time for completed swelling is recorded, and the
swollen diameter is then measured.
From such data, comparisons are made with other copolymers,
crosslinking data are obtained, and decisions concerning ion
exchange conversion are made
.
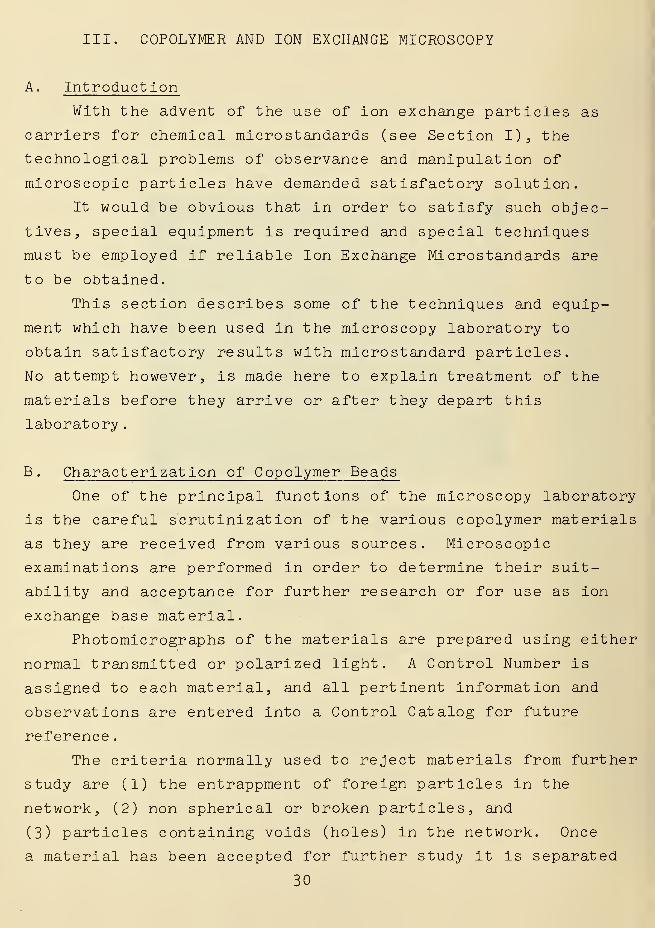
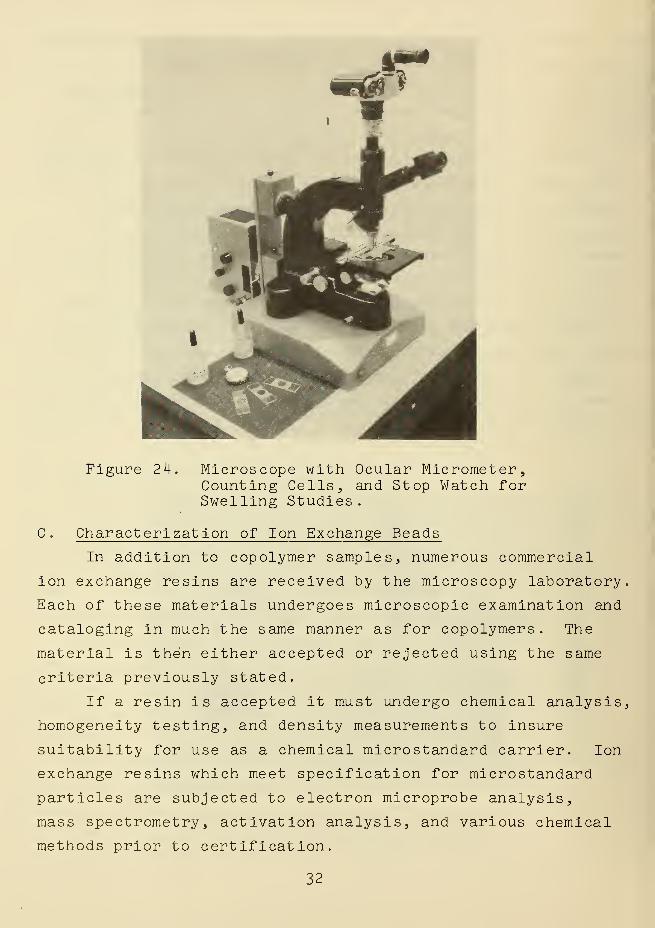
Figure 24 shows a microscope equipped with an ocular
micrometer, a counting cell, and a stop watch for swelling
rate measurements.
Jb,
«- **"
Figure 23. Comparator Used for Measurement ofParticle Diameters and Particle SizeDistribution
.
31
m
%
I
f.. T
'*Mp >*; ^pl
i^Sktr
^> .
^^r
^^Figure 24. Microscope with Ocular Micrometer,
Counting Cells, and Stop Watch forSwelling Studies
.
C . Characterization of Ion Exchange Beads
In addition to copolymer samples, numerous commercial
ion exchange resins are received by the microscopy laboratory.
Each of these materials undergoes microscopic examination and
cataloging in much the same manner as for copolymers. The
material is then either accepted or rejected using the same
criteria previously stated.
If a resin is accepted it must undergo chemical analysis,
homogeneity testing, and density measurements to insure
suitability for use as a chemical microstandard carrier. Ion
exchange resins which meet specification for microstandard
particles are subjected to electron microprobe analysis,
mass spectrometry, activation analysis, and various chemical
methods prior to certification.
32

Ion exchange particles examined by the electron micro-
probe are initially dispersed in a 0.1 percent solution of
polyisobutylene in cyclohexane and cast on a polished aluminum
or graphite disc. In the case of mass spectrometry, individual
particles of measured diameter are selected and transferred
directly to a filament which is then placed directly into the
ion chamber of the spectrometer. For activation analysis,
individually measured particles are selected following irra-
diation, and are mounted on a scintillation disc for counting.
Figure 25 shows a microscope with a micromanipulator and
some of the various mounts used for the analysis of micro-
standard particles.
Figure 25. Microscope with Micromanipulator andSpecimen Mounts for Microst andardParticles
.
33
D . The Microscopy Laboratory Facility
The microscopy laboratory is equipped to perform con-
ventional light microscopy via the use of transmitted light,
incident light, phase contrast and fluorescence, with magni-
fications up to 1500 X.
In addition to the light microscopes an electron micro-
scope is used to examine very small particles and to study
structure defects and contamination in copolymer and Ion
exchange particles. The use of the electron microscope permits
direct observations of these materials up to magnifications
of 80,000 X.
Accessories to the electron microscope permit the
stabilization of substances via a vacuum evaporator, the
shadowing of specimens, and sample sectioning and preparation
using a microtome . The photographic equipment employed for
the preparation of photomicrographs obtainable from the
laboratory's light microscopes consists of several polaroid
cameras, a 4" x 5" plate camera, and a 35 mm camera. The
electron microscope is equipped with both a 35 mm and a
2 1/4" x 2 1/4" plate camera. A photographic enlarger and a
dry rapid print processor complement this equipment.
The present capability of the microscopy facility to
observe microscopic defects, measure bead diameters with high
precision, and perform transfers of loaded ion exchange
particles-, forms a necessary and unique function in the Ion
Exchange Microstandards program.
34
IV. CHROMATOGRAPHY
A. Gas Chromatography
1 . Pi vinyl benzene
Divinylbenzene (DVB) Is widely used to prepare cross-
linked poly (styrene/DVB) copolymers which may be derivatized
(for instance, by sulfonation) to produce ion exchange resins.
The importance of conducting analytical separations of DVB
sample components is obvious in the potential extension of
such studies to preparative scale separations to obtain the
pure isomers of DVB for copolymer synthesis, as well as to
provide detailed information regarding compositional makeup
of commercial DVB.
(a) Separations on Bentone-34
Historically, most of the separations of DVB mixtures
have been performed on a column composed of a mixture of
85:15:5 parts by weight of Chromosorb W: Bentone-3^: Ucon
oil [19] s and examples of this are reported in detail in a
previous NBS report [20]. Since this information was released,
efforts were made to simulate detailed separations on Bentone-
34 of the order reported by Hannah, et_ al. [16] on Carbowax
6000 and di-2-ethylhexyl sebacate. A chromatogram representa-
tive of our work is shown in Figure 26.
(b
)
Separations on Liquid Crystals
The term "liquid crystal" implies a misomer, but in
reality such compounds evidence specific spatial structure in
the liquid state. That is to say, a liquid crystal material
does not become isotropic directly upon melting, but rather
may exhibit molecular alignment in three principal stable
structural phases prior to becoming isotropic; namely the
smectic, nematic and cholesteric phase states. Liquid crystals
as liquid phases in gas chromatographic separations provide
an extra dimension of solute selectivity based upon the spatial
geometry of their particular liquid state. Such materials
35

cnI
CD
cO-PC(D
CQ
Co
to
pc(D
coa6ooPQ>PCmO
co•H-Pctf
Mcti
VDCM
QJ
M
•H
36
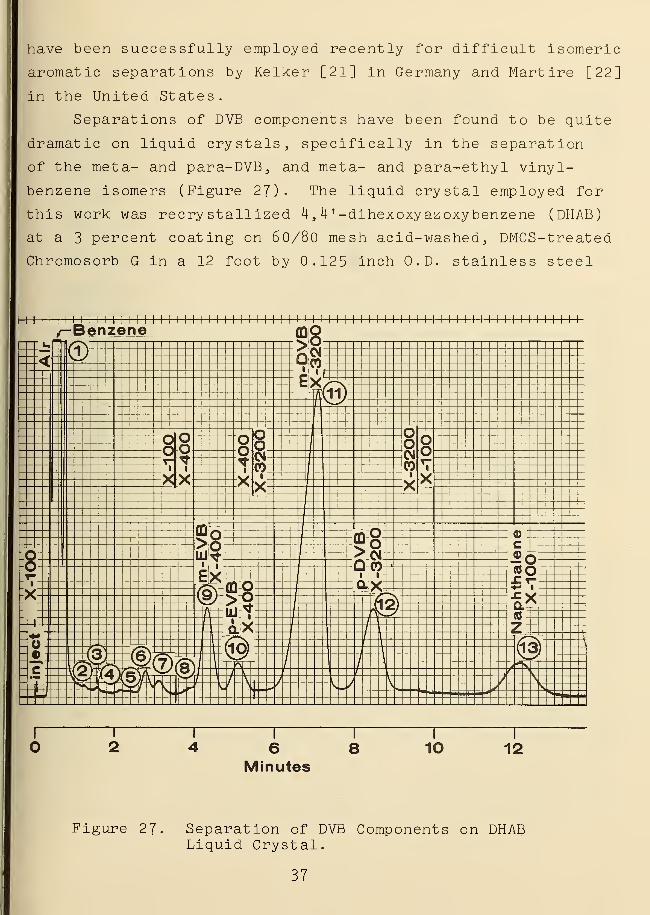
have been successfully employed recently for difficult isomeric
aromatic separations by Kelker [21] in Germany and Martire [22]
in the United States.
Separations of DVB components have been found to be quite
dramatic on liquid crystals, specifically in the separation
of the meta- and para-DVB, and meta- and para-ethyl vinyl-
benzene isomers (Figure 27). The liquid crystal employed for
this work was recry stallized 4
,
H ' -dihexoxy azoxybenzene (DHAB)
at a 3 percent coating on 60/80 mesh acid-washed, DMCS-treated
Chromosorb G in a 12 foot by 0.125 inch O.D. stainless steel
1 1 l 1 1 1 111
1 1 1 I I I I I I I I I I I I I I I I I I I I
l' I
II I I I I I I I I I M I I I I I I I I I I I I I I I I I I I I
"i 1 r4 6 8
Minutes
1
2 10 12
Figure 27. Separation of DVB Components on DHABLiquid Crystal.
37

column. The analysis shown in Figure 27 was conducted at
127 °C. This liquid crystal melts at 81.0 °C into a nematic
phase which becomes isotropic at 128.2 °C [23]. In the
nematic phase state model, the liquid crystal molecules are
arranged as non-layered parallel rods, enabling para-substituted
aromatics to "fit" into and interact with the liquid crystal
nematic phase more easily than met a and ortho substituted
derivatives. Additional distinguishing features of analyses
of DVB samples on liquid crystals relative to Bentone-34
columns provide (a) a much lower analytical temperature, (b)
a faster analysis time, and (c) a realistic scale up of meta-
and para-DVB separations to preparative scale gas chromatography
The a separation factor for meta- and para-DVB is better than
1.2 and a complete analysis can be conducted in less than 15
minutes. Complete preparative separation of all sample com-
ponents is indicated by lowering the temperature further
within the 81-128 °C nematic range. The data in Table III
provides a comparison of analysis of a DVB sample on Bentone-34
vs. DHAB liquid crystal.
(c ) Vinyl Toluene
Vinyl toluene (VT) has been examined as a candidate monomer
in place of styrene for copolymer synthesis. Gas chromato-
graphic analysis of commercial vinyl toluene, using a liquid
crystal stationary phase, has revealed the presence of the
para- (peak 5) as well as the meta-VT (peak 4) as major com-
ponents, and six minor impurities (Figure 28). Peak area
computations reveal that the meta (70.9 percent) and para
(28.8 percent) isomers compose 9 9-7 percent of the sample.
This information is essential for following reaction pathways
using a VT monomer composed of the mixed isomers.
38
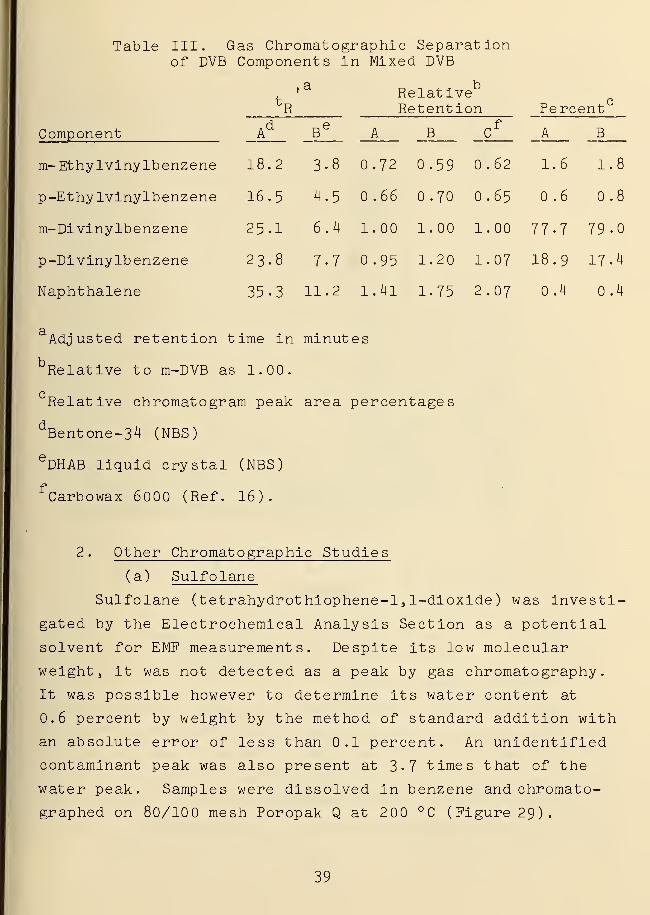
Table III. Gas Chromatographic Separationof DVB Components in Mixed DVB
Component
fc
R
a RelativeRetention Perc
A
1.6
ent
Ad
Be
3.8
A
0.72
B cf
.62
B
18.2 0.59 1.8
16.5 4.5 0.66 .70 0.65 0.6 0.8
25.1 6.4 1.00 1.00 1.00 77-7 79-0
23.8 7-7 0.95 1.20 1.07 I8.9 17.4
m- Ethylviny lb enzene
p-Ethylvinylbenzene
m-Divinylbenzene
p-Di vinylb enzene
Naphthalene 35-3 11.2 1.4l 1.75 2.07 0.4 0.4
Adjusted retention time in minutes
Relative to m-DVB as 1.00.
Relative chromatogram peak area percentages
dBentone-34 (NBS)
eDHAB liquid crystal (NBS)
fCarbowax 6000 (Ref. 16).
2 . Other Chromatographic Studies
(a) Sulfolane
Sulfolane (tetrahydrot hiophene-1, 1-dioxide ) was investi-
gated by the Electrochemical Analysis Section as a potential
solvent for EMF measurements. Despite its low molecular
weight, it was not detected as a peak by gas chromatography.
It was possible however to determine its water content at
0.6 percent by weight by the method of standard addition with
an absolute error of less than 0.1 percent. An unidentified
contaminant peak was also present at 3-7 times that of the
water peak. Samples were dissolved in benzene and chromato-
graphed on 80/100 mesh Poropak Q at 200 °C (Figure 29).
39
I I I i I I I I I I I 1 1 1 I I 1 I I I I I 1 I 1 I I I I I I 1 1 1 I I I I II I I 1 1 I
fl>z zr zr:— c:— © 1
'
2 - (2\ i± § :zzzzzzz:£)z:' zzzzzzzzzzzzzzzzzzzzzzzzzzzzzzzfi izzzzzzzzHg zzzzzzzzzzzzzzzzzzzzzzzzzzzzz:
rzzzzz: 8° =
— 1 wv '1 1± :: :QX: : :
/s\= ::= = ==(§)== = :== = :
F=z===== zzzzzzlzzzzzz zzzzzzzzzzzzzzzzzzzzz:==== ===="""== = =============="=====±===== =
IF
—
- LV ^.= V/f!s^
zi': z zzzzzzzz z zzzzzzzzzzzzzzzzzzzzzzzzzzzzz:: S- := (3) :F= : == zzzzzzzzzzzzz zzzzzzz:
= ? = F== :(2S :F"i"""""""="----------- :^±^t:b4-|t=:z^:~:~:::==^e5^|I EEe|^zzzz|z^zzz=#=z:
±±.z :: ± ± 3:
"T2
1
4Minutes
86
Figure 28. Analysis of Vinyl Toluene on DHABLiquid Crystal.
(b) 2-Methoxy Ethanol
This material, commonly known as methyl cellosolve, has
also been considered as a solvent for EMF measurements by the
Electrochemcial Analysis Section. Commercial samples were
evaluated by gas chromatographic analysis on 80/100 mesh
Poropak Q at 200 °C using a thermal conductivity detector at
a helium flow rate of 40 ml/min., for the presence of water
and volatile impurities. The peak area response factors
40

Benzene
Fig. 29 Determinationof Water inSulfolane
.
Sulfolane PeakNot Obtained
UnidentifiedContaminant
Minutes
41

calculated separately for water and 2-methoxy ethanol were
1788 and 1080 mm /mg, respectively. Methanol, cited as a
known degradation product of 2-methoxy ethanol, was not
detected. The water content of the samples was found to be
0.036 weight percent. A chromatogram showing the separation
of water, methanol, ethanol, and acetone on Poropak Q under
these conditions is shown in Figure 30.
-
A.
— 1 4.
:::~:
:'j:~l
1
P::=
,._ ..
1
H2Oo.
,
. ...L_tr 1
o.,.L_ j
. 1 ...... —
-
—<J
MeOK= r :
:
—1... ,
dl
EtC>h 1
1
—I A
- +*, — ~ p"
\
up1
" !__1— i_
~ZZXI1"
'-.zi::;<
- - t
It1
1
11 1 j
1 11
1
L> '
1 t -1\i
._ .- -T 1
'
_|r -
'
"7^ :—
<
/ B+-1
Figure 30. Separation of Volatiles on Poropak Q
(c ) Ortho-Fluorobenzoic Acid
This compound is issued as a Standard Reference Material
(SRM 1^9) for microanalysis for fluorine. Gas chromatography
of the silylated acid by temperature programming from 100 to
300 °C on 10 percent UC-W58 silicone coated on 80/100 mesh
Chromosorb W using a flame ionization detector shows that
analysis was simple and rapid.
42
3 . Gas Chromatography -Mass Spectrometry
(a) The Quadrupole Mass Spectrometer
The quadrupole mass spectrometer is different from most
other mass spectrometers because it utilizes only an electro-
static field rather than the magnetic and electrostatic fields
of conventional magnet instruments to produce a mass spectrum.
In conventional spectrometers the magnets required to produce
an adequate magnetic field are necessarily large In contrast
to the quadrupole system.
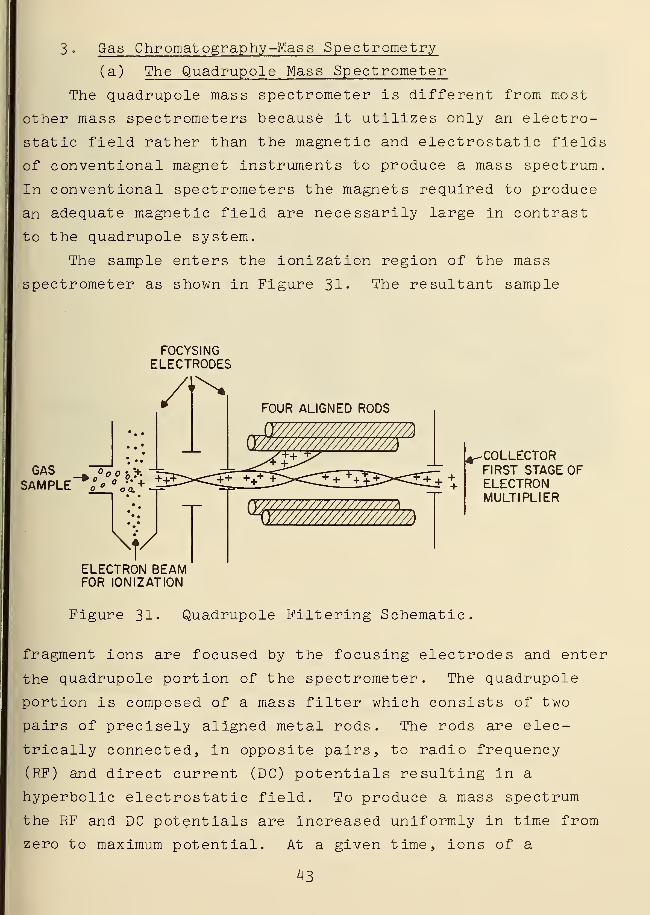
The sample enters the ionization region of the mass
spectrometer as shown in Figure 31. The resultant sample
FOCYSINGELECTRODES
GASSAMPLE'
V %==^ELECTRON BEAMFOR IONIZATION
-COLLECTORFIRST STAGE OFELECTRONMULTIPLIER
Figure 31- Quadrupole Filtering Schematic.
fragment ions are focused by the focusing electrodes and enter
the quadrupole portion of the spectrometer. The quadrupole
portion is composed of a mass filter which consists of two
pairs of precisely aligned metal rods. The rods are elec-
trically connected, in opposite pairs, to radio frequency
(RF) and direct current (DC) potentials resulting in a
hyperbolic electrostatic field. To produce a mass spectrum
the RF and DC potentials are increased uniformly in time from
zero to maximum potential. At a given time, ions of a
43

specific mass -to-charge (m/e) ratio are deflected as much
toward one rod as they are toward another. Ions of this
particular m/e value are initially excluded. As the voltages
sweep from zero to their maximum values, the entire mass range
(0 to 750 m/e) is scanned. The range thus starts at low m/e
values and increases linearly to high m/e values.
Ions which avoid deflection and traverse the field are
detected by an electron multiplier and produce an electrical
signal which is amplified, and monitored on an oscilliscope
.
A recording of the mass spectrum can be initiated at any time
by an oscillographic recorder contained within the unit to
photograph the spectrum displayed on the oscilliscope. The
system can produce a mass spectrum from m/e 10 to m/e 250 in
less than three seconds with unit mass resolution,
(b) The GC-MS Interface
The ability of the quadrupole mass spectrometer to
rapidly scan the m/e range of to 750 renders it especially
useful as a qualitative detector for organic vapors eluting
from a gas chromat ograph (Figure 32). The gas chromat ograph
however, operates at carrier gas pressures of a few atmospheres
while the MS operates at pressures in the range of 10 to
one atmosphere. In order to avoid swamping of the MS detector
with ionized bulk carrier gas (He), an interfacing assembly is
used to pump away most of the light GC carrier gas thereby
enriching the gas stream entering the MS in sample eluent
.
The interfacing assembly is shown in Figure 33'
Gas flowing into portion A proceeds to the capillary
portion D. In order to gain access to the MS, the gas must
traverse the distance between capillaries D and C. The
presence of a vacuum at this point removes most of the light
helium carrier gas molecules from their D to C trajectory.
Solutes of sufficient momentum (greater mass) eluting from
the GC, proceed to point C and enter the mass spectrometer.
44

Figure 32. The GC-Mass Spectrometer System
FRITTED GLASS
B C D
TO MASSSPECTROMETER
\ It
\
TO VACUUM
FROM GASCHROMATOGRAPH
Figure 33. Schematic of GC-MS Interface
45
The utility of combined gas chromatography-mass
spectrometry will undeniably lend strong analytical support
to the programs of the Separation and Purification Section
in the areas of applied and basic research and development.
This instrumentation is presently being applied to the
identification of unknown components present in commercial
divinylbenzene j and will be extended to the identification of
isolated contaminants in clinical Standard Reference Materials.
B. Liquid Chromatography
1. Introduction
Recent developments leading to improved resolution and
faster analysis in ion exchange and liquid-liquid chromatog-
raphy have resulted in a resurgence of interest in these
analytical techniques. Efficiencies and elution times in
optimized systems can be made to approach those commonly
experienced in gas chromatography. Column efficiencies in
liquid systems may be expressed by theoretical equations
analogous in form to the modified van Deemter equation for
gas-liquid chromatography. An important exception is that
the diffusion coefficient in liquids is four orders of mag-
nitude smaller than in gases. The ability of a system to
provide resolution is governed by the smallness and size
uniformity of the particles employed as column packing material,
the uniformity of the packed bed, the thinness of the film or
ion exchange l^yer coating the particle, the smallness of
sample sizes introduced into the column (which creates a
requirement for sensitive detectors), and the narrowness of
the column bore to minimize trans-column flow variations.
All of these factors are pointed toward minimizing the
theoretical plate height for a given column length and solvent
carrier flow rate. The use of very small particles (10-50
microns in diameter) produces a sizeable resistance to flow
such that, to insure that retention times of solutes are not
prohibitive, pressures on the order of 100-1000 p.s.i. are
46

used with thick-walled glass columns (for example: 0.25" I.D.
with a 0.125" wall). Pressures as great as 3000 p.s.i. or
higher require the use of stainless steel columns, where
column bore diameters as small as 2 mm are appropriate.
2 . Instrument Design
A liquid chromatograph suitable for liquid-liquid,
liquid-solid, and ion exchange is presently in use in our
laboratories. High inlet pressures require reliable pumps.
A precolumn or a presaturated carrier solvent reservoir is
used with liquid-liquid chromatography to presaturate the
mobile solvent phase, which should be adequately degassed to
avoid the escape of air bubbles at the low pressure end of
the column or in the detector. Pressures and liquid flow
rates are carefully monitored, and the feature of measured
column thermostatting is desirable. The injection port should
not allow the entrance of air upon sample injection, and a
high-quality high-pressure valve with a changeable sample
loop (as used by Scott at ORNL ) has been concluded to be
nearly ideal. However, septum injection utilizing .a double
septum in the injection port has also been found to work well
at inlet pressures up to 800 p.s.i. (Figure 3^) • The con-
nection from the column exit to the detector flow cell inlet
(Figure 35) and the flow cell itself should be as small in
volume as possible. Finally, the detector should be highly
sensitive to compositional changes in the column effluent,
having a low electronic noise level, fast response, and
preferably low selectivity to solute type. Although no
specific detectors are suggested, the differential refractive
index detector and the ultraviolet photometric detector
(Laboratory Data Control, Danbury, Connecticut), and the
microadsorption detector (under investigation at Oak Ridge
National Laboratories), are detection devices which we have
considered. Acknowledgment for considerable assistance
obtained in suggestions and informative discussions are owed
47

"iT"
'
Figure 34. Sample Inlet System for Septum Injection.
to Dr. Paul B. Hamilton (Alfred I. du Pont Institute,
Wilmington, Delaware), Dr. Charles Scott (Oak Ridge National
Laboratories, , Oak Ridge, Tennessee) and Dr. Jack Kirkland
(E. I. du Pont de Nemours, Wilmington, Delaware), among many
others
.
3 . Clinical Standard Reference Materials - Bilirubin
Liquid chromatography permits the analysis of underiva-
tized high molecular weight, heat-labile compounds which may
not be successfully analyzed by gas chromatography. Numerous
and diverse clinical materials of a biological nature tend to
fall into this domain. The necessity for accurate separation
and measurement of impurities in such compounds forms a part
of our clinical Standard Reference Materials program. The
Analytical Chemistry Division is involved in the examination
of bilirubin samples obtained from various sources. The
bilirubin molecule contains two vinyl, two propionic acid,
four methyl, and two tautomeric hydroxyl residues, attached
48
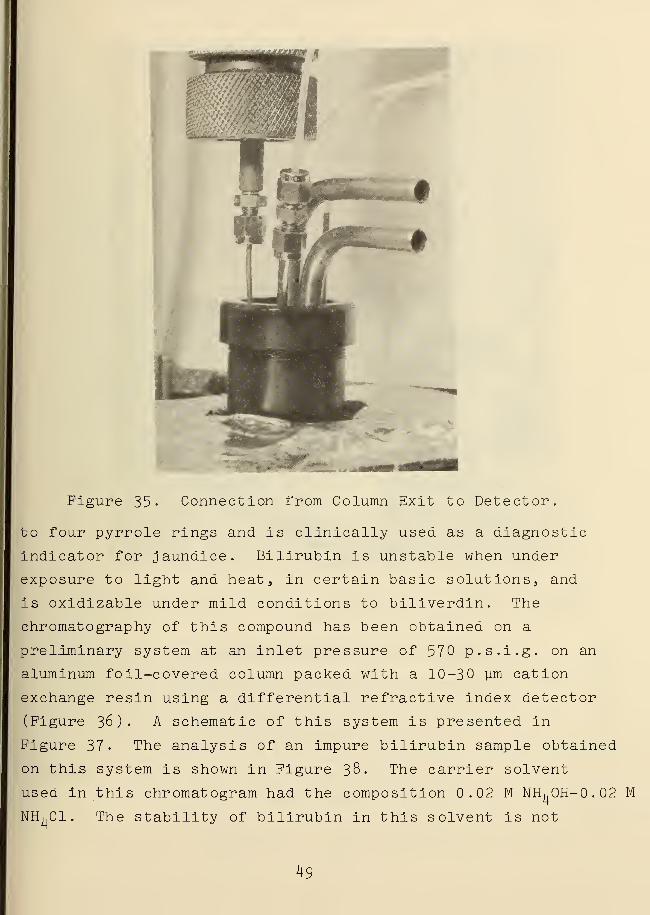
Figure 35- Connection from Column Exit to Detector.
to four pyrrole rings and is clinically used as a diagnostic
indicator for jaundice. Bilirubin is unstable when under
exposure to light and heat, in certain basic solutions, and
is oxidizable under mild conditions to biliverdin. The
chromatography of this compound has been obtained on a
preliminary system at an inlet pressure of 570 p.s.i.g. on an
aluminum foil-covered column packed with a 10-30 urn cation
exchange resin using a differential refractive index detector
(Figure 36). A schematic of this system is presented in
Figure 37- The analysis of an impure bilirubin sample obtained
on this system is shown in Figure 38. The carrier solvent
used in this chromatogram had the composition 0.02 M NHkOH-0.02 M
NHhCl. The stability of bilirubin in this solvent is not
49

Figure 36. Preliminary Ion Exchange ChromatographicSy stem.
ideal. Other solvents for the chromatography of bilirubin are
being considered. Its chromatography in dimethylsulfoxide
(DMSO), an excellent solvent for bilirubin, is under investi-
gation. Spectrophotometric measurements in DMSO gave a
comparable final reading (0.795 A) to the initial reading
(0.79^ A) over a period of forty minutes. The molar extinction
coefficient for bilirubin in DMSO was calculated from this
data to be 61.92 x 10 3.
50

n it
A. Hot plate supporting solvent reservoirB
.
PumpC. Sample inlet (syringe injection)D. Pressure gaugeE. Analytical columnF. Detector (R.I. or U.V.)G. Recorder
Figure 37. Schematic of Ion Exchange ChromatographicSystem.
51
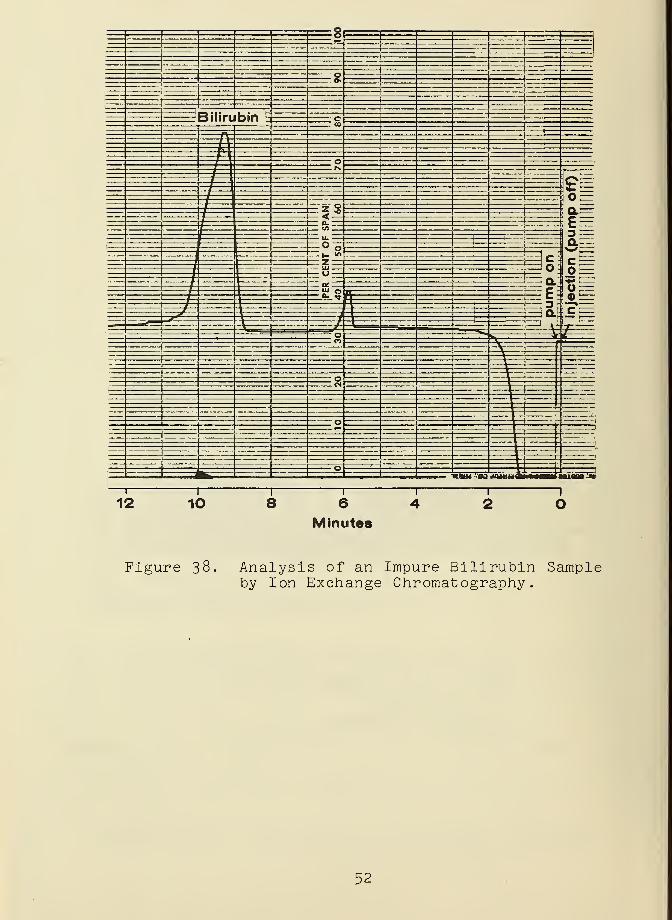
12 10i
81
6Minutes
2~l
O
Figure 38. Analysis of an Impure Bilirubin Sampleby Ion Exchange Chromatography.
52
V. REAGENTS
A. Introduction
The increasing sensitivity of instrumental analysis,
coupled with the rising significance of trace impurities in
wet chemical analysis, necessitates the availability of
reagents whose purity criteria far exceed those of the normal
"CP" or "reagent grade" classification. This is especially
true at the National Bureau of Standards where reagents with
impurities measurable in parts per billion must now be
available. When reagents in this purity range are needed in
the Analytical Chemistry Division it is the obligation of
this Section to make them available.
While formerly it was necessary to synthesize such
materials ourselves, the potential market in ultra pure
chemicals has encouraged commercial firms to expand in a
direction to fulfill this need. The more common chemicals
can be purchased in quantity, while more specialized ones
can often be obtained by specific order. These aspects of
our reagent program are covered in Section B, below. There
are, however, instances when commercial sources cannot answer
our problems, and the synthetic work must be done by this
Section, as is discussed in Section C, below.
In addition to fulfilling the immediate needs for ultra
purity in the reagent field, research on certain aspects of
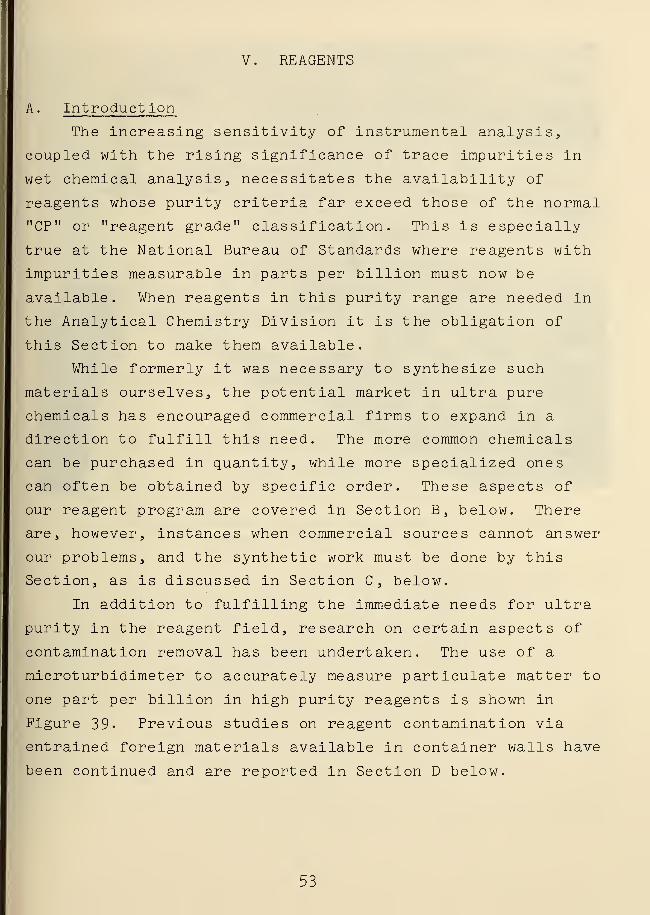
contamination removal has been undertaken. The use of a
microturbidimeter to accurately measure particulate matter to
one part per billion In high purity reagents is shown In
Figure 39- Previous studies on reagent contamination via
entrained foreign materials available in container walls have
been continued and are reported in Section D below.
53
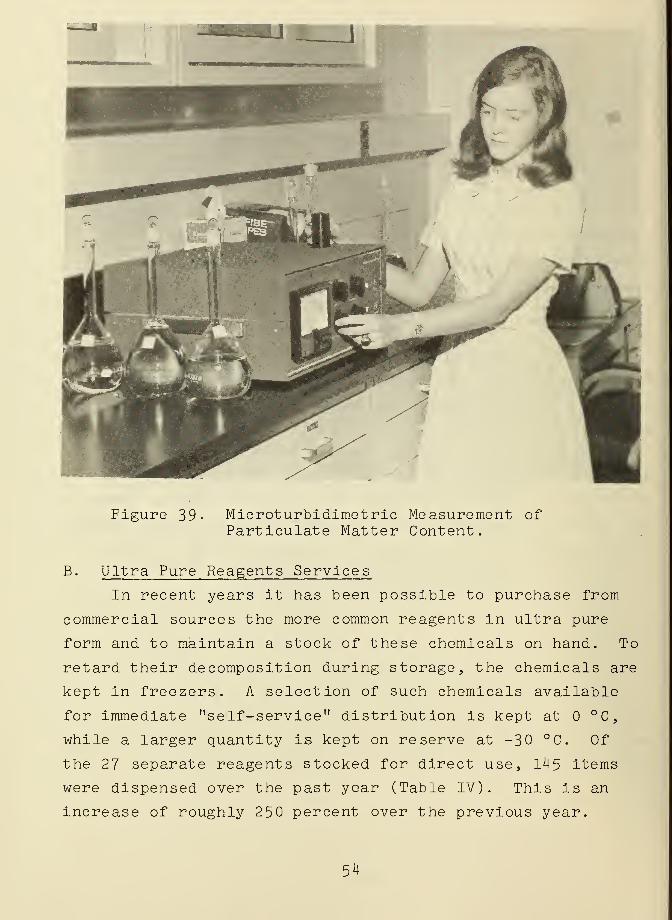
Figure 39 • Microturbidimetric Measurement ofParticulate Matter Content.
B. Ultra Pure Reagents Services
In recent years it has been possible to purchase from
commercial sources the more common reagents in ultra pure
form and to maintain a stock of these chemicals on hand. To
retard their decomposition during storage, the chemicals are
kept in freezers. A selection of such chemicals available
for immediate "self-service" distribution is kept at °C,
while a larger quantity is kept on reserve at -30 °C. Of
the 27 separate reagents stocked for direct use, 145 items
were dispensed over the past year (Table IV). This is an
increase of roughly 250 percent over the previous year.
54
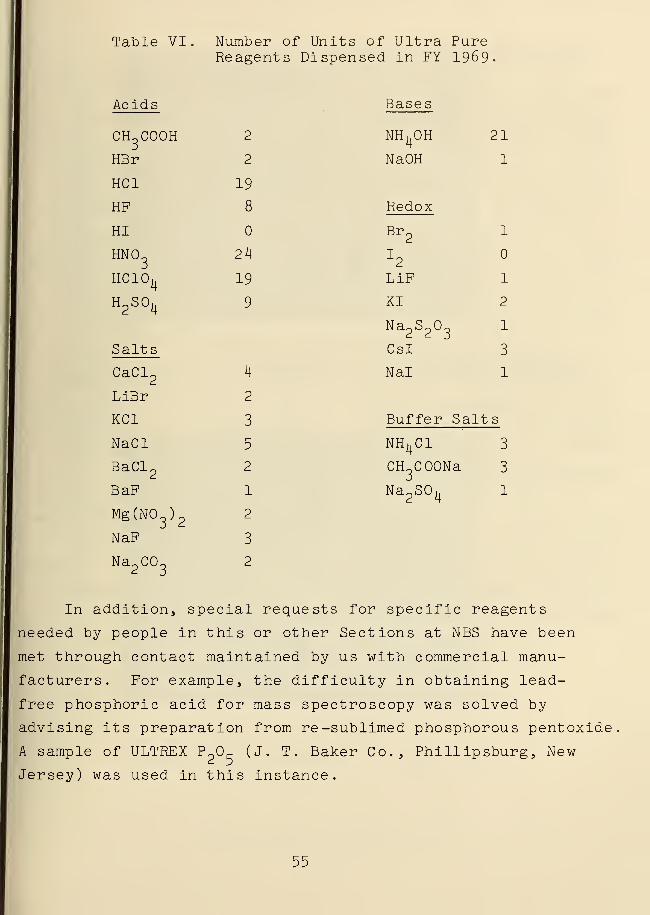
Table VI. Number of Units of Ultra PureReagents Dispensed in FY 1969«
Acids Bases
CH COOH 2
HBr 2
HC1 19
HF 8
HI
HNO- 24
HCIO^ 19
H o S0,, 9
NH^OH 21
NaOH 1
Redox
Salts
CaCl2
4
LiBr 2
KC1 3
NaCl 5
BaCl2
2
BaF 1
Mg(N03
)2
2
NaF 3
Na2CO^ 2
Br2
1
hLiF 1
KI 2
Na2S2 0^
1
Csl 3
Nal 1
Buffer Salt s
NH^Cl 3
CH COONa 3
Na2SO^ 1
In addition, special requests for specific reagents
needed by people in this or other Sections at NBS have been
met through contact maintained by us with commercial manu-
facturers. For example, the difficulty in obtaining lead-
free phosphoric acid for mass spectroscopy was solved by
advising its preparation from re-sublimed phosphorous pentoxide
A sample of ULTREX P^ (J. T. Baker Co., Phillipsburg, New
Jersey) was used in this instance.
55
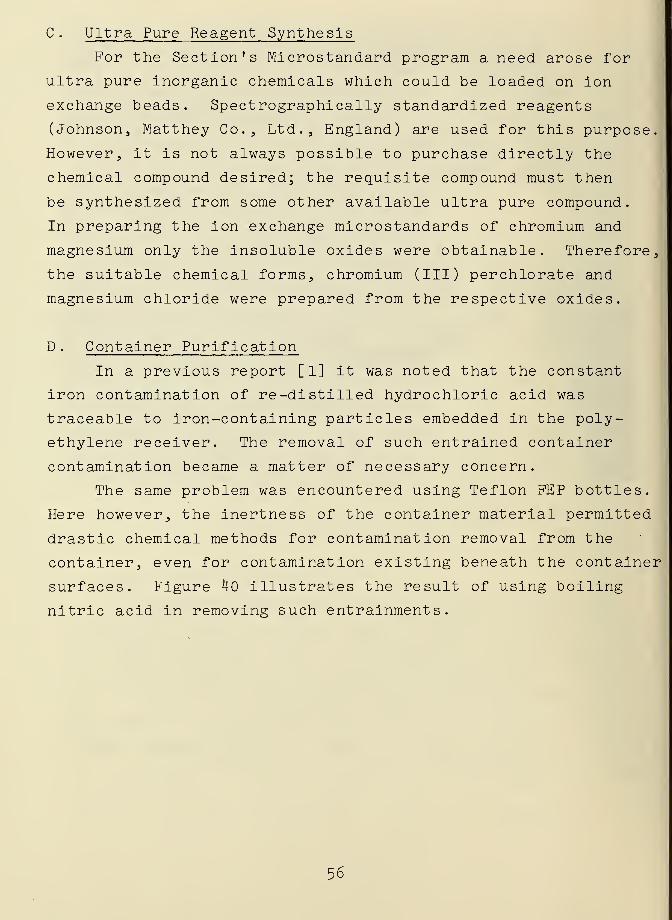
C
.
Ultra Pure Reagent Synthesis
For the Section's Microstandard program a need arose for
ultra pure inorganic chemicals which could be loaded on ion
exchange beads. Spectrographically standardized reagents
(Johnson, Matthey Co., Ltd., England) are used for this purpose.
However, it is not always possible to purchase directly the
chemical compound desired; the requisite compound must then
be synthesized from some other available ultra pure compound.
In preparing the ion exchange microstandards of chromium and
magnesium only the insoluble oxides were obtainable. Therefore,
the suitable chemical forms, chromium (III) perchlorate and
magnesium chloride were prepared from the respective oxides.
D
.
Container Purification
In a previous report [1] it was noted that the constant
iron contamination of re-distilled hydrochloric acid was
traceable to Iron-containing particles embedded in the poly-
ethylene receiver. The removal of such entrained container
contamination became a matter of necessary concern.
The same problem was encountered using Teflon PEP bottles.
Here however, the inertness of the container material permitted
drastic chemical methods for contamination removal from the
container, even for contamination existing beneath the container
surfaces. Figure 40 illustrates the result of using boiling
nitric acid in removing such entrainments
.
56
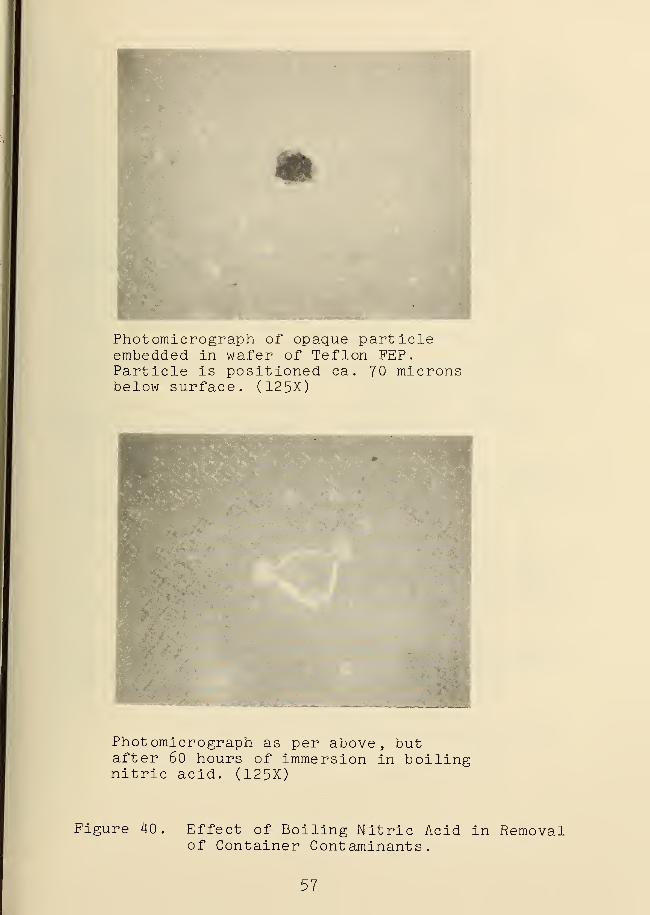
Photomicrograph of opaque particleembedded in wafer of Teflon PEP.Particle is positioned ca . 70 micronsbelow surface. (125X)
Photomicrograph as per above, butafter 60 hours of immersion in boilingnitric acid. (125X)
Figure 40 . Effect of Boiling Nitric Acid in Removalof Container Contaminants.
57

VI. PERSONNEL AND ACTIVITIES
A . Personnel Listing
Separation and Purification Section
David H. Freeman, Section ChiefJanice M. Hurst, Secretary
Ion Exchange
Rosalie Angeles (Part time)Lawrence Morgenthaler (Summer faculty participant
from Georgetown University)Robert Young (Summer student participant from
Georgetown University)
Chromatographic Separations
William DorkoDelmo EnagonioWalter ZielinskiSister Laura Turbini (National Science Foundation
Summer Institute for Teachersof Physics and Chemistry)
Particulate and Microscopic Studies
Patti Byrne (Guest Student Worker, University ofDelaware
)
Jane Doyle
High Purity Reagents
Edwin KuehnerGerald Sleater
Microscopic Standards
Herbert DixonVincent Story
Youth Opportunity Corps
Linda GantSylvia Prather
58

B. Talks
1. D. H. Freeman , W. F. Rittner, "Studies of Ion ExchangeResin Structure," 156th National Meeting of the AmericanChemical Society, Atlantic City, New Jersey. September11, 1968.
2. D. H. Freeman, "Particles in Solution by Laser-LightScattering," Scientific Apparatus Makers Association,National Bureau of Standards. September 17, 1968.
3- D. H. Freeman, "Microstandards for Activation Analysis,"1968 International Conference on Modern Trends inActivation Analysis, National Bureau of Standards.October 8, 1968.
4. D. H. Freeman, "Ion Exchange Resin Standards: Character-ization and Applications," Howard University, Washington,D. C. November 21, 1968.
5. D. H. Freeman, "Chemical Microstandards," American Micro-chemical Society, Hoboken, New Jersey. December 12, 1968.
6. D. H. Freeman, "Chemical Microstandards," AmericanChemcial Society, 4th Annual Middle Atlantic RegionalMeeting, Washington, D. C. February 13, 1969-
7. D. H. Freeman, "Chemical Microstandards," 20th PittsburghConference on Analytical Chemistry and Applied Spectroscopy,Cleveland, Ohio. March 5, 1969.
8. D. H. Freeman, "Studies of Ion Exchange Networks,"Georgetown University, Washington, D. C. March 19, 1969-
9. W. L. Zielinski, Jr., "High-Resolution Liquid Chromatog-raphy," Washington Gas Chromatography Discussion Group,Rockville, Maryland. May 15, 1969.
10. D. H. Freeman, "Light Scattering Measurements of Sub-PPMConcentrations of Liquid-borne Particulate Matter,"1969 ASTM Convention, Atlantic City, New Jersey.June 23, 1969.
59
C. Publications
1. D. H. Freeman, "Separation and Purification Section:Summary of Activities July 1967 to June 1968, " NBSTechnical Note 459, (1968).
2. D. H. Freeman, Book Review: "AnalaR Standards forLaboratory Chemicals," Anal. Chem. 4_0, 75A (1968).
3. D. H. Freeman and E. C. Kuehner, "Containers for PureSubstances," (Chapter 30) in Purification of Inorganicand Organic Materials , Marcel Dekker, Inc., New York,N. Y., 299-306 (196b).
4. D. H. Freeman, W. L. Zielinski, Jr., and W. F. Rittner,"Recognition of Crosslinking in the Infrared Spectra ofPoly ( styrene/divinylbenzene )
," accepted for publication
in the Proceedings of the International Conference onIon Exchange in the Process Industries.
5. D. H. Freeman, Book Review: "Reagent Chemicals," Anal.Chem., 41, 87A (1969).
60

VII. REFERENCES
[ 1] National Bureau of Standards Technical Bote 439 3 D. H.
Freeman, Ed., December 1968.
[ 2] Kuehner, E. C. and Freeman, D. H. , "Purification ofInorganic and Organic Materials j" M . Zief, Ed., MarcelDekker, Inc., New York, N. Y., 1969, Chapter 30, p. 297-
[ 3] Nelson, F., Murase, T., and Kraus, K. A., J. Chromatog ._,
13, 503 (1964).
[ 4] Freeman, D. H. , Currie, L. A., Kuehner, E. C, Dixon,H. D., and Paulson, R. A., "Chemical Micro standards ,
"
submitted to Anal. Chem. for publication.
[ 5] National Bureau of Standards Technical Note 505 3 J. K.Taylor, Ed. , 1969-
[ 6] National Bureau of Standards Technical Note 504 3 0.Menis, Ed., 1969.
[ 7] Provisional Certificate 1800, Microstandard Ion ExchangeBeads, Calcium Loaded, N.B.S., 1969 (see Fig. 6).
[ 8] Wiley, R. H. and Venkatachalam, T. K., J. Poly. Sci. 3 4 3
1982 (1966).
[ 9] Ref. [8]; and Ref. [1], p. 19.
[10] This Report; and Ref. [11].
[11] Winslow, F. H. and Matreyek, W. , Ind. Eng
.
3 43 3 1108(195D.
[12] Boyd, G. E. and Soldano, B. A., Z. Electrochem. 3 57 3
162 (1953).
[13] Ref. [1], p. 6.
[14] Pepper, K. W. , J. Appl. Chem. 3 l 3 124 (1951).
[15] Wheaton, R. M. and Hatch, M. J., in "Ion Exchange,"Vol. II., J. Marinsky, Ed., Marcel Dekker, Inc., NewYork, N. Y. , 1969, p. 200.
[16] Hannah, R. E., Cook, M. L. and Blanchette, J. A., Anal.Chem. 3 39 3 358 (1967).
[17] Zielinski, W. L. Jr., personal communication.
61

REFERENCES (Con't)
[18] Freeman, D. H. and Aiyar, A. S., Anal. Chem. 3 39 3 ll4l(1967).
[19] Wiley, R. H., Allen, J. K., Chang, S. P., Musselman,K. E. , and Venkatachalam, T. K. , J. Phys. Chem. 3 68 3
1176 (1964).
[20] Ref. [1], p. 21.
[21] Kelker, H. and von Schivizhoffen, E., "Advances inChromatography 3
" Vol. 6, J. C. Giddings and R. A. Kelker,Eds., Marcel Dekker, Inc., New York, N. Y., 1968, p. 247.
[22] Martlre, D. E., Blasco, P. A., Carone , P. F. , Chow, L. C.
and Viclni, H., J. Phys. Chem. 3 72 3 3489 (1968).
[23] Chow, L. C. and Martire, D. E., J. Phys. Chem. 3 73,1127 (1969).
* V. 8. GOVERNMENT PRINTING OFFICE : 1 970— 392-2^9/1 1
1
62