
SEPARATE FINANCIAL STATEMENTS FOR THE THREE ENDED … · 2012-05-24 · FOR THE THREE MONTHS ENDED...
46
Ssangyong Motor Company SEPARATE FINANCIAL STATEMENTS FOR THE THREE ENDED March 31, 2012 AND INDEPENDENT ACCOUNTANTS’ REVIEW REPORT
Transcript of SEPARATE FINANCIAL STATEMENTS FOR THE THREE ENDED … · 2012-05-24 · FOR THE THREE MONTHS ENDED...

Ssangyong Motor Company SEPARATE FINANCIAL STATEMENTS FOR THE THREE ENDED March 31, 2012 AND INDEPENDENT ACCOUNTANTS’ REVIEW REPORT

Deloitte Anjin LLC9F., One IFC,23, Yoido-dong,Youngdeungpo-gu, Seoul150-945, Korea
Tel : +82 (2) 6676 1000Fax: +82 (2) 6674 2114www.deloitteanjin.co.kr
Deloitte refers to one or more of Deloitte Touche Tohmatsu Limited, a UK private company limitedby guarantee, and its network of member firms, each of which is a legally separate and independent entity. Please see www.deloitte.com/kr/about for a detailed description of the legal structure of Deloitte Touche Tohmatsu Limited and its member firms. Member of Deloitte Touche Tohmatsu Limited.
Independent Accountants’ Review Report English Translation of a Report Originally Issued in Korean To the Shareholders and Board of Directors of Ssangyong Motor Company: We have reviewed the accompanying separate interim financial statements of Ssangyong Motor Company (the “Company”). The financial statements consist of the statements of financial position as of March, 31, 2012, the statements of comprehensive income, the statements of changes in shareholders’ equity and cash flows for the three months ended March 31, 2012 and 2011, and a summary of significant accounting policies and other explanatory information. Management’s responsibility for the separate financial statements The Company’s management is responsible for the preparation and fair presentation of the accompanying separate interim financial statements and for such internal control as management determines is necessary to enable the preparation of financial statements that are free from material misstatement, whether due to fraud or error. Independent accountants’ responsibility Our responsibility is to express a conclusion on the accompanying interim financial statements based on our review. We conducted our review in accordance with standards for review of interim financial statements in the Republic of Korea. A review is limited primarily to inquiries of company personnel and analytical procedures applied to financial data, and this provides less assurance than an audit. We have not performed an audit and, accordingly, we do not express an audit opinion. Review conclusion Based on our review, nothing has come to our attention that causes us to believe that the accompanying separate interim financial statements of the Company are not presently fairly, in all material respects, in accordance with Korean International Financial Reporting Standards (K-IFRS) 1034 Interim Financial Reporting Other matters We have given an opinion on the comparative statement of financial position as of December 31, 2011 and the related statements of operations, retained earnings, and cash flows on March 14, 2012 as fairly state. there is no difference in terms of importance between comparative purposed financial position on December 31, 2011 and current financial position. Emphasis of matter We draw attention to Note 2 to the financial statements which describes that the Company is not required to submit consolidated interim financial statements even if it has subsidiaries which are subject to consolidation in accordance with K-IFRS and may submit SEPARATE semi-annual and quarterly financial statements only by a fiscal year starting from January 1, 2012 pursuant to the Enforcement Decree of the Financial Investment Services and Capital Market Act No. 20947, Article 23.
May 8, 2012 Notice to Readers
This report is effective as of May 8, 2012, the accountants’ review report date. Certain subsequent events or circumstances may have occurred between this review report date and the time the report is read. Such events or circumstances could significantly affect the accompanying separate interim financial statements and may result in modifications to the accountants’ review report.

SSANGYONG MOTOR COMPANY
SEPARATE STATEMENTS OF FINANCIAL POSITION
AS OF MARCH 31, 2012 AND DECEMBER 31, 2011
Korean Won India- Rupee
March 31, 2012 January 31,2011 March 31, 2012 January 31,2011
(In thousands) (In thousands)
ASSETS
CURRENT ASSETS:
Cash and cash equivalents (Notes 3 and 32)
₩ 235,748,862 ₩ 202,509,810 Rs. 10,726,573 Rs. 9,214,196
Trade and other receivables, net (Notes 5,31 and 32)
193,859,100 176,137,064 8,820,589 8,014,236
Inventories, net (Notes 6 and 9)
273,554,173 258,859,471 12,446,715 11,778,106
Other current assets (Note 8)
10,832,814 16,175,012 492,893 735,963
Total current assets
713,994,949 653,681,357 32,486,770 29,742,501
NON-CURRENT ASSETS:
Non-current financial instruments (Notes 3 and
32)
6,000 6,000 273 273 Non-current available-for-sale financial assets
(Notes 4 and 32)
560,000 560,000 25,480 25,480 Non-current other receivables, net (Notes 5,31
and 32)
36,699,713 37,593,793 1,669,837 1,710,518 Property, plant and equipment, net (Notes 9 and
11)
1,040,151,028 1,038,426,146 47,326,872 47,248,390
Intangible assets (Note 10)
58,715,089 64,396,704 2,671,537 2,930,050
Investments in subsidiaries (Note 7)
4,456,554 4,456,554 202,773 202,773
Other non-current assets (Note 8)
498,738 569,242 22,693 25,901
Total non-current assets
1,141,087,122 1,146,008,439 51,919,465 52,143,385
TOTAL ASSETS
1,855,082,071 1,799,689,796 84,406,235 81,885,886
LIABILITIES AND SHAREHOLDERS’ EQUITY
CURRENT LIABILITIES:
Trade and other payables (Notes 17 and 32)
483,360,474 384,521,594 21,992,902 17,495,733
Short-term borrowings (Notes 9, 11 and 32)
30,268,050 40,567,689 1,377,196 1,845,830
Provision for product warranties (Note 14)
47,254,937 47,093,611 2,150,100 2,142,759 Other current liabilities borrowings (Notes 13,
15 and 32)
44,837,412 45,518,171 2,040,102 2,071,077
Total current liabilities
605,720,873 517,701,065 . 27,560,300 . 23,555,399
(Continued)

SSANGYONG MOTOR COMPANY
SEPARATE STATEMENTS OF FINANCIAL POSITION
AS OF MARCH 31, 2012 AND DECEMBER 31, 2011
Korean Won India- Rupee
March 31, 2012 January 31,2011 March 31, 2012 January 31,2011
(In thousands) (In thousands)
NON-CURRENT LIABILITIES:
Debentures (Notes 11 and 32)
₩ 95,404,765 ₩ 95,404,765 Rs. 4,340,917 Rs. 4,340,917
Other non-current payables (Notes 15, and 32)
2,170,890 2,150,548 98,775 97,850
Retirement benefit obligation (Note 16)
186,621,990 184,985,910 8,491,301 8,416,859
Other long-term employee benefits obligation
11,667,707 11,315,781 530,881 514,867
Provision for long-term product warranties (Note 14)
74,435,015 74,914,225 3,386,793 3,408,597
Total non-current liabilities
370,300,367 368,771,229 16,848,667 16,779,090 TOTAL LIABILITIES
976,021,240 886,472,294 44,408,967 40,334,489
SHAREHOLDERS’ EQUITY:
Capital stock (Notes 18)
609,809,205 609,809,205 27,746,319 27,746,319 Other capital surplus (Note 19)
125,496,967 125,496,967 5,710,112 5,710,112
Retained earnings (accumulated deficit) (Note 20 and 24)
(2,398,750) 193,310 (109,143) 8,796
Other comprehensive income(Notes 21)
146,153,409 177,718,020 6,649,980 8,086,170
TOTAL SHAREHOLDERS’ EQUITY
879,060,831 913,217,502 39,997,268 41,551,397
TOTAL LIABILITIES AND SHAREHOLDERS’ EQUITY
₩ 1,855,082,071 ₩ 1,799,689,796 Rs. 84,406,235 Rs. 81,885,886
See accompanying notes to the financial statements.

SSANGYONG MOTOR COMPANY
SEPARATE STATEMENTS OF LOSS AND COMPREHENSIVE LOSS
FOR THE THREE MONTHS ENDED MARCH 31, 2012 AND 2011
Korean Won India- Rupee
Three months ended
March 31, 2012
Three months ended
March 31, 2011
Three months ended
March 31, 2012
Three months ended
March 31, 2011
(In thousands, except per share amounts) (In thousands, except per share amounts)
SALES (Notes 30 and 31) ₩ 643,970,094 ₩ 620,525,157 Rs. 29,300,640 Rs. 28,233,895
COST OF SALES (Notes 23 and 31) 571,218,863 554,668,720 25,990,458 25,237,427
GROSS PROFIT 72,751,231 65,856,437 3,310,182 2,996,468
SELLING AND ADMINISTRATIVE EXPENSES (Notes 23 and 25) 103,219,783 107,490,560 4,696,500 4,890,820
OTHER OPERATING INCOME (Notes 26) 6,635,519 11,267,062 301,916 512,651
OTHER OPERATING IEXPENSES (Notes 26) 8,823,997 11,526,536 401,492 524,457
OPERATING LOSS (32,657,030) (41,893,597) (1,485,894) (1,906,158)
FINANCIAL INCOME (Note 27) 4,492,332 51,109,636 204,401 2,325,488 FINANCIAL COST (Note 27) 3,399,030 6,606,913 154,656 300,615 INCOME(LOSS) BEFORE INCOME
TAX (31,563,728) 2,609,126 (1,436,149) 118,714 INCOME TAX EXPENSE (Note 22) - - - -
NET INCOME(LOSS) (31,563,728) 2,609,126 (1,436,149) 118,714 OTHER COMPREHENSIVE LOSS(Note 24) (2,592,943) (13,593) (117,979) (618) TOTAL COMPREHENSIVE INCOME(LOSS) (34,156,671) 2,595,533 (1,554,128) 118,096 EARNINGS PER SHARE (Note 28)
Basic and diluted loss per share ₩ (260) ₩ 31 Rs. (12) Rs. 1
See accompanying notes to financial statements.
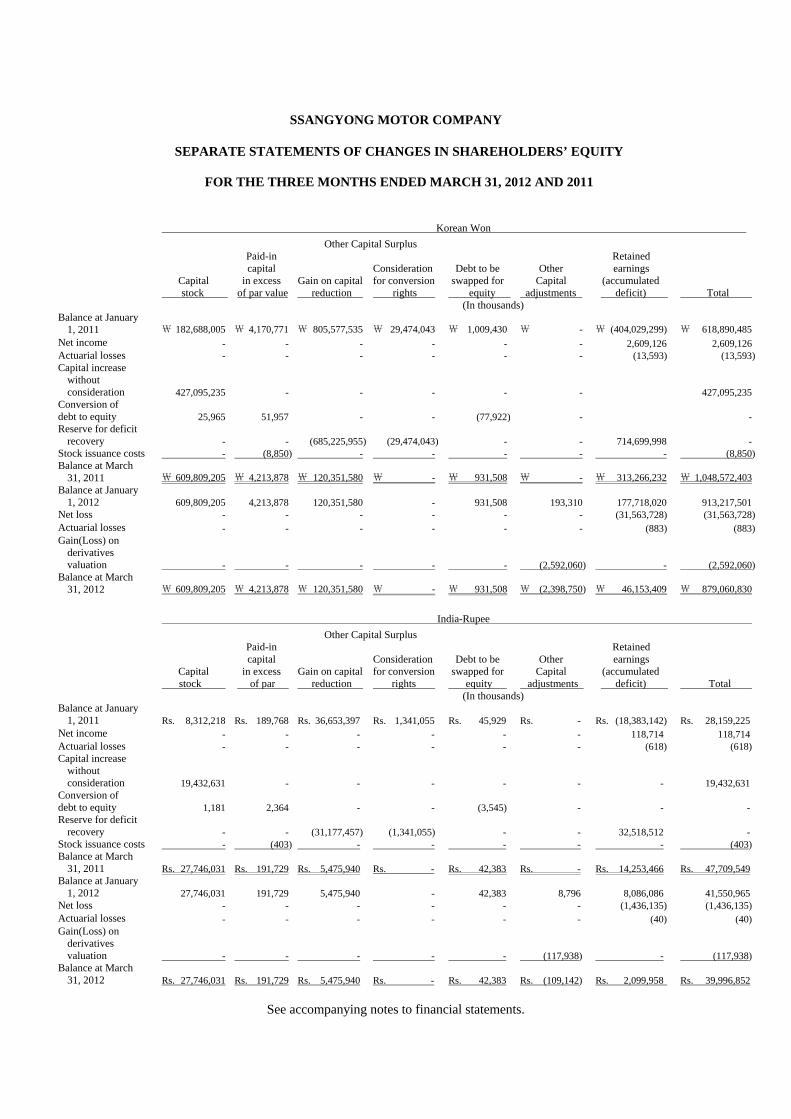
SSANGYONG MOTOR COMPANY
SEPARATE STATEMENTS OF CHANGES IN SHAREHOLDERS’ EQUITY
FOR THE THREE MONTHS ENDED MARCH 31, 2012 AND 2011
Korean Won
Capital stock
Other Capital Surplus
Retained earnings
(accumulated deficit)
Total
Paid-in capital
in excess of par value
Gain on capital reduction
Consideration for conversion rights
Debt to be swapped for
equity
Other
Capital adjustments
(In thousands) Balance at January
1, 2011 ₩ 182,688,005 ₩ 4,170,771 ₩ 805,577,535 ₩ 29,474,043 ₩ 1,009,430 ₩ - ₩ (404,029,299) ₩ 618,890,485
Net income - - - - - - 2,609,126 2,609,126 Actuarial losses - - - - - - (13,593) (13,593) Capital increase
without consideration
427,095,235 - - - - - 427,095,235 Conversion of debt to equity
25,965 51,957 - - (77,922) - -
Reserve for deficit recovery
-
- (685,225,955) (29,474,043) - - 714,699,998 -
Stock issuance costs -
(8,850)
- - - - -
(8,850) Balance at March
31, 2011 ₩ 609,809,205
₩ 4,213,878
₩ 120,351,580 ₩ - ₩ 931,508 ₩ - ₩ 313,266,232
₩ 1,048,572,403
Balance at January 1, 2012
609,809,205 4,213,878 120,351,580 - 931,508 193,310 177,718,020 913,217,501
Net loss - - - - - - (31,563,728) (31,563,728) Actuarial losses - - - - - - (883) (883) Gain(Loss) on
derivatives valuation
- - - - - (2,592,060) - (2,592,060) Balance at March
31, 2012 ₩ 609,809,205 ₩ 4,213,878 ₩ 120,351,580 ₩ - ₩ 931,508 ₩ (2,398,750) ₩ 46,153,409 ₩ 879,060,830
India-Rupee
Capital stock
Other Capital Surplus
Retained earnings
(accumulated deficit)
Total
Paid-in capital
in excess of par
Gain on capital reduction
Consideration for conversion rights
Debt to be swapped for
equity
Other
Capital adjustments
(In thousands) Balance at January
1, 2011
Rs. 8,312,218 Rs. 189,768 Rs. 36,653,397 Rs. 1,341,055 Rs. 45,929 Rs. - Rs. (18,383,142) Rs. 28,159,225 Net income - - - - - - 118,714 118,714 Actuarial losses - - - - - - (618) (618) Capital increase
without consideration
19,432,631 - - - - - - 19,432,631 Conversion of debt to equity
1,181 2,364 - - (3,545) - - -
Reserve for deficit recovery
-
- (31,177,457) (1,341,055) - - 32,518,512 -
Stock issuance costs -
(403)
- - - - -
(403) Balance at March
31, 2011
Rs. 27,746,031
Rs. 191,729
Rs. 5,475,940 Rs. - Rs. 42,383 Rs. - Rs. 14,253,466
Rs. 47,709,549 Balance at January
1, 2012
27,746,031 191,729 5,475,940 - 42,383 8,796 8,086,086 41,550,965 Net loss - - - - - - (1,436,135) (1,436,135) Actuarial losses - - - - - - (40) (40) Gain(Loss) on
derivatives valuation
- - - - - (117,938) - (117,938) Balance at March
31, 2012
Rs. 27,746,031 Rs. 191,729 Rs. 5,475,940 Rs. - Rs. 42,383 Rs. (109,142) Rs. 2,099,958 Rs. 39,996,852
See accompanying notes to financial statements.

SSANGYONG MOTOR COMPANY
SEPARATE STATEMENTS OF CASH FLOWS
FOR THE THREE MONTHS ENDED MARCH 31, 2012 AND 2011
Korean Won India- Rupee
Three months ended
March 31, 2012
Three months ended
March 31, 2011
Three month ended
March 31, 2012
Three months ended
March 31, 2011 (In thousands) (In thousands)
CASH FLOWS FROM OPERATING ACTIVITIES: (Note 29)
Net loss ₩ (31,563,728) ₩ 2,609,126 Rs. (1,436,149) Rs. 118,714 Adjustment 43,408,787 (1,821,843) 1,975,098 (82,893) Changes in net working capital 60,941,304 9,896,913 2,772,831 450,310
72,786,363 10,684,196 3,311,780 486,131
Interests received 1,622,094 1,093,540 73,805 49,756 Interests paid (2,301,026) (1,138,693) (104,697) (51,811) Dividend income received 71,900 6,000 3,271 273
Net cash provided by operating activities 72,179,331 10,645,043 3,284,159 484,348
CASH FLOWS FROM INVESTING ACTIVITIES:
Cash inflows from investing activities:
Decrease in other receivables 973,317 479,280 44,286 21,807 Disposal of property, plant and equipment 12,140 6,599,402 552 300,273 Disposal of other financial assets - 10,100 - 460 Decrease in other assets 2,535 1,115 115 51
987,992 7,089,897 44,953 322,591
Cash outflows from investing activities:
Increase in other receivables 240,000 - 10,920 - Acquisition of property, plant and equipment 26,718,658 15,769,785 1,215,699 717,525 Acquisition of intangible assets 2,721,112 2,835,424 123,811 129,012 Acquisition of other financial assets - 10,090 - 459
29,679,770 18,615,299 1,350,430 846,996
Net cash provided by(used in) in investing activities (28,691,778) (11,525,402) (1,305,477) (524,405)
CASH FLOWS FROM FINANCING ACTIVITIES:
Cash inflows from financing activities: Increase in borrowings - 4,169,000 - 189,690 Issuance of debentures - 95,404,765 - 4,340,917 Capital increase with consideration - 374,763,555 - 17,051,742
- 474,337,320 - 21,582,349 Cash outflows from financing activities:
Redemption of borrowings 10,306,290 310,934,562 468,936 14,147,523 Redemption of troubled debts - 170,294,152 - 7,748,384 Stock issuance costs - 8,850 - 403
10,306,290 481,237,564 468,936 21,896,310 Net cash provided by (used in) financing activities (10,306,290) (6,900,244) (468,936) (313,961)
(Continued)

SSANGYONG MOTOR COMPANY
SEPARATE STATEMENTS OF CASH FLOWS (CONTINUED)
FOR THE THREE MONTHS ENDED MARCH 31, 2012 AND 2011
Korean Won India- Rupee
Three months ended
March 31, 2012
Three months ended
March 31, 2011
Three months ended
March 31, 2012
Three months ended
March 31, 2011 (In thousands) (In thousands) EXCHANGE RATE FLUCTUATION EFFECT
OF CASH AND CASH EQUIVALENTS ₩ 57,789 ₩ (663,256) Rs. 2,629 Rs. (30,178)
NET INCREASE(DECREASE) IN CASH AND
CASH EQUIVALENTS 33,239,052 (8,443,859) 1,512,374 (384,196)
CASH AND CASH EQUIVALENTS, AT
BEGINNIG OF THE PERIOD 202,509,810 80,566,165 9,214,196 3,665,761
CASH AND CASH EQUIVALENTS, AT
ENDNIG OF THE PERIOD ₩ 235,748,862 ₩ 72,122,306 Rs. 10,726,570 Rs. 3,281,564
See accompanying notes to financial statements.

SSANGYONG MOTOR COMPANY
NOTES TO SEPARATE FINANCIAL STATEMENTS
FOR THE THREE MONTHS ENDED MARCH 31, 2012 AND 2011
1. GENERAL:
(1) Company overview and recent changes in business environment Ssangyong Motor Company (“the Company”) was incorporated on December 6, 1962, and listed its stocks on the Korea Stock Exchange in May, 1975. The Company is headquartered in Chilgeo-dong, Pyungtaek and its factories are located in Pyungtaek, Kyeonggi-do and Changwon, Kyeongsangnam-do. The Company manufactures and distributes motor vehicles and parts. On February 6, 2009, Seoul Central District Court (the “Court”) made a decision on a corporate reorganization for the Company and on December 17, 2009 approved the relevant reorganization plan. Subsequently, in the creditors’ meeting held on January 28, 2011, an amended reorganization plan in accordance with the merger and acquisition (“M&A”) agreement with Mahindra & Mahindra Ltd. executed on November 23, 2010, was passed, and received the formal consent from the Court on January 31, 2011. In accordance with the amended plan, payments for the capital increase through third-party allotment of 427.1 billion won (17.084 billion rupee) and unguaranteed corporate bonds of 95.4 billion won (3.816 billion rupee) were made to the Company on February 8 and February 9, in 2011, respectively. Furthermore, the Company repaid rehabilitation security rights and bonds upon the approval of the Court and submitted to the Court a request to terminate reorganization proceedings. The Court receivership was terminated as the request for termination of reorganization proceedings was approved on March 14, 2011. (2) Major shareholders
As of March 31, 2012, the Company’s shareholders are as follows:
Name of shareholder Number of
shares owned Percentage of
Ownership (%) Mahindra & Mahindra Ltd. 85,419,047 70.04 Others 36,542,794 29.96 121,961,841 100.00
In accordance with the investment contract for the merger and acquisition, Mahindra & Mahindra Ltd. has acquired shares of the Company through the third-party allotment and become the largest shareholder of the Company. 2. SIGNIFICANT ACCCOUNTING POLICIES: The company’s summarized interim financial statement, its period belong to annual financial report, adopts Korean International Reporting Standards (“K-IFRS”) 1034. The audited financial statement, December 31, 2011 is used to understand the interim financial statement. The account policy is identified with the audited financial statement of December 31, 2011 except for the account policy explained as follow (1) First-time adoption of IFRSs and its description(change in account policy) as follow:
K- IFRS 1107 Financial Instruments: Disclosures – Transfers of Financial Assets

- 2 -
The amendments to K-IFRS 1107 increase the disclosure requirements for transactions involving transfers of financial assets. These amendments are intended to provide greater transparency around risk exposures when a financial asset is transferred but the transferor retains some level of continuing exposure in the asset. The amendments also require disclosures where transfers of financial assets are not evenly distributed throughout the period. There is no effect on interim financial disclosures and its related to the amendment. Amendments to K-IFRS 1012 Deferred Tax – Recovery of Underlying Assets The amendments to K-IFRS 1012 provide an exception to the general principles in K-IFRS 1012 that the measurement of deferred tax assets and deferred tax liabilities should reflect the tax consequences that would follow from the manner in which the entity expects to recover the carrying amount of an asset. Investment property measured using the revaluation model under K-IFRS 1040 Investment Property or a non-depreciable asset measured using the revaluation model in K-IFRS 1016 Property, Plant and Equipment, are presumed to be recovered through sale for the purposes of measuring deferred taxes, unless the presumption is rebutted in certain circumstances. The amendments doesn’t effect on interim financial statement.
(2) The Company has not applied new policies that have been issued but are not yet effective as follow K-IFRS 1019 (as revised in 2011) Employee Benefits The amendments to K-IFRS 1019 change the accounting for defined benefit plans and termination benefits. The most significant change relates to the accounting for changes in defined benefit obligations and plan assets. The amendments require the recognition of changes in defined benefit obligations and in fair value of plan assets when they occur, and hence eliminate the 'corridor approach' permitted under the previous version of K-IFRS 1019 and accelerate the recognition of past service costs. The amendments to K-IFRS 1019 are effective for annual periods beginning on or after January 1, 2013 and require retrospective application with certain exceptions.
K-IFRS 1113 Fair Value Measurement K-IFRS 1113 establishes a single source of guidance for fair value measurements and disclosures about fair value measurements. The standard defines fair value, establishes a framework for measuring fair value, and requires disclosures about fair value measurements. K-IFRS 1113 is effective for annual periods beginning on or after January 1, 2013, with earlier application permitted. The Company does not anticipate that these amendments referred above will have a significant effect on the Company’s separate interim financial statements and disclosures. The Indo rupee amounts presented in these financial statements were computed by translating the Korean won into Indo rupees based on the Bank of Korea Basic Rate (₩ 21.98 to Rs. 1.00 at March 31, 2012), solely for the convenience of the reader. These convenience translations into Indo rupees should not be construed as representations that the Korean won amounts have been, could have been, or could in the future be, converted at this or any other rate of exchange.

- 3 -
3. RESTRICTED FINANCIAL ASSETS: Restricted financial assets as of March 31, 2012 and December 31, 2011 are as follows
(Unit: Won in thousands):
Financial institution
March 31, 2012
December 31,2011 Notes
Cash and cash equivalents
Shinhan Bank and others
₩ 839,668 ₩ 1,249,811
Government subsidies and others
Woori Bank and others
14,476,414 14,415,666
Pledge and doubted debt recovery
Long-term financial instruments
Shinhan Bank and others
6,000 6,000
Overdraft deposit
₩ 15,322,082
₩ 15,671,477
(Unit: : Indian-Rupee in thousands):
Financial institution
March 31, 2012
December 31,2011 Notes
Cash and cash equivalents
Shinhan Bank and others
Rs. 38,205 Rs. 56,866
Government subsidies and others
Woori Bank and others
658,677 655,913
Pledge and doubted debt recovery
Long-term financial instruments
Shinhan Bank and others
273
273
Overdraft deposit
Rs. 697,155
Rs. 713,052
4. LONG-TERM AVAILABLE-FOR-SALE FINANCIAL ASSETS:
The Company’s long-term available-for-sale financial assets as of March 31, 2012 are as follows
(Unit: Won in thousands):
March 31, 2012
December 31, 2011
Classification
Ownership %
Acquisition cost
Net asset value
Book value
Book value
Kihyup Technology Banking Corporation (*)
1.72 ₩ 500,000
₩ 652,102
₩ 500,000
₩ 500,000
Korea Management Consultants Association (*)
1.50
60,000
351,402
60,000
60,000
₩ 560,000 ₩1,003,504 ₩ 560,000 ₩ 560,000
(Unit: Indian-Rupee in thousands):
March 31, 2012
December 31, 2011
Classification
Ownership %
Acquisition cost
Net asset value
Book value
Book value
Kihyup Technology Banking Corporation (*)
1.72 Rs. 22,750 Rs. 29,671 Rs. 22,750 Rs. 22,750
Korea Management Consultants Association (*)
1.50 2,730 15,989 2,730 2,730

- 4 -
March 31, 2012
December 31, 2011
Classification
Ownership %
Acquisition cost
Net asset value
Book value
Book value
Rs. 25,480 Rs. 45,660 Rs. 25,480 Rs. 25,480
(*) Because the market prices from an active market are not available and the fair values cannot be reliably
measured, AFS financial assets are measured at their acquisition costs. 5. TRADE AND OTHER RECEIVABLES:
All current trade and other receivables are due within 1 year from March 31, 2012 and because the present value discount effect is not material, the fair value of the aforementioned receivables is consistent with the book value.
(1) Details of current portion of trade and other receivables as of March 31, 2012 and December 31, 2011 are as follows:
(Unit: Won in thousands)
Financial liabilities
March 31, 2012
Trade receivables
Non-trade receivables
Other receivables
Other long-term receivables
Receivables – general ₩ 142,317,302 ₩ 34,039,430 ₩ 3,816,452 ₩ 37,091,159
Receivables due from affiliated parties 11,762,317 5,314,458 - -
Less: Allowance for doubtful accounts (1,369,990) (2,019,490) (1,380) (391,446)
₩ 152,709,629 ₩ 37,334,398 ₩ 3,815,072 ₩ 36,699,713
Financial liabilities
December 31, 2011
Trade receivables
Non-trade Receivables
Other receivables
Other long-term receivables
Receivables – general ₩ 135,269,027 ₩ 27,087,061 ₩ 2,834,566 ₩ 37,996,784
Receivables due from affiliated parties 9,390,769 4,770,122 - 232
Less: Allowance for doubtful accounts (1,193,267) (2,019,821) (1,394) (403,223)
₩ 143,466,529 ₩ 29,837,362 ₩ 2,833,172 ₩ 37,593,793
(Unit: Indian-Rupee in thousands):
Financial liabilities
March 31, 2012
Trade receivables
Non-trade receivables
Other receivables
Other long-term receivables
Receivables – general Rs. 6,475,455 Rs. 1,548,798 Rs. 173,649 Rs. 1,687,652
Receivables due from affiliated parties 535,187 241,809 - -
Less: Allowance for doubtful accounts (62,335) (91,887) (63) (17,811)
Rs. 6,948,307 Rs. 1,698,720 Rs. 173,586 Rs. 1,669,842
Financial liabilities
December 31, 2011
Trade receivables
Non-trade receivables
Other receivables
Other long-term receivables
Receivables – general Rs. 6,154,741 Rs. 1,232,461 Rs. 128,973 Rs. 1,728,854
Receivables due from affiliated parties 427,280 217,041 - 11
Less: Allowance for doubtful accounts (54,294) (91,902) (63) (18,347)
Rs. 6,527,727 Rs. 1,357,600 Rs. 128,910 Rs. 1,710,518
(2) Credit risk and allowance for doubtful accounts The above trade and non-trade receivables and other receivables are classified as loans and receivables and measured at amortized cost.

- 5 -
If a credit risk occurs with respect to a dealership sale, which is a major type of the Company’s sales, the respective dealership bears all of the risk; the Company manages credit risk on product sales using two management indexes, agreed liability rate and agreed excess rate, and when the management index exceeds the agreed rate, it imposes a release restriction on the respective dealership and transfers a credit risk arising from product sales. The Company’s trade receivables are usually collected within 30 days but some of the notes receivable are collected within 90 days. Based on the past experience, receivables that are overdue for more than 1 year are usually not collected, and the Company reserves the full amount of those receivables as an allowance for doubtful accounts. The Company estimates an allowance for the receivables that are overdue for more than 90 days but less than 1 year through an individual analysis based on each transacting party; for receivables that are not subject to individual analysis, the Company estimates an allowance based on the historical loss rates. Some of the trade receivables that are overdue for more than 90 days are not included in the above trade receivables (refer to the aging analysis below); the Company did not reserve an allowance for the aforementioned receivables since their credit ratings did not change materially and they are expected to be collected. The Company has no collaterals pledged or credit enforcement provided for the aforementioned receivables and does not have a legal right to offset those receivables with the debt of the transacting parties. 1) Aging analysis of the trade and non-trade receivables that are overdue but are not impaired as of March 31,
2012 and December 31,2011 are as follows (Unit: Won in thousands):
Classification March 31, 2012
3-6 months
6-12 months
Over 1 year
Total
Trade receivables ₩ 3,052,629 ₩ 5,251,223 ₩ 20,660 ₩ 8,324,512
Non-trade receivables
157,496 23,750 4,594,150 4,775,396
₩ 3,210,125 ₩ 5,274,973 ₩ 4,614,810 ₩ 13,099,908
Classification December 31, 2011
3-6 months
6-12 months
Over 1 year
Total
Trade receivables ₩ 2,568,793 ₩ 4,444,478 ₩ 20,660 ₩ 7,033,931
Non-trade receivables
218,450 22,279 4,535,946 4,776,675
₩ 2,787,243 ₩ 4,466,757 ₩ 4,556,606 ₩ 11,810,606
(Unit: Indian-Rupee in thousands):
Classification March 31, 2012
3-6 months
6-12 months
Over 1 year
Total
Trade receivables
Rs. 138,895 Rs. 238,931 Rs. 940 Rs. 378,766 Non-trade receivables
7,166 1,081 209,034 217,281
Rs. 146,061 Rs. 240,012 Rs. 209,974 Rs. 596,047
Classification December 31, 2011
3-6 months
6-12 months
Over 1 year
Total
Trade receivables
Rs. 116,880 Rs. 202,224 Rs. 940 Rs. 320,044 Non-trade receivables
9,939 1,014 206,386 217,339
Rs. 126,819 Rs. 203,238 Rs. 207,326 Rs. 537,383
2) Aging analysis of the impaired trade and non-trade receivables as of March 31, 2012 and December 31,2011
are as follows (Unit: Won thousands):
Classification December 31, 2011
3-6 months
6-12 months
Over 1 year
Total
Trade receivables ₩ - ₩ - ₩ - ₩ -
Non-trade receivables
- - 2,009,185 2,009,185
₩ - ₩ - ₩ 2,009,185 ₩ 2,009,185

- 6 -
Classification December 31, 2011
3-6 months
6-12 months
Over 1 year
Total
Trade receivables ₩ - ₩ - ₩ 12,293 ₩ 12,293
Non-trade receivables
- - 2,011,543 2,011,543
₩ - ₩ - ₩ 2,023,836 ₩ 2,023,836
(Unit: Indian-Rupee in thousands):
Classification December 31, 2011
3-6 months
6-12 months
Over 1 year
Total
Trade receivables
Rs. - Rs. - Rs. - Rs. - Non-trade receivables
- - 91,418 91,418
Rs. - Rs. - Rs. 91,418 Rs. 91,418
Classification December 31, 2011
3-6 months
6-12 months
Over 1 year
Total
Trade receivables
Rs. - Rs. - Rs. 559 Rs. 559 Non-trade receivables
- - 91,525 91,525
Rs. - Rs. - Rs. 92,084 Rs. 92,084
3) Changes in allowance for trade and other receivables for the years ended March 31, 2012 and December
31,2011 are as follows (Unit: Won in thousands)
Classification
March 31, 2012
Trade receivables
Non-trade receivables
Other receivables
Other long-term
receivables Beginning balance
₩ 1,193,267 ₩ 2,019,821 ₩ 1,394 ₩ 403,223
Bad debt expense
176,723 - - - Write-offs
- - - -
Reversal of allowance (*)
- (331) (15) (11,777) Ending balance
₩ 1,369,990 ₩ 2,019,490 ₩ 1,379 ₩ 391,446
Classification
Year ended December 31, 2011
Trade receivables
Non-trade receivables
Other receivables
Other long-term
receivables Beginning balance
₩ 2,348,682 ₩ 2,057,840 ₩ 13,584 ₩ 89,318
Bad debt expense
- 3,059 470 398,681 Write-offs
- (3,059) - (583)
Reversal of allowance
(1,155,415) (38,019) (12,660) (84,193) Ending balance
₩ 1,193,267 ₩ 2,019,821 ₩ 1,394 ₩ 403,223
(Unit: Indian-Rupee in thousands):
Classification
March 31, 2012
Trade receivables
Non-trade receivables
Other receivables
Other long-term
receivables Beginning balance
Rs. 54,294 Rs. 91,902 Rs. 64 Rs. 18,347
Bad debt expense
8,041 - - - Write-offs
- - - -
Reversal of allowance (*)
- (15) (1) (536) Ending balance
Rs. 62,335 Rs. 91,887 Rs. 63 Rs. 17,811

- 7 -
Classification
Year ended December 31, 2011
Trad receivables
Non-trade receivables
Other Receivables
Other long-term
receivables Beginning balance
Rs. 106,865 Rs. 93,632 Rs. 618 Rs. 4,064
Bad debt expense
- 139 21 18,140 Write-offs
- (139) - (26)
Reversal of allowance
(52,571) (1,730) (576) (3,831) Ending balance
Rs. 54,294 Rs. 91,902 Rs. 63 Rs. 18,347
The Company estimates allowances for doubtful accounts through individual analysis, and an allowance for the receivables that are not subject to separate individual analysis is estimated based on the historical collection rates. For troubled receivables (default, liquidation, bankruptcy, court receivership, workout, disappearance, full-scale capital erosion, etc.), the Company assesses collectability of each receivable through an individual analysis and reserves 100% allowance. For the receivables that are not subject to individual analysis, the allowance is estimated by applying the average loss rate for the past 3 years to the remaining balance of the receivables at the end of a reporting period; the 3-year average loss rate is calculated by dividing the amount of actual loss occurred in the past 3 years by the average balance of the receivables. 6. INVENTORIES: Details of the inventories as of March 31, 2012 and December 31, 2011 are as follows (Unit: Won in thousands): March 31, 2012
December 31, 2011
Carrying amount before valuation
Valuation allowance
Book value
Carrying amount before valuation
Valuation allowance
Book value
Merchandises ₩ 49,104,204 ₩ (1,614,956) ₩ 47,489,248 ₩ 47,095,880 ₩ (1,635,191) ₩ 45,460,689 Finished goods 52,920,911 (2,515,532) 50,405,379 40,715,388 (2,519,949) 38,195,439 Work-in-
process
30,062,628 (1,062,865) 28,999,763
27,910,491 (1,411,191) 26,499,300 Raw materials 99,077,830 (6,327,646) 92,750,184 73,442,261 (6,769,758) 66,672,503 Sub-materials 5,732,243 - 5,732,243 7,253,748 - 7,253,748 Supplies 4,667,948 (2,212) 4,665,736 4,609,418 (2,212) 4,607,206 Goods in transit 43,511,620 - 43,511,620 70,170,587 - 70,170,587
Total ₩ 285,077,384 ₩ (11,523,211) ₩ 273,554,173 ₩ 271,197,773 ₩ (12,338,301) ₩258,859,472 (Unit: Indian-Rupee in thousands): March 31, 2012
December 31, 2011
Carrying amount before valuation
Valuation allowance
Book value
Carrying amount before valuation
Valuation allowance
Book value
Merchandises Rs. 2,234,241 Rs. (73,480) Rs. 2,160,761 Rs. 2,142,863 Rs. (74,401) Rs. 2,068,461 Finished goods 2,407,901 (114,457) 2,293,445 1,852,550 (114,658) 1,737,892 Work-in-
process
1,367,850 (48,360) 1,319,489 1,269,927 (64,209) 1,205,718 Raw materials 4,508,041 (287,908) 4,220,133 3,341,623 (308,024) 3,033,599 Sub-materials 260,817 - 260,817 330,046 - 330,046 Supplies 212,392 (101) 212,291 209,729 (101) 209,628 Goods in transit 1,979,779 - 1,979,779 3,192,762 - 3,192,762
Total Rs. 12,971,021 Rs. (524,306) Rs. 12,446,715 Rs. 12,339,499 Rs. (561,393) Rs. 11,778,106

- 8 -
The company is using the “lower of cost or market method” on the balance sheet in the case of inventories’ market value decrease under the acquisition cost. On the other hand, losses on valuation of inventories which was added to “cost of sales” on current period due to the application of “lower of cost or market method” is ₩ 790,191thousands(Rs 35,954 thousands). 7. INVESTMENT IN SUBSIDIAIRIES: (1) Details of investment in subsidiaries accounted for using equity method as of Mach 31, 2012 are as follows
(Unit: Won in thousands)
Name of subsidiary
Location
Ownership %
March 31, 2012
Acquisition cost
Book value
Ssangyong (Yizheng) Auto-parts Manufacturing Co., Ltd.
China
100 ₩ 1,618,803 ₩ 2,854,568
Ssangyong Motor (Shanghai) Co., Ltd.
China 86.57 1,025,962 1,601,986 Ssangyong European Parts Center B.V.
Netherland 100 835,695 -
₩ 3,480,460 ₩ 4,456,554 (Unit: Indian-Rupee in thousands)
Name of subsidiary
Location
Ownership %
March 31, 2012
Acquisition cost
Book value (*)
Ssangyong (Yizheng) Auto-parts Manufacturing Co., Ltd.
China
100
Rs. 73,656
Rs. 129,883
Ssangyong Motor (Shanghai) Co., Ltd.
China 86.57
46,681
72,890 Ssangyong European Parts Center B.V.
Netherland 100
38,024
-
Rs. 158,361
Rs. 202,773 (2) Summarized financial information of subsidiaries The summarized financial information of the Company’s subsidiaries as of and for the three months ended March 31, 2012 is as follows (Unit: Won in thousands)
Companies
Assets
Liabilities
Operating revenues
Net income (loss)
Ssangyong (Yizheng) Auto-parts Manufacturing Co., Ltd.
₩ 2,389,885 ₩ 17,009 ₩ 1,037,940 ₩ 30,431
Ssangyong Motor (Shanghai) Co., Ltd
3,028,312 472,506 465,462 (285,642) Ssangyong European Parts Center
B.V.
10,132,905 14,875,330 3,857,100 135,866 (Unit: Indian-Rupee in thousands)
Companies
Assets
Liabilities
Operating revenues
Net income (loss)
Ssangyong (Yizheng) Auto-parts Manufacturing Co., Ltd.
Rs. 108,740 Rs. 774 Rs. 47,226 Rs. 1,385
Ssangyong Motor (Shanghai) Co., Ltd
137,788 21,499 21,179 (12,997) Ssangyong European Parts Center
B.V.
461,047 676,828 175,498 6,182

- 9 -
(3) Summarized statement of financial position with application of equity method (Unit: Won in thousands)
Account
Mar. 31, 2012
Dec. 31, 2011 Current assets
₩ 713,994,949 ₩ 653,681,356
Non-current assets
1,141,356,562 1,146,910,433 Total assets
1,855,351,511 1,800,591,789
Current liabilities
605,720,874 517,701,065 Non-current liabilities
370,300,367 368,771,229
Total liabilities
976,021,241 886,472,294 Total shareholders’ equity
879,330,270 914,119,495
Total liabilities and shareholders’ equity ₩ 1,855,351,511 ₩ 1,800,591,789
(Unit: Indian-Rupee in thousands)
Account
Mar. 31, 2012
Dec. 31, 2011 Current assets
Rs. 32,486,770 Rs. 29,742,502
Non-current assets
51,931,724 52,184,425 Total assets
84,418,494 81,926,926
Current liabilities
27,560,300 23,555,398 Non-current liabilities
16,848,667 16,779,091
Total liabilities
44,408,967 40,334,489 Total shareholders’ equity
40,009,527 41,592,437
Total liabilities and shareholders’ equity
Rs. 84,418,494 Rs. 81,926,926 (4) Summarized statement of comprehensive income with application of equity method
(Unit: Won in thousands) Account
Mar. 31, 2012
Mar. 31, 2011
Operating income ₩ (32,657,030) ₩ (41,710,558)
Financial revenues
4,190,790 5,482,258 Financial expenses
3,399,030 6,965,807
Loss on valuation of investment using the equity method of accounting (*)
(262,854) (112,031)
Loss before income tax
(32,128,124) (43,306,138) Income taxes
- -
Net loss
(32,128,124) (43,306,138) Other comprehensive loss
(2,334,192) (80,150)
Total other comprehensive loss ₩ (34,462,316) ₩ (43,386,288) (Unit: Indian-Rupee in thousands)
Account
Mar. 31, 2012
Mar. 31, 2011 Operating income
Rs. (1,485,895) Rs. (1,897,830)
Financial revenues
190,681 249,443 Financial expenses
154,656 316,944
Loss on valuation of investment using the equity method of accounting (*)
(11,960) (5,097)
Loss before income tax
(1,461,830) (1,970,428) Income taxes
- -
Net loss
(1,461,830) (1,970,428) Other comprehensive loss
(106,206) (3,647)
Total other comprehensive loss Rs. (1,568,036) Rs. (1,974,075) (*) The Company discontinued applying the equity method on Ssangyong European Parts Center B.V. of which
book value was valued at zero due to accumulated loss, and the unrecognized accumulated change in equity amounts to ₩6,907,357 thousand (Rs 276,294 thousand).

- 10 -
8. OTHER ASSETS: The carrying values of the Company’s other assets as of March 31, 2012 are as follows (Unit: Won in thousands) Account
Mar. 31, 2012
Dec. 31, 2011
Other current assets ₩ 7,099,844 ₩ 12,946,343
Advance payments
(39,683) (72,869) (-) Allowance for doubtful accounts
3,002,940 2,748,375
Prepaid expenses
769,712 553,163 Total
₩ 10,832,813 ₩ 16,175,012
Other non-current assets
129,768 207,628
Long-term prepaid expenses
368,970 361,614 Total
₩ 498,738 ₩ 569,242
(Unit: Indian-Rupee in thousands) Account
Mar. 31, 2012
Dec. 31, 2011
Other current assets
Rs. 323,043 Rs. 589,059 Advance payments
(1,806) (3,316)
(-) Allowance for doubtful accounts
136,634 125,051 Prepaid expenses
35,022 25,169
Total
Rs. 492,893 Rs. 735,963
Other non-current assets
5,904 9,447 Long-term prepaid expenses
16,788 16,453
Total
Rs. 22,693 Rs. 25,901 9. PROPERTY, PLANT AND EQUIPMENT: (1) Carrying amounts Changes in the carrying amounts of property, plant and equipment for the three months ended March 31, 2012 and for the year ended December 31, 2011 are as follows (Unit: Won in thousands):
March 31, 2012
Acquisition
cost
Government subsidies
Depreciation
Loss on valuation
Carrying amount
Land ₩ 469,644,702 ₩ - ₩ - ₩ - ₩ 469,644,702
Buildings 506,514,344 1,816,496 160,422,754 148,652,850 195,622,244
Structures 105,510,990 210,217 58,344,993 29,845,146 17,110,634
Machinery 1,214,917,466 1,123,651 987,443,223 100,042,809 126,307,783
Vehicles 11,200,221 3 7,243,004 1,561,551 2,395,663
Tools and molds 772,049,134 80,890 410,308,048 164,153,823 197,506,373
Equipment 51,050,445 27,511 33,295,706 5,705,285 12,021,943
Construction in progress 19,541,686 - - - 19,541,686
₩ 3,150,428,988 ₩ 3,258,768 ₩ 1,657,057,728 ₩ 449,961,464 ₩ 1,040,151,028
December 31, 2011
Acquisition
cost
Government subsidies
Depreciation
Loss on valuation
Carrying amount
Land ₩ 469,644,702 ₩ - ₩ - ₩ - ₩ 469,644,702
Buildings 506,326,230 1,828,072 158,258,412 148,713,692 197,526,054
Structures 105,540,140 215,212 58,002,840 29,850,469 17,471,619
Machinery 1,210,350,462 1,127,864 981,024,609 100,089,697 128,108,292

- 11 -
December 31, 2011
Acquisition
cost
Government subsidies
Depreciation
Loss on valuation
Carrying amount
Vehicles 11,389,549 3 7,315,731 1,581,432 2,492,383
Tools and molds 742,363,803 85,803 397,546,435 164,184,360 180,547,205
Equipment 49,653,310 46,417 33,027,963 5,779,001 10,799,929
Construction in progress
31,748,336 - - - 31,748,336
Machinery in transit 87,626 - - - 87,626
Total ₩ 3,127,104,158 ₩ 3,303,371 ₩ 1,635,175,990 ₩ 450,198,651 ₩ 1,038,426,146
(Unit: Indian-Rupee in thousands):
March 31, 2012
Acquisition
cost
Government subsidies
Depreciation
Loss on valuation
Carrying amount
Land
Rs. 21,368,834 Rs. - Rs. - Rs. - Rs. 21,368,834 Buildings
23,046,403 82,651 7,299,235 6,763,705 8,900,812
Structures
4,800,750 9,565 2,654,698 1,357,954 778,533 Machinery
55,278,745 51,126 44,928,667 4,551,948 5,747,004
Vehicles
509,610 - 329,556 71,051 109,003 Tools and molds
35,128,236 3,680 18,669,016 7,468,999 8,986,541
Equipment
2,322,795 1,252 1,514,955 259,590 546,998 Construction in
progress
889,147 - - - 889,147
Rs. 143,344,520 Rs. 148,274 Rs. 75,396,127 Rs. 20,473,247 Rs. 47,326,872
December 31, 2011
Acquisition
cost
Government subsidies
Depreciation
Loss on valuation
Carrying Amount
Land
Rs. 21,368,834 Rs. - Rs. - Rs. - Rs. 21,368,834 Buildings
23,037,843 83,177 7,200,758 6,766,473 8,987,435
Structures
4,802,076 9,792 2,639,129 1,358,196 794,959 Machinery
55,070,946 51,318 44,636,620 4,554,081 5,828,927
Vehicles
518,224 - 332,866 71,955 113,403 Tools and molds
33,777,553 3,904 18,088,363 7,470,388 8,214,898
Equipment
2,259,226 2,112 1,502,771 262,945 491,398 Construction in
progress
1,444,549 - - - 1,444,549 Machinery in transit
3,987 - - - 3,987
Rs. 142,283,238 Rs. 150,303 Rs. 74,400,507 Rs. 20,484,038 Rs. 47,248,390
(2) Changes in the carrying amounts of property, plant and equipment for the year ended March 31, 2012 and
for the year ended December 31, 2011 are as follows (Unit: Korean won in thousands):
March 31, 2012
Beginning
balance
Acquisition
Disposal
Other
Depreciation(*)
Ending balance Land
₩ 469,644,702 ₩ - ₩ - ₩ - ₩ - ₩ 469,644,702
Buildings 197,526,054 314,020 - (18,817) 2,199,013 195,622,244
Structures 17,471,619 13,900 - (1,596) 373,289 17,110,634
Machinery 128,108,292 949,577 3,762 5,422,453 8,168,777 126,307,783
Vehicles 2,492,383 43,000 9 1 139,712 2,395,663
Tools and molds 180,547,205 11,110,586 273 19,102,303 13,253,448 197,506,373
Equipment 10,799,929 1,885,684 20,217 59,084 702,535 12,021,943
Construction in progress
31,748,336 12,401,814 - (24,608,464) - 19,541,686
Machinery in transit 87,626 77 - (87,703) - -
₩ 1,038,426,146 ₩ 26,718,658 ₩ 24,261 ₩ 132,741 ₩ 24,836,774 ₩1,040,151,028

- 12 -
(*) Depreciation Expenses on Asset not in use, 16,605 thousand won, has excluded from cash flow.
Year ended December 31, 2011
Beginning
balance
Acquisition
Disposal
Other
Depreciation
Ending balance Land
₩ 472,348,135 ₩ - ₩ 2,933,876 ₩ - ₩ - ₩ 469,414,259
Buildings 199,962,373 546,248 609,864 479,381 2,109,651 198,268,487
Structures 18,225,114 192,677 73,998 - 357,106 17,986,687
Machinery 141,607,790 655,998 165 1,222,307 7,481,969 136,003,961
Vehicles 1,435,320 119,757 2,527 (1,883) 135,692 1,414,975
Tools and molds 173,542,418 378,801 12,979 1,738,501 10,785,710 164,861,031
Equipment 6,499,837 1,028,302 8,859 (443) 440,298 7,078,539
Construction in progress 16,413,955 12,786,018 - (3,429,330) - 25,770,643
Machinery in transit - 61,985 - (19,023) - 42,962
₩ 1,030,034,942 ₩ 15,769,786 ₩ 3,642,268 ₩ (10,490) ₩ 21,310,426 ₩ 1,020,841,544
(*) Depreciation Expenses on Asset not in use, 3,758 thousand won, has excluded from cash flow. (Unit: Indian-Rupee in thousands):
March 31, 2012
Beginning
balance
Acquisition
Disposal
Other
Depreciation (*)
Ending balance Land
Rs. 21,368,834
Rs. -
Rs. -
Rs. - - Rs. - Rs. 21,368,834
Buildings
8,987,435
14,288
(856)
100,055 8,900,812 Structures
794,959
632
(73)
16,985 778,533
Machinery
5,828,927
43,206
171 246,722
371,679 5,747,004
Vehicles
113,403
1,957
- -
6,357 109,003
Tools and molds
8,214,898
505,532
12 869,155
603,032 8,986,541
Equipment
491,398
85,799
920 2,688
31,965 546,998
Construction in progress
1,444,549
564,283
-
(1,119,685)
- 889,147
Machinery in transit
3,987
4
(3,990)
-
Rs. 47,248,390
Rs. 1,215,699
Rs. 1,103
Rs. 6,040
Rs. 1,130,073 Rs. 47,326,872
(*) Depreciation Expenses on Asset not in use, Rs 756 thousand, has excluded from cash flow.
Year ended December 31, 2011
Beginning
balance
Acquisition
Disposal
Other
Depreciation
Ending balance Land
Rs. 21,491,840
Rs. -
Rs. 133,491
Rs. -
Rs. -
Rs. 21,358,349
Buildings
9,098,288
24,854
27,749 21,813
95,988
9,021,218
Structures
829,243
8,767
3,367 -
16,248
818,395
Machinery
6,443,154
29,848
8 55,615
340,430
6,188,179
Vehicles
65,307
5,449
115 (86)
6,174
64,381
Tools and molds
7,896,180
17,235
591 79,102
490,750
7,501,176
Equipment
295,743
46,788
403 (20)
20,034
322,074
Construction in progress
746,835
581,764
-
(156,035)
-
1,172,564
Machinery in transit
-
2,820
- (866)
-
1,954
Rs. 46,866,590
Rs. 717,525
Rs. 165,724
Rs. (477)
Rs. 969,624
Rs. 46,448,290
(*) Depreciation Expenses on Asset not in use, Rs 171 thousand, has excluded from cash flow.

- 13 -
(3) Insured asset The Company’s assets are insured as follows (Unit: Korean won and India-Rupee in thousands):
Type
Sum insured
Insured period
Insurer
Assets insured Product liability
insurance
USD 2,165,955,461
2012.01.01~2013.12.31
LIG Insurance Co., Ltd.
Products Property insurance
₩ 2,580,164,238 (Rs 103,206,570)
2011.12.20~2012.12.20
Meritz Fire and Marine Insurance
Property, plant and equipment and
inventories In addition to the above insurances, the Company has subscribed to liability and comprehensive insurance for its vehicles and workers’ compensation, health insurance and unemployment insurance for its employees. It has also subscribed to liability insurance for reparation of gas accident, auto insurance, other accident and casualty insurances and cargo insurance. (4) Assets pledged as collateral The assets pledged as collateral for the Company’s borrowings as of March 31, 2012 are as follows (won in thousands):
(Unit: Indian-Rupee in thousands):
10. INTANGIBLE ASSETS:
(1) Details of intangible assets as of March 31, 2012 and December 31, 2011 are as follows (Unit: Korean won
in thousands):
March 31, 2012
Acquisition cost
Government subsidies
Accumulated depreciation
Accumulated impairment loss
Book value
Development cost ₩ 101,857,932 ₩ - ₩ 48,646,676 ₩ - ₩ 53,211,256
Patents
1,806,063 - 1,110,090 15,265 680,708 Other intangible
assets
10,827,643 202,581 5,801,937 - 4,823,125
₩ 114,491,638 ₩ 202,581 ₩ 55,558,703 ₩ 15,265 ₩ 58,715,089
December 31, 2011
Acquisition cost
Government subsidies
Accumulated depreciation
Accumulated impairment loss
Book value
Development cost ₩ 181,940,629 ₩ - ₩ 123,176,033 ₩ - ₩ 58,764,596
Patents
1,753,170 - 1,041,499 10,562 701,109
Assets pledged as Collaterals
Details
Book value
Maximum amount
Land Buildings Machinery
Chilgoe-dong Pyeongtaek, Gyeonggi-do 150-3 (factory site) and others
Pyeongtaek plant production facilities
₩ 464,918,494 195 (Billion) 189,228,580
68,191,872 Total ₩ 722,338,946
Assets pledged as Collaterals
Details
Book value
Maximum amount
Land Buildings Machinery
Chilgoe-dong Pyeongtaek, Gyeonggi-do 150-3 (factory site) and others
Pyeongtaek plant production facilities
Rs. 21,153,791 78 (Billion) 8,609,900
3,102,730 Rs. 32,806,422

- 14 -
December 31, 2011
Acquisition cost
Government subsidies
Accumulated depreciation
Accumulated impairment loss
Book value
Other intangible assets
10,611,863 251,773 5,429,091 - 4,930,999
₩ 194,305,662 ₩ 251,773 ₩ 129,646,623 ₩ 10,562 ₩ 64,396,704
(Unit: Indian-Rupee in thousands):
March 31, 2012
Acquisition cost
Government subsidies
Accumulated depreciation
Accumulated impairment loss
Book value
Development cost
Rs. 4,631,432 Rs. -
Rs. 2,111,941
Rs. -
Rs. 2,421,490
Patents
82,121 -
50,475
695
30,972
Other intangible assets
492,328
9,211
263,811
-
219,305
Rs. 5,205,880
Rs. 9,211
Rs. 2,526,228
Rs. 695
Rs. 2,669,747
December 31, 2011
Acquisition cost
Government subsidies
Accumulated Depreciation
Accumulated impairment loss
Book value
Development cost
Rs. 8,272,753
Rs. - Rs. 5,600,755
Rs. -
Rs. 2,671,998
Patents
79,716
- 47,356
481
31,879
Other intangible assets
482,516
11,449
246,858
-
224,361
Rs. 8,834,986
Rs. 11,449
Rs. 5,898,921
Rs. 481
Rs. 2,930,050
(2) Changes in intangible assets for the years ended March 31, 2012 and 2011 are as follows (Unit: Korean won in thousands):
March 31, 2012
Beginning balance Acquisition Depreciation Impairment loss Ending balance
Development cost ₩ 58,764,596 ₩ 2,452,438 ₩ 8,005,778 ₩ - ₩ 53,211,256
Patents
701,109 52,893 68,590 4,704 680,708 Other intangible
assets
4,930,999 215,781 323,655
- 4,823,125
₩ 64,396,704 ₩ 2,721,112 ₩ 8,398,023 ₩ 4,704 ₩ 58,715,089
December 31, 2011
Beginning balance Acquisition Depreciation Impairment loss Ending balance
Development cost ₩ 84,043,459 ₩ 2,681,639 ₩ 9,599,603 ₩ - ₩ 77,125,495
Patents
603,569 63,785 56,129 2,459 608,766 Other intangible
assets
4,524,104 90,000 413,752 - 4,200,352
₩ 89,171,132 ₩ 2,835,424 ₩ 10,069,484 ₩ 2,459 ₩ 81,934,613
(Unit: Indian-Rupee in thousands):
March 31, 2012
Beginning balance Acquisition Depreciation Impairment loss Ending balance
Development cost
Rs. 2,671,989 Rs. 111,511 Rs. 364,019 Rs. - Rs. 2,419,490 Patents
31,879 2,405 3,119 214 30,951
Other intangible assets
224,210 9,811 14,716 - 219,305
Rs. 2,928,087 Rs. 123,728 Rs. 381,854 Rs. 214 Rs. 2,669,747

- 15 -
Year ended December 31, 2011
Beginning balance Acquisition Depreciation Impairment loss Ending balance
Development cost
Rs. 3,821,416 Rs. 121,933 Rs. 436,489 Rs. - Rs. 3,506,859 Patents
27,444 2,900 2,552 112 27,680
Other intangible assets
205,709 4,092 18,813 - 190,988
Rs. 4,054,569 Rs. 128,925 Rs. 457,855 Rs. 112 Rs. 3,725,528
(3) Amortization of the Company’s intangible assets for the years ended March 31, 2012 and 2011 is as follows.
Korean Won in thousands Indian-Rupee in thousands Account
March 31, 2012 March 31, 2011 March 31, 2012 March 31, 2011
Cost of goods manufactured
₩ 7,914,945 ₩ 9,593,492 Rs. 360,130 Rs. 436,504
Selling and administrative expenses
483,078 475,992 21,980 21,658
₩ 8,398,023 ₩ 10,069,484 Rs. 382,110 Rs. 458,162
11. BORROWINGS:
(1) The Company’s short-term borrowings as of March 31, 2012 and 2011 are consist of the following (Unit: Won in thousands):
Creditor
Type Interest rate
(%)
March 31, 2012
December 31,2011 Korea Development Bank
Operating fund
CD + 3.50
₩ 30,000,000 ₩ 30,000,000
Korea Development Bank
Banker's usance
EUR: 3.45 USD: 2.25 JPY: 2.14
268,050 10,567,689
₩ 30,268,050 ₩ 40,567,689 (Unit: Indian-Rupee in thousands):
Type
kind Interest rate
(%)
March 31, 2012
December31,2011 Korea Development Bank
Operating fund
CD + 3.50
Rs. 1,365,000 Rs. 1,365,000
Korea Development Bank
Banker's usance
EUR: 3.45 USD: 2.25 JPY: 2.14
12,196
480,830
Rs. 1,377,196 Rs. 1,845,830
(2) The Company’s bonds and current portion of long-term borrowings as of March 31, 2012 and 2011 consist of the following
(Unit: Korean won in thousands):
Type
Issue date Maturity
date Interest rate
(%) March
31, 2012 December
31,2011
Private non-guaranteed bonds
2011-02-09 2014-02-09
7.00 ₩ 95,404,765
₩ 95,404,765
(Unit: Indian-Rupee in thousands):
Type
Issue date Maturity
date Interest rate
(%) March
31, 2012 December
31,2011
Private non-guaranteed bonds
2011-02-09 2014-02-09 7.00 Rs. 4,340,917 Rs. 4,340,917

- 16 -
(3) The Company provided the following collaterals in relation to its borrowings:
Creditor Assets pledged as collaterals Pledged date Maximum credit amount Korea Development Bank Land, buildings and machinery 2009-08-13 195 billion Korean Won
(7.8 billion Rupee) 12. DEBT RESTRUCTURING
The Company completed its debt restructuring, in accordance with the Court approval of the Company’s reorganizing plan dated December 17, 2009, and as a result, the Company’s capital decreased by ₩ 421,335,095 thousand (Rs. 19,170,747 thousand). In addition, the Company recognized a gain on exemption of debts amounting to ₩49,046,893thousand (Rs. 2,231,634 thousand) by approved debt reorganizing plan on January, 28 2011.
13. OTHER FINANCIAL LIABILITIES: Carrying value of the Company’s other financial liabilities as of March 31, 2011 and December 31, 2011 is as follows (Unit: Won in thousands, Rupee in thousands):
Korean Won in thousands Indian-Rupee in thousands
Classification
March 31, 2012
December 31, 2011 March 31, 2012 December 31, 2011 Other long-term financial liabilities:
₩ 10,610,358
₩ 16,599,583
Rs. 482,771
Rs. 755,281 Derivative liabilities 3,895,549 - 177,247 - ₩ 14,505,907 ₩ 16,599,583 Rs. 660,019 Rs. 755,281
14. PROVISION FOR PRODUCT WARRANTIES:
The Company provides warranties for the sale of its products and establishes a provision for product warranties for the amount of expected warranty costs. Provisions for product warranties as of March 31, 2012 and December 31, 2011 are as follows:
(Unit: Korean won in thousands):
Beginning balance
Increase
Decrease
Ending balance
Current
Non-current Mar. 31, 2012
₩122,007,836 ₩ 13,316,390 ₩13,634,274 ₩121,689,952 ₩ 47,254,937 ₩ 74,435,015
Dec. 31, 2011
77,265,249 101,046,995 56,304,408 122,007,836 47,093,611 74,914,225 (Unit: Rupee in thousands):
Beginning balance
Increase
Decrease
Ending balance
Current
Non-current Mar. 31, 2012
Rs. 5,551,357 Rs. 605,895 Rs. 620,359 Rs. 5,536,893 Rs. 2,150,100 Rs. 3,386,793
Dec. 31, 2011
3,515,569 4,597,639 2,561,851 5,551,357 2,142,759 3,408,597

- 17 -
15. OTHER LIABILITIES AND OTHER LONG-TERM LIABILITIES:
Carrying value of the Company’s other liabilities as of March 31, 2012 and December 31, 2011 is as follows
Korean won in thousands Indian-Rupee in thousands
Classification March 31, 2012
December 31, 2011 March 31, 2012 December 31, 2011 Other liabilities
Advances from customers ₩ 12,126,170
₩ 5,730,529
Rs. 551,741
Rs. 260,739
Deposits received 471,317 469,498 21,445 21,362 Withholdings 11,797,524 17,578,565 536,787 799,825 Income in advance 5,087,116 4,087,888 231,464 185,999
Total ₩ 29,482,127 ₩ 27,866,480 Rs 1,341,437 Rs 1,267,925 Other Long-term
liabilities
Withholdings 8,270 8,270 . 376 . 376
16. RETIREMENT BENEFIT OBLIGATION:
(1) Defined benefit plans and related liabilities arising from the company’s financial statements configuration items are as follows :
Korean won in thousands Indian-Rupee in thousands
Classification March 31, 2012
December 31, 2011 March 31, 2012 December 31, 2011 Present value of defined
benefit obligation ₩ 189,570,514 ₩ 188,058,593 Rs. 8,625,458 Rs. 8,556,666 Fair value of plan assets (2,948,524) (3,072,683) (134,158) (139,807) ₩ 186,621,990 ₩ 184,985,910 Rs. 8,491,301 Rs. 8,416,859
(2) Details of defined benefit plan recognized on the statements of operations for the three months ended March
31, 2012 and 2011 are as follows (Unit: Won in thousands):
Three months ended March 31, 2012
Three months ended March 31, 2011
Current service cost ₩ 5,764,127 ₩ 4,892,922
Interest cost
2,233,078 2,135,389 Expected return on plan assets
(23,395) (40,243)
₩ 7,973,810 ₩ 6,988,068
(Unit: Rupee in thousands):
Three months ended March 31, 2012
Three months ended March 31, 2011
Current service cost
Rs. 262,268 Rs. 222,628 Interest cost
101,605 97,160
Expected return on plan assets
(1,064) (1,831)
Rs. 362,808 Rs. 317,957
(3) Expenses related to defined benefit plan for the three months ended March 31, 2012 and 2011 are as
follows (Unit: Won in thousands):
Three months ended March 31, 2012
Three months ended March 31, 2011
Cost of goods manufactured ₩ 5,677,198 ₩ 4,893,767
Selling and administrative expenses
2,296,612 2,094,301

- 18 -
Three months ended March 31, 2012
Three months ended March 31, 2011
₩ 7,973,810 ₩ 6,988,068
(Unit: Rupee in thousands):
Three months ended March 31, 2012
Three months ended March 31, 2011
Cost of goods manufactured
Rs. 258,313 Rs. 222,666 Selling and administrative expenses
104,495 95,291
Rs. 362,808 Rs. 317,957
(4) Changes in the Company’s defined benefit obligation for the period ended March 31, 2012 and 2011 are as
follows (Unit: Won in thousands):
Three months ended March 31, 2012
Three months ended March 31, 2011
Beginning balance ₩ 188,058,593 ₩ 151,897,559
Current service cost
5,764,127 4,892,922 Interest cost
2,233,078 2,135,389
Actuarial gains (losses)
- - Wages paid
(6,338,614) (972,468)
Other
(146,670) (19,176) Ending balance
₩ 189,570,514 ₩ 157,934,226
(Unit: Rupee in thousands):
Three months ended March 31, 2012
Three months ended March 31, 2011
Beginning balance
Rs. 8,556,666 Rs. 6,911,339 Current service cost
262,268 222,628
Interest cost
101,605 97,160 Actuarial gains (losses)
Wages paid
(288,407) (44,247) Other
(6,673) (873)
Ending balance
Rs. 8,625,458 Rs. 7,186,007
(5) Changes in the fair value of plan assets for the period ended March 31, 2012 and 2011 are as follows (Unit: Won in thousands):
Three months ended March 31, 2012
Three months ended March 31, 2011
Beginning balance ₩ 3,072,683 ₩ 3,219,524
Expected return on plan assets
23,394 40,243 Actuarial gains (losses)
(883) (13,593)
Wages paid
(146,670) (19,176) Ending balance
₩ 2,948,524 ₩ 3,226,998
(Unit: Rupee in thousands):
Three months ended March 31, 2012
Three months ended March 31, 2011
Beginning balance
Rs. 139,807 Rs. 146,488 Expected return on plan assets
1,064 1,831
Actuarial gains (losses)
(40) (618) Wages paid
(6,673) (873)
Ending balance
Rs. 134,158 Rs. 146,828

- 19 -
(6) Actuarial assumptions used as of March 31, 2012 and December 31, 2011 are as follows:
March 31, 2012 December 31, 2011
Discount rate (%)
4.80
4.80 Expected return on plan assets (%)
3.08
3.08
Expected rate of salary increase (%)
5.32
5.32
The expected rate of return on plan assets was derived from weighted average market values of each plan asset. A long-term historical rate of return, current market situation, and strategic asset allocation are equally considered for the calculation of the expected rate of return.
(7) The actual return on plan assets for the period ended March 31, 2012 and 2011 are as follows
Korean Won in thousands Indian-Rupee in thousands
March 31,2012 March 31, 2011 March 31,2012 March 31, 2011
Actual return on plan assets
₩ 22,511
₩ 26,650
Rs. 1,024
Rs. 1,213
(8) Company's plan assets as of March 31, 2012 and December 31, 2011 are composed of as follows:
Korean Won in thousands Indian-Rupee in thousands
March 31,2012 March 31, 2011 March 31,2012 March 31, 2011
Others ₩ 2,948,524 ₩ 3,072,683 Rs. 134,158 Rs 139,807
17. CONTINGENCIES AND COMMITMENTS:
The following are the major commitments and contingent liabilities as of March 31, 2012.
(1) The Company carries a product liability insurance for all products sold in domestic region. (2) As of March 31, 2012, the company has been providing guarantees from WORRI BANK and etc amounting
to USD 24,265,671, EUR 5,432,357 and JPY 71,531,200 related to import L/C.
provided Contract period Contract
price(USD) Amount execution Amount execution
WOORIBANK 2011.08.23~2012.08.23 USD 40,000,000 USD 18,816,308 Usance import credit
limit
KDB 2011.07.27~2012.07.27 USD 65,000,000
USD 5,449,363 Usance import credit
limit EUR 5,432,357 JPY 71,531,200
Total
USD 24,265,670 EUR 5,432,357 JPY 71,531,200
(3) The followings are the major loan arrangements with the financial institutions as of March 31, 2012. (Unit: Korean won in thousands):
Financial institution Classification Limit Exercise price KDB Operating purpose loans ₩ 80,000,000 ₩ 30,000,000
(Unit: Indian-Rupee in thousands):
Financial institution Classification Limit Exercise price KDB Operating purpose loans Rs 3,640,000 Rs 1,365,000

- 20 -
(4) As of March 31, 2012, the Company has three pending litigations as a plaintiff with claims amounting to ₩15,240 million (Rs. 693 million) and twenty-five pending litigations as a defendant with claims amounting to ₩11,932 million (Rs. 543 million). Details of significant pending litigations as of March 31, 2012 are as follows:
Type of litigation Claimed amount Plaintiff Defendant Remarks
(Korean won in thousands)
(Indian-Rupee in thousands)
Prohibition of air pollution emission ₩ 10,000
Rs. 455
Kwon, joonghee
The Company
3rd trial pending
Debt non-existence confirmation 959,090
43,639
Telstar Hommel
The Company
1st trial pending
Objection to confirmation trial 1,560,000
70,980
SK E&C Co., Ltd.
The Company
1st trial pending
Wages 4,464,000 203,112
Sung-Ho Lee and 247 others
The Company
1st trial pending
Void dismissal 3,020,015 137,411
Suk-joo Noh and 155 others
The Company
1st trial pending
Compensation for damages 5,000,000
227,500
The Company
Labor Union, Kap Deuk Jung and others
1st trial pending
Compensation for damages 10,000,000
455,000
The Company
Federation of Korean Metal Workers’
Trade Union
1st trial pending Unfair dismissal Remedies 240,000
10,920
The Company
Central Labor Council
2nd trial pending
(*) For the above pending litigations, the Company recognized other payables amounting to ₩2,153,342 thousand (Rs. 97,977 thousand) that are expected to be a probable loss and can be reasonably estimated as of March 31, 2012. 18. CAPITAL STOCK: As of March 31, 2012, the number of authorized shares is 3 billion shares. Details of capital stock are as follows: (Unit: Won in thousands except par value)
Classification Number of authorized shares
Par value
Capital stock Mar. 31, 2012 121,961,841
₩ 5,000
₩ 609,809,205
(Unit: Rupee in thousands except par value):
Classification Number of authorized shares
Par value
Capital stock Mar. 31, 2012 121,961,841
Rs. 228
Rs. 27,746,319
19. OTHER CAPITAL SURPLUS:
Details of the Company’s other capital surplus and retained earnings as of March 31, 2012 and December 31, 2011 are as follows

- 21 -
(Unit: Won in thousands):
Classification
March 31, 2012
December 31, 2011 Other Capital
Surplus Paid-in capital in excess
of par value ₩ 4,213,878 ₩ 4,213,878
Gain on retirement of
capital stock 120,351,580 120,351,580
Debt converted to
equity 931,508 931,508
₩ 125,496,966 ₩ 125,496,966 (Unit: Indian-Rupee in thousands):
Classification
March 31, 2012
December 31, 2011 Other Capital
Surplus Paid-in capital in excess
of par value Rs. 191,731 Rs. 191,731
Gain on retirement of capital stock 5,475,997 5,475,997
Debt converted to
equity 42,384 42,384
Rs. 5,710,112 Rs. 5,710,112
20. OTHER CAPITAL ADJUSTMENTS
(1) Detail of the company’s other Capital adjustment of March 31 ,2012 and December 31 ,2011 are as follows (Unit: Won in thousands): Classification March 31, 2012 December 31, 2011
Other Capital Adjustments
Gains on valuation of derivatives ₩ (2,398,750) ₩ 193,310
(Unit: Indian-Rupee in thousands): Classification March 31, 2012 December 31, 2011
Other Capital Adjustments
Gains on valuation of derivatives Rs. (109,143) Rs. 8,796
(2) Canges in the Company’s Gains on valuation of Derivatives for the year ended March 31, 2012 and 2011
are as follows (Unit: Korean Won and India-Rupee in thousands):
Won in thousands India-Rupee in thousands
March 31, 2012 December 31, 2011 March 31, 2012 December 31, 2011
Beginning balance ₩ 193,310
₩ Rs. 8,796 Rs. -
Gains on valuation of derivatives
(2,592,060)
193,310 (117,939) 8,796
Ending balance
(2,398,750)
193,310 (109,143) 8,796
21. RETAIN EARNING
(1) Details of the Company’s Retain Earing of March 31 ,2012 and December 31 ,2011 are as follows

- 22 -
(Unit: Won in thousands):
March 31, 2012
December 31, 2011
Appropriation of Retain Earning ₩ 146,153,409
₩ 177,718,820
(Unit: Indian-Rupee in thousands):
March 31, 2012
December 31, 2011 Appropriation of Retain
Earning Rs. 6,649,980
Rs. 8,086,170 (2) Change on Retain Earing of March 31 ,2012 and December 31 ,2011 are as follows
(Unit: Won in thousands):
March 31, 2012
December 31, 2011 Beginning Balance
₩ 177,718,020
₩ (404,029,299)
Loss on Appropriated Retained Earnings (31,563,728)
(112,438,814)
Actuarial losses
(883)
(20,513,864) Appropriated Retained
Earnings for Deficit Recovery -
714,699,997
Ending Balance ₩ 146,153,409
₩ 177,718,020
(Unit: Indian-Rupee in thousands):
March 31, 2012
December 31, 2011 Beginning Balance Rs. 8,086,170
Rs. (18,383,333)
Loss on Appropriated Retained Earnings (1,436,150)
(5,115,966)
Actuarial losses (40)
(933,381) Appropriated Retained
Earnings for Deficit Recovery
32,518,850
Ending Balance Rs. 6,649,980
Rs. 8,086,170 22. INCOME TAX:
(1) Composition of income tax expense for the three months ended March 31, 2012 and 2011 are as follows
(Unit: Won in thousands):
Three months ended March 31, 2012
Three months ended March 31, 2011
Current income tax payable ₩ - ₩ -
Income tax expense directly reflected to shareholders’ equity
-
-
Income tax expense ₩ - ₩ -
(Unit: Rupee in thousands):
Three months ended March 31, 2012
Three months ended March 31, 2011
Current income tax payable Rs. -
Rs. - Income tax expense directly reflected to shareholders’ equity
-
-
Income tax expense Rs. -
Rs. -

- 23 -
(2) Changes in temporary differences and deferred income tax assets (Unit: Won in thousands): The changes in temporary differences and deferred income tax assets for the three months ended March 31, 2012 are as follows
(Unit: Won in thousands):
Description
Beginning Balance
Decrease
Increase
Ending balance
(Temporary differences)
Allowance for doubtful
accounts ₩ (1,781,828) ₩ 1,535,377 ₩ 4,870,225 ₩ 1,553,020
Government subsidies
5,565,857 1,314,233 10,516 4,262,140 Provision for product
warranties
122,007,836 73,140,516 121,689,952 170,557,272 Accrued severance
indemnities
180,520,441 212,903 4,768,469 185,076,007 Impairment loss on
property, plant and equipment, net
131,688,428 10,865,896 73,609,975 194,432,507
Development cost
42,473,990 23,236,132 21,835,359 41,073,217 Depreciation
9,532,068 585,307 1,870,213 10,816,974
Other payables
13,838,928 13,838,928 60,507,259 60,507,259 Accrued expenses
15,552,941 15,552,941 9,490,572 9,490,572
Investments in subsidiaries
2,684,828 - 178,862 2,863,690 Gain (loss) on foreign
currency translation
1,212,429 19,318,719 - (18,106,290)
Present value discount
(8,398,864) 56,982,219 - (65,381,083) Other long-term employee
benefits
12,367,890 -
- 12,367,890
Land
(261,695,316) - 988,077 (260,707,239) Other
(628,420) 349,089 380,627 (596,882)
Deficit carried over
1,051,562,801 - 113,000,379 1,164,563,180
Total 1,316,504,009 1,512,772,234 Not recognized as deferred
tax assets
1,316,504,009 1,512,772,234 Recognized as deferred tax
assets
- - Statutory tax rate
22% 22%
Deferred tax assets resulting from temporary differences
- -
Tax credit carry forwards
20,026,962
20,026,962 1,512,772,234 Not recognized as deferred
tax assets
20,026,962
20,026,962 Recognized as deferred tax
assets
Deferred tax assets resulting from tax credit carry forwards
Total deferred income tax

- 24 -
(Unit: Rupee in thousands):
Description
Beginning Balance
Decrease
Increase
Ending balance
(Temporary differences)
Allowance for doubtful
accounts
Rs. (81,073) Rs. 69,860 Rs. 221,595 Rs. (232,808) Government subsidies
253,246 59,798 478 312,566
Provision for product warranties
5,551,357 3,327,893 5,536,893 3,342,357
Accrued severance indemnities
8,213,680 9,687 216,965 8,006,402
Impairment loss on property, plant and equipment, net
5,991,823 494,398 3,349,254 3,136,967
Development cost
1,932,567 1,057,244 993,509 1,996,302 Depreciation
433,709 26,631 85,095 375,245
Other payables
629,671 629,671 2,753,080 (1,493,738) Accrued expenses
707,659 707,659 431,821 983,497
Investments in subsidiaries
122,160 - 8,138 114,022 Gain (loss) on foreign
currency translation
55,166 879,002 - 934,168 Present value discount
(382,148) 382,148 - 2,210,543
Other long-term employee benefits
562,739 - - 562,739
Land
(11,907,137) - 44,958 (11,952,095) Other
(28,593) 15,884 17,319 (30,028)
Deficit carried over
47,846,107 - 5,141,517 42,704,590
Total
Rs. 59,900,932 Rs. - Rs. - Rs. 59,900,932
Not recognized as deferred tax assets
59,900,932 - - 59,900,932
Recognized as deferred tax assets
- - - -
Statutory tax rate
22% - - 22%
Deferred tax assets resulting from temporary differences
- - - -
Tax credit carry forwards
911,227 911,227
Not recognized as deferred tax assets
911,227 911,227
Recognized as deferred tax assets
Deferred tax assets resulting from tax credit carry forwards
Total deferred income tax
The Company did not recognize deferred income tax assets related to the temporary differences, deficit carried forward and tax credit carried forward since it could not estimate the income tax effect resulting from future taxable income.

- 25 -
23. EXPENSES BY CATEGORY: Details of expenses classified by category for the period ended March 31, 2012 and 2011 are as follows (Unit: Won in thousands):
March 31, 2012 March 31, 2011
Changes in inventories ₩ (16,738,963) ₩ (25,385,733) Cost of raw materials and merchandise goods 474,623,525 462,192,079 Salary 50,778,525 55,683,212 Depreciation 24,820,169 21,306,668 Amortization 8,398,023 10,069,484 Payments expense 2,520,016 3,823,119 Development expenses 27,014,796 29,370,608 Product warranty 13,316,390 20,415,452 Sales commissions 22,484,831 22,718,493 Export cost 18,388,820 18,352,381 Others 48,832,513 43,613,517 ₩ 674,438,645 ₩ 662,159,280
(Unit: Rupee in thousands):
March 31, 2012 March 31, 2011
Changes in inventories
Rs. (761,623) Rs. (1,155,051) Cost of raw materials and merchandise goods 21,595,370 21,029,740 Salary 2,310,423 2,533,586 Depreciation 1,129,318 969,453 Amortization 382,110 458,162 Rent expense 114,661 173,952 Development expenses 1,229,173 1,336,363 Product warranty 605,896 928,903 Payments commissions 1,023,060 1,033,691 Export cost 836,691 835,033 Others 2,221,878 1,984,415 Rs. 30,686,958 Rs. 30,128,247
24. DERIVATIVES FINANCIAL INSTRUMENTS: The company is making a derivative contract with Woori Bank and KDB to avoid the risks of exchange rate fluctuation by fitting the amount and period of expected foreign currency sales (hedged items) and derivative financial instruments(hedging instrument). Cash flow risk aversion accounting treatment is applied on valuation of derivatives of ₩ 2,398,750 thousand (Rs 109,143 thousand) as other capitals components and also, ₩ 324,061 thousand ( Rs 14,745 thousand) recognized as accumulated other comprehensive income for the year ended March 31, 2012. 25. SELLING AND ADMINISTRATIVE EXPENSES: (1) Selling expenses for the period ended March 31, 2012 and 2011 are as follows):
Korean Won in thousands Indian-Rupee in thousands
2012 2011 2012 2011
Warranty expenses ₩ 13,316,390 ₩ 20,415,452 Rs. 605,896 Rs. 928,903 Sales commissions 22,484,832 22,718,493 1,023,060 1,033,691 Sales promotional
expenses 5,933,599 4,106,343 269,979 186,839 Packaging expenses 948,207 870,292 43,143 39,598

- 26 -
Korean Won in thousands Indian-Rupee in thousands
2012 2011 2012 2011
Advertising expenses 2,050,008 1,199,750 93,275 54,589 Freight expenses 7,143,020 6,294,771 325,007 286,412 Export expenses 18,388,820 18,352,381 836,691 835,033
₩ 70,264,876 ₩ 73,957,482 Rs. 3,197,052 Rs. 3,365,065
(2) Administrative expenses for the period ended March 31, 2012 and 2011 are as follows (Unit: Won in
thousands):
Korean Won in thousands Indian-Rupee in thousands
2012
2011 2012 2011
Salaries ₩ 9,277,120 ₩ 10,073,768 Rs. 422,109 Rs. 458,356
Post-employment benefits 1,270,212 1,015,008 57,795 46,183 Employee benefits 2,620,838 1,850,834 119,248 84,213 Travel expenses 193,402 251,319 8,800 11,435 Communication expenses 239,558 223,563 10,900 10,172 Electricity expenses 157,435 144,221 7,163 6,562 Utility expenses 121,311 121,543 5,520 5,530 Taxes and dues 455,713 385,356 20,735 17,534 Rent expense 3,739,315 3,519,695 170,139 160,146 Repair expenses 146,792 173,986 6,679 7,916 Insurance 35,873 36,731 1,632 1,671 Entertainment expenses 74,379 32,086 3,384 1,460 Vehicles 191,756 213,625 8,725 9,720 Overseas marketing
expenses
36,911 52,346 1,679 2,382 Training 190,561 164,341 8,671 7,478 Printing 50,462 110,213 2,296 5,015 Supplies 103,739 84,952 4,720 3,865 Conference expense 60,563 27,607 2,756 1,256 Service fees 2,185,925 3,734,471 99,460 169,918 Legal expense 84,364 7,695 3,839 350 Outsourcing expense 4,785,725 3,720,756 217,750 169,294 Computing expense 1,350,254 1,138,208 61,437 51,788 Depreciation 1,057,717 745,667 48,126 33,928 Other administrative
expenses
177,046 178,306 8,056 8,113 R&D expenses 3,688,134 5,050,789 167,810 229,811 Amortization 483,079 475,992 21,980 21,658 Bad debt expense 176,723 - 8,041 - ₩ 32,954,906 ₩ 33,533,077 Rs. 1,499,448 Rs. 1,525,755
26. OTHER OPERATING INCOME (EXPENSES): (1) Details of the Company’s other operating income for the period ended March 31, 2012 and 2011 are as
follows (Unit: Won in thousands):
Korean Won in thousands Indian-Rupee in thousands
2012
2011 2012 2011
Commission income ₩ 238,785 ₩ - Rs. 10,865 Rs. - Gain on foreign currency
transactions
1,713,246 1,902,472 77,953 86,562 Gain on foreign currency
translation
520,250 739,468 23,671 33,646
Gain on disposal of property, 12,125 3,001,655 552 136,575

- 27 -
Korean Won in thousands Indian-Rupee in thousands
2012
2011 2012 2011
plant and equipment Gain on disposal of investment
assets
2,529 969 115 44 Product warranty reserve 1,154,499 1,185,048 52,530 53,920 Others, net 2,948,776 3,747,566 134,168 170,514 Reversal of allowance for
doubtful accounts
45,309 689,884 2,062 31,390
₩ 6,635,518 ₩ 11,267,062 Rs. 301,916 Rs. 512,651
2) Details of the Company’s other operating expense for the year ended December 31, 2012 and 2011 are as follows:
Korean Won in thousands Indian-Rupee in thousands
2012
2011 2012 2011
Gain on foreign currency transactions ₩ 2,381,005 ₩ 2,883,974 Rs. 108,336 Rs. 131,221 Gain on foreign currency translation 368,826 1,443,811 16,782 65,693 Gain on disposal of property, plant
and equipment 24,246 44,521 1,103 2,026
Gain on disposal of investment assets 4,874 4,101 222 187 Others, net 3,651,803 2,755,558 166,156 125,377
Impairment loss on Investment assets 110,005
- 5,005 -
Impairment loss on property, plant and equipment
4,704 2,459 214 112
Reversal of allowance for doubtful accounts
2,251,929 4,388,354 102,463 199,670
Depreciation on asset not in use 16,605 3,758 756 171 Donation 10,000 - 455 -
₩ 8,823,997 ₩ 11,526,536 Rs. 401,492 Rs. 524,457 27. FINANCIAL REVENULES AND EXPENSES: (1) Details of the Company’s financial revenues for the period ended March 31, 2012 and 2011 are as follows (Unit: Won in thousands):
Korean Won in thousands Indian-Rupee in thousands
2012
2011 2012 2011
Interest income ₩ 1,741,312 ₩ 1,100,263 Rs. 79,230 Rs. 50,062 Dividend income 307,542 6,000 13,993 273 Gain on foreign currency
transactions
430,802 - 19,601 - Gain on foreign currency
translation
62,818 956,480 2,858 43,520 Gain on disposal of derivatives 1,792,000 - 81,536 - Gain on transaction of derivatives 157,858 - 7,183 - Gain on debt exemption - 49,046,893 - 2,231,634 ₩ 4,492,332 ₩ 51,109,636 Rs. 204,401 Rs. 2,325,488
(2) Details of the Company’s financial costs for the period ended March 31, 2012 and 2011 are as follows (Unit: Won in thousands):
Korean Won in thousands Indian-Rupee in thousands
2012
2011 2012 2011
Interest expense ₩ 2,327,349 ₩ 4,614,465 Rs. 105,894 Rs. 209,958 Loss on foreign currency
transactions
463,583 -
21,093
-
Loss on foreign currency translation
11,679 1,992,447 531 90,656

- 28 -
Korean Won in thousands Indian-Rupee in thousands
2012
2011 2012 2011
Loss on disposal of derivatives
114,500 - 5,210 -
Loss on valuation of derivatives 481,919 - 21,927 -
₩ 3,399,030 ₩ 6,606,912 Rs. 154,655 Rs. 300,614
(3) Details of the Company’s financial gain/loss for the period ended March 31, 2012 and 2011 are as follows
Korean Won in thousands Indian-Rupee in thousands
2012
2011 2012 2011
Receivables ₩ 75,326 ₩ 85,221 Rs. 3,427 Rs. 3,878 Avail of for sales in financial
asset
6,000 6,000 273 273
Other financial liabilities 1,011,976 44,411,503 46,045 2,020,723 ₩ 1,093,302 ₩ 44,502,724 Rs. 49,745 Rs. 2,024,874
28. INCOME LOSS PER SHARE: (1) Basic income (loss) per share for the periods ended December 31, 2012 and 2011 is calculated as follows: (Unit: Won in thousands, except for earnings per share):
March 31, 2012 December 31, 2011
Net loss
₩ (31,563,728) ₩ 2,609,127 Preferred stock dividends
- -
Loss contributed to common stocks
(31,563,728) 2,609,127 Number of common stocks outstanding (*)
121,539,603 84,524,681
Basic and diluted loss per share
(260) 31 (*) Basic and diluted losses per share for the period ended March 31, 2012 and 2011 are identical since there are
no dilutive potential common shares. (Unit: Rupee in thousands, except for earnings per share):
March 31, 2012 December 31, 2011
Net loss
Rs. (1,436,150) Rs. 118,715 Preferred stock dividends
- -
Loss contributed to common stocks
(1,436,150) 118,715 Number of common stocks outstanding (*)
121,539,603 84,524,681
Basic and diluted loss per share
(260) 31 (*) Basic and diluted losses per share for the period ended March 31, 2011 and 2011 are identical since there are
no dilutive potential common shares. (2) Number of outstanding for the periods ended March 31, 2012 and December 31, 2011 is calculated as
follows
March 31. 2012
(Number of Share) Time Interval Outstanding
Accumulated Outstanding
Weighted Average Impact
Common stock 2010-01-01 2010-12-31 ₩121,539,603 ₩121,539,603 ₩ 121,539,603 Total ₩ 121,539,603

- 29 -
December 31. 2012
(Number of Share)
Time Interval Outstanding Accumulated Outstanding
Weighted Average Impact
Common stock 2011-01-01 2011-02-08 ₩ 36,120,556 ₩ 36,120,556 ₩ 15,652,240 Additional Share 2011-02-09 2011-12-31 85,419,047 121,539,603 68,872,441
Total ₩ 84,524,681 29. CASH FLOWS FROM OPERATING ACTIVITIES: (1) Details of cash flow from operating activities as of March 31, 2012 and 2011 are as follows (Unit: Won in thousands):
March 31, 2012 March 31, 2011
Cash flow from operating ₩ 72,786,363 ₩ 10,684,196 1. Net loss
(31,563,728) 2,609,126
2. Adjustments:
43,408,787 (1,612,364) (1) Addition of expenses
47,048,721 53,795,672
Loss on foreign currency translation
380,505 3,436,258 Loss on disposal of trade receivables
2,251,929 4,388,354
Loss on valuation of derivatives
481,919 - Loss on valuation of inventories
- 2,859,675
Rent expense
77,861 77,861 Bad debt expense
176,723 -
Depreciation
24,820,169 21,306,668 Loss on disposal of investment assets
4,874 4,101
Loss on disposal of property, plant and equipment
24,246 44,521 Impairment loss on property, plant and equipment
110,005 -
Amortization
8,398,023 10,069,484 Impairment loss on intangible assets
4,704 2,459
Interest expense
2,327,348 4,614,465 Employee benefits (including long-term)
7,973,810 6,988,068
Depreciation Expenses on Assets not in Use
16,605 3,758 (2) Deduction of revenue
(3,639,934) (55,541,621)
Gain on foreign currency translation
583,068 1,695,948 Reversal of allowance for doubtful accounts
45,309 689,884
Reversal of Loss on valuation of inventories reverse
790,191 - Interest income
1,741,312 1,100,263
Dividend income
307,542 6,000 Gain on valuation of derivatives
157,858 -
Gain on disposal of investment assets
2,529 969 Gain on disposal of property, plant and equipment
12,125 3,001,655
Gain on debt exemption
- 49,046,893 Other gain
- 9
3) Changes in working capital
60,941,304 9,896,913 Increase(Decrease) in trade receivables, net
(11,366,350) 4,651,818
Decrease (Increase) in other receivables, net
(7,138,554) (2,657,630) Increase(Decrease) in deposits
- ₩ (104,345)
Decrease (Increase) in advanced payments
5,846,499 14,209,483 Decrease (Increase) in prepaid expenses
(254,565) 817,015
Increase (Decrease) in income tax refundable
(216,549) (154,702) Decrease (Increase) in inventories
(13,904,511) (10,389,255)
Increase in long security
289,300 571,912 Increase (Decrease) in non-current assets
113,434,164 8,912,901
Increase (Decrease) in trade payables
(14,959,371) (11,001,823)

- 30 -
March 31, 2012 March 31, 2011
Increase (Decrease) in other payables
(5,907,606) - Increase in deposits received
1,819 (45,427)
Decrease (Increase) in current other long term benefit
(202,730) - Increase (Decrease) in advances from customers
6,395,641 745,172
Decrease in withholdings
(5,781,040) (2,540,542) Increase (Decrease) in unearned revenue
705,147 73,087
Increase (Decrease) in government subsidies
304,582 (62,626) Decrease in short-term provision of product warranties
161,326 2,616,436
Decrease in long-term other payables
- (22,090) Increase in other long term benefit
351,926 333,834
Payment of severance indemnities
(6,338,614) (972,468) Increase in long-term provision of product warranties
(479,210) 4,916,163
2. Interest received
1,622,094 1,017,646 3. Interest paid
(2,301,026) (1,138,693)
4. Dividends received
71,900 6,000 Net cash provided by operating activities
72,179,331 10,778,628
(Unit: Rupee in thousands):
March 31, 2012 March 31, 2011
Cash flow from operating
Rs. 3,311,780 Rs. 489,583 1. Net loss
(1,436,149) 118,714
2. Adjustments:
1,975,098 (79,441) (1) Addition of expenses
2,140,716 2,447,703
Loss on foreign currency translation
17,313 156,349 Loss on disposal of trade receivables
102,463 199,670
Loss on valuation of derivatives
21,927 - Loss on valuation of inventories
- 130,115
Rent expense
3,543 3,543 Bad debt expense
8,041 -
Depreciation
1,129,317 969,453 Loss on disposal of investment assets
222 187
Loss on disposal of property, plant and equipment
1,103 2,026 Impairment loss on property, plant and equipment
5,005 -
Amortization
382,110 458,162 Impairment loss on intangible assets
214 112
Interest expense
105,894 209,958 Employee benefits (including long-term)
362,808 317,957
Depreciation Expenses on Assets not in Use
756 171 (2) Deduction of revenue
(165,618) (2,527,144)
Gain on foreign currency translation
26,530 77,166 Reversal of allowance for doubtful accounts
2,062 31,390
Reversal of Loss on valuation of inventories reverse
35,954 - Interest income
79,230 50,062
Dividend income
13,993 273 Gain on valuation of derivatives
7,183 -
Gain on disposal of investment assets
115 44 Gain on disposal of property, plant and equipment
552 136,575
Gain on debt exemption
- 2,231,634 Other gain
- -
3) Changes in working capital
2,772,831 450,310 Increase(Decrease) in trade receivables, net
(517,168) 211,661
Decrease (Increase) in other receivables, net
(324,804) (120,922) Increase(Decrease) in deposits
- (4,748)
Decrease (Increase) in advanced payments
266,016 646,531 Decrease (Increase) in prepaid expenses
(11,583) 37,174
Increase (Decrease) in income tax refundable
(9,853) (7,039)

- 31 -
March 31, 2012 March 31, 2011
Decrease (Increase) in inventories
(632,655) (472,711) Increase in long security
13,163 26,022
Increase (Decrease) in non-current assets
5,161,254 405,537 Increase (Decrease) in trade payables
(680,651) (500,583)
Increase (Decrease) in other payables
(268,796) - Increase in deposits received
83 (2,067)
Decrease (Increase) in current other long term benefit
(9,224) - Increase (Decrease) in advances from customers
291,002 33,905
Decrease in withholdings
(263,037) (115,595) Increase (Decrease) in unearned revenue
32,084 3,325
Increase (Decrease) in government subsidies
13,858 (2,849) Decrease in short-term provision of product warranties
7,340 119,048
Decrease in long-term other payables
- (1,005) Increase in other long term benefit
16,013 15,189
Payment of severance indemnities
(288,407) (44,247) Increase in long-term provision of product warranties
(21,804) 223,685
2. Interest received
73,805 46,303 3. Interest paid
(104,697) (51,811)
4. Dividends received
3,271 273 Net cash provided by operating activities
3,284,159
484,348
30. SEGMENT INFORMATION: (1) The company determines a single reportable segment by considering nature and characteristics of an asset
which provides service to generate revenue. The segment’s operating income, income before income tax and its assets and liabilities has omitted from disclosures.
. (2) Information of each sales region as of March 31, 2011 is as follows
Korean Won in thousands Indian-Rupee in thousands
2012
2011 2012 2011
Republic of Korea ₩ 305,974,640 ₩ 333,624,236 Rs. 13,921,846 Rs. 15,179,903 Europe 181,119,009 151,347,689 8,240,915 6,886,320 Asia Pacific 37,636,695 17,763,921 1,712,470 808,258 Others 119,239,750 117,789,310 5,425,409 5,359,414 ₩ 643,970,094 ₩ 620,525,157 Rs. 29,300,640 Rs. 28,233,895
*Sales of non-current asset exclude from listed table due to secure the major customer, individual and oversee agency, information. . (3) Sales revenue by type of automobile for the period ended March 31, 2012 is as follows (Unit: won in thousands)
March 31, 2012 March 31, 2011
Type of automobile
Domestic Export
Domestic Export
CHAIRMAN H ₩ 10,565,075 ₩ - ₩ 23,032,876 ₩ -
CHAIRMAN W
34,190,834 1,803,740 55,945,369 352,234 ACTYON
- 9,960,299 442,241 19,987,252
ACTYON SPORTS
2,182 541,801 60,927,810 50,149,017 KORANDO C
59,520,391 120,714,108 43,877,288 100,843,281
KYRON C Sports
125,425,582 63,443,310 - - KYRON 22,671 72,010,009 1,282,438 60,191,849 REXTON 7,416,468 42,689,471 65,940,437 26,196,539 RODIUS
107,935 8,269,970
6,572,530 9,546,010
₩ 237,251,138 ₩ 319,432,708
₩ 258,020,989 ₩ 267,266,182

- 32 -
(Unit: Indian-Rupee in thousands):
March 31, 2012 March 31, 2011
Type of automobile
Domestic Export Domestic Export
CHAIRMAN H
Rs. 480,711 Rs. - Rs. 1,047,996 Rs. - CHAIRMAN W
1,555,683 82,070 2,545,514 16,027
ACTYON
- 453,194 20,122 909,420 ACTYON SPORTS
99 24,652 2,772,215 2,281,780
KORANDO C
2,708,178 5,492,492 1,996,417 4,588,369 KYRON C Sports
5,706,864 2,886,671 - -
KYRON 1,032 3,276,455 58,351 2,738,729 REXTON 337,449 1,942,371 3,000,290 1,191,943 RODIUS
4,911 376,284
299,050 434,343
Rs. 10,794,927 Rs. 14,534,188
Rs. 11,739,955 Rs. 12,160,611
31. RELATED PARTY TRANSACTIONS: (1) The Company’s controlling company is Mahindra & Mahindra Ltd. and the Company’s subsidiaries are
Ssangyong (Yizheng) Auto-parts Manufacturing Co., Ltd., Ssangyong Motor (Shanghai) Co., Ltd. and Ssangyong European Parts Center B.V.
(2) Major transactions with the related parties for the three months ended March 31, 2012 and 2011 are as
follows. (Unit: Won in thousands): March 31, 2012 March 31, 2011
Sales and Others
Purchases and others
Sales and Others
Purchases and others
Transactions with controlling ₩ 85,384 ₩ 1,810,634 ₩ - ₩ - Transactions with subsidiaries 3,131,575 - 3,596,228 22,397 Transactions with Other
affiliates
6,723,923 3,864 - -
(Unit: Rupee in thousands): March 31, 2012 March 31, 2011
Sales and Others
Purchases and others
Sales and Others
Purchases and others
Transactions with controlling Rs. 3,885 Rs. 82,384 Rs. - Rs. - Transactions with subsidiaries 142,942 - 163,628 1,019 Transactions with Other
affiliates
305,938 176 - - (3) Outstanding receivables and payables from transactions with related parties as of March 31, 2012 and
December 31, 2011 are as follows (Unit: Won in thousands):
March 31, 2012 December 31, 2011
Payables to controlling company: Receivables and others ₩ 343,190 ₩ 91,687
Payables and others 257,638 96,459,115 Receivables and payables to subsidiaries Receivables and others - 14,069,436 Payables and others 668,723 668,723 Receivables and payables to Other affiliates Receivables and others 1,226,268 - Payables and others 1,461,627 -

- 33 -
(Unit: Rupee in thousands):
March 31, 2012 December 31, 2011
Payables to controlling company: Receivables and others Rs. 15,615 Rs. 4,172 Payables and others 11,723 4,388,890 Receivables and payables to subsidiaries Receivables and others - 640,159 Payables and others 30,427 30,427 Receivables and payables to Other affiliates Receivables and others 55,795 - Payables and others 66,504 -
The Company did not recognize allowance for the above receivables and no bad debt expense was recognized for the period ended March 31, 2012. (4) Details of compensation cost for key executives for the period ended March 31, 2012 and 2011 are as
follows
(Unit: Won in thousands):
March 31, 2012 December 31, 2011
Short-term employee benefits ₩ 117,694
₩ 110,000
Employment benefits
1,119
1,388
(Unit: Rupee in thousands):
March 31, 2012 December 31, 2011
Short-term employee benefits
Rs. 5,355 Rs. 5,005 Post-employment benefits
51 63
32. FINANCIAL INSTRUMENTS: (1) Capital risk management The Company manages capital risk in order to maximize shareholders' profit by maintaining a sound capital structure, and in order to achieve an optimum capital structure. The company’s strategy doesn’t change from 2011. The Company uses debt ratio as a capital management index and calculates the ratio as total liabilities divided by total equity. Debt to Equity ratio for the period ended March 31, 2012 and December 31, 2011 are as follows (Unit: Won in thousands):
December 31, 2012 December 31, 2011
Debt (A) ₩ 976,021,240 ₩ 886,472,294 Equity (B) 879,060,831 913,217,502 Debt ratio (A/ B) 111.03% 97.07%
(Unit: Indian-Rupee in thousands):
December 31, 2012 December 31, 2011
Debt (A) Rs. 44,408,967 Rs. 40,334,489 Equity (B) 39,997,268 41,551,397 Debt ratio (A/ B) 111.03% 97.07%

- 34 -
(1) Details of financial assets and liabilities by category as of March 31, 2012 and December 31, 2011 are as follows
1) Financial assets (Unit: Won in thousands):
March 31, 2012
Financial asset Loans and
Receivables
AFS financial assets
Designated to hedge item Total
Fair value
Cash and cash equivalents ₩ 235,748,862 ₩ - ₩ - ₩ 235,748,862 ₩ 235,748,862 Long-term financial
instruments 6,000 - - 6,000 6,000 Trade receivables and
Other receivables 229,386,075 - 1,172,738 230,558,814 230,558,813 Long-term AFS financial
assets - 560,000 - 560,000 560,000 ₩ 465,140,937 ₩ 560,000 ₩ 1,172,738 ₩ 466,873,676 ₩ 466,873,675
December 31, 2011
Financial asset Loans and receivables
AFS financial assets
Designated to hedge item Total
Fair value
Cash and cash equivalents ₩ 202,509,810 ₩ - ₩ - ₩ 202,509,810 ₩ 202,509,810 Long-term financial
instruments 6,000 - - 6,000 6,000 Trade receivables and
Other receivables 213,537,547 - 1,172,738 213,730,857 213,730,857 Long-term AFS financial
assets - 560,000 - 560,000 560,000 ₩ 416,053,357 ₩ 560,000 ₩ 1,172,738 ₩ 416,806,667 ₩ 416,806,667
(Unit: Indian-Rupee in thousands):
March 31, 2012
Financial asset Loans and receivables
AFS financial assets
Designated to hedge item Total
Fair value
Cash and cash equivalents Rs. 10,726,573 Rs. - Rs. - Rs. 10,726,573 Rs. 10,726,573 Long-term financial
instruments 273 - - 273 273 Trade receivables and
Other receivables 10,437,066 - 53,360 10,490,426 10,490,426 Long-term AFS financial
assets - 25,480 - 25,480 25,480 Rs. 21,163,913 Rs. 25,480 Rs. 53,360 Rs. 21,242,752 Rs. 21,242,752
December 31, 2011
Financial asset Loans and receivables
AFS financial assets
Designated to hedge item Total
Fair value
Cash and cash equivalents Rs. 9,214,196 Rs. - Rs. - Rs. 9,214,196 Rs. 9,214,196 Long-term financial
instruments 273 - - 273 273 Trade receivables and
Other receivables 9,715,958 - 53,360 9,724,754 9,724,754 Long-term AFS financial
assets - 25,480 - 25,480 25,480 Rs. 18,930,428 Rs. 25,480 Rs. 53,360 Rs. 18,964,703 Rs. 18,964,703
2) Financial liabilities

- 35 -
Won in thousands Indian-Rupee in thousands
March 31, 2012 March 31, 2011 March 31, 2012 March 31, 2011
Trade payables and Other payables
₩ 492,408,044 ₩ 403,263,454 Rs. 22,404,566 Rs. 18,348,487
Debt 125,672,815 135,972,454 5,718,113 6,186,747 Derivatives 3,895,549 - 177,247 -
Total ₩ 62,1976,408 ₩ 539,235,908 Rs. 28,299,926 Rs. 24,535,234 (2) Financial risk management The Company is exposed to credit risk, liquidity risk and market risk. In order to manage the aforementioned risks, the Company operates a risk management policy and a program that performs close monitoring of and responding to each risk factors. Financial assets that are subject to the financial risk management consist of cash and cash equivalents, AFS financial assets, trade receivables, other receivables and others; financial liabilities subject to the financial risk management consist of trade payables, other payables, borrowings, bonds and others. 1) Market risk a. Foreign currency risk The Company undertakes transactions denominated in foreign currencies; consequently, exposures to exchange rate fluctuations arise. The Company assesses, manages and reports, on a regular basis, the foreign currency risk for its receivables and payables denominated in foreign currency. Details of the Company held foreign currency denominated monetary assets and monetary liabilities of the carrying amount for the years ended March 31, 2012and December 31, 2011 are as follows:
(Unit: Korean Won in thousands):
Financial assets
Financial liabilities
Currency
Mach 31, 2012
March 31, 2011
Mach 31, 2012
March 31, 2011 USD ₩ 79,488,062
₩ 52,740,827
₩ 11,097,807
₩ 11,298,102
EUR 22,856,300 23,535,845 12,962,335 27,538,450 JPY 434,741 250,167 4,988,843 5,203,875 Others 4,798,182 12,810,347 6,280,659 7,563,035 ₩ 107,577,285 ₩ 89,337,186 ₩ 35,327,644 ₩ 51,603,462
(Unit: Indian-Rupee in thousands):
Financial assets
Financial liabilities
Currency
Mach 31, 2012
March 31, 2011
Mach 31, 2012
March 31, 2011 USD Rs. 3,617,090
Rs. 2,399,708
Rs. 504,950
Rs. 514,064
EUR 1,039,962 1,070,881 589,786 1,252,999 JPY 19,781 11,383 227,000 236,776 Others 218,317 582,871 285,770 344,118 Rs. 4,895,149 Rs. 4,064,842 Rs. 1,607,507 Rs. 2,347,958
The table below shows the sensitivity for each foreign currency when exchange rates change 10%. Sensitivity analysis only includes a foreign currency monetary item that is not paid, and it adjusts the translation assuming exchange rate changes 10% at the year end of March 31, 2012. (Unit: Korean Won in thousands):
Financial assets
Financial liabilities
Currency
10% increase
10% decrease
10% increase
10% decrease USD ₩ 7,948,806
₩ (7,948,806)
₩ (1,109,581)
₩ 1,109,581

- 36 -
Financial assets
Financial liabilities
Currency
10% increase
10% decrease
10% increase
10% decrease EUR 2,285,630 (2,285,630) (1,296,234) 1,296,234 JPY 43,474 (43,474) (498,884) 498,884 Others 479,818 (479,818) (628,066) 628,066 ₩ 10,757,729 ₩ (10,757,729) ₩ (3,532,765) ₩ 3,532,765
(Unit: Indian-Rupee in thousands):
Financial assets
Financial liabilities
Currency
10% increase
10% decrease
10% increase
10% decrease USD Rs. 361,709
Rs. (361,709)
Rs. (50,486)
Rs. 50,486
EUR 103,996 (103,996) (58,979) 58,979 JPY 1,978 (1,978) (22,700) 22,700 Others 21,832 (21,832) (28,577) 28,577 Rs. 489,515 Rs. (489,515) Rs. (160,751) Rs. 160,751
In order to avoid the risk of foreign exchange debt payments and foreign exchange receivables collected foreign exchange risk within the range of 30 to 50 percent, the company has a policy of making an foreign exchange forward agreement. Also in order to manage sales transactions and purchase transactions to foreign exchange risk that are expected to occur within the next nine months that are within the range of 30 to 50 percent, the Company makes a foreign exchange forward. Details of non-payment forward contracts for the three months ended March 31, 2012 are as follows
Average exchange rate
contracted
Amount of foreign currency
Amount of Contract
Fair value
Cash flow hedges
USD purchase
~3 months 1135.52 won USD 23,000,000 ₩ 139,587,850 ₩ (908,498) 3~6 months 1142.10 won USD 132,000,000 150,778,740 (773,980) 6~9 months 1144.95 won USD 135,000,000 154,568,150 (1,040,332)
(Unit: Indian-Rupee in thousands):
Average exchange rate
contracted
Amount of foreign currency
Amount of Contract
Fair value
Cash flow hedges
USD purchase
~3 months 1135.52 won USD 23,000,000 Rs. 6,351,247 Rs. (41,337) 3~6 months 1142.10 won USD 132,000,000 6,860,433 (35,216) 6~9 months 1144.95 won USD 135,000,000 7,032,851 (47,335)
The cumulative benefits of cash flow hedges related to foreign forward contracts, amounts to 2,398,750 won.(Rs 109,143) transaction is expected to occur within the first nine months after March 31, 2012, and this amount that is deferred in equity will be reclassified as Current income. b. Interest rate risk Sensitivity analysis was conducted assuming in the case of floating rate debt current balance is the same during the whole reporting period. When reporting interest rate risk to management internally, 0.5% variation is used, representing management's assessment about reasonably accruable fluctuations of interest rates. When other variables are constant and the interest rate is lower or higher by 0.5% than the current rate, the company's current income will decrease/increase 37,808 thousand won(1,512 thousands rupee) for the years ended Dec 31, 2011, due to floating rate debt’s interest rate risk.

- 37 -
2) Credit risk The company’s trade receivables consist of a number of customers in various regions. The company regularly assesses credit ratings of its customers and transaction parties also, made a credit guarantee with customers or transaction parties if it necessary. 3) Liquidity risk The Company establishes short-term and long-term fund management plans; consequently, exposures to liquidity risk. The Company analyzes and reviews actual cash out flows and its budget to correspond the maturities of financial liabilities to those of financial assets. Management of the Company believes that the financial liabilities may be redeemed by cash flows arising from operating activities and financial assets. The Company has entered into a factoring agreement with Aju Capital Co., Ltd., in order to manage risks arising from installment sales receivables. Maturity analysis of non-derivative financial liabilities according to their remaining maturities as of March 31, 2012 is as follows (Unit: Won in thousands):
March 31, 2012
Within a year
More than 1 year
Total
Trade payables ₩ 378,184,303 ₩ - ₩ 378,184,303
Accrued expenses
101,450,762 - 101,450,762 Short-term borrowings
30,268,050 - 30,268,050
Other payables
14,505,907 - 14,505,907 Long-term other payables
- 2,162,620 2,162,620
Debt
6,678,334 101,168,258 107,846,592
₩ 531,087,356 ₩ 103,330,878 ₩ 634,418,234
December 31, 2011
Within a year
More than 1 year
Total
Trade payables ₩ 264,594,196 ₩ - ₩ 264,594,196
Accrued expenses
119,927,398 - 119,927,398 Short-term borrowings
40,567,689 - 40,567,689
Other payables
16,599,583 - 16,599,583 Long-term other payables
- 2,142,277 2,142,277
Debt
6,678,334 103,196,154 109,874,488
₩ 448,367,200 ₩ 105,338,431 ₩ 553,705,631
(Unit: Rupee in thousands): March 31, 2012
Within a year
More than 1 year
Total
Trade payables
Rs. 17,207,386 Rs. - Rs. 17,207,386 Accrued expenses
4,616,010 - 4,616,010
Short-term borrowings
1,377,196 - 1,377,196 Other payables
660,019 - 660,019
Long-term other payables
- 98,399 98,399 Debt
303,864 4,603,156 4,907,020
Rs. 24,164,475 Rs. 4,701,555 Rs. 28,866,030
December 31, 2011
Within a year
More than 1 year
Total
Trade payables
Rs. 12,039,036 Rs. - Rs. 12,039,036 Accrued expenses
5,456,697 - 5,456,697
Short-term borrowings
1,845,830 - 1,845,830 Other payables
755,281 - 755,281

- 38 -
December 31, 2011
Within a year
More than 1 year
Total
Long-term other payables
- 97,474 97,474 Debt
303,864 4,695,425 4,999,289
Rs. 20,400,708 Rs. 4,792,899 Rs. 25,193,606
Funding arrangements as of December 31,2012and December 31, 2011 are as follows: (Unit: Korean won in thousands):
March 31,2012 December 31,2011 Borrowing limit
commitments Used
Unused ₩ 50,000,000 ₩ 50,000,000 Total ₩ 50,000,000 ₩ 50,000,000
(Unit: Indian-Rupee in thousands):
March 31,2012 December 31,2011 Borrowing limit
commitments Used Rs -
Rs - Unused 2,275,000 2,275,000 Total Rs 2,275,000 Rs 2,275,000
(4) Fair value of financial instruments The fair value of the Company’s actively-traded financial instruments (i.e. financial assests AFS and others) is based on the traded market-price as of the reporting period end. The fair value of the Company’s financial assets is the amount which the asset could be exchanged for or the amount which a liability could be settled for. The following table provides an analysis of financial instruments that are measured subsequent to initial recognition at fair value, classified as Level 1, 2 or 3, based on the degree to which the fair value is observable. Level 1 Unadjusted quoted prices in active markets for identical assets or liabilities; Level 2 Inputs other than quoted prices that are observable for the asset or liability either directly or indirectly; and Level 3 Inputs that are not based on observable market data. 1) Fair values of financial instruments by heirarchy level as of March 31, 2012, are as follows (Unit: Korean
won in thousands): March 31, 2012 Type Level 1 Level 2 Level 3 Fair value Derivatives designated to hedge item ₩ - ₩ (2,272,811) ₩ - ₩ (2,272,811)
March 31, 2011 Type Level 1 Level 2 Level 3 Fair value Derivatives designated to hedge item ₩ - ₩ 193,310 ₩ - ₩ 193,310
(Unit: Indian-Rupee in thousands): December 31, 2011 Type Level 1 Level 2 Level 3 Fair value Derivatives designated to hedge item Rs. - Rs. (103,413) Rs. - Rs. (103,413)
December 31, 2011 Type Level 1 Level 2 Level 3 Fair value Derivatives designated to hedge item Rs. - Rs. 8,796 Rs. - Rs. 8,796


![Three months ended December 31, Year ended December 31, … · 2016-01-27 · Three months ended December 31, Year ended December 31, 2015 2014 Change ~¦u]oo]}v 2015 2014 Change](https://static.fdocuments.net/doc/165x107/5f05bacd7e708231d41469d5/three-months-ended-december-31-year-ended-december-31-2016-01-27-three-months.jpg)

