Sentiments - Al Meezan Investment Management Limited ISLAMIC FUND (MIF) Fund Review: Net assets of...
16
FROM THE CIO’s DESK: Stock Market Undeterred by BREXIT! Pakistan’s Reclassification in MSCI’s Emerging Markets Index Leading Investors’ Sentiments Dear Investor, FY’16 turned out to be quite an eventful year for the stock market. The year initiated with continued foreign investors’ selling which dragged the market down during the first half but positive developments later like continued monetary easing by the SBP (whereby the policy rate was slashed by 75bps cumulatively and brought down to 5.75%) and reclassification of Pakistan in MSCI’s emerging markets category (after eight years) provided the much needed impetus to keep the investors’ confidence intact and drive the market to new highs. Despite a total net sell of USD 282 million by foreigners during FY’16, the KMI-30 appreciated by 15.53% while the KSE-100 closed 9.84% up thereby reflecting on the consistently improving macroeconomic fundamentals of Pakistan as well as the potential inherent in the market which has kept it resilient so far. Pakistan: Star Performer among Global Equities As evident in the table, Pakistan was among the best performing markets globally during FY’16 which coupled with healthy participations by global investors in the country’s international bond/sukuk issues, improving economy (falling inflation and interest rates, strengthening forex reserves, lowered deficits, etc) and upcoming investments scheduled under CPEC, highlight that the future case for Pakistan is very strong. In our notes issued on Pakistan’s inclusion in the MSCI’s emerging markets category and post BREXIT, it had been stated that the stock market will continue gaining momentum on the back of foreign inflows into Pakistan on account of country’s reclassification as an emerging market. It had also been highlighted that BREXIT will not have much of an impact on Pakistan and MSCI’s development will override the perceived concerns over BREXIT. Both the above mentioned factors have been seen to have played out whereby currently, the market has recuperated the ground it lost post Britain’s referendum result announcement and is now at an all-time high. Islamic Fixed Income: Monetary Easing and Lack of Investment Avenues Still a Concern While the SBP carried out three Ijarah sukuk auctions during FY’16 cumulatively amounting to Rs. 314 billion, it is important to note that a total of six GoP Ijarah Sukuks amounting to Rs. 277 billion also matured during the year. While the shariah compliant end of the money market has continued to grow at an impressive pace, the growth in Islamic investment avenues has not been reasonable enough which in turn leads to lower yields as demand/supply factors end up playing a bigger role in the Islamic Market. Interest rates are also expected to slide further as lower oil prices have kept inflation in check and provided the SBP with ample cushion with reference to its real interest rate requirement. In the budget announcement for FY’17, the government has not provided any borrowing requirement through local Ijarah sukuk issuance which coupled with SBP’s continued monetary easing stance, is expected to keep the fixed income returns on the lower side. Outlook The reclassification of Pakistan in the MSCI Emerging Markets category will work as a catalyst driving the market’s performance during the new fiscal year. While some political concerns may stay in the near term, it is pertinent to note that continued monetary softening, low international oil prices, Pakistan’s stock market being attractive among peers on the basis of P/E multiple, strong corporate profitability expected to continue, improving macroeconomic fundamentals and ongoing development under the China Pakistan Economic Corridor are expected to keep the equities strong and performing in the long run. Commodities, especially precious metals like Gold are expected to continue rising as the volatility in the Global Economic landscape is expected to keep the demand for Gold intact. While a summary of the returns of our equity mutual funds can be observed in the table, investors with relevant risk profiles and investment horizons are advised to go through our detailed Fund Manager Report hereunder for a detailed performance review of our mutual funds. Investment in Meezan Gold Fund and recently launched Meezan Asset Allocation Fund are strongly advised. Ground Floor Block “B”, Finance and Trade Center, Shahrah-e-Faisal Karachi. UAN: 111-633-926 (111-Meezan) Call Center: 0800-42525, Web Site: www.almeezangroup.com
Transcript of Sentiments - Al Meezan Investment Management Limited ISLAMIC FUND (MIF) Fund Review: Net assets of...
FROM THE CIO’s DESK:
Stock Market Undeterred by BREXIT! Pakistan’s Reclassification in MSCI’s Emerging Markets Index Leading Investors’
Sentiments
Dear Investor,
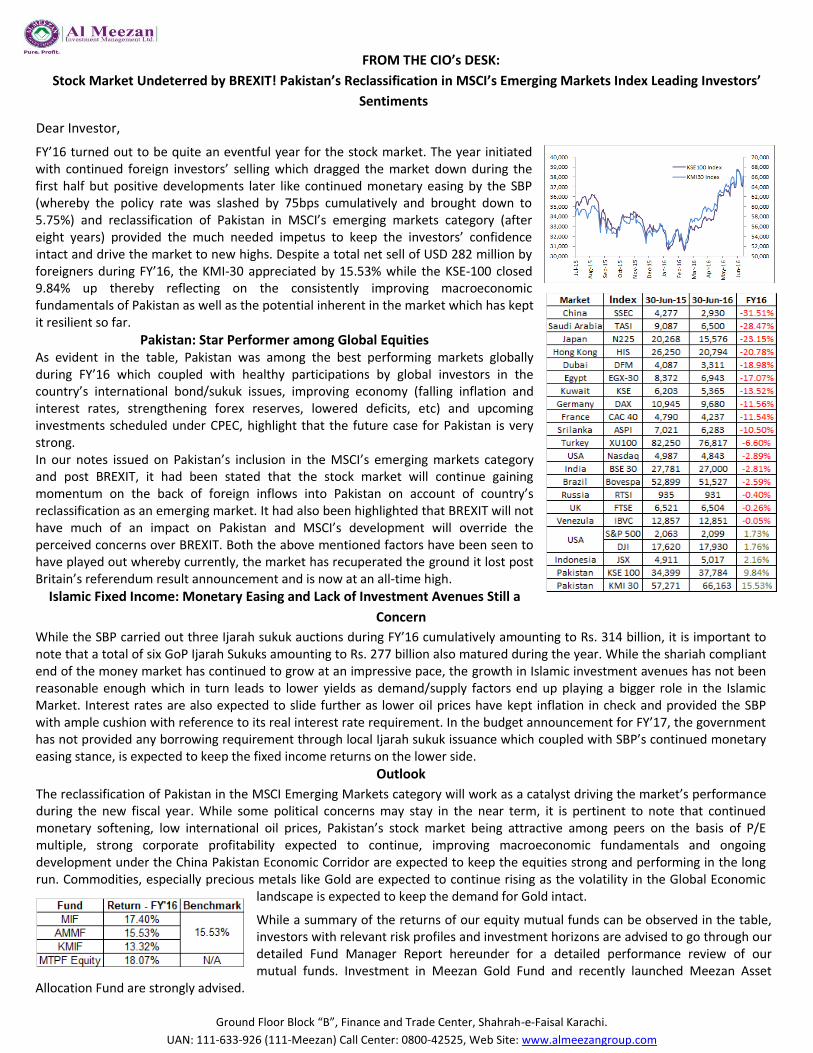
FY’16 turned out to be quite an eventful year for the stock market. The year initiated with continued foreign investors’ selling which dragged the market down during the first half but positive developments later like continued monetary easing by the SBP (whereby the policy rate was slashed by 75bps cumulatively and brought down to 5.75%) and reclassification of Pakistan in MSCI’s emerging markets category (after eight years) provided the much needed impetus to keep the investors’ confidence intact and drive the market to new highs. Despite a total net sell of USD 282 million by foreigners during FY’16, the KMI-30 appreciated by 15.53% while the KSE-100 closed 9.84% up thereby reflecting on the consistently improving macroeconomic fundamentals of Pakistan as well as the potential inherent in the market which has kept it resilient so far.
Pakistan: Star Performer among Global Equities As evident in the table, Pakistan was among the best performing markets globally during FY’16 which coupled with healthy participations by global investors in the country’s international bond/sukuk issues, improving economy (falling inflation and interest rates, strengthening forex reserves, lowered deficits, etc) and upcoming investments scheduled under CPEC, highlight that the future case for Pakistan is very strong. In our notes issued on Pakistan’s inclusion in the MSCI’s emerging markets category and post BREXIT, it had been stated that the stock market will continue gaining momentum on the back of foreign inflows into Pakistan on account of country’s reclassification as an emerging market. It had also been highlighted that BREXIT will not have much of an impact on Pakistan and MSCI’s development will override the perceived concerns over BREXIT. Both the above mentioned factors have been seen to have played out whereby currently, the market has recuperated the ground it lost post Britain’s referendum result announcement and is now at an all-time high.
Islamic Fixed Income: Monetary Easing and Lack of Investment Avenues Still a
Concern
While the SBP carried out three Ijarah sukuk auctions during FY’16 cumulatively amounting to Rs. 314 billion, it is important to note that a total of six GoP Ijarah Sukuks amounting to Rs. 277 billion also matured during the year. While the shariah compliant end of the money market has continued to grow at an impressive pace, the growth in Islamic investment avenues has not been reasonable enough which in turn leads to lower yields as demand/supply factors end up playing a bigger role in the Islamic Market. Interest rates are also expected to slide further as lower oil prices have kept inflation in check and provided the SBP with ample cushion with reference to its real interest rate requirement. In the budget announcement for FY’17, the government has not provided any borrowing requirement through local Ijarah sukuk issuance which coupled with SBP’s continued monetary easing stance, is expected to keep the fixed income returns on the lower side.
Outlook
The reclassification of Pakistan in the MSCI Emerging Markets category will work as a catalyst driving the market’s performance during the new fiscal year. While some political concerns may stay in the near term, it is pertinent to note that continued monetary softening, low international oil prices, Pakistan’s stock market being attractive among peers on the basis of P/E multiple, strong corporate profitability expected to continue, improving macroeconomic fundamentals and ongoing development under the China Pakistan Economic Corridor are expected to keep the equities strong and performing in the long run. Commodities, especially precious metals like Gold are expected to continue rising as the volatility in the Global Economic
landscape is expected to keep the demand for Gold intact.
While a summary of the returns of our equity mutual funds can be observed in the table, investors with relevant risk profiles and investment horizons are advised to go through our detailed Fund Manager Report hereunder for a detailed performance review of our mutual funds. Investment in Meezan Gold Fund and recently launched Meezan Asset
Allocation Fund are strongly advised.
Ground Floor Block “B”, Finance and Trade Center, Shahrah-e-Faisal Karachi.
UAN: 111-633-926 (111-Meezan) Call Center: 0800-42525, Web Site: www.almeezangroup.com
0
Fund Managers’ Report
AL Meezan Investment Management Limited
Stock Market Review
During the month of June 2016, the KSE-100 index appreciated by
4.78% to close at 37,783 points. Banks, Power and Cements were
positive contributors whereas Oil stocks were negative
contributors. The average daily volume of the market was 172 mn
shares, down by 36% on a MoM basis. The market’s performance
was largely driven by Pakistan’s reclassification into Emerging
markets as announced by MSCI.
Foreigners reported a net buy of USD 74 mn in June. Individuals
were net buyers of USD 82mn, Companies were net sellers of USD
168mn whereas Banks sold stocks worth USD 23mn. Foreign buying
was witnessed in the Fertilizer, Oil, Cement and Banking sectors in
stocks which were included in the MSCI Emerging markets Index.
Along with budget announcement, another major event during the
month was Britain’s vote to exit the European Union, which sent
equity and commodity markets tumbling. Although major equity
Indexes across the globe have recovered since, Oil was 2.4% down
at month end.
MSCI’s decision to reclassify Pakistan into emerging markets is
positive for the equity market in the longer term as it will attract
foreign flows and put Pakistan to the larger radar. However,
concerns over global growth after Brexit and the tense political
situation in Pakistan remain potential risks to equities.
KSE-100 Index Performance
Al Meezan Investments, the company in operation since 1995, has one of the longest track record of managing mutual funds in the private sector
in Pakistan. Al Meezan Investments manages twelve mutual funds; namely Al Meezan Mutual Fund, Meezan Balanced Fund, Meezan Islamic
Fund, Meezan Islamic Income Fund, Meezan Tahaffuz Pension Fund, Meezan Cash Fund, Meezan Sovereign Fund, Meezan Capital Preservation
Fund II, Meezan Financial Planning Fund of Funds, KSE Meezan Index Fund, Meezan Gold Fund and Meezan Asset Allocation Fund.
The total funds under management of Al Meezan, the only full-fledged Shariah compliant asset management company in Pakistan, have reached
Rs. 77.77 billion as on June 30, 2016. With an AM2++ credit rating denoting high management quality, the company clearly stays well ahead of all
its competitors in the Islamic asset management market in Pakistan.
June, 2016
Money Market Review
The money market faced relatively tight liquidity scenario evidenced
by Rs. 6.9 trillion worth of OMO injections carried out by the SBP
coupled with Rs. 18 billion worth of discounting availed by various
counters during this month. However, the floor placements during
the month were of Rs. 270 bn. The 3MK closed 6 bps down at 6.05%
and 6MK closed 8 bps down at 6.06%. The T-bill and PIB yields also
took downward adjustments in the range of 3-8 bps and 32-43 bps
respectively.
Inflation for the month of June, 2016 clocked in at 3.19% as
compared to 3.17% in May 2016 and 3.16% in June 2015. The
average inflation for FY 16 now stands at 2.86% as against to 4.56% in
FY 15.
Moreover, two T-bill auctions were conducted during this period
whereby in total Rs. 331 billion was accepted against the
participation of Rs. 798 billion with major participation and
acceptance in 6 months category. A PIB auction was also conducted
whereby Rs. 43 billion was accepted against the participation of Rs.
220 billion with major participation and acceptance in 3 years
category.
On the forex front, the rupee in interbank market closed Rs. 0.03
stronger at Rs. 104.86/$ while in the open market, it closed Rs. 0.15
stronger at Rs. 105.10/$ during the month.
6 Month KIBOR
Disclaimer
This publication is for informational purpose only and nothing herein should be construed as a solicitation, recommendation or an offer to buy or sell any fund. All investments in mutual funds are subject to market risk. The NAV based prices of units and any dividends/returns thereon are dependent on force and factors affecting the capital markets. These
may go up or down based on market conditions. Past performance is not necessarily indicative of future results.
(This report has been prepared in line with MUFAP’s recommended Format)
35,200
36,000
36,800
37,600
38,400
39,200
0
100
200
300
400
1-J
un
6-J
un
9-J
un
14-J
un
17-J
un
22-J
un
27-J
un
30-J
un
Vol (mn) (LHS) Index (RHS)
5.80
6.00
6.20
6.40
6.60
6.80
1-J
un
6-J
un
9-J
un
14-J
un
17-J
un
22-J
un
27-J
un
30-J
un
MEEZAN ISLAMIC FUND (MIF)
Fund Review:
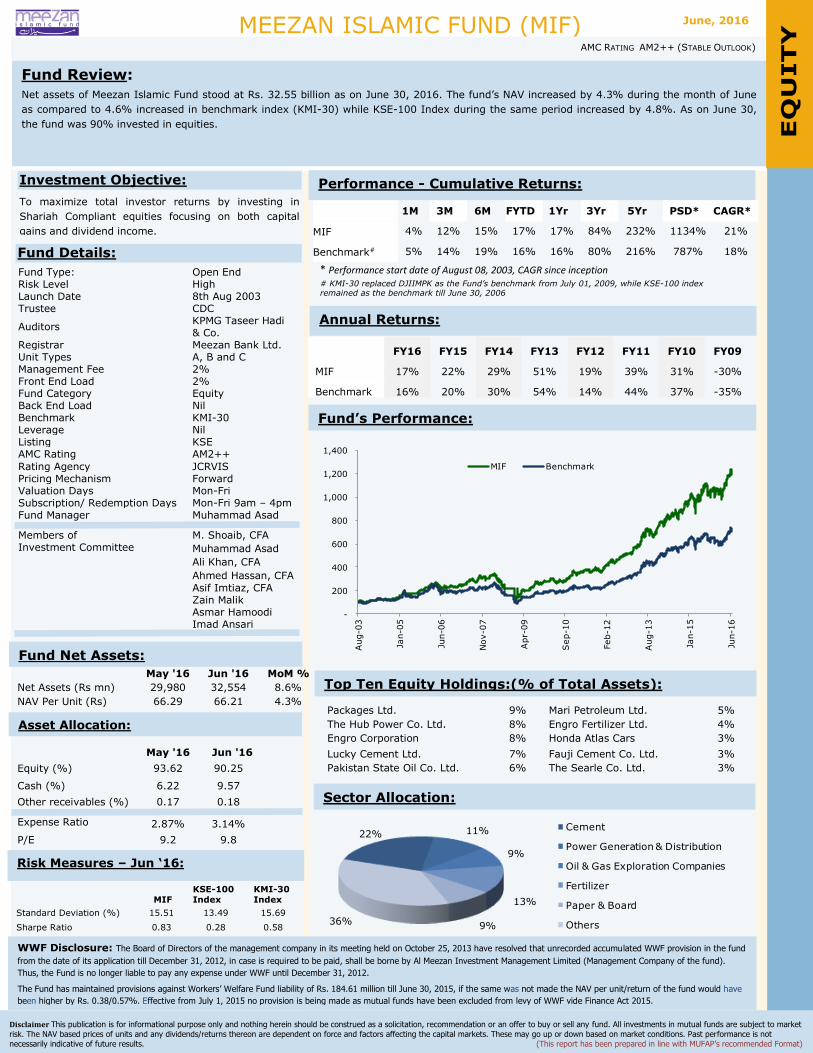
Net assets of Meezan Islamic Fund stood at Rs. 32.55 billion as on June 30, 2016. The fund’s NAV increased by 4.3% during the month of June
as compared to 4.6% increased in benchmark index (KMI-30) while KSE-100 Index during the same period increased by 4.8%. As on June 30,
the fund was 90% invested in equities.
Funds Details
Disclaimer This publication is for informational purpose only and nothing herein should be construed as a solicitation, recommendation or an offer to buy or sell any fund. All investments in mutual funds are subject to market
risk. The NAV based prices of units and any dividends/returns thereon are dependent on force and factors affecting the capital markets. These may go up or down based on market conditions. Past performance is not
necessarily indicative of future results. (This report has been prepared in line with MUFAP’s recommended Format)
AMC RATING AM2++ (STABLE OUTLOOK)
1M 3M 6M FYTD 1Yr 3Yr 5Yr PSD* CAGR*
MIF 4% 12% 15% 17% 17% 84% 232% 1134% 21%
Benchmark# 5% 14% 19% 16% 16% 80% 216% 787% 18%
* Performance start date of August 08, 2003, CAGR since inception # KMI-30 replaced DJIIMPK as the Fund’s benchmark from July 01, 2009, while KSE-100 index remained as the benchmark till June 30, 2006
FY16 FY15 FY14 FY13 FY12 FY11 FY10 FY09
MIF 17% 22% 29% 51% 19% 39% 31% -30%
Benchmark 16% 20% 30% 54% 14% 44% 37% -35%
Packages Ltd. 9% Mari Petroleum Ltd. 5%
The Hub Power Co. Ltd. 8% Engro Fertilizer Ltd. 4%
Engro Corporation 8% Honda Atlas Cars 3%
Lucky Cement Ltd. 7% Fauji Cement Co. Ltd. 3%
Pakistan State Oil Co. Ltd. 6% The Searle Co. Ltd. 3%
Fund Type: Open End Risk Level High Launch Date 8th Aug 2003 Trustee CDC
Auditors KPMG Taseer Hadi & Co.
Registrar Meezan Bank Ltd. Unit Types A, B and C Management Fee 2% Front End Load 2% Fund Category Equity Back End Load Nil Benchmark KMI-30 Leverage Nil Listing KSE AMC Rating AM2++
Rating Agency JCRVIS Pricing Mechanism Forward Valuation Days Mon-Fri Subscription/ Redemption Days Mon-Fri 9am – 4pm Fund Manager Muhammad Asad
Members of Investment Committee
M. Shoaib, CFA
Muhammad Asad
Ali Khan, CFA
Ahmed Hassan, CFA
Asif Imtiaz, CFA Zain Malik Asmar Hamoodi Imad Ansari
Investment Objective:
To maximize total investor returns by investing in
Shariah Compliant equities focusing on both capital
gains and dividend income.
Fund Details:
May '16 Jun '16 MoM %
Net Assets (Rs mn) 29,980 32,554 8.6%
NAV Per Unit (Rs) 66.29 66.21 4.3%
May '16 Jun '16
Equity (%) 93.62 90.25
Cash (%) 6.22 9.57
Other receivables (%) 0.17 0.18
Expense Ratio 2.87% 3.14%
P/E 9.2 9.8
adf
MIF KSE-100 Index
KMI-30 Index
Standard Deviation (%) 15.51 13.49 15.69
Sharpe Ratio 0.83 0.28 0.58
Fund Net Assets:
Top Ten Equity Holdings:(% of Total Assets):
Annual Returns:
Performance - Cumulative Returns:
Fund’s Performance:
Sector Allocation:
EQ
UITY
qu
ity
Risk Measures – Jun ‘16:
Asset Allocation:
WWF Disclosure: The Board of Directors of the management company in its meeting held on October 25, 2013 have resolved that unrecorded accumulated WWF provision in the fund
from the date of its application till December 31, 2012, in case is required to be paid, shall be borne by Al Meezan Investment Management Limited (Management Company of the fund).
Thus, the Fund is no longer liable to pay any expense under WWF until December 31, 2012.
The Fund has maintained provisions against Workers’ Welfare Fund liability of Rs. 184.61 million till June 30, 2015, if the same was not made the NAV per unit/return of the fund would have
been higher by Rs. 0.38/0.57%. Effective from July 1, 2015 no provision is being made as mutual funds have been excluded from levy of WWF vide Finance Act 2015.
June, 2016
-
200
400
600
800
1,000
1,200
1,400
Aug-0
3
Jan-0
5
Jun-0
6
Nov-0
7
Apr-
09
Sep-1
0
Feb-1
2
Aug-1
3
Jan-1
5
Jun-1
6
MIF Benchmark
22% 11%
9%
13%
9%36%
Cement
Power Generation & Distribution
Oil & Gas Exploration Companies
Fertilizer
Paper & Board
Others
AL MEEZAN MUTUAL FUND (AMMF)
Fund Review:
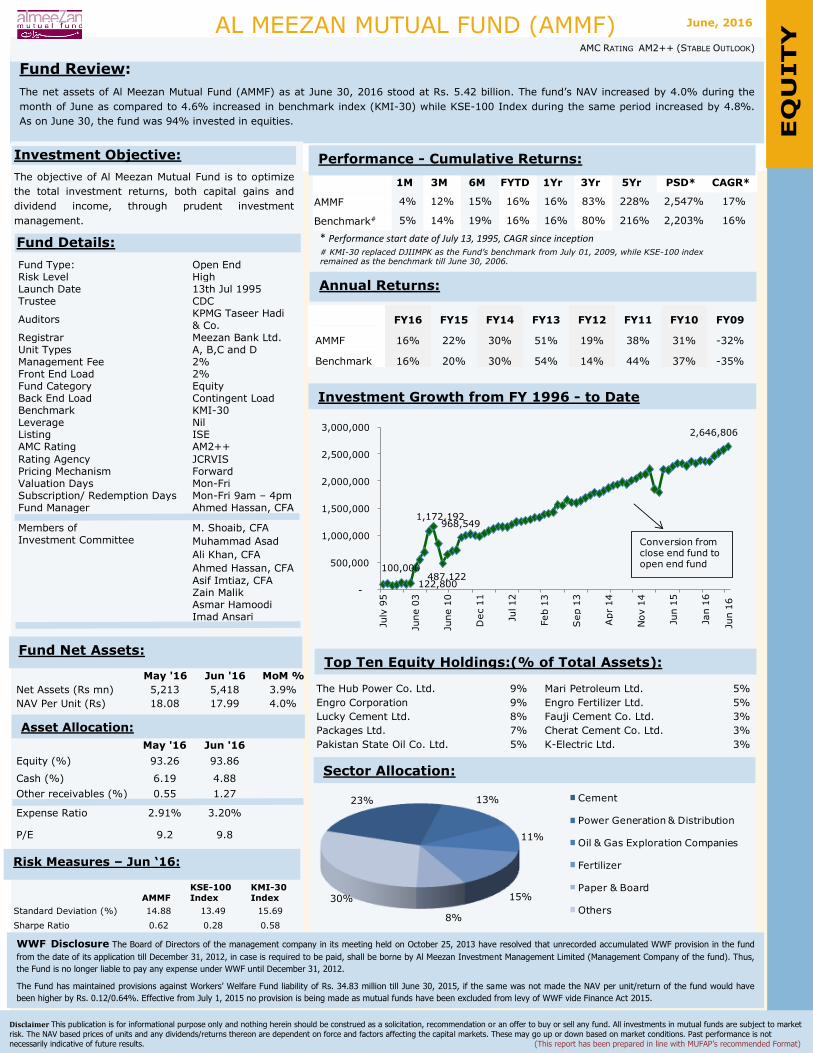
The net assets of Al Meezan Mutual Fund (AMMF) as at June 30, 2016 stood at Rs. 5.42 billion. The fund’s NAV increased by 4.0% during the
month of June as compared to 4.6% increased in benchmark index (KMI-30) while KSE-100 Index during the same period increased by 4.8%.
As on June 30, the fund was 94% invested in equities.
Funds Details
Disclaimer This publication is for informational purpose only and nothing herein should be construed as a solicitation, recommendation or an offer to buy or sell any fund. All investments in mutual funds are subject to market
risk. The NAV based prices of units and any dividends/returns thereon are dependent on force and factors affecting the capital markets. These may go up or down based on market conditions. Past performance is not
necessarily indicative of future results. (This report has been prepared in line with MUFAP’s recommended Format)
AMC RATING AM2++ (STABLE OUTLOOK)
1M 3M 6M FYTD 1Yr 3Yr 5Yr PSD* CAGR*
AMMF 4% 12% 15% 16% 16% 83% 228% 2,547% 17%
Benchmark# 5% 14% 19% 16% 16% 80% 216% 2,203% 16%
* Performance start date of July 13, 1995, CAGR since inception # KMI-30 replaced DJIIMPK as the Fund’s benchmark from July 01, 2009, while KSE-100 index remained as the benchmark till June 30, 2006.
FY16 FY15 FY14 FY13 FY12 FY11 FY10 FY09
AMMF 16% 22% 30% 51% 19% 38% 31% -32%
Benchmark 16% 20% 30% 54% 14% 44% 37% -35%
The Hub Power Co. Ltd. 9% Mari Petroleum Ltd. 5%
Engro Corporation 9% Engro Fertilizer Ltd. 5%
Lucky Cement Ltd. 8% Fauji Cement Co. Ltd. 3%
Packages Ltd. 7% Cherat Cement Co. Ltd. 3%
Pakistan State Oil Co. Ltd. 5% K-Electric Ltd. 3%
Fund Type: Open End Risk Level High Launch Date 13th Jul 1995 Trustee CDC
Auditors KPMG Taseer Hadi & Co.
Registrar Meezan Bank Ltd. Unit Types A, B,C and D Management Fee 2% Front End Load 2% Fund Category Equity Back End Load Contingent Load Benchmark KMI-30 Leverage Nil Listing ISE AMC Rating AM2++
Rating Agency JCRVIS Pricing Mechanism Forward Valuation Days Mon-Fri Subscription/ Redemption Days Mon-Fri 9am – 4pm Fund Manager Ahmed Hassan, CFA
Members of Investment Committee
M. Shoaib, CFA
Muhammad Asad
Ali Khan, CFA
Ahmed Hassan, CFA
Asif Imtiaz, CFA Zain Malik Asmar Hamoodi Imad Ansari
Investment Objective:
The objective of Al Meezan Mutual Fund is to optimize
the total investment returns, both capital gains and
dividend income, through prudent investment
management.
Fund Details:
May '16 Jun '16 MoM %
Net Assets (Rs mn) 5,213 5,418 3.9%
NAV Per Unit (Rs) 18.08 17.99 4.0%
May '16 Jun '16
Equity (%) 93.26 93.86
Cash (%) 6.19 4.88
Other receivables (%) 0.55 1.27
Expense Ratio 2.91% 3.20%
P/E 9.2 9.8
*Management fee is included in the expense ratio
Fund Net Assets:
Top Ten Equity Holdings:(% of Total Assets):
Annual Returns:
Performance - Cumulative Returns:
Investment Growth from FY 1996 - to Date
Sector Allocation:
EQ
UITY
qu
ity
Asset Allocation:
AMMF
KSE-100
Index
KMI-30
Index
Standard Deviation (%) 14.88 13.49 15.69
Sharpe Ratio 0.62 0.28 0.58
Risk Measures – Jun ‘16:
WWF Disclosure The Board of Directors of the management company in its meeting held on October 25, 2013 have resolved that unrecorded accumulated WWF provision in the fund
from the date of its application till December 31, 2012, in case is required to be paid, shall be borne by Al Meezan Investment Management Limited (Management Company of the fund). Thus,
the Fund is no longer liable to pay any expense under WWF until December 31, 2012.
The Fund has maintained provisions against Workers’ Welfare Fund liability of Rs. 34.83 million till June 30, 2015, if the same was not made the NAV per unit/return of the fund would have
been higher by Rs. 0.12/0.64%. Effective from July 1, 2015 no provision is being made as mutual funds have been excluded from levy of WWF vide Finance Act 2015.
June, 2016
100,000
122,800
1,172,192
487,122
968,549
2,646,806
-
500,000
1,000,000
1,500,000
2,000,000
2,500,000
3,000,000
July
95
June 0
3
June 1
0
Dec 1
1
Jul 12
Feb 1
3
Sep 1
3
Apr
14
Nov 1
4
Jun 1
5
Jan 1
6
Conversion from close end fund to open end fund
Jun 1
6
23% 13%
11%
15%
8%
30%
Cement
Power Generation & Distribution
Oil & Gas Exploration Companies
Fertilizer
Paper & Board
Others
MEEZAN ISLAMIC INCOME FUND (MIIF)
Fund Review
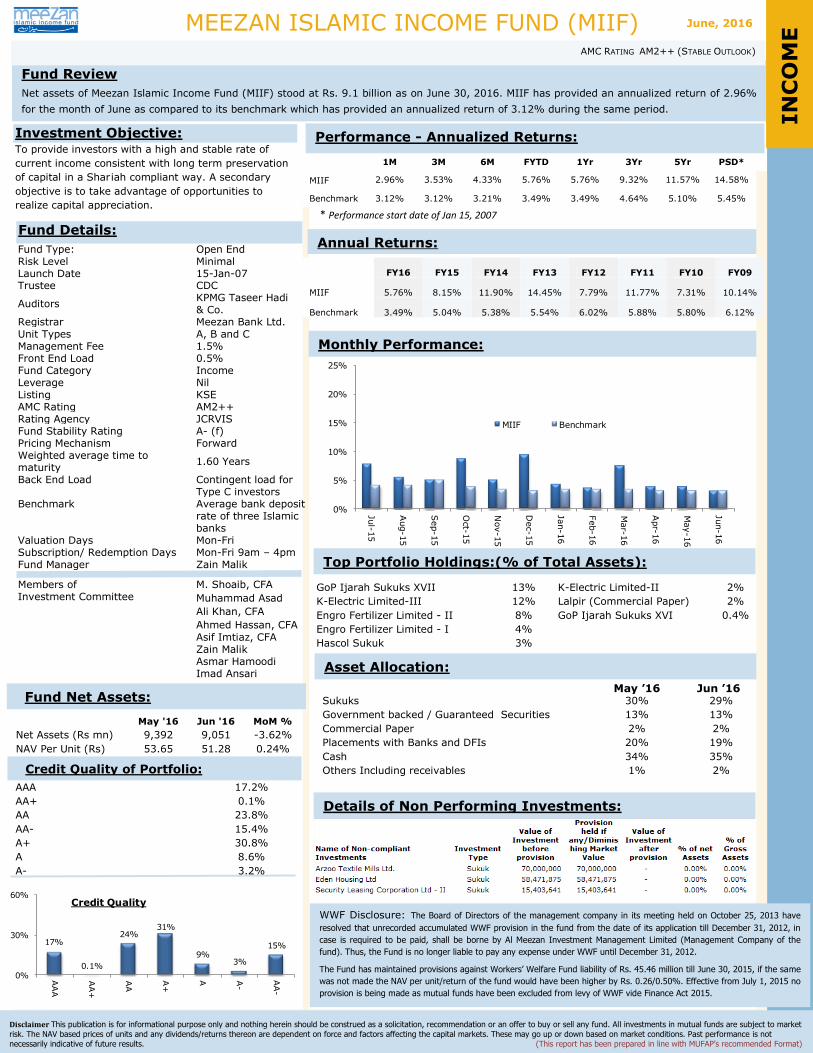
Net assets of Meezan Islamic Income Fund (MIIF) stood at Rs. 9.1 billion as on June 30, 2016. MIIF has provided an annualized return of 2.96%
for the month of June as compared to its benchmark which has provided an annualized return of 3.12% during the same period.
Funds Details
Disclaimer This publication is for informational purpose only and nothing herein should be construed as a solicitation, recommendation or an offer to buy or sell any fund. All investments in mutual funds are subject to market
risk. The NAV based prices of units and any dividends/returns thereon are dependent on force and factors affecting the capital markets. These may go up or down based on market conditions. Past performance is not
necessarily indicative of future results. (This report has been prepared in line with MUFAP’s recommended Format)
AMC RATING AM2++ (STABLE OUTLOOK)
1M 3M 6M FYTD 1Yr 3Yr 5Yr PSD*
MIIF 2.96% 3.53% 4.33% 5.76% 5.76% 9.32% 11.57% 14.58%
Benchmark 3.12% 3.12% 3.21% 3.49% 3.49% 4.64% 5.10% 5.45%
* Performance start date of Jan 15, 2007
FY16 FY15 FY14 FY13 FY12 FY11 FY10 FY09
MIIF 5.76% 8.15% 11.90% 14.45% 7.79% 11.77% 7.31% 10.14%
Benchmark 3.49% 5.04% 5.38% 5.54% 6.02% 5.88% 5.80% 6.12%
GoP Ijarah Sukuks XVII 13% K-Electric Limited-II 2%
K-Electric Limited-III 12% Lalpir (Commercial Paper) 2%
Engro Fertilizer Limited - II 8% GoP Ijarah Sukuks XVI 0.4%
Engro Fertilizer Limited - I 4%
Hascol Sukuk 3%
May ’16 Jun ’16 Sukuks 30% 29%
Government backed / Guaranteed Securities 13% 13%
Commercial Paper 2% 2%
Placements with Banks and DFIs 20% 19%
Cash 34% 35%
Others Including receivables 1% 2%
Fund Type: Open End Risk Level Minimal Launch Date 15-Jan-07 Trustee CDC
Auditors KPMG Taseer Hadi & Co.
Registrar Meezan Bank Ltd. Unit Types A, B and C Management Fee 1.5% Front End Load 0.5% Fund Category Income Leverage Nil Listing KSE AMC Rating AM2++ Rating Agency JCRVIS Fund Stability Rating A- (f) Pricing Mechanism Forward Weighted average time to maturity
1.60 Years
Back End Load Contingent load for Type C investors
Benchmark Average bank deposit rate of three Islamic banks
Valuation Days Mon-Fri Subscription/ Redemption Days Mon-Fri 9am – 4pm Fund Manager Zain Malik
Members of Investment Committee
M. Shoaib, CFA
Muhammad Asad
Ali Khan, CFA
Ahmed Hassan, CFA
Asif Imtiaz, CFA Zain Malik Asmar Hamoodi Imad Ansari
Investment Objective: To provide investors with a high and stable rate of
current income consistent with long term preservation
of capital in a Shar iah compliant way. A secondary
objective is to take advantage of opportunities to
realize capital appreciation.
Fund Details:
May '16 Jun '16 MoM %
Net Assets (Rs mn) 9,392 9,051 -3.62%
NAV Per Unit (Rs) 53.65 51.28 0.24%
Top Portfolio Holdings:(% of Total Assets):
Annual Returns:
Performance - Annualized Returns:
Monthly Performance:
Asset Allocation:
Details of Non Performing Investments:
Fund Net Assets:
Credit Quality of Portfolio: IN
CO
ME
WWF Disclosure: The Board of Directors of the management company in its meeting held on October 25, 2013 have
resolved that unrecorded accumulated WWF provision in the fund from the date of its application till December 31, 2012, in
case is required to be paid, shall be borne by Al Meezan Investment Management Limited (Management Company of the
fund). Thus, the Fund is no longer liable to pay any expense under WWF until December 31, 2012.
The Fund has maintained provisions against Workers’ Welfare Fund liability of Rs. 45.46 million till June 30, 2015, if the same
was not made the NAV per unit/return of the fund would have been higher by Rs. 0.26/0.50%. Effective from July 1, 2015 no
provision is being made as mutual funds have been excluded from levy of WWF vide Finance Act 2015.
AAA 17.2%
AA+ 0.1%
AA 23.8%
AA- 15.4%
A+ 30.8%
A 8.6%
A- 3.2%
June, 2016
0%
5%
10%
15%
20%
25%
Jul-
15
Aug-15
Sep-15
Oct-
15
Nov-15
Dec-15
Jan-16
Feb-16
Mar-
16
Apr-
16
May-16
Jun-16
MIIF Benchmark
17%
0.1%
24%31%
9%3%
15%
0%
30%
60%
AAA
AA+
AA
A+
A A-
AA
-
Credit Quality
MEEZAN CASH FUND (MCF)
Fund Review
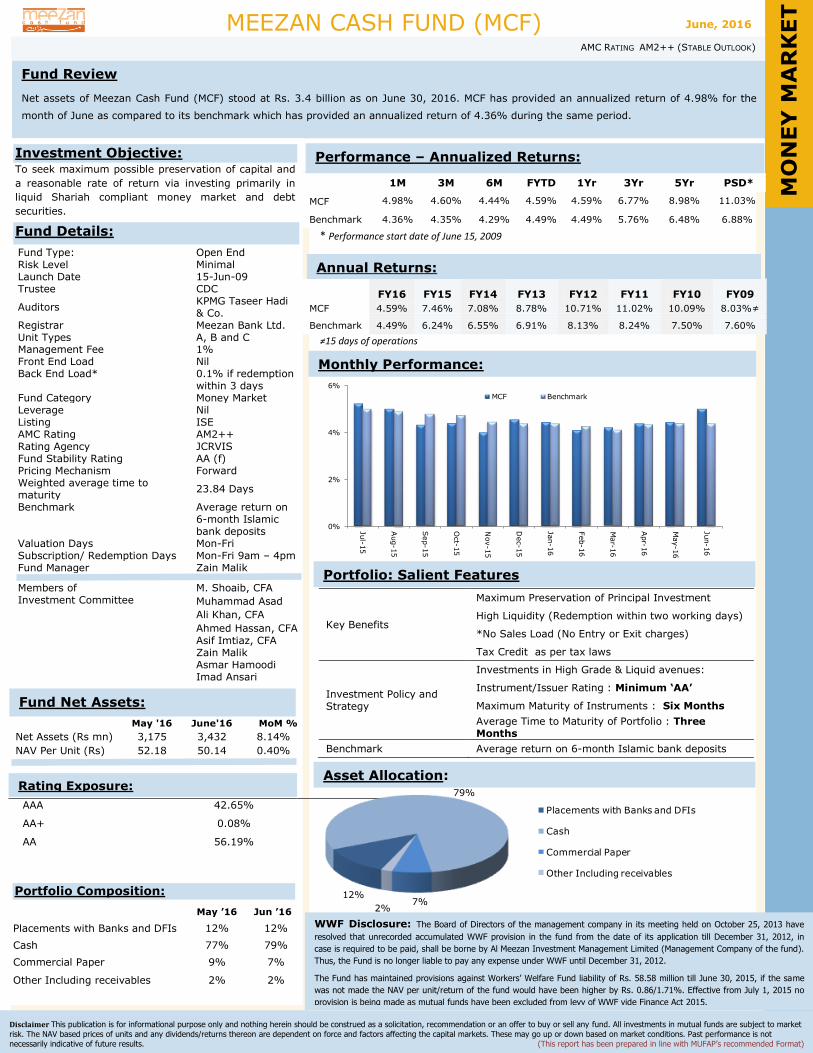
Net assets of Meezan Cash Fund (MCF) stood at Rs. 3.4 billion as on June 30, 2016. MCF has provided an annualized return of 4.98% for the
month of June as compared to its benchmark which has provided an annualized return of 4.36% during the same period.
Funds Details
Disclaimer This publication is for informational purpose only and nothing herein should be construed as a solicitation, recommendation or an offer to buy or sell any fund. All investments in mutual funds are subject to market
risk. The NAV based prices of units and any dividends/returns thereon are dependent on force and factors affecting the capital markets. These may go up or down based on market conditions. Past performance is not
necessarily indicative of future results. (This report has been prepared in line with MUFAP’s recommended Format)
AMC RATING AM2++ (STABLE OUTLOOK)
1M 3M 6M FYTD 1Yr 3Yr 5Yr PSD*
MCF 4.98% 4.60% 4.44% 4.59% 4.59% 6.77% 8.98% 11.03%
Benchmark 4.36% 4.35% 4.29% 4.49% 4.49% 5.76% 6.48% 6.88%
* Performance start date of June 15, 2009
FY16 FY15 FY14 FY13 FY12 FY11 FY10 FY09
MCF 4.59% 7.46% 7.08% 8.78% 10.71% 11.02% 10.09% 8.03%≠
Benchmark 4.49% 6.24% 6.55% 6.91% 8.13% 8.24% 7.50% 7.60%
≠15 days of operations
Fund Type: Open End Risk Level Minimal Launch Date 15-Jun-09 Trustee CDC
Auditors KPMG Taseer Hadi & Co.
Registrar Meezan Bank Ltd. Unit Types A, B and C Management Fee 1% Front End Load Nil Back End Load* 0.1% if redemption
within 3 days Fund Category Money Market Leverage Nil Listing ISE AMC Rating AM2++ Rating Agency JCRVIS Fund Stability Rating AA (f) Pricing Mechanism Forward Weighted average time to maturity
23.84 Days
Benchmark Average return on 6-month Islamic bank deposits
Valuation Days Mon-Fri Subscription/ Redemption Days Mon-Fri 9am – 4pm Fund Manager Zain Malik
Members of Investment Committee
M. Shoaib, CFA
Muhammad Asad
Ali Khan, CFA
Ahmed Hassan, CFA
Asif Imtiaz, CFA Zain Malik Asmar Hamoodi Imad Ansari
Investment Objective: To seek maximum possible preservation of capital and
a reasonable rate of return via investing primarily in
liquid Shariah compliant money market and debt
securities.
Fund Details:
May '16 June'16 MoM %
Net Assets (Rs mn) 3,175 3,432 8.14%
NAV Per Unit (Rs) 52.18 50.14 0.40%
AAA 42.65%
AA+ 0.08%
AA 56.19%
Rating Exposure:
Portfolio: Salient Features
Annual Returns:
Performance – Annualized Returns:
Monthly Performance:
Asset Allocation:
Fund Net Assets:
Key Benefits
Maximum Preservation of Principal Investment
High Liquidity (Redemption within two working days)
*No Sales Load (No Entry or Exit charges)
Tax Credit as per tax laws
Investment Policy and Strategy
Investments in High Grade & Liquid avenues:
Instrument/Issuer Rating : Minimum ‘AA’
Maximum Maturity of Instruments : Six Months
Average Time to Maturity of Portfolio : Three Months
Benchmark Average return on 6-month Islamic bank deposits
Portfolio Composition:
May ’16 Jun ’16
Placements with Banks and DFIs 12% 12%
Cash 77% 79%
Commercial Paper 9% 7%
Other Including receivables 2% 2%
M
ON
EY
MA
RK
ET
WWF Disclosure: The Board of Directors of the management company in its meeting held on October 25, 2013 have
resolved that unrecorded accumulated WWF provision in the fund from the date of its application till December 31, 2012, in
case is required to be paid, shall be borne by Al Meezan Investment Management Limited (Management Company of the fund).
Thus, the Fund is no longer liable to pay any expense under WWF until December 31, 2012.
The Fund has maintained provisions against Workers’ Welfare Fund liability of Rs. 58.58 million till June 30, 2015, if the same
was not made the NAV per unit/return of the fund would have been higher by Rs. 0.86/1.71%. Effective from July 1, 2015 no
provision is being made as mutual funds have been excluded from levy of WWF vide Finance Act 2015.
June, 2016
0%
2%
4%
6%
Jul-
15
Aug-15
Sep-15
Oct-
15
Nov-15
Dec-15
Jan-16
Feb-16
Mar-
16
Apr-
16
May-16
Jun-16
MCF Benchmark
12%
79%
7%2%
Placements with Banks and DFIs
Cash
Commercial Paper
Other Including receivables
MEEZAN SOVEREIGN FUND (MSF)
Fund Review
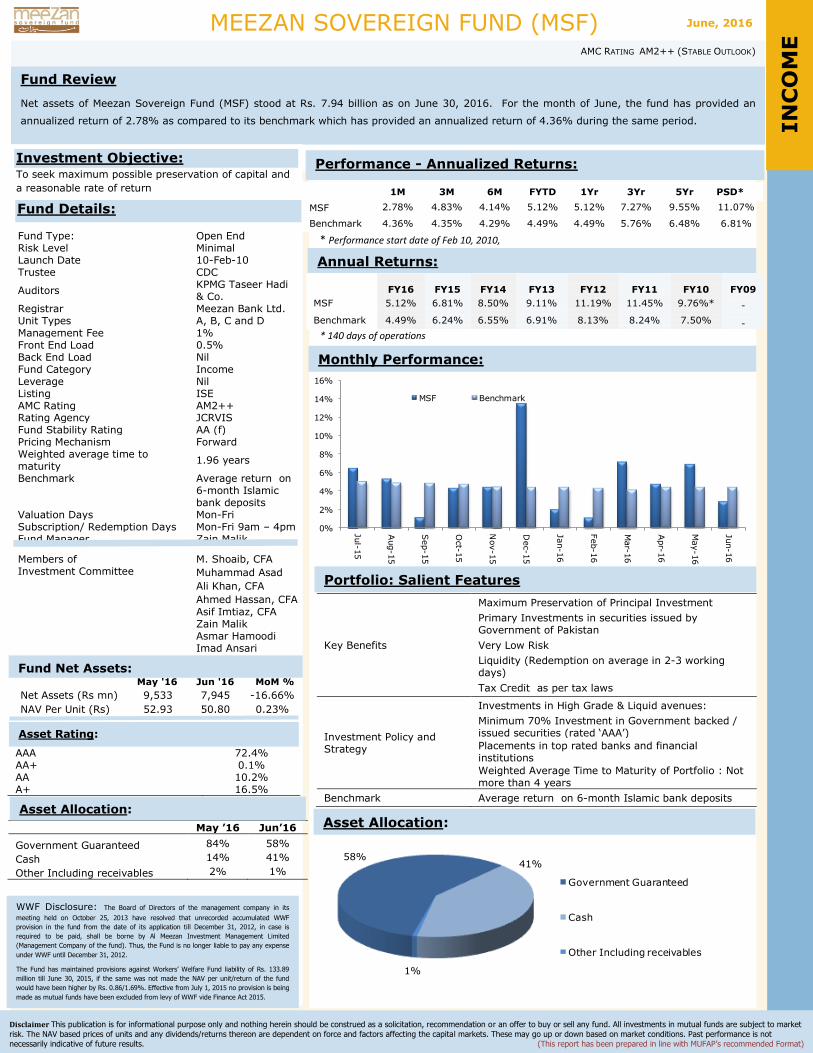
Net assets of Meezan Sovereign Fund (MSF) stood at Rs. 7.94 billion as on June 30, 2016. For the month of June, the fund has provided an
annualized return of 2.78% as compared to its benchmark which has provided an annualized return of 4.36% during the same period.
Funds Details
Disclaimer This publication is for informational purpose only and nothing herein should be construed as a solicitation, recommendation or an offer to buy or sell any fund. All investments in mutual funds are subject to market
risk. The NAV based prices of units and any dividends/returns thereon are dependent on force and factors affecting the capital markets. These may go up or down based on market conditions. Past performance is not
necessarily indicative of future results. (This report has been prepared in line with MUFAP’s recommended Format)
AMC RATING AM2++ (STABLE OUTLOOK)
1M 3M 6M FYTD 1Yr 3Yr 5Yr PSD*
MSF 2.78% 4.83% 4.14% 5.12% 5.12% 7.27% 9.55% 11.07%
Benchmark 4.36% 4.35% 4.29% 4.49% 4.49% 5.76% 6.48% 6.81%
* Performance start date of Feb 10, 2010,
FY16 FY15 FY14 FY13 FY12 FY11 FY10 FY09
MSF 5.12% 6.81% 8.50% 9.11% 11.19% 11.45% 9.76%* -
Benchmark 4.49% 6.24% 6.55% 6.91% 8.13% 8.24% 7.50% -
* 140 days of operations
Fund Type: Open End Risk Level Minimal Launch Date 10-Feb-10 Trustee CDC
Auditors KPMG Taseer Hadi & Co.
Registrar Meezan Bank Ltd. Unit Types A, B, C and D Management Fee 1% Front End Load 0.5% Back End Load Nil Fund Category Income Leverage Nil Listing ISE AMC Rating AM2++ Rating Agency JCRVIS Fund Stability Rating AA (f) Pricing Mechanism Forward Weighted average time to maturity
1.96 years
Benchmark Average return on 6-month Islamic bank deposits
Valuation Days Mon-Fri Subscription/ Redemption Days Mon-Fri 9am – 4pm Fund Manager Zain Malik
Members of Investment Committee
M. Shoaib, CFA
Muhammad Asad
Ali Khan, CFA
Ahmed Hassan, CFA
Asif Imtiaz, CFA Zain Malik Asmar Hamoodi Imad Ansari
Investment Objective: To seek maximum possible preservation of capital and
a reasonable rate of return
Fund Details:
May '16 Jun '16 MoM %
Net Assets (Rs mn) 9,533 7,945 -16.66%
NAV Per Unit (Rs) 52.93 50.80 0.23%
AAA 72.4% AA+ 0.1% AA 10.2% A+ 16.5%
May ’16 Jun’16
Government Guaranteed 84% 58%
Cash 14% 41%
Other Including receivables 2% 1%
Asset Rating:
Portfolio: Salient Features
Annual Returns:
Performance - Annualized Returns:
Monthly Performance:
Asset Allocation:
Fund Net Assets:
Key Benefits
Maximum Preservation of Principal Investment
Primary Investments in securities issued by Government of Pakistan
Very Low Risk
Liquidity (Redemption on average in 2-3 working days)
Tax Credit as per tax laws
Investment Policy and Strategy
Investments in High Grade & Liquid avenues:
Minimum 70% Investment in Government backed / issued securities (rated ‘AAA’)
Placements in top rated banks and financial institutions
Weighted Average Time to Maturity of Portfolio : Not more than 4 years
Benchmark Average return on 6-month Islamic bank deposits
Asset Allocation:
IN
CO
ME
WWF Disclosure: The Board of Directors of the management company in its
meeting held on October 25, 2013 have resolved that unrecorded accumulated WWF
provision in the fund from the date of its application till December 31, 2012, in case is
required to be paid, shall be borne by Al Meezan Investment Management Limited
(Management Company of the fund). Thus, the Fund is no longer liable to pay any expense
under WWF until December 31, 2012.
The Fund has maintained provisions against Workers’ Welfare Fund liability of Rs. 133.89
million till June 30, 2015, if the same was not made the NAV per unit/return of the fund
would have been higher by Rs. 0.86/1.69%. Effective from July 1, 2015 no provision is being
made as mutual funds have been excluded from levy of WWF vide Finance Act 2015.
June, 2016
0%
2%
4%
6%
8%
10%
12%
14%
16%
Jul-
15
Aug-15
Sep-15
Oct-
15
Nov-15
Dec-15
Jan-16
Feb-16
Mar-
16
Apr-
16
May-16
Jun-16
MSF Benchmark
58%41%
1%
Government Guaranteed
Cash
Other Including receivables
MEEZAN TAHAFFUZ PENSION FUND (MTPF)
Fund Review:
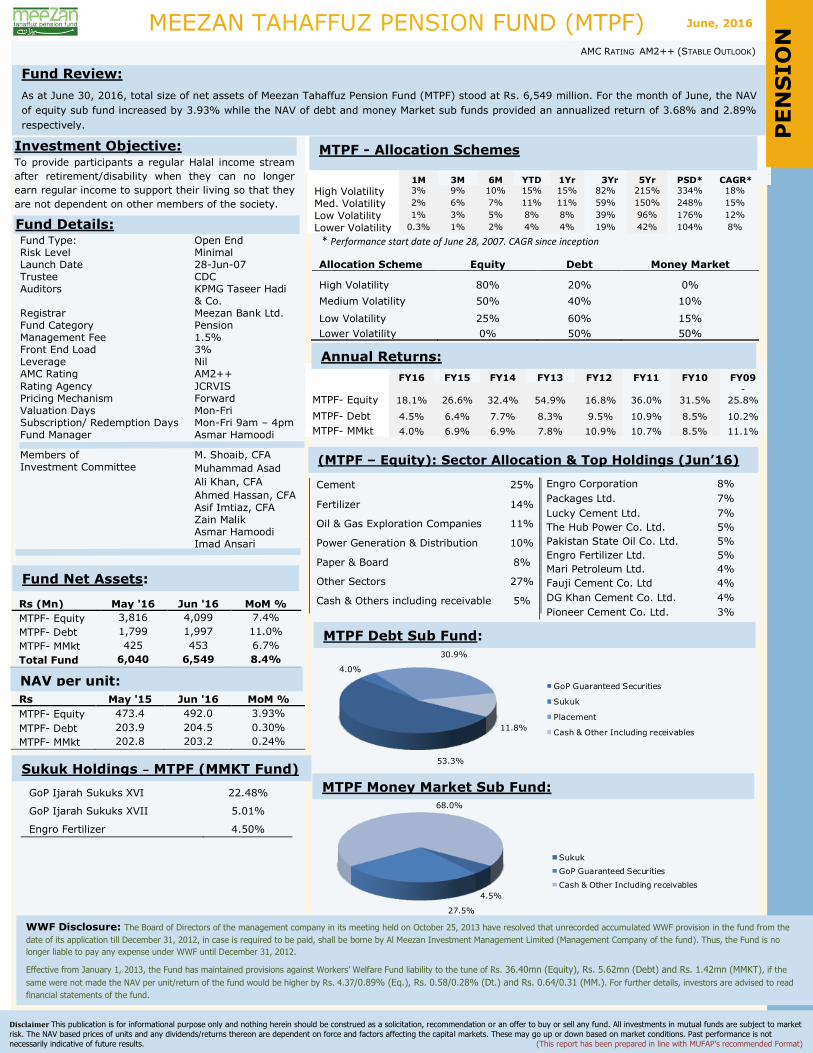
As at June 30, 2016, total size of net assets of Meezan Tahaffuz Pension Fund (MTPF) stood at Rs. 6,549 million. For the month of June, the NAV
of equity sub fund increased by 3.93% while the NAV of debt and money Market sub funds provided an annualized return of 3.68% and 2.89%
respectively.
Funds Details
Disclaimer This publication is for informational purpose only and nothing herein should be construed as a solicitation, recommendation or an offer to buy or sell any fund. All investments in mutual funds are subject to market
risk. The NAV based prices of units and any dividends/returns thereon are dependent on force and factors affecting the capital markets. These may go up or down based on market conditions. Past performance is not
necessarily indicative of future results. (This report has been prepared in line with MUFAP’s recommended Format)
AMC RATING AM2++ (STABLE OUTLOOK)
1M 3M 6M YTD 1Yr 3Yr 5Yr PSD* CAGR*
High Volatility 3% 9% 10% 15% 15% 82% 215% 334% 18%
Med. Volatility 2% 6% 7% 11% 11% 59% 150% 248% 15%
Low Volatility 1% 3% 5% 8% 8% 39% 96% 176% 12%
Lower Volatility 0.3% 1% 2% 4% 4% 19% 42% 104% 8%
* Performance start date of June 28, 2007. CAGR since inception
Allocation Scheme Equity Debt Money Market
High Volatility 80% 20% 0%
Medium Volatility 50% 40% 10%
Low Volatility 25% 60% 15%
Lower Volatility 0% 50% 50%
FY16 FY15 FY14 FY13 FY12 FY11 FY10 FY09
MTPF- Equity 18.1% 26.6% 32.4% 54.9% 16.8% 36.0% 31.5% -
25.8%
MTPF- Debt 4.5% 6.4% 7.7% 8.3% 9.5% 10.9% 8.5% 10.2%
MTPF- MMkt 4.0% 6.9% 6.9% 7.8% 10.9% 10.7% 8.5% 11.1%
Fund Type: Open End Risk Level Minimal Launch Date 28-Jun-07 Trustee CDC Auditors KPMG Taseer Hadi
& Co. Registrar Meezan Bank Ltd. Fund Category Pension Management Fee 1.5% Front End Load 3% Leverage Nil AMC Rating AM2++
Rating Agency JCRVIS Pricing Mechanism Forward Valuation Days Mon-Fri Subscription/ Redemption Days Mon-Fri 9am – 4pm Fund Manager Asmar Hamoodi
Members of Investment Committee
M. Shoaib, CFA
Muhammad Asad
Ali Khan, CFA
Ahmed Hassan, CFA
Asif Imtiaz, CFA Zain Malik Asmar Hamoodi Imad Ansari
Rs (Mn) May '16 Jun '16 MoM %
MTPF- Equity 3,816 4,099 7.4%
MTPF- Debt 1,799 1,997 11.0%
MTPF- MMkt 425 453 6.7%
Total Fund 6,040 6,549 8.4%
Rs May '15 Jun '16 MoM %
MTPF- Equity 473.4 492.0 3.93%
MTPF- Debt 203.9 204.5 0.30%
MTPF- MMkt 202.8 203.2 0.24%
Investment Objective: To provide participants a regular Halal income stream
after retirement/disability when they can no longer
earn regular income to support their living so that they
are not dependent on other members of the society.
Fund Details:
NAV per unit:
Annual Returns:
(MTPF – Equity): Sector Allocation & Top Holdings (Jun’16)
MTPF Debt Sub Fund:
Sukuk Holdings – MTPF (MMKT Fund)
GoP Ijarah Sukuks XVI 22.48%
GoP Ijarah Sukuks XVII 5.01%
Engro Fertilizer 4.50%
MTPF Money Market Sub Fund: P
EN
SIO
N
Fund Net Assets:
MTPF - Allocation Schemes
WWF Disclosure: The Board of Directors of the management company in its meeting held on October 25, 2013 have resolved that unrecorded accumulated WWF provision in the fund from the
date of its application till December 31, 2012, in case is required to be paid, shall be borne by Al Meezan Investment Management Limited (Management Company of the fund). Thus, the Fund is no
longer liable to pay any expense under WWF until December 31, 2012.
Effective from January 1, 2013, the Fund has maintained provisions against Workers’ Welfare Fund liability to the tune of Rs. 36.40mn (Equity), Rs. 5.62mn (Debt) and Rs. 1.42mn (MMKT), if the
same were not made the NAV per unit/return of the fund would be higher by Rs. 4.37/0.89% (Eq.), Rs. 0.58/0.28% (Dt.) and Rs. 0.64/0.31 (MM.). For further details, investors are advised to read
financial statements of the fund.
Engro Corporation 8%
Packages Ltd. 7%
Lucky Cement Ltd. 7%
The Hub Power Co. Ltd. 5%
Pakistan State Oil Co. Ltd. 5%
Engro Fertilizer Ltd. 5%
Mari Petroleum Ltd. 4%
Fauji Cement Co. Ltd 4%
DG Khan Cement Co. Ltd. 4%
Pioneer Cement Co. Ltd. 3%
Cement 25%
Fertilizer 14%
Oil & Gas Exploration Companies 11%
Power Generation & Distribution 10%
Paper & Board 8%
Other Sectors 27%
Cash & Others including receivable 5%
June, 2016
4.5%
27.5%
68.0%
Sukuk
GoP Guaranteed Securities
Cash & Other Including receivables
53.3%
4.0%
30.9%
11.8%
GoP Guaranteed Securities
Sukuk
Placement
Cash & Other Including receivables
KSE-MEEZAN INDEX FUND (KMIF)
AMC RATING AM2++ (STABLE OUTLOOK)
Fund Review:
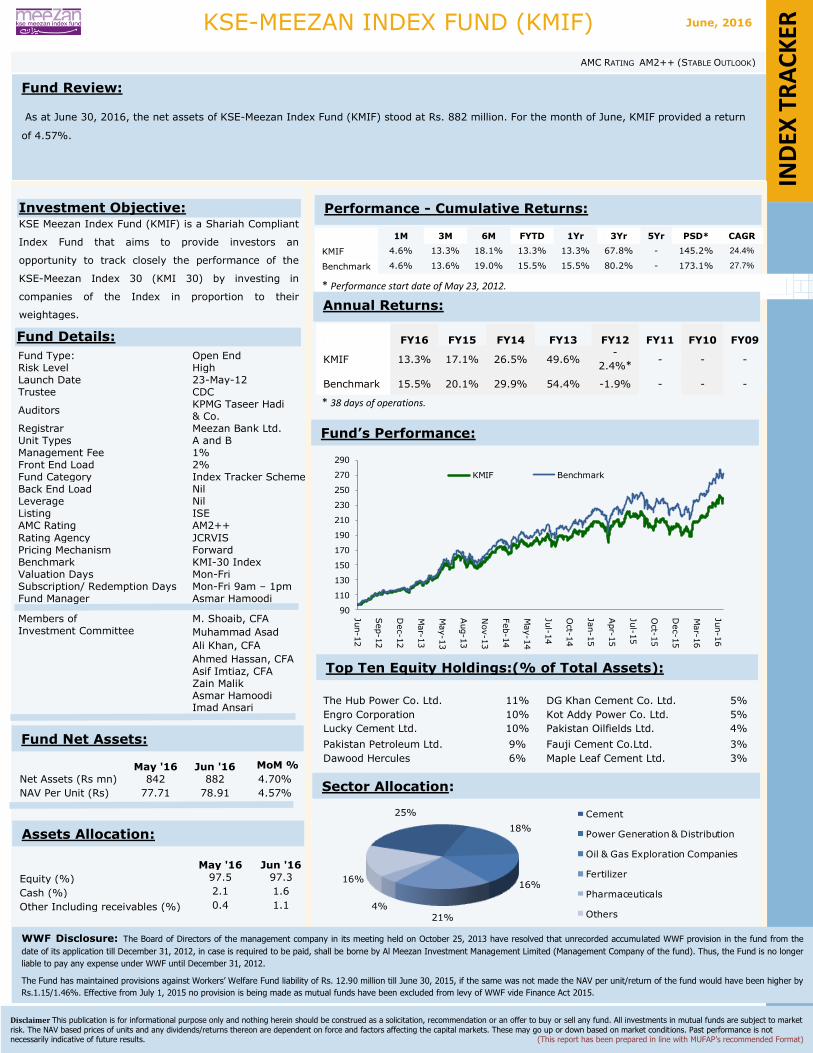
As at June 30, 2016, the net assets of KSE-Meezan Index Fund (KMIF) stood at Rs. 882 million. For the month of June, KMIF provided a return
of 4.57%.
Disclaimer This publication is for informational purpose only and nothing herein should be construed as a solicitation, recommendation or an offer to buy or sell any fund. All investments in mutual funds are subject to market
risk. The NAV based prices of units and any dividends/returns thereon are dependent on force and factors affecting the capital markets. These may go up or down based on market conditions. Past performance is not necessarily indicative of future results. (This report has been prepared in line with MUFAP’s recommended Format)
1M 3M 6M FYTD 1Yr 3Yr 5Yr PSD* CAGR
KMIF 4.6% 13.3% 18.1% 13.3% 13.3% 67.8% - 145.2% 24.4%
Benchmark 4.6% 13.6% 19.0% 15.5% 15.5% 80.2% - 173.1% 27.7%
* Performance start date of May 23, 2012.
FY16 FY15 FY14 FY13 FY12 FY11 FY10 FY09
KMIF 13.3% 17.1% 26.5% 49.6% -
2.4%* - - -
Benchmark 15.5% 20.1% 29.9% 54.4% -1.9% - - -
* 38 days of operations.
The Hub Power Co. Ltd. 11% DG Khan Cement Co. Ltd. 5%
Engro Corporation 10% Kot Addy Power Co. Ltd. 5%
Lucky Cement Ltd. 10% Pakistan Oilfields Ltd. 4%
Pakistan Petroleum Ltd. 9% Fauji Cement Co.Ltd. 3%
Dawood Hercules 6% Maple Leaf Cement Ltd. 3%
Fund Type: Open End Risk Level High Launch Date 23-May-12 Trustee CDC
Auditors KPMG Taseer Hadi & Co.
Registrar Meezan Bank Ltd. Unit Types A and B Management Fee 1% Front End Load 2% Fund Category Index Tracker Scheme Back End Load Nil Leverage Nil Listing ISE AMC Rating AM2++
Rating Agency JCRVIS Pricing Mechanism Forward Benchmark KMI-30 Index Valuation Days Mon-Fri Subscription/ Redemption Days Mon-Fri 9am – 1pm Fund Manager Asmar Hamoodi
Members of Investment Committee
M. Shoaib, CFA
Muhammad Asad
Ali Khan, CFA
Ahmed Hassan, CFA
Asif Imtiaz, CFA Zain Malik Asmar Hamoodi Imad Ansari
Investment Objective: KSE Meezan Index Fund (KMIF) is a Shariah Compliant
Index Fund that aims to provide investors an
opportunity to track closely the performance of the
KSE-Meezan Index 30 (KMI 30) by investing in
companies of the Index in proportion to their
weightages.
Performance - Cumulative Returns:
Annual Returns:
Fund Net Assets:
Sector Allocation:
Fund Details:
WWF Disclosure: The Board of Directors of the management company in its meeting held on October 25, 2013 have resolved that unrecorded accumulated WWF provision in the fund from the
date of its application till December 31, 2012, in case is required to be paid, shall be borne by Al Meezan Investment Management Limited (Management Company of the fund). Thus, the Fund is no longer
liable to pay any expense under WWF until December 31, 2012.
The Fund has maintained provisions against Workers’ Welfare Fund liability of Rs. 12.90 million till June 30, 2015, if the same was not made the NAV per unit/return of the fund would have been higher by
Rs.1.15/1.46%. Effective from July 1, 2015 no provision is being made as mutual funds have been excluded from levy of WWF vide Finance Act 2015.
May '16 Jun '16 MoM %
Net Assets (Rs mn) 842 882 4.70%
NAV Per Unit (Rs) 77.71 78.91 4.57%
May '16 Jun '16
Equity (%) 97.5 97.3
Cash (%) 2.1 1.6
Other Including receivables (%) 0.4 1.1
IN
DEX
TR
AC
KER
Fund’s Performance:
Top Ten Equity Holdings:(% of Total Assets):
Assets Allocation:
June, 2016
25%
18%
16%
21%
4%
16%
Cement
Power Generation & Distribution
Oil & Gas Exploration Companies
Fertilizer
Pharmaceuticals
Others
90
110
130
150
170
190
210
230
250
270
290Jun-12
Sep-12
Dec-12
Mar-
13
May-13
Aug-13
Nov-13
Feb-14
May-14
Jul-
14
Oct-
14
Jan-15
Apr-
15
Jul-
15
Oct-
15
Dec-15
Mar-
16
Jun-16
KMIF Benchmark
MEEZAN FINANCIAL PLANNING FUND OF FUNDS (MFPFOF)
Fund Review:
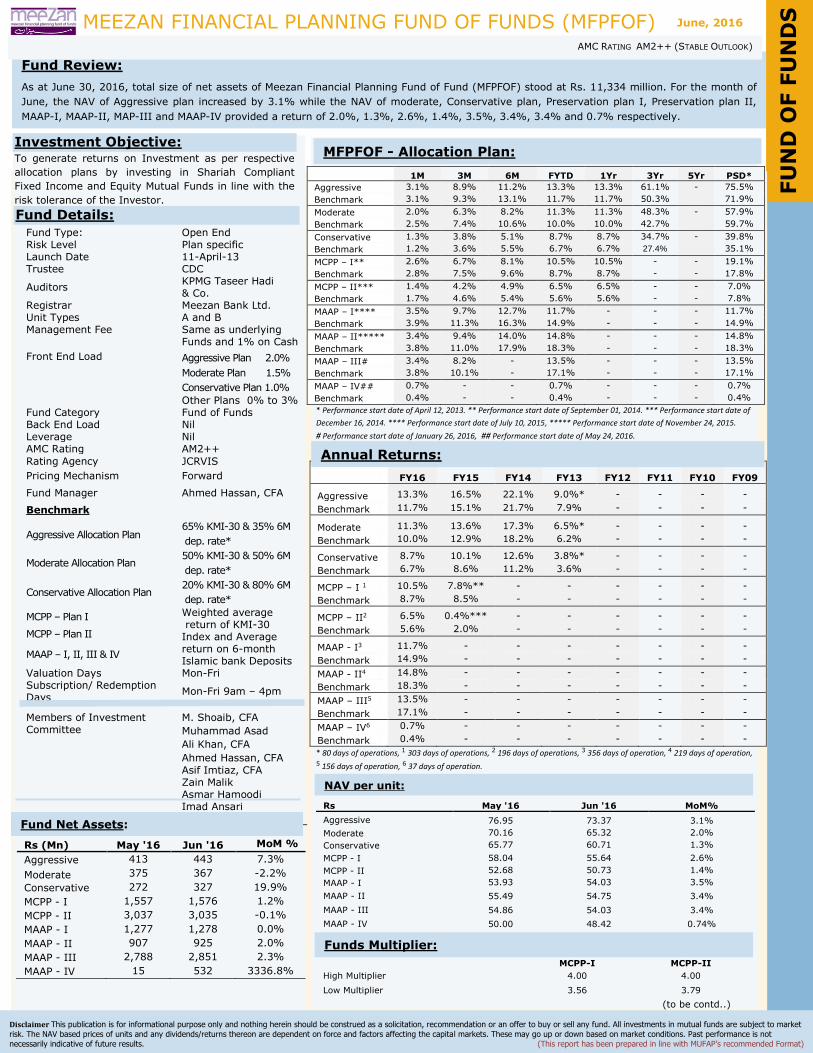
As at June 30, 2016, total size of net assets of Meezan Financial Planning Fund of Fund (MFPFOF) stood at Rs. 11,334 million. For the month of
June, the NAV of Aggressive plan increased by 3.1% while the NAV of moderate, Conservative plan, Preservation plan I, Preservation plan II,
MAAP-I, MAAP-II, MAP-III and MAAP-IV provided a return of 2.0%, 1.3%, 2.6%, 1.4%, 3.5%, 3.4%, 3.4% and 0.7% respectively.
Funds Details
Disclaimer This publication is for informational purpose only and nothing herein should be construed as a solicitation, recommendation or an offer to buy or sell any fund. All investments in mutual funds are subject to market
risk. The NAV based prices of units and any dividends/returns thereon are dependent on force and factors affecting the capital markets. These may go up or down based on market conditions. Past performance is not
necessarily indicative of future results. (This report has been prepared in line with MUFAP’s recommended Format)
AMC RATING AM2++ (STABLE OUTLOOK)
1M 3M 6M FYTD 1Yr 3Yr 5Yr PSD*
Aggressive 3.1% 8.9% 11.2% 13.3% 13.3% 61.1% - 75.5%
Benchmark 3.1% 9.3% 13.1% 11.7% 11.7% 50.3% 71.9%
Moderate 2.0% 6.3% 8.2% 11.3% 11.3% 48.3% - 57.9%
Benchmark 2.5% 7.4% 10.6% 10.0% 10.0% 42.7% 59.7%
Conservative 1.3% 3.8% 5.1% 8.7% 8.7% 34.7% - 39.8%
Benchmark 1.2% 3.6% 5.5% 6.7% 6.7% 27.4% 35.1%
MCPP – I** 2.6% 6.7% 8.1% 10.5% 10.5% - - 19.1%
Benchmark 2.8% 7.5% 9.6% 8.7% 8.7% - - 17.8%
MCPP – II*** 1.4% 4.2% 4.9% 6.5% 6.5% - - 7.0%
Benchmark 1.7% 4.6% 5.4% 5.6% 5.6% - - 7.8%
MAAP – I**** 3.5% 9.7% 12.7% 11.7% - - - 11.7%
Benchmark 3.9% 11.3% 16.3% 14.9% - - - 14.9%
MAAP – II***** 3.4% 9.4% 14.0% 14.8% - - - 14.8%
Benchmark 3.8% 11.0% 17.9% 18.3% - - - 18.3%
MAAP – III# 3.4% 8.2% - 13.5% - - - 13.5%
Benchmark 3.8% 10.1% - 17.1% - - - 17.1%
MAAP – IV## 0.7% - - 0.7% - - - 0.7%
Benchmark 0.4% - - 0.4% - - - 0.4%
* Performance start date of April 12, 2013. ** Performance start date of September 01, 2014. *** Performance start date of
December 16, 2014. **** Performance start date of July 10, 2015, ***** Performance start date of November 24, 2015.
# Performance start date of January 26, 2016, ## Performance start date of May 24, 2016.
FY16 FY15 FY14 FY13 FY12 FY11 FY10 FY09
Aggressive 13.3% 16.5% 22.1% 9.0%* - - - -
Benchmark 11.7% 15.1% 21.7% 7.9% - - - -
Moderate 11.3% 13.6% 17.3% 6.5%* - - - -
Benchmark 10.0% 12.9% 18.2% 6.2% - - - -
Conservative 8.7% 10.1% 12.6% 3.8%* - - - -
Benchmark 6.7% 8.6% 11.2% 3.6% - - - -
MCPP – I 1 10.5% 7.8%** - - - - - -
Benchmark 8.7% 8.5% - - - - - -
MCPP – II2 6.5% 0.4%*** - - - - - -
Benchmark 5.6% 2.0% - - - - - -
MAAP - I3 11.7% - - - - - - -
Benchmark 14.9% - - - - - - -
MAAP - II4 14.8% - - - - - - -
Benchmark 18.3% - - - - - - -
MAAP – III5 13.5% - - - - - - -
Benchmark 17.1% - - - - - - -
MAAP – IV6 0.7% - - - - - - -
Benchmark 0.4% - - - - - - -
* 80 days of operations, 1 303 days of operations, 2 196 days of operations, 3 356 days of operation, 4 219 days of operation,
5 156 days of operation, 6 37 days of operation.
Rs May '16 Jun '16 MoM%
Aggressive 76.95 73.37 3.1%
Moderate 70.16 65.32 2.0%
Conservative 65.77 60.71 1.3%
MCPP - I 58.04 55.64 2.6%
MCPP - II 52.68 50.73 1.4%
MAAP - I 53.93 54.03 3.5%
MAAP - II 55.49 54.75 3.4%
MAAP - III 54.86 54.03 3.4%
MAAP - IV 50.00 48.42 0.74%
Fund Type: Open End Risk Level Plan specific Launch Date 11-April-13 Trustee CDC
Auditors KPMG Taseer Hadi & Co.
Registrar Meezan Bank Ltd. Unit Types A and B Management Fee Same as underlying
Funds and 1% on Cash
Front End Load Aggressive Plan 2.0%
Moderate Plan 1.5%
Conservative Plan 1.0%
Other Plans 0% to 3% Fund Category Fund of Funds Back End Load Nil Leverage Nil AMC Rating AM2++
Rating Agency JCRVIS
Pricing Mechanism Forward
Fund Manager Ahmed Hassan, CFA
Benchmark
Aggressive Allocation Plan 65% KMI-30 & 35% 6M
dep. rate*
Moderate Allocation Plan 50% KMI-30 & 50% 6M
dep. rate*
Conservative Allocation Plan 20% KMI-30 & 80% 6M
dep. rate*
MCPP – Plan I Weighted average return of KMI-30 Index and Average return on 6-month Islamic bank Deposits
MCPP – Plan II
MAAP – I, II, III & IV
Valuation Days Mon-Fri Subscription/ Redemption Days
Mon-Fri 9am – 4pm
Members of Investment Committee
M. Shoaib, CFA
Muhammad Asad
Ali Khan, CFA
Ahmed Hassan, CFA
Asif Imtiaz, CFA Zain Malik Asmar Hamoodi Imad Ansari
* Average return on 6-month Islamic bank deposits
Investment Objective: To generate returns on Investment as per respective
allocation plans by investing in Shariah Compliant
Fixed Income and Equity Mutual Funds in line with the
risk tolerance of the Investor.
Fund Details:
NAV per unit:
Annual Returns:
Fund Net Assets:
MFPFOF - Allocation Plan:
FU
ND
OF F
UN
DS
June, 2016
Rs (Mn) May '16 Jun '16 MoM %
Aggressive 413 443 7.3%
Moderate 375 367 -2.2%
Conservative 272 327 19.9%
MCPP - I 1,557 1,576 1.2%
MCPP - II 3,037 3,035 -0.1%
MAAP - I 1,277 1,278 0.0%
MAAP - II 907 925 2.0%
MAAP - III 2,788 2,851 2.3%
MAAP - IV 15 532 3336.8%
Funds Multiplier:
MCPP-I MCPP-II
High Multiplier 4.00 4.00
Low Multiplier 3.56 3.79
(to be contd..)
MEEZAN FINANCIAL PLANNING FUND OF FUNDS (MFPFOF)
Fund Review:
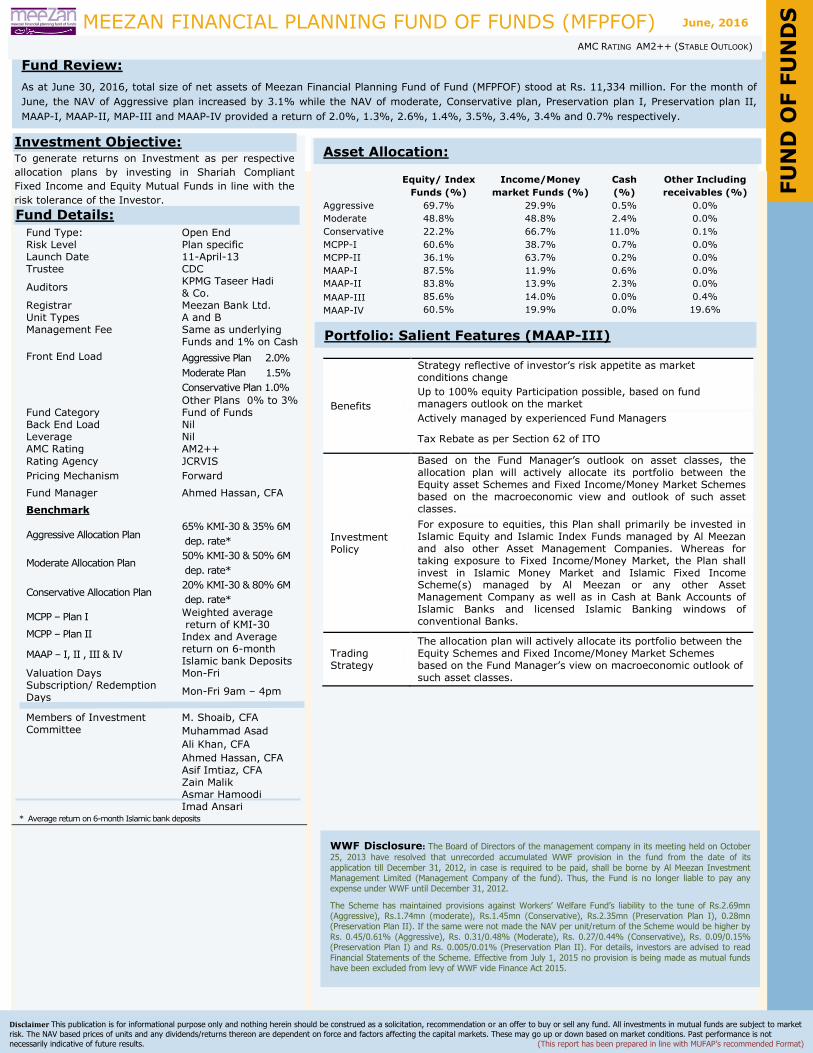
As at June 30, 2016, total size of net assets of Meezan Financial Planning Fund of Fund (MFPFOF) stood at Rs. 11,334 million. For the month of
June, the NAV of Aggressive plan increased by 3.1% while the NAV of moderate, Conservative plan, Preservation plan I, Preservation plan II,
MAAP-I, MAAP-II, MAP-III and MAAP-IV provided a return of 2.0%, 1.3%, 2.6%, 1.4%, 3.5%, 3.4%, 3.4% and 0.7% respectively.
Funds Details
Disclaimer This publication is for informational purpose only and nothing herein should be construed as a solicitation, recommendation or an offer to buy or sell any fund. All investments in mutual funds are subject to market
risk. The NAV based prices of units and any dividends/returns thereon are dependent on force and factors affecting the capital markets. These may go up or down based on market conditions. Past performance is not
necessarily indicative of future results. (This report has been prepared in line with MUFAP’s recommended Format)
AMC RATING AM2++ (STABLE OUTLOOK)
Equity/ Index
Funds (%)
Income/Money
market Funds (%)
Cash
(%)
Other Including
receivables (%)
Aggressive 69.7% 29.9% 0.5% 0.0%
Moderate 48.8% 48.8% 2.4% 0.0%
Conservative 22.2% 66.7% 11.0% 0.1%
MCPP-I 60.6% 38.7% 0.7% 0.0%
MCPP-II 36.1% 63.7% 0.2% 0.0%
MAAP-I 87.5% 11.9% 0.6% 0.0%
MAAP-II 83.8% 13.9% 2.3% 0.0%
MAAP-III 85.6% 14.0% 0.0% 0.4%
MAAP-IV 60.5% 19.9% 0.0% 19.6%
Fund Type: Open End Risk Level Plan specific Launch Date 11-April-13 Trustee CDC
Auditors KPMG Taseer Hadi & Co.
Registrar Meezan Bank Ltd. Unit Types A and B Management Fee Same as underlying
Funds and 1% on Cash
Front End Load Aggressive Plan 2.0%
Moderate Plan 1.5%
Conservative Plan 1.0%
Other Plans 0% to 3% Fund Category Fund of Funds Back End Load Nil Leverage Nil AMC Rating AM2++
Rating Agency JCRVIS
Pricing Mechanism Forward
Fund Manager Ahmed Hassan, CFA
Benchmark
Aggressive Allocation Plan 65% KMI-30 & 35% 6M
dep. rate*
Moderate Allocation Plan 50% KMI-30 & 50% 6M
dep. rate*
Conservative Allocation Plan 20% KMI-30 & 80% 6M
dep. rate*
MCPP – Plan I Weighted average return of KMI-30 Index and Average return on 6-month Islamic bank Deposits
MCPP – Plan II
MAAP – I, II , III & IV
Valuation Days Mon-Fri Subscription/ Redemption Days
Mon-Fri 9am – 4pm
Members of Investment Committee
M. Shoaib, CFA
Muhammad Asad
Ali Khan, CFA
Ahmed Hassan, CFA
Asif Imtiaz, CFA Zain Malik Asmar Hamoodi Imad Ansari
* Average return on 6-month Islamic bank deposits
Investment Objective: To generate returns on Investment as per respective
allocation plans by investing in Shariah Compliant
Fixed Income and Equity Mutual Funds in line with the
risk tolerance of the Investor.
Fund Details:
Asset Allocation:
FU
ND
OF F
UN
DS
WWF Disclosure: The Board of Directors of the management company in its meeting held on October
25, 2013 have resolved that unrecorded accumulated WWF provision in the fund from the date of its
application till December 31, 2012, in case is required to be paid, shall be borne by Al Meezan Investment Management Limited (Management Company of the fund). Thus, the Fund is no longer liable to pay any expense under WWF until December 31, 2012.
The Scheme has maintained provisions against Workers’ Welfare Fund’s liability to the tune of Rs.2.69mn (Aggressive), Rs.1.74mn (moderate), Rs.1.45mn (Conservative), Rs.2.35mn (Preservation Plan I), 0.28mn (Preservation Plan II). If the same were not made the NAV per unit/return of the Scheme would be higher by
Rs. 0.45/0.61% (Aggressive), Rs. 0.31/0.48% (Moderate), Rs. 0.27/0.44% (Conservative), Rs. 0.09/0.15% (Preservation Plan I) and Rs. 0.005/0.01% (Preservation Plan II). For details, investors are advised to read
Financial Statements of the Scheme. Effective from July 1, 2015 no provision is being made as mutual funds have been excluded from levy of WWF vide Finance Act 2015.
June, 2016
Portfolio: Salient Features (MAAP-III)
Benefits
Strategy reflective of investor’s risk appetite as market conditions change
Up to 100% equity Participation possible, based on fund managers outlook on the market
Actively managed by experienced Fund Managers
Tax Rebate as per Section 62 of ITO
Investment Policy
Based on the Fund Manager’s outlook on asset classes, the allocation plan will actively allocate its portfolio between the Equity asset Schemes and Fixed Income/Money Market Schemes based on the macroeconomic view and outlook of such asset classes.
For exposure to equities, this Plan shall primarily be invested in Islamic Equity and Islamic Index Funds managed by Al Meezan and also other Asset Management Companies. Whereas for taking exposure to Fixed Income/Money Market, the Plan shall invest in Islamic Money Market and Islamic Fixed Income Scheme(s) managed by Al Meezan or any other Asset Management Company as well as in Cash at Bank Accounts of Islamic Banks and licensed Islamic Banking windows of conventional Banks.
Trading Strategy
The allocation plan will actively allocate its portfolio between the Equity Schemes and Fixed Income/Money Market Schemes based on the Fund Manager’s view on macroeconomic outlook of such asset classes.
asdf
January, 2016
MEEZAN GOLD FUND (MGF)
Fund Review:
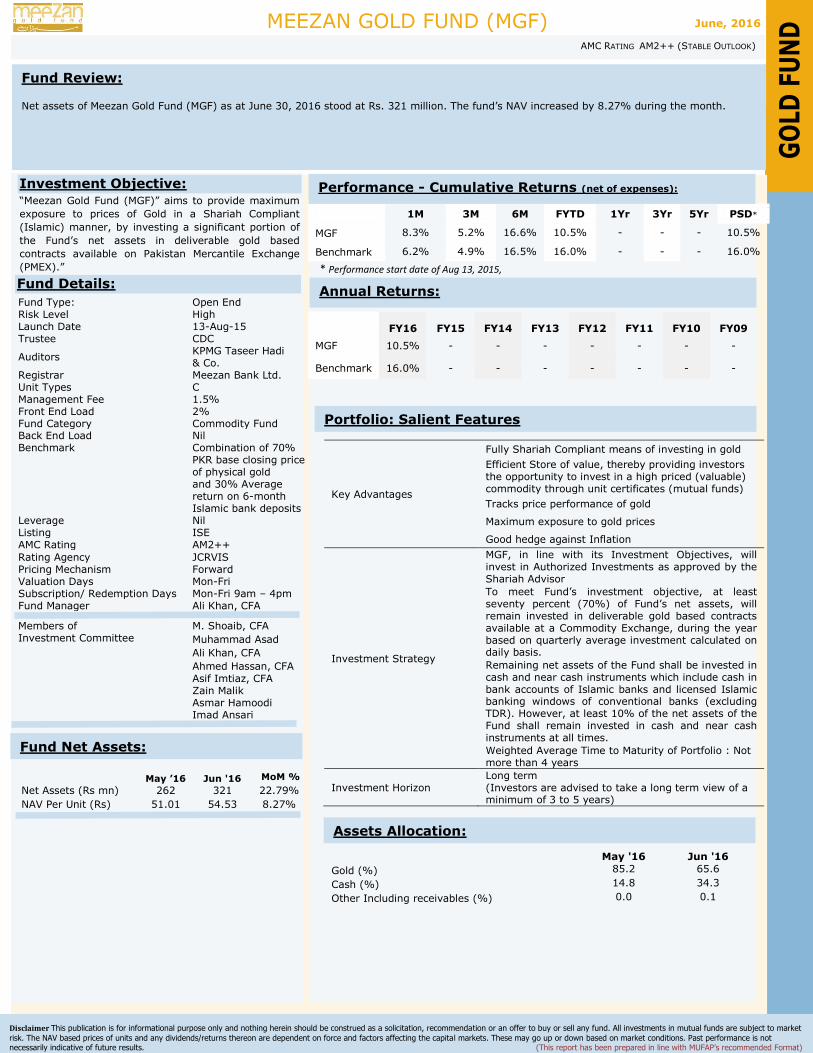
Net assets of Meezan Gold Fund (MGF) as at June 30, 2016 stood at Rs. 321 million. The fund’s NAV increased by 8.27% during the month.
Funds Details
Disclaimer This publication is for informational purpose only and nothing herein should be construed as a solicitation, recommendation or an offer to buy or sell any fund. All investments in mutual funds are subject to market
risk. The NAV based prices of units and any dividends/returns thereon are dependent on force and factors affecting the capital markets. These may go up or down based on market conditions. Past performance is not necessarily indicative of future results. (This report has been prepared in line with MUFAP’s recommended Format)
AMC RATING AM2++ (STABLE OUTLOOK)
1M 3M 6M FYTD 1Yr 3Yr 5Yr PSD*
MGF 8.3% 5.2% 16.6% 10.5% - - - 10.5%
Benchmark 6.2% 4.9% 16.5% 16.0% - - - 16.0%
* Performance start date of Aug 13, 2015,
FY16 FY15 FY14 FY13 FY12 FY11 FY10 FY09
MGF 10.5% - - - - - - -
Benchmark 16.0% - - - - - - -
May '16 Jun '16
Gold (%) 85.2 65.6
Cash (%) 14.8 34.3
Other Including receivables (%) 0.0 0.1
Fund Type: Open End Risk Level High Launch Date 13-Aug-15 Trustee CDC
Auditors KPMG Taseer Hadi & Co.
Registrar Meezan Bank Ltd. Unit Types C Management Fee 1.5% Front End Load 2% Fund Category Commodity Fund Back End Load Nil Benchmark Combination of 70%
PKR base closing price of physical gold and 30% Average return on 6-month Islamic bank deposits
Leverage Nil Listing ISE AMC Rating AM2++
Rating Agency JCRVIS Pricing Mechanism Forward Valuation Days Mon-Fri Subscription/ Redemption Days Mon-Fri 9am – 4pm Fund Manager Ali Khan, CFA
Members of Investment Committee
M. Shoaib, CFA
Muhammad Asad
Ali Khan, CFA
Ahmed Hassan, CFA
Asif Imtiaz, CFA Zain Malik Asmar Hamoodi Imad Ansari
Investment Objective: “Meezan Gold Fund (MGF)” aims to provide maximum
exposure to prices of Gold in a Shariah Compliant
(Islamic) manner, by investing a significant portion of
the Fund’s net assets in deliverable gold based
contracts available on Pakistan Mercantile Exchange
(PMEX).”
Fund Details:
May ’16 Jun '16 MoM %
Net Assets (Rs mn) 262 321 22.79%
NAV Per Unit (Rs) 51.01 54.53 8.27%
Annual Returns:
Performance - Cumulative Returns (net of expenses):
Fund Net Assets:
June, 2016
GO
LD F
UN
D
Portfolio: Salient Features
Key Advantages
Fully Shariah Compliant means of investing in gold
Efficient Store of value, thereby providing investors the opportunity to invest in a high priced (valuable) commodity through unit certificates (mutual funds)
Tracks price performance of gold
Maximum exposure to gold prices
Good hedge against Inflation
Investment Strategy
MGF, in line with its Investment Objectives, will invest in Authorized Investments as approved by the Shariah Advisor
To meet Fund’s investment objective, at least seventy percent (70%) of Fund’s net assets, will remain invested in deliverable gold based contracts available at a Commodity Exchange, during the year based on quarterly average investment calculated on daily basis.
Remaining net assets of the Fund shall be invested in cash and near cash instruments which include cash in bank accounts of Islamic banks and licensed Islamic banking windows of conventional banks (excluding TDR). However, at least 10% of the net assets of the Fund shall remain invested in cash and near cash instruments at all times.
Weighted Average Time to Maturity of Portfolio : Not more than 4 years
Investment Horizon Long term (Investors are advised to take a long term view of a minimum of 3 to 5 years)
Assets Allocation:
Fund Review:
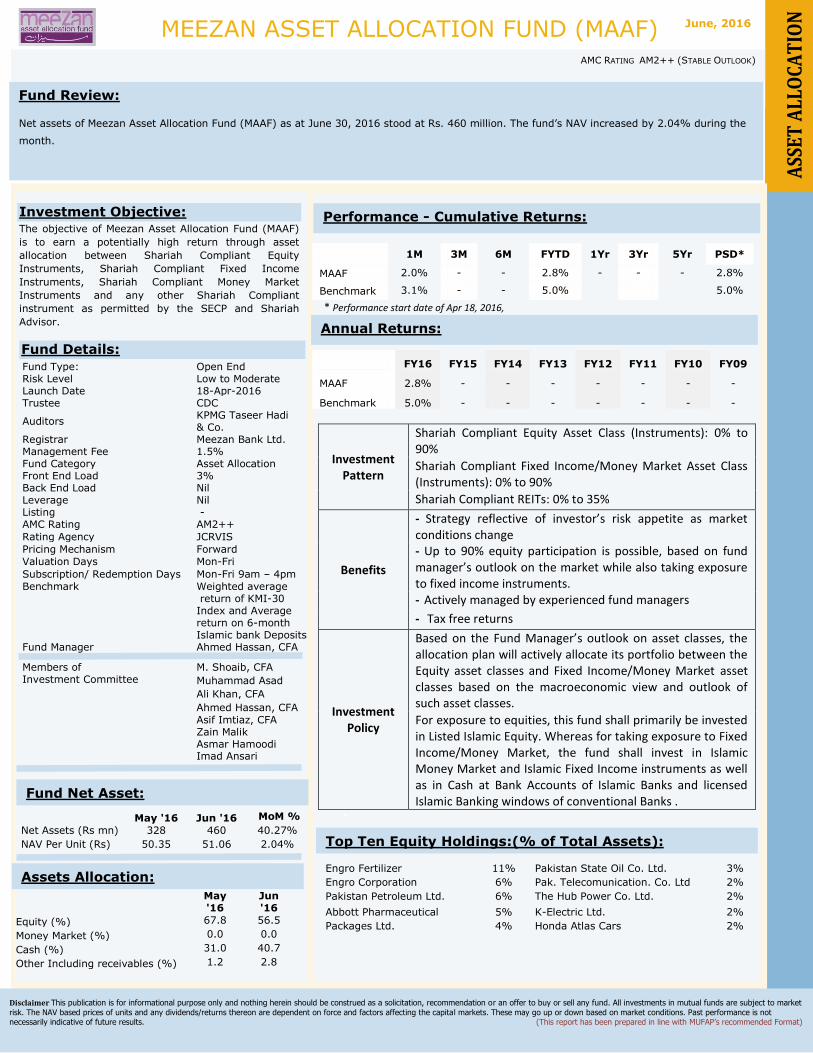
Net assets of Meezan Asset Allocation Fund (MAAF) as at June 30, 2016 stood at Rs. 460 million. The fund’s NAV increased by 2.04% during the
month.
Funds Details
Disclaimer This publication is for informational purpose only and nothing herein should be construed as a solicitation, recommendation or an offer to buy or sell any fund. All investments in mutual funds are subject to market
risk. The NAV based prices of units and any dividends/returns thereon are dependent on force and factors affecting the capital markets. These may go up or down based on market conditions. Past performance is not necessarily indicative of future results. (This report has been prepared in line with MUFAP’s recommended Format)
1M 3M 6M FYTD 1Yr 3Yr 5Yr PSD*
MAAF 2.0% - - 2.8% - - - 2.8%
Benchmark 3.1% - - 5.0% 5.0%
* Performance start date of Apr 18, 2016,
FY16 FY15 FY14 FY13 FY12 FY11 FY10 FY09
MAAF 2.8% - - - - - - -
Benchmark 5.0% - - - - - - -
Investment Pattern
Shariah Compliant Equity Asset Class (Instruments): 0% to 90%
Shariah Compliant Fixed Income/Money Market Asset Class (Instruments): 0% to 90%
Shariah Compliant REITs: 0% to 35%
Benefits
- Strategy reflective of investor’s risk appetite as market conditions change - Up to 90% equity participation is possible, based on fund manager’s outlook on the market while also taking exposure to fixed income instruments. - Actively managed by experienced fund managers
- Tax free returns
Investment Policy
Based on the Fund Manager’s outlook on asset classes, the allocation plan will actively allocate its portfolio between the Equity asset classes and Fixed Income/Money Market asset classes based on the macroeconomic view and outlook of such asset classes.
For exposure to equities, this fund shall primarily be invested in Listed Islamic Equity. Whereas for taking exposure to Fixed Income/Money Market, the fund shall invest in Islamic Money Market and Islamic Fixed Income instruments as well as in Cash at Bank Accounts of Islamic Banks and licensed Islamic Banking windows of conventional Banks .
*
Engro Fertilizer 11% Pakistan State Oil Co. Ltd. 3%
Engro Corporation 6% Pak. Telecomunication. Co. Ltd 2%
Pakistan Petroleum Ltd. 6% The Hub Power Co. Ltd. 2%
Abbott Pharmaceutical 5% K-Electric Ltd. 2%
Packages Ltd. 4% Honda Atlas Cars 2%
Fund Type: Open End Risk Level Low to Moderate Launch Date 18-Apr-2016 Trustee CDC
Auditors KPMG Taseer Hadi & Co.
Registrar Meezan Bank Ltd. Management Fee 1.5% Fund Category Asset Allocation Front End Load 3% Back End Load Nil Leverage Nil Listing - AMC Rating AM2++
Rating Agency JCRVIS
Pricing Mechanism Forward
Valuation Days Mon-Fri
Subscription/ Redemption Days Mon-Fri 9am – 4pm
Benchmark Weighted average return of KMI-30 Index and Average return on 6-month Islamic bank Deposits
Fund Manager Ahmed Hassan, CFA
Members of Investment Committee
M. Shoaib, CFA
Muhammad Asad
Ali Khan, CFA
Ahmed Hassan, CFA
Asif Imtiaz, CFA Zain Malik Asmar Hamoodi Imad Ansari
Fund Details:
Annual Returns:
Performance - Cumulative Returns:
Fund Net Asset:
MEEZAN ASSET ALLOCATION FUND (MAAF)
FUNDma(MBF) AMC RATING AM2++ (STABLE OUTLOOK)
May '16 Jun '16 MoM %
Net Assets (Rs mn) 328 460 40.27%
NAV Per Unit (Rs) 50.35 51.06 2.04%
June, 2016
A
SSET
ALL
OCA
TIO
N
Assets Allocation:
May '16
Jun '16
Equity (%) 67.8 56.5
Money Market (%) 0.0 0.0
Cash (%) 31.0 40.7
Other Including receivables (%) 1.2 2.8
Investment Objective: The objective of Meezan Asset Allocation Fund (MAAF)
is to earn a potentially high return through asset
allocation between Shariah Compliant Equity
Instruments, Shariah Compliant Fixed Income
Instruments, Shariah Compliant Money Market
Instruments and any other Shariah Compliant
instrument as permitted by the SECP and Shariah
Advisor.
Top Ten Equity Holdings:(% of Total Assets):
MEEZAN CAPITAL PRESERVATION FUND-II
Fund Review:
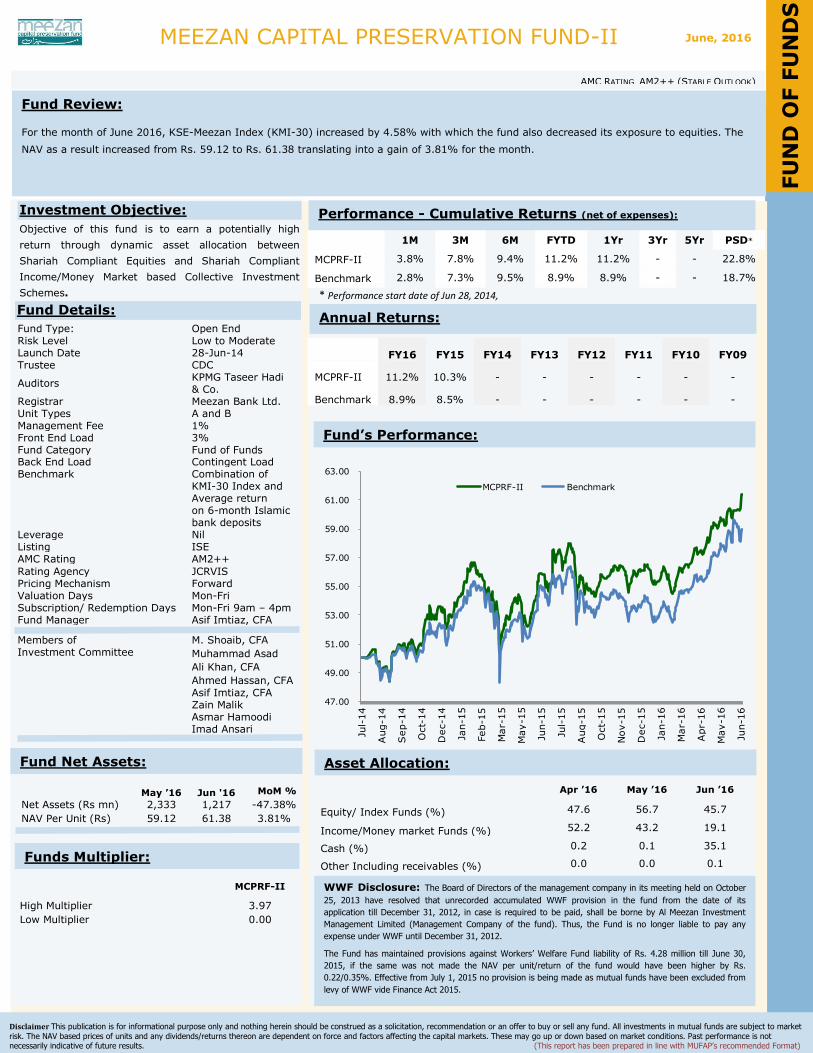
For the month of June 2016, KSE-Meezan Index (KMI-30) increased by 4.58% with which the fund also decreased its exposure to equities. The
NAV as a result increased from Rs. 59.12 to Rs. 61.38 translating into a gain of 3.81% for the month.
Funds Details
Disclaimer This publication is for informational purpose only and nothing herein should be construed as a solicitation, recommendation or an offer to buy or sell any fund. All investments in mutual funds are subject to market
risk. The NAV based prices of units and any dividends/returns thereon are dependent on force and factors affecting the capital markets. These may go up or down based on market conditions. Past performance is not necessarily indicative of future results. (This report has been prepared in line with MUFAP’s recommended Format)
AMC RATING AM2++ (STABLE OUTLOOK)
1M 3M 6M FYTD 1Yr 3Yr 5Yr PSD*
MCPRF-II 3.8% 7.8% 9.4% 11.2% 11.2% - - 22.8%
Benchmark 2.8% 7.3% 9.5% 8.9% 8.9% - - 18.7%
* Performance start date of Jun 28, 2014,
FY16 FY15 FY14 FY13 FY12 FY11 FY10 FY09
MCPRF-II 11.2% 10.3% - - - - - -
Benchmark 8.9% 8.5% - - - - - -
Apr ’16 May ’16 Jun ’16
Equity/ Index Funds (%) 47.6 56.7 45.7
Income/Money market Funds (%) 52.2 43.2 19.1
Cash (%) 0.2 0.1 35.1
Other Including receivables (%) 0.0 0.0 0.1
Fund Type: Open End Risk Level Low to Moderate Launch Date 28-Jun-14 Trustee CDC
Auditors KPMG Taseer Hadi & Co.
Registrar Meezan Bank Ltd. Unit Types A and B Management Fee 1% Front End Load 3% Fund Category Fund of Funds Back End Load Contingent Load Benchmark Combination of
KMI-30 Index and Average return on 6-month Islamic bank deposits
Leverage Nil Listing ISE AMC Rating AM2++
Rating Agency JCRVIS Pricing Mechanism Forward Valuation Days Mon-Fri Subscription/ Redemption Days Mon-Fri 9am – 4pm Fund Manager Asif Imtiaz, CFA
Members of Investment Committee
M. Shoaib, CFA
Muhammad Asad
Ali Khan, CFA
Ahmed Hassan, CFA
Asif Imtiaz, CFA Zain Malik Asmar Hamoodi Imad Ansari
Investment Objective:
Objective of this fund is to earn a potentially high
return through dynamic asset allocation between
Shariah Compliant Equities and Shariah Compliant
Income/Money Market based Collective Investment
Schemes.
Fund Details:
May ’16 Jun '16 MoM %
Net Assets (Rs mn) 2,333 1,217 -47.38%
NAV Per Unit (Rs) 59.12 61.38 3.81%
Annual Returns:
Performance - Cumulative Returns (net of expenses):
Fund Net Assets: Asset Allocation:
Fund’s Performance:
WWF Disclosure: The Board of Directors of the management company in its meeting held on October
25, 2013 have resolved that unrecorded accumulated WWF provision in the fund from the date of its
application till December 31, 2012, in case is required to be paid, shall be borne by Al Meezan Investment
Management Limited (Management Company of the fund). Thus, the Fund is no longer liable to pay any
expense under WWF until December 31, 2012.
The Fund has maintained provisions against Workers’ Welfare Fund liability of Rs. 4.28 million till June 30,
2015, if the same was not made the NAV per unit/return of the fund would have been higher by Rs.
0.22/0.35%. Effective from July 1, 2015 no provision is being made as mutual funds have been excluded from
levy of WWF vide Finance Act 2015.
June, 2016
FU
ND
OF F
UN
DS
Funds Multiplier:
MCPRF-II
High Multiplier 3.97
Low Multiplier 0.00
47.00
49.00
51.00
53.00
55.00
57.00
59.00
61.00
63.00
Jul-
14
Aug-1
4
Sep-1
4
Oct-
14
Dec-1
4
Jan-1
5
Feb-1
5
Mar-
15
May-1
5
Jun-1
5
Jul-
15
Aug-1
5
Oct-
15
Nov-1
5
Dec-1
5
Jan-1
6
Mar-
16
Apr-
16
May-1
6
Jun-1
6
MCPRF-II Benchmark
Fund Review:
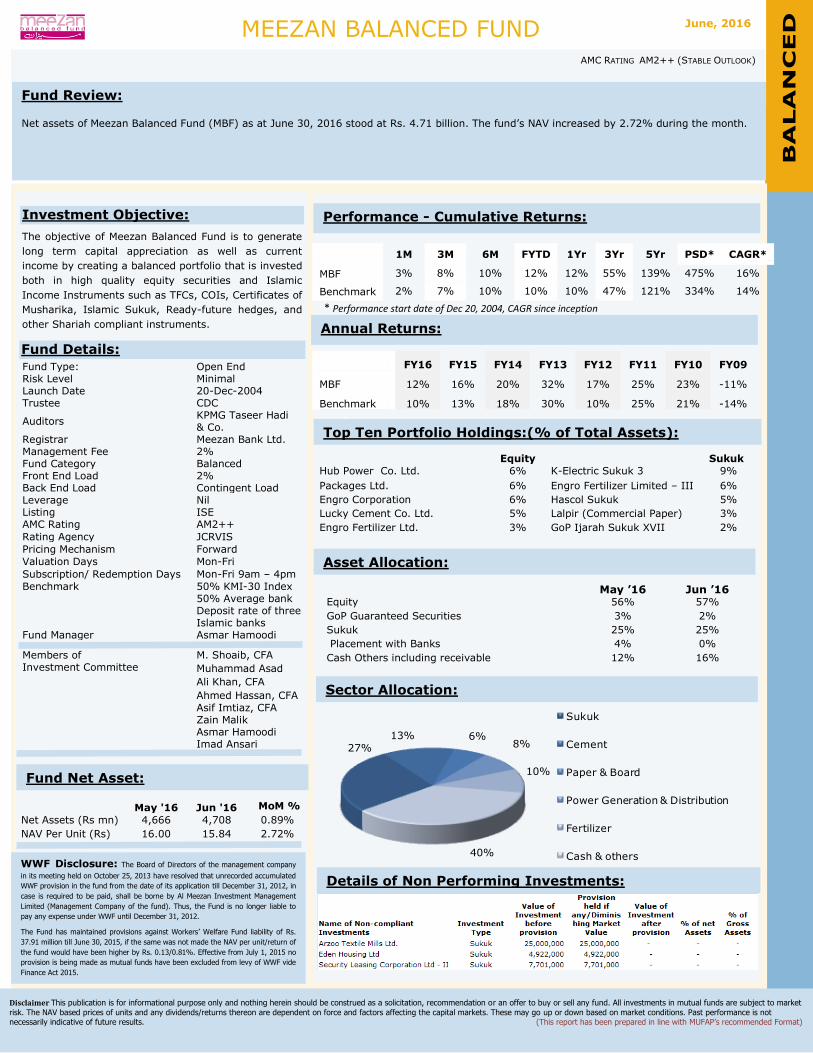
Net assets of Meezan Balanced Fund (MBF) as at June 30, 2016 stood at Rs. 4.71 billion. The fund’s NAV increased by 2.72% during the month.
Funds Details
Disclaimer This publication is for informational purpose only and nothing herein should be construed as a solicitation, recommendation or an offer to buy or sell any fund. All investments in mutual funds are subject to market
risk. The NAV based prices of units and any dividends/returns thereon are dependent on force and factors affecting the capital markets. These may go up or down based on market conditions. Past performance is not necessarily indicative of future results. (This report has been prepared in line with MUFAP’s recommended Format)
1M 3M 6M FYTD 1Yr 3Yr 5Yr PSD* CAGR*
MBF 3% 8% 10% 12% 12% 55% 139% 475% 16%
Benchmark 2% 7% 10% 10% 10% 47% 121% 334% 14%
* Performance start date of Dec 20, 2004, CAGR since inception
FY16 FY15 FY14 FY13 FY12 FY11 FY10 FY09
MBF 12% 16% 20% 32% 17% 25% 23% -11%
Benchmark 10% 13% 18% 30% 10% 25% 21% -14%
*
Equity
Sukuk
Hub Power Co. Ltd. 6% K-Electric Sukuk 3 9%
Packages Ltd. 6% Engro Fertilizer Limited – III 6%
Engro Corporation 6% Hascol Sukuk 5%
Lucky Cement Co. Ltd. 5% Lalpir (Commercial Paper) 3%
Engro Fertilizer Ltd. 3% GoP Ijarah Sukuk XVII 2%
May ’16 Jun ’16 Equity 56% 57%
GoP Guaranteed Securities 3% 2%
Sukuk 25% 25%
Placement with Banks 4% 0%
Cash Others including receivable 12% 16%
Fund Type: Open End Risk Level Minimal Launch Date 20-Dec-2004 Trustee CDC
Auditors KPMG Taseer Hadi & Co.
Registrar Meezan Bank Ltd. Management Fee 2% Fund Category Balanced Front End Load 2% Back End Load Contingent Load Leverage Nil Listing ISE AMC Rating AM2++
Rating Agency JCRVIS
Pricing Mechanism Forward
Valuation Days Mon-Fri
Subscription/ Redemption Days Mon-Fri 9am – 4pm
Benchmark 50% KMI-30 Index 50% Average bank Deposit rate of three Islamic banks
Fund Manager Asmar Hamoodi
Members of Investment Committee
M. Shoaib, CFA
Muhammad Asad
Ali Khan, CFA
Ahmed Hassan, CFA
Asif Imtiaz, CFA Zain Malik Asmar Hamoodi Imad Ansari
Investment Objective:
The objective of Meezan Balanced Fund is to generate
long term capital appreciation as well as current
income by creating a balanced portfolio that is invested
both in high quality equity securities and Islamic
Income Instruments such as TFCs, COIs, Certificates of
Musharika, Islamic Sukuk, Ready-future hedges, and
other Shariah compliant instruments.
Fund Details:
Annual Returns:
Performance - Cumulative Returns:
Top Ten Portfolio Holdings:(% of Total Assets):
Sector Allocation:
Fund Net Asset:
MEEZAN BALANCED FUND
(MBF) AMC RATING AM2++ (STABLE OUTLOOK)
May '16 Jun '16 MoM %
Net Assets (Rs mn) 4,666 4,708 0.89%
NAV Per Unit (Rs) 16.00 15.84 2.72%
B
ALA
NC
ED
Asset Allocation:
WWF Disclosure: The Board of Directors of the management company
in its meeting held on October 25, 2013 have resolved that unrecorded accumulated
WWF provision in the fund from the date of its application till December 31, 2012, in
case is required to be paid, shall be borne by Al Meezan Investment Management
Limited (Management Company of the fund). Thus, the Fund is no longer liable to
pay any expense under WWF until December 31, 2012.
The Fund has maintained provisions against Workers’ Welfare Fund liability of Rs.
37.91 million till June 30, 2015, if the same was not made the NAV per unit/return of
the fund would have been higher by Rs. 0.13/0.81%. Effective from July 1, 2015 no
provision is being made as mutual funds have been excluded from levy of WWF vide
Finance Act 2015.
June, 2016
Details of Non Performing Investments:
27%13% 6%
8%
10%
40%
Sukuk
Cement
Paper & Board
Power Generation & Distribution
Fertilizer
Cash & others
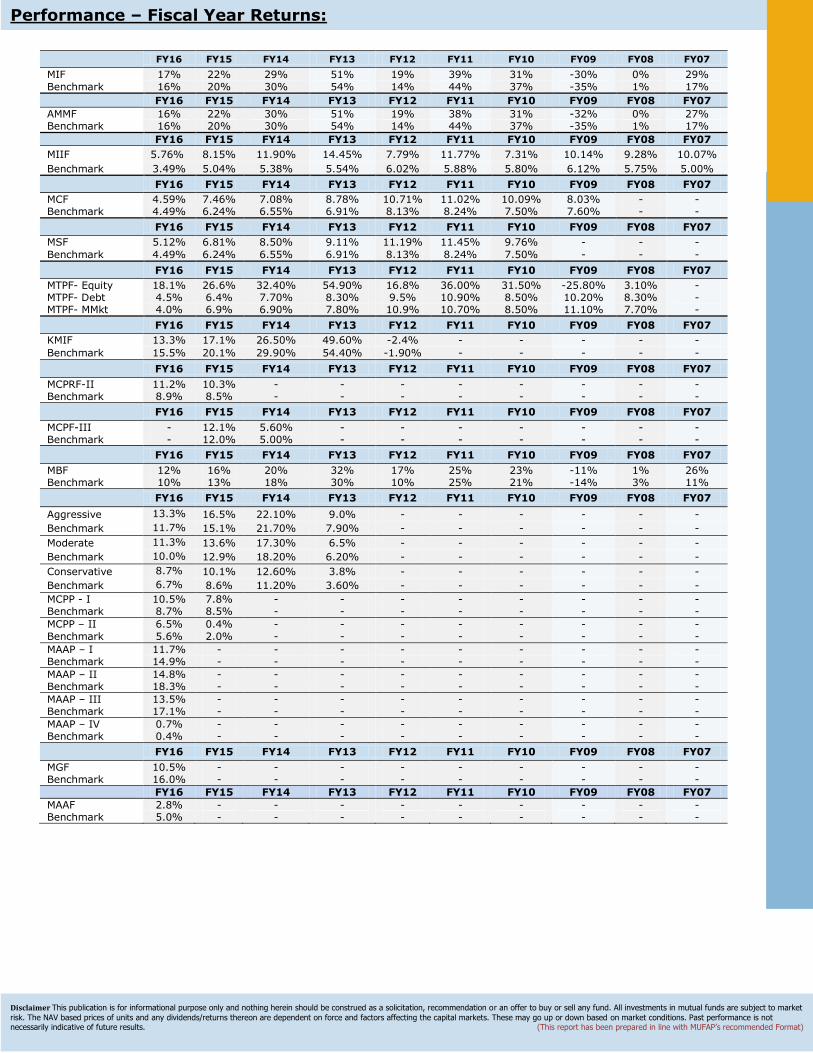
Performance – Fiscal Year Returns:
FY16 FY15 FY14 FY13 FY12 FY11 FY10 FY09 FY08 FY07
MIF 17% 22% 29% 51% 19% 39% 31% -30% 0% 29%
Benchmark 16% 20% 30% 54% 14% 44% 37% -35% 1% 17%
FY16 FY15 FY14 FY13 FY12 FY11 FY10 FY09 FY08 FY07
AMMF 16% 22% 30% 51% 19% 38% 31% -32% 0% 27% Benchmark 16% 20% 30% 54% 14% 44% 37% -35% 1% 17%
FY16 FY15 FY14 FY13 FY12 FY11 FY10 FY09 FY08 FY07
MIIF 5.76% 8.15% 11.90% 14.45% 7.79% 11.77% 7.31% 10.14% 9.28% 10.07%
Benchmark 3.49% 5.04% 5.38% 5.54% 6.02% 5.88% 5.80% 6.12% 5.75% 5.00%
FY16 FY15 FY14 FY13 FY12 FY11 FY10 FY09 FY08 FY07
MCF 4.59% 7.46% 7.08% 8.78% 10.71% 11.02% 10.09% 8.03% - - Benchmark 4.49% 6.24% 6.55% 6.91% 8.13% 8.24% 7.50% 7.60% - -
FY16 FY15 FY14 FY13 FY12 FY11 FY10 FY09 FY08 FY07
MSF 5.12% 6.81% 8.50% 9.11% 11.19% 11.45% 9.76% - - -
Benchmark 4.49% 6.24% 6.55% 6.91% 8.13% 8.24% 7.50% - - -
FY16 FY15 FY14 FY13 FY12 FY11 FY10 FY09 FY08 FY07
MTPF- Equity 18.1% 26.6% 32.40% 54.90% 16.8% 36.00% 31.50% -25.80% 3.10% - MTPF- Debt 4.5% 6.4% 7.70% 8.30% 9.5% 10.90% 8.50% 10.20% 8.30% - MTPF- MMkt 4.0% 6.9% 6.90% 7.80% 10.9% 10.70% 8.50% 11.10% 7.70% -
FY16 FY15 FY14 FY13 FY12 FY11 FY10 FY09 FY08 FY07
KMIF 13.3% 17.1% 26.50% 49.60% -2.4% - - - - -
Benchmark 15.5% 20.1% 29.90% 54.40% -1.90% - - - - -
FY16 FY15 FY14 FY13 FY12 FY11 FY10 FY09 FY08 FY07
MCPRF-II 11.2% 10.3% - - - - - - - - Benchmark 8.9% 8.5% - - - - - - - -
FY16 FY15 FY14 FY13 FY12 FY11 FY10 FY09 FY08 FY07
MCPF-III - 12.1% 5.60% - - - - - - - Benchmark - 12.0% 5.00% - - - - - - -
FY16 FY15 FY14 FY13 FY12 FY11 FY10 FY09 FY08 FY07
MBF 12% 16% 20% 32% 17% 25% 23% -11% 1% 26% Benchmark 10% 13% 18% 30% 10% 25% 21% -14% 3% 11%
FY16 FY15 FY14 FY13 FY12 FY11 FY10 FY09 FY08 FY07
Aggressive 13.3% 16.5% 22.10% 9.0% - - - - - -
Benchmark 11.7% 15.1% 21.70% 7.90% - - - - - -
Moderate 11.3% 13.6% 17.30% 6.5% - - - - - -
Benchmark 10.0% 12.9% 18.20% 6.20% - - - - - -
Conservative 8.7% 10.1% 12.60% 3.8% - - - - - -
Benchmark 6.7% 8.6% 11.20% 3.60% - - - - - -
MCPP - I 10.5% 7.8% - - - - - - - - Benchmark 8.7% 8.5% - - - - - - - -
MCPP – II 6.5% 0.4% - - - - - - - -
Benchmark 5.6% 2.0% - - - - - - - -
MAAP – I 11.7% - - - - - - - - - Benchmark 14.9% - - - - - - - - -
MAAP – II 14.8% - - - - - - - - - Benchmark 18.3% - - - - - - - - -
MAAP – III 13.5% - - - - - - - - - Benchmark 17.1% - - - - - - - - -
MAAP – IV 0.7% - - - - - - - - - Benchmark 0.4% - - - - - - - - -
FY16 FY15 FY14 FY13 FY12 FY11 FY10 FY09 FY08 FY07
MGF 10.5% - - - - - - - - - Benchmark 16.0% - - - - - - - - -
FY16 FY15 FY14 FY13 FY12 FY11 FY10 FY09 FY08 FY07
MAAF 2.8% - - - - - - - - - Benchmark 5.0% - - - - - - - - -
Disclaimer This publication is for informational purpose only and nothing herein should be construed as a solicitation, recommendation or an offer to buy or sell any fund. All investments in mutual funds are subject to market
risk. The NAV based prices of units and any dividends/returns thereon are dependent on force and factors affecting the capital markets. These may go up or down based on market conditions. Past performance is not necessarily indicative of future results. (This report has been prepared in line with MUFAP’s recommended Format)