SENSORY REGRESSION TIME FROM SUBARACHNOID BLOCK …
69
Virginia Commonwealth University Virginia Commonwealth University VCU Scholars Compass VCU Scholars Compass Theses and Dissertations Graduate School 1989 SENSORY REGRESSION TIME FROM SUBARACHNOID BLOCK SENSORY REGRESSION TIME FROM SUBARACHNOID BLOCK WITH HYPERBARIC 0.75% BUPIVACAINE IN THE OBESE PATIENT WITH HYPERBARIC 0.75% BUPIVACAINE IN THE OBESE PATIENT George Leslie Hilton Follow this and additional works at: https://scholarscompass.vcu.edu/etd Part of the Perioperative, Operating Room and Surgical Nursing Commons © The Author Downloaded from Downloaded from https://scholarscompass.vcu.edu/etd/5067 This Thesis is brought to you for free and open access by the Graduate School at VCU Scholars Compass. It has been accepted for inclusion in Theses and Dissertations by an authorized administrator of VCU Scholars Compass. For more information, please contact [email protected].
Transcript of SENSORY REGRESSION TIME FROM SUBARACHNOID BLOCK …

Virginia Commonwealth University Virginia Commonwealth University
VCU Scholars Compass VCU Scholars Compass
Theses and Dissertations Graduate School
1989
SENSORY REGRESSION TIME FROM SUBARACHNOID BLOCK SENSORY REGRESSION TIME FROM SUBARACHNOID BLOCK
WITH HYPERBARIC 0.75% BUPIVACAINE IN THE OBESE PATIENT WITH HYPERBARIC 0.75% BUPIVACAINE IN THE OBESE PATIENT
George Leslie Hilton
Follow this and additional works at: https://scholarscompass.vcu.edu/etd
Part of the Perioperative, Operating Room and Surgical Nursing Commons
© The Author
Downloaded from Downloaded from https://scholarscompass.vcu.edu/etd/5067
This Thesis is brought to you for free and open access by the Graduate School at VCU Scholars Compass. It has been accepted for inclusion in Theses and Dissertations by an authorized administrator of VCU Scholars Compass. For more information, please contact [email protected].

School of Allied Health Professions Virginia Commonwealth University
This is to certify that the thesis prepared by George Leslie Hilton entitled SEN SORY REG RESSION T IME FROM SUBARACHNO ID BLOCK WITH HY PERBARIC 0.75% BUP IVACA INE IN THE OBESE PAT IENT has been approved by his committee as satisfactory completion of the thesis requirement fo r the degree of Master of Science in Nurse Anesthesia.
Director of Thesis
Department chairman
School Dean
Date

SENSORY REG RESS ION T I ME FROM
S UBARACHNOID BLOCK W I TH HY PERBAR IC 0. 75% BUP IVACA INE
IN THE OBE S E PAT I ENT
A thesis submitted in partial ful�illment of the requirements for the degree of Master of
Science in Nurse Anesthesia at Virginia Commonwealth University
BY
George Leslie Hilton
Bachelor of Science in Business Administration The University of Toledo, 1974
Bachelor of Science in Nursing The University of Toledo, 1986
Director: Charles H. Moore, MS, CRNA Assistant Professor Department of Nurse Anesthesia School of Allied Health Professions
Virginia Commonwealth University Richmond, Virginia
August, 1989

Acknowledgments
This investigator wishes to express his appreciation
to Charles H. Moore for his support and guidance throughout
this endeavor. He altered his schedule and covered the
investigator's room, or assisted in the collection of data
on several occasions. This investigator would also like to
thank James Embrey, Dr. Norman Blass, and Addie Pontiflet
for their input and support. He also wishes to thank his
wife Sharon for her patience and understanding during the
completion of this thesis.
iii
TABLE OF CONTENTS
Page List of Tables........................................ v
List of Figures ...................... . · . . . . . . . . . . . . . . .
Ab s t r ac t ............................. . · . . . . . . . . . . . . . . .
Chapte r One : Introduction. Statement of Statement of
Purpose • .
Problem • • · .
· .
. . . . . . . .
· . . . . . . · .
· . . . . · . . · . .
Hypotheses . . . . • . • . . . • • . . . . . . . . . . . . . . . . . . . . . . . . . .
Variables . • • • • • • • · . . · . .
Significance • • • • • . • • • • . • . • . . . • · . . · . .
· . . . .
• • •
· . . .
Definition of Terms . • • • • . • . . . . • • • • . • . . . . . • • • . • • •
Obese . . • . . . . • • • • • • • . • . . • . • • • . . . . • • • • •
Non -obe se • . • . • • • . . . . · . • • • •
Sensory Regression Time • • . • . . • • • • • · .
Subarachnoid Block • . . . • • • · . . · . .
0.75% Bupivacaine • . . . . . • . . . . . • • •
· . . · .
. . . .
· . .
· . . · . . .
· .
Hype rba ric ............................ .
Assumptions • • . • . . . . • • . . . • . • • • . • • • • •
Limitations • . • • • • • • • • . . • . • . • • . . • . .
Delimitations • • . . · . . . . · . . . . . . .
· . . . • • • · .
· . . . . . . . .
Conceptual Framework • . • . • • . . • . . . • • . • . . . . • . • .
Int roduction . . . • • • • . • • • . · . . . . . .
Anatomy of the vertebral Column . . . • . • • • .
Cereb rospinal Fluid • • • . • . • • • . . . • . . . .
Blood Supply. · . .
Local Anesthetic Site and Mechanism of Action ..... . ... ... ........ . .. .
Local Anesthetic Spread .. Assessment of Local Anesthetic
. . .
Sp read. Anesthetic Duration of Local
Bupivacaine .. Metabolism of Obesity • • • .
Summa ry . . • •
Action .. · . . · . . . . . . . . .
Bupivacaine .. · . . . . . . . · . . .
. . • • . . . . . .
· . . . .
• •
. . .
· .
• •
Literature . . . . . . . . . • . . . Chapter Two: Review of Bupivacaine Clearance Effect of Body Mass on
· . . .
in Obese Patients • • . . . .
the Sp read of Spinal Anesthesia . . . . . . . • . . . . . . . . . . .
vi
vii
1 2 2 2 2 3 3 3 3 3 4 4 4 4 5 5 5 5 6 7 8
9 11 14 14 15 16 16 20
21 21
22

1V
page Effect of pH on Anestheti zed Ne rves . . . . . . • . . . . . . 23 Effects of Volume of Spinal Anesthetic in the
Suba rachnoid Space • . . . . . . • . . . . . . . . . . . . .
Infe rio r Vena Cava Comp ression • . . . . . . . . . .
Influence of Obesity on Spinal Analgesia.
Chapte r Three: Methodology . . . . . . . . . . . • • . • . • . . . . . .
Resea rch Design • . . • • . • • . . . • . • • . • • . . . . . . . . .
Population, Sample, and Setting . • . • • • • . • . . .
Data Collection . . • • . • . . . . . . . • • . . • • • • • . . . . . . .
Inst rumentation . . Consent . . . . . • • •
. . . .
. .
. .
. .
. . . . . . . . . . .
. . . .
. . .
Analysis • • • • • . • . . . . . . . . . . . . . . . . . . . . . . . . .
Chapte r Fou r: Results. . . . . . . . . . . . . . . . . . . . . . . . . . . . .
Chapte r Five: Discussion • • • • • . • • . • • • . . . . • • . • . • . . . .
Difficulties with Study • • . . • • . • . • • . • • . . • . • . • • . • .
Conclusion • . • . . • . . . • • . . . . . . . . . . . . . .
Suggestions fo r Futu re Research . . • • • • • . • • . • • . • • •
Refe rences • •
Appendix A : Appendix B:
Appendix C: Appendix D:
. . . . . . . . . . . . . . . . . . . . . . . . . . . . . . . . . . . . . . . . . .
Consent Fo rm • . • . . • • . . . . . . . . . . . . . • . . . . . •
Cha rt of Desi rable Weights fo r Men and Women • • • • • • • • • • • • • • • • •
De rmatome Cha rt . • . . . • .
Data Collection Sheet.
. . . . . . . . . . . . .
. . . . . . . . .
. . . . . . . . . . .
24 25 27
29 29 29 30 31 32 32
33
41 42 43 43
45
49
53 55 57
Vita. . ............ .. .... ...... ....... .. . .... .. ... . . .. . 59

Lis t of Tables
Table
1. Means, Standard Deviations, Minimum Values, and Maximum Values, for Age, Weight, Height, Dose,
v
Page
and Regression Time . . . . . . . . . . . . . . . . . . . . . . . . . . . . 34
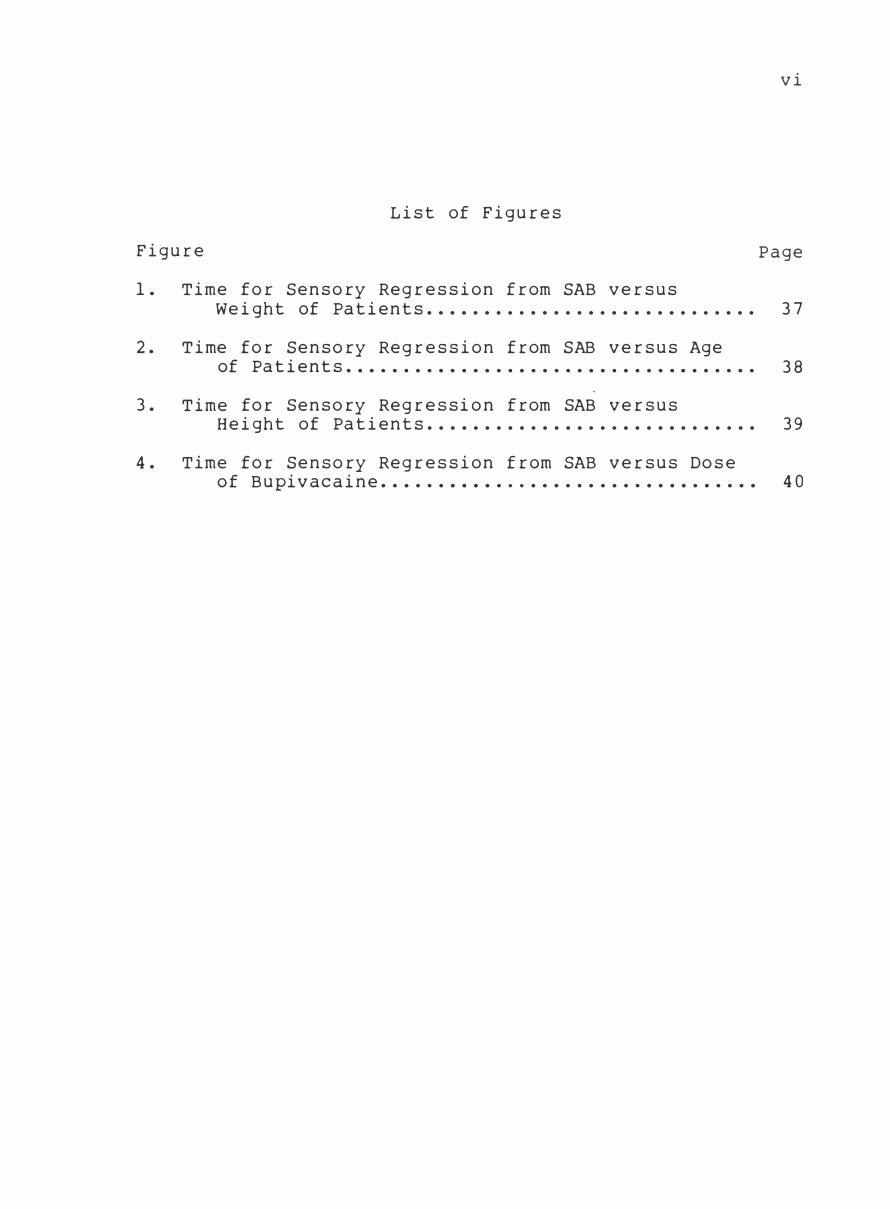
List of Figures
Figure
1. Time for Sensory Regression from SAB versus
vi
Page
Weight of Patients • • • • . • . . . . • . . . • . • • • . . • . . . . . . . 37
2. Time for Sensory Regression from SAB versus Age of Patients.................................... 38
3. Time for Sensory Regression from SAB versus Height of Patients . . • • . . . . . . . . . • . . . • . . • • . . • . . . . 39
4 . Time for Sensory Regression from SAB versus Dose of Bupivacaine . . • . . . • • • • . . . . . . . . . . . . . • . • • . • . . • • 4 0

Abstract
S EN SORY REG RESSION T IME FROM SUBARACHNOID BLOCK WITH
HYPERBARIC 0.75% BUP IVACA INE IN THE OBESE PAT IENT
George L. Hilton, BBA, BSN
School of Allied Health Professions, Virginia Commonwealth
University, 19 89
Major Director : Charles H. Moore, MS, CRNA
The purpose of this study was to determine if obese
patients have a different sensory regression time from
subarachnoid block than non-obese patients using hyperbaric
0.75% bupivacaine. A quasi-experimental design was used.
Twenty patients were separated into two groups; one group
was classified as obese, and the other group was classified
as non-obese. The data consisting of age, height, weight,
sex, and surgical procedure were recorded preoperatively.
All the patients received hyperbaric 0.75% bupivacaine via
subarachnoid puncture. The levels of spinal anesthesia
were recorded at the highest level achieved. The injection
time was also recorded. When the surgery was completed,
the patient was transferred to the recovery room and levels
of sensory blockade were checked by pin-prick with an
18-gauge needle every 10 minutes until complete recovery
viii
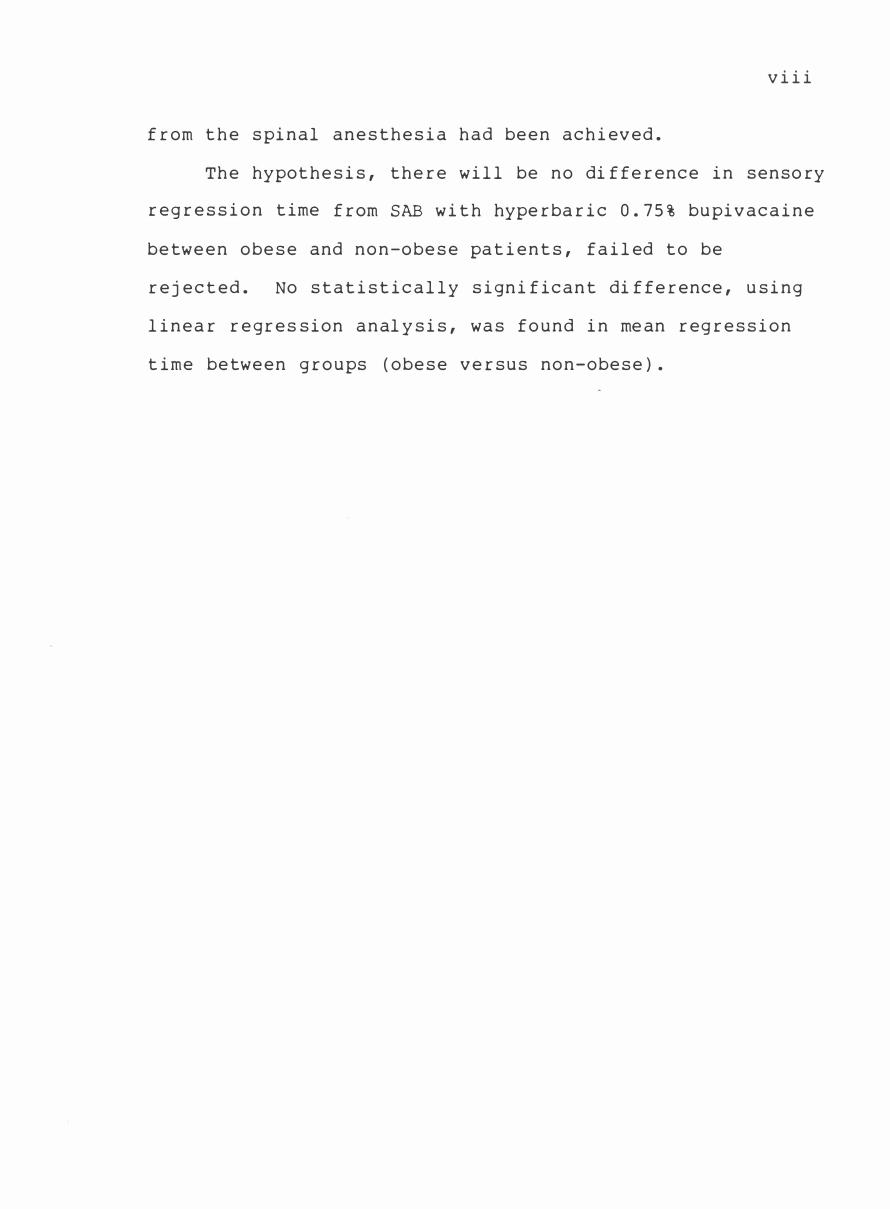
from the spinal anesthesia had been achieved.
The hypothesis, there will be no difference in sensory
regression time from SAB with hyperbaric 0.75% bupivacaine
between obese and non-obese patients, failed to be
rejected. No statistically significant difference, using
linear regression analysis, was found in mean regression
time between groups (obese versus non-obese) .
Chapter One
Introduction
Subarachnoid block (SAB) was first reported by Dr.
Corning in 1885. He made his discovery while experimenting
with cocaine as a local anesthetic in a dog. Subsequently,
Augusta Beard in 189 8 refined the SAB technique. This
technique was studied ln many different ways; however,
there was little current research published addressing
obesity and the effect it had on sensory regression time.
A prolonged block can cause many problems for the
patient, such as anxiety, financial expense in terms of a
longer period of time spent in the recovery room, and risk
of an accident due to loss of sensation and motor control.
An insufficient block requires the patient to have an
additional anesthetic for the same surgical procedure, and
exposes the patient to additional risks and complications.
By acquiring the knowledge of sensory regression time from
SAB in obese patients, it is possible to plan accordingly
for obese patients in terms of preoperative teaching,
preparation, type and dose of local anesthetic to use, and
postoperative care. Increased knowledge from research in
1

this area will benefit patients in terms of safety,
comfort, cost, and convenience.
Statement of Purpose
The purpose of this study was to determine if obese
patients have a different sensory regression time from
subarachnoid block than non-obese patients using
hyperbaric, 0.75% bupivacaine.
statement of Problem
Is the sensory regression time from SAB with
hyperbaric, 0.75% bupivacaine different in the obese and
non-obese patient?
Hypothesis
2
There is no difference in sensory regression time from
SAB with hyperbaric, 0.75% bupivacaine, between obese and
non-obese patients.
Variables
Dependent. The dependent variable was the time for
sensory regression from SAB.
I ndependent. The independent variable was body
weight.
Significance

3
I nc reased kn owled ge gained f rom this study will help
clinician s p rovide a safe r an d mo re cost effective SAB fo r
obese patients. Knowledge gained f rom this study will also
help the clinician p repa re the patient fo r the SAB
p rocedu re and decrease patient anxiety. Othe r gains
include dec reased cost to the patient in te rms of time
spent in the recove ry room and dec reased risk of injury to
the patient due to loss of sensation and moto r cont rol.
Definition of Te rms
Obese. Patients whose body weight is above thei r
weight range acco rding to the chart of Desi rable weights
fo r Men and Women p repa red by the Met ropolitan Li fe
Insurance Company ( 19 80) ( see Appendix B) a re classified as
obese .
Non-obese. Patients whose body weight is within thei r
weight range according to the cha rt of Desi rable Weights
for Men and Women p repa red by the Met ropolitan Li fe
Insurance Company ( 19 80) ( see Appendix B ) a re classi fied as
obese.
Sensory reg ression time . Following a SAB , the time
r�ui red fo r a patient to have complete retu rn of a "sha rp"
sensation from the stimulus of an 18-gauge needle . This
sensation is intact f rom the nipple line to the tip of the
2nd an d 3rd toes bilaterally.
Suba rachnoid block. Anesthesia p rod uced by injecting
hype rba ric, 0.75% bupivacaine by mean s of a 25-gauge spinal

n eedle into the subarachnoid space through a lumbar
vertebral space, either at L2- 3, L3-4, or L4-s.
0.75% Bupivacaine. An amide type local anesthetic
commonly used to produce analgesia when injected into the
subarachn oid space. The concentration used in this study
contained 7.5 milligrams of bupivacaine per milliliter of
solution ( mg/ml).
4
Hyperbaric. A solution heavier than that solution
into which it is injected. Dextrose is a common additive
used to make solutions hyperbaric. The concentration used
in this study contained 84 mg/ml.
Assumptions
1. There were no defects in the spinal anatomy of the
patients.
2. The spinal anesthetic "hyperbaric 0.75% bupivacaine
in 8.4% dextrose " was pure and the dose per ampule was
accurate as indicated on the label.
3. The dose of local anesthetic given was presumed to
be adequate to produce T4 level sensory analgesia in all
patients.
4. Each subject possessed a normal blood acid-base
balance.
5. Scales were uniformly accurate between patients.
5
Limitations
1. The methodology included a lack of randomization,
with unequivalent comparison groups.
2. The individual may have performed an inconsistent
assessment of sensory levels due to patient differences in
the perception of sharpness.
3. More than one individual performed the assessments
of the levels of anesthesia, and there may have been
different judgments about where the level of anesthesia was
actually located.
4. The individual could be biased in his or her
judgment regarding the anesthesia level because of
preconceived ideas about what effect obesity had on the
recovery time from SAB.
Delimitations
1. Patients could only be studied if they agreed to
participate.
2. Informed consent was required.
3. All patients were accurately weighed on the same
scale prior to surgery .
4. All patients were female presenting for postpartum
bilateral tubal ligations.
Conceptual Framework
Introduction. Patients who are obese or pregnant
experience higher levels of analgesia following SAB when
6
compared to non -obese or non-pregnant patients given a
similar dose of bupivacaine anesthetic ( McCulloch &
Littlewood, 19 86). Since there are several reasons to
explain these higher sensory levels, it is necessary to
discuss the basic anatomy of the spinal column, production
and flow of cerebrospinal fluid, blood supply to the spinal
cord, local anesthetic site and mechanism of action, local
anesthetic spread and duration of action, and the local
anesthetic bupivacaine.
Anatomy of the vertebral column. The vertebral column
consists of seven cervical, twelve thoracic, five lumbar,
five sacral and usually, four coccygeal vertebrae. There
are four curves in the vertebral column cervical, thoracic,
lumbar, and pelvic ( Bridenbaugh & Kennedy, 19 80). Normally,
the cervical and lumbar curves are convex anteriorly and
the thoracic and pelvic curves are concave anteriorly.
These curves affect the spread of local anesthetic in the
subarachnoid space ( Smith, 19 68). The upper lumbar and
lower thoracic vertebral canal is inclined anteriorly in
the supine patient 8 to 12 degrees. These inclined
vertebrae cause a more cephalad spread of hyperbaric
analgesics to the fourth or fifth thoracic segments.
There are three main ligaments that provide the spinal
column stability and flexibility. The ligaments preceding
from a ventral to dorsal direction are as follows. The
ligamentum flavum covers the interlaminar space. The
interspinous ligament connects the spinous processes and

blends dorsally with the supraspinous ligaments. The
supraspinous ligament connects the apices of the spinous
processes from cervical vertebrae number seven to the
sacrum (Bridenbaugh & Kennedy, 1980).
7
Exposure of spinal nerves to local anesthetic causes
sensory blockade and analgesia to the corresponding
dermatomes. There are 3 1 pairs of spinal ne rves arranged
as follows : eight cervical, twelve thoracic, five lumbar,
five sacral, and one coccygeal. The spinal nerves leave
the vertebral canal by passing through the intervertebral
foramina. The union of ventral and dorsal roots form the
spinal nerves. The ventral roots contain axons of motor
neurons, and the dorsal roots contain axons of sensory
neurons (Bridenbaugh & Kennedy, 1980).
Cerebrospinal fluid. Cerebrospinal fluid (CSF) is
formed in the choroid plexus and is an ultrafiltrate of
blood (Bridenbaugh & Kennedy, 1980). It is a clear,
colorless fluid found in the spinal and cranial
subarachnoid spaces and in the ventricles of the brain. It
has a pH of 7.4 to 7.6 and a specific gravity of 1.003 to
1.009. The electrolyte concentrations similar to that of
plasma but with a sodium and chloride ion content slightly
higher and a protein content slightly lower. The total
volume of CSF in the average adult ranges from 120 ml to
150 ml with 25 ml to 3 5 ml in the spinal subarachnoid
space. The pressure of the CSF ranges from 60 millimeters
of water (mm H20) to 80 mm H20. According to Bridenbaugh

8
and Kennedy (1980), cerebrospinal fluid flows from the
fourth ventricle to the two foramen of Lushka, and under
the influence of the cephalad circulation in the vertebral
vein s circulates upward over the surface of the brain. It
also passes through the median foramen of Magen die and then
proceeds downward to the spinal cord. The composition of
the CSF is kept constant by osmosis alterations in posture,
and arterial pulsations. Cerebrospinal fluid passes back
into the bloodstream by filtration and osmosis, which takes
place in the supratentorial region of the brain through the
arachn oid villi and granulations.
Blood supply. There are one anterior and two
posterior spinal arteries that supply blood to the spinal
cord ( Bridenbaugh & Kennedy, 1980). The anterior spinal
artery descends in front of the anterior longitudinal
sulcus of the spinal cord to the filum terminale. Many
vessels branch off the anterior spinal artery to encircle
the spinal cord and supply its periphery. The posterior
spinal arteries send penetrating branches into the
posterior white and gray matter. These branches freely
connect with the anterior spinal artery.
Blood is drained from the spinal cord by two ascen ding
vertebral veins that lie posterior and lateral to the
spinal cord. These veins become engorged in the obese
individual, especially when the patient is in the supine
position. I t is the blood flowing in the cephalad

direction in the vertebral venous system that influences
the cephalad movement of CSF.
Local anesthetic site and mechanism of action.
9
According to Howarth (194 9), when a local anesthetic was
injected into the subarachnoid space, it was absorbed by
neural elements. It was believed the spinal nerve roots
are the site of action of local anesthetics; however, the
exact site of action was debatable. Howarth discovered
that radioactive-isotope- labeled local anesthetics gathered
around the lateral and posterior aspects of the spinal
cord, as well as along the spinal nerve roots. Howarth
postulated that local anesthetics act by reducing the
permeability of the cell membrane to sodium ions so that
there was a marked depression of the rate of depolarization
such that it failed to reach threshold potential.
Consequently, an action potential did not occur and neural
blockade resulted.
There were three theories regarding the exact
mechanism that resulted in neural blockade from the
administration of local anesthetics ( Strichartz , 1 97 3).
First, the receptor site theory stated that local
anesthetics bind to receptors in sodium channels.
Strichartz reported that the sodium channel gates must be
open for local anesthetic to enter and to block ionic
conduction through the nerve. Strichartz postulated that
the quartenary molecules of the local anesthetics bind to
open sodium channels resulting in blocked neural

conduction. Lee (1979) suggested four possible sites for
action of the local anesthetics on sodium channels ( a)
within the pore, ( b) on protein surfaces exposed to the
aqueous phase, ( c) at the lipid-protein-water interface,
and ( d) within the membrane.
10
Second, the membrane expansion theory stated that
local anesthetics expand nerve membranes that in turn block
the sodium channels and neural conduction. The nerve
membrane was regarded as being essentially impermeable to
cations except at special regions where holes or channels
exist through which cations move during an action
potential. Anesthetic agents were postulated to increase
the freedom of movement of the lipid molecules, especially
at the aqueous-lipid interface, with the result that some
part of the membrane that is critical for conduction is in
an expanded state ( Ritchie, 1975).
Third, the surface charge stated that the local
anesthetic agent was bound to the membrane by the
lipophilic, aromatic end of the molecule with its cationic
head remaining in solution. As a result, the fixed
negative charges on the membrane were neutrali zed so that
the resting potential across the membrane increased
considerably. I f this increase in transmembrane potential
was great enough, the action potential might be
insufficient to reduce the membrane potential to its
threshold level and a conduction block occurred ( Ritchie,
1975).
1 1
According to Wood (1982), there were three properties
that had an influence on the action of local anesthetics.
They included lipid solubility, protein binding, and the
dissociation constant ( pKa). It was the lipophylic portion
of the drug molecule that penetrated the cell membrane.
The more lipophylic the local an esthetic ; the more potent
and longer acting was the drug. Increased lipid solubility
of the local anesthetic caused more extensive entry into
body membranes and tissues. Anesthetic action was
prolonged by increased protein binding. As the local
anesthetic releases from the protein; the n eural blockade
continues.
The pKa is the pH at which the drug is 50% ioniz ed and
50% un-ioniz ed. Local anesthetics, including bupivacaine,
are weak bases. Weak bases are more ioniz ed in an acidic
solution, so decreasing the pH increases the ioni zation of
the base. The closer the pKa is to physiologic pH, the
more un -ionized form of the drug is available to cross the
cell membran e and to have a faster onset of action ( Wood,
1 982).
Local anesthetic spread. Local anesthetic spread
refers to the movement of the local anesthetic after it is
injected into the subarachn oid space. The spread of a
local anesthetic solution, after it was injected into the
CSF, has an effect on sensory regression time. The
addition of a glucose solution (7.5-1 0% ) to a local
anesthetic produces a hyperbaric solution that influences

12
the spread of local anesthetic. Gravity influences the
movement of a hyperbaric solution, when injected into the
subarachnoid space. If the patient remains in a sitting
position, the hyperbaric solution moves in the caudad
direction. Placing the patient in a Trendelenberg position
facilitates a cephalad spread of the anesthetic drug. A
hyperbaric solution becomes isobaric within 10 to 15
minutes after injection into the CSF. At this point, the
level of anesthesia becomes "fixed" and changes in patient
position do not affect the anesthetic level (Norris, 1988).
There are patient characteristics that affect the
spread of local anesthetics in CSF. As the age of the
patient increases, the onset of the local anesthetic is
faster and it takes longer for the anesthetic to be
metaboliz ed and cleared from the body (Veering, Burm, &
Spierdijk, 1988).
Patient height also influences local anesthetic
spread. According to Greene (1985), a "short" person who
has a local anesthetic injected at the L3 -4 interspace will
have a more cephalad spread of anesthesia than a "tall"
person with the same amount and type of local anesthetic.
Even if the anesthetic solution spreads an equal distance
in both patients, an 18 centimeter (cm) spread reaches a
higher spinal segmental level in a "short" patient.
There are also height-related di fferences in CSF
volume. The volume of CSF below the L2 interspace is
greater in "tall" patients because the length of the cauda
13
equina is greater (Norris, 1988). Since the CSF volume at
the L2-L5 interspace, where the local anesthetic is
injected, is greater in "tall" patients, the anesthetic
solution has greater dilution and hence less cephalad
spread. The depth of the subarachnoid space (from the dura
to the pia matter) is greater in "tall" patients. The
increased depth means there is an increase in absolute CSF
volume at any level of the cord that contributes to further
dilution of the local anesthetic in the CSF (Norris, 1988).
The site of injection of local anesthetic into the
subarachnoid is important to note. Above L2, the spinal
cord occupies a larger portion of the subarachnoid space
that subsequently decreases the amount of CSF. Therefore,
less dilution of the local anesthetic occurs with greater
cephalad distribution (Norris, 1988).
According to Greene (1985), the direction of the bevel
of the spinal needle during injection had no effect on the
spread of local anesthetics in the subarachnoid space.
Greene cited studies that indicated turbulence, as a result
of the rate or force of injection, did not have any
clinically significant effect on local anesthetic spread in
the CSF. Furthermore, Greene reported that sudden
increases in CSF pressure from uterine contractions,
valsalva maneuver, straining or coughing did not increase
the spread of local anesthetics in the subarachnoid space.
According to Norris (1988), the dose of anesthetic
affects its spread in the CSF. It is generally found that

14
a higher dose of local anesthetic results in a more
cephalad spread of the drug in the CSF. However, the
influence of concentration, volume, and baricity may
override the effect of a higher dosage of local anesthetic.
Assessment of local anesthetic spread. Rocco ,
Raymond, Murray, Dhingra, and Freiberger (1985)
demonstrated loss of sensation to touch as the best method
of assessing sensation after SAB. Sensation to pin-prick
and cold were also studied. Most practitioners in
anesthesia today use pin-prick to assess sensory levels.
Local anesthetic duration of action. The duration of
analgesia is influenced by the speed of absorption from the
subarachnoid space into the bloodstream. The egress of
local anesthetic agents following subarachnoid injection is
primarily by vascular absorption with no hydrolysis or
other form of degradation taking place in the spinal fluid
(Bridenbaugh & Kennedy, 1980) . Local anesthetic
concentration decreased rapidly in the CSF after injection
because the drug is bound to tissue and absorbed into the
bloodstream. Spinal anesthesia duration is controlled by
the speed that the local anesthetic is absorbed from the
spinal cord, the subarachnoid space, and di f fusion throug h
the dura and the epidural space. The more absorptive
surface the local anesthetic is exposed to as it spreads in
the subarachnoid space, the shorter the duration of
anesthesia.

15
According to Ritchie and Greene (1985), the
lipophylicity of the local anesthetic also affects its
duration. Tetracaine is highly lipid soluble and lasts 2
to 3 hours as a spinal anesthetic. Lidocaine is less lipid
sol uble and only lasts approximately 1 hour. Bupivacaine
is highly lipid soluble and has a duration of 2.5 to 4
hours.
Bupivacaine. Bupivacaine is an amid� type local
anesthetic. It has a molecular weight of 288 and a pKa of
8. 1. Bupivacaine has a lipid solubility partition
coefficient of 28 and is 95% bound to plasma proteins.
Onset of action of bupivacaine is very rapid with maximum
motor blockade and maximum dermatome level achieved within
15 minutes. Bupivacaine' s duration of action, when
injected into the subarachnoid space, is reported by the
manufacturer to be approximately 4 hours. This is
considered to be an intermediate length of time as compared
to other local anesthetics. The half life of bupivacaine
is approximately 2.7 hours. On a potency scale of one to
eight, bupivacaine has a rating of eight (Savarese &
Covino, 1 986).
Metabolism of bupivacaine. Amide type local
anesthetics are metabolized in the liver via conjugation
with glucouronic acid. The major metabolite
"pipecolylxylidine" is excreted by the kidney. Only 6% of

bupivacaine is excreted unchanged in the urine (Boyes,
1975).
16
Obesity. When given a similar dose of local
anesthetic, obese patients experience higher sensory levels
following SAB when compared to normal weight patients.
There are several reasons that explain the higher sensory
levels. The primary reason relates to the decreased amount
of CSF in obese patients. Other reasons .include slower
speed of absorption and decreased susceptibility at the
nerve roots to local anesthetics (McCulloch & Littlewood,
1986).
According to McCulloch and Littlewood (1986), obese
patients, in the supine position, have a decreased CSF
capacity in their subarachnoid space. Less CSF is
available to mix with the anesthetic agent; therefore,
less dilution of the local anesthetic occurs. A reduced
dose of local anesthetic is required to anestheti ze the
spinal segments. Blood volume and CSF volume have an
inverse relationship with one another. I nferior vena cava
compression produced by a large amount of abdominal fat
causes lumbar vertebral venous engorgement that decreases
the subarachnoid space capacity for CSF (Barclay, Renegar &
Nelson, 1968). Occluding inferior vena cava blood flow
causes a subsequent increase in blood flow through the
lumbar vertebral plexus, the ascending lumbar veins, and
the vertebral venous system (Robinson, 19 49 ).

17
One of the causes of pressure change in CSF is a
pressure change in the vertebral venous system. The
vertebral venous system has partially collapsed elastic
vessels that allow substantial volume increases without a
pressure increase. There is an inverse relationship
between vertebral venous system blood volume and CSF volume
in the subarachnoid space. This explains the decreased
requirement for local anesthetic in the subarachnoid space
of both obese and pregnant patients (Barclay et al., 1968).
Decreased CSF volume might cause a greater spread of
local anesthetic when placed in the subarachnoid space.
This phenomenon was demonstrated by the use of an abdominal
binder to cause abdominal compression and thereby, a
decrease in the siz e of the subarachnoid space. Barclay et
ale (1968), demonstrated that increased pressure from the
binder caused increased spread of local anesthetic placed
In the subarachnoid space.
There are obese patients that hypoventilate due to the
large amounts of abdominal fat that restrict breathing
efforts. These patients demonstrate hypercapnia and
hypoxia. The hypoxic patients are slightly acidotic and
have a lower physiologic pH. At the same time, an increase
in cardiac output and alveolar ventilation is needed to
provide for the increased metabolic needs of obese
patients, resulting in an increase in both oxygen
consumption and carbon dioxide (C02) production. It is
difficult for the respiratory system to meet this increased

18
metabolic demand because of the excess fat. The increased
chest wall and abdominal adipose tissue produce a decrease
in chest wall compliance that in turn reduces lung volume.
There is a decrease in functional residual capacity (PRe)
and the increase in closing volume of the lungs causes
perfusion to non-ventilated portions of the lungs. All of
these changes result in arterial hypoxemia in obese
patients (Vaughn, 1982).
Since the pKa of bupivacaine is 8.1, it is considered
a weak base. Weak bases are more ionized in an acidic
solution, as may be the case of the blood in obese
patients.
the base.
Decreasing the pH increases the ionization of
In obese patient, there may be more of the
ioni zed than the un-ionized form of bupivacaine in the
bloodstream. These patients will have less drug available
to cross the cell membrane and hence, bupivacaine will have
a slower onset of action.
Bupivacaine clearance is dependent on hepatic blood
f low. Obese patients have a decreased hepatic blood flow
due to changes, such as cirrhosis and fatty infiltration
(Widman, 1975). Bupivacaine clearance may be prolonged in
the obese patient.
Drug distributional changes alter bupivacaine
elimination despite a lack of change in metabolic clearance
(Abernethy, Greenblatt, Divoll, Harmatz , & Shader, 1 981).
The extent of drug distribution into excess body fat is
related to the solubility characteristics of the drug.

19
Abern ethy et al., discovered that antipyrine, a low lipid
soluble drug, was distributed into excess body fat in small
amounts. However, diaz epam, a highly lipophylic compound,
distributes disproportionately into excess body fat.
Diazepam would have a slower clearing capacity due to its
distribution into excess body fat. The relationship of
this concept to bupivacaine in an obese patient is worth
consideration. Bupivacaine is a highly lipid soluble drug
(it has a lipid solubility partition coefficient of 28).
Excess extradural fat, as in the obese patient, is readily
available for bupivacaine distribution after SAB. This
results in prolonged absorption into the bloodstream and
prolonged clearance from the body.
Summary. It can be concluded from the above
discussion that bupivacaine leaves the CSF and enters the
blood stream via a concentration gradient. If the
elimination half-life of bupivacaine is prolonged in the
obese patient due to in creased distribution into fat, there
will be less of a concentration gradient of bupivacaine
between CSF and blood. Bupivacaine will remain in the CSF
for a longer period of time. I f this theory is true, the
spinal nerve roots in obese patients will be exposed to
bupivacaine for a prolonged time period resulting in a
prolonged sensory block. Also, obese patients have a
decreased CSF volume; therefore, the spinal nerve roots are
exposed to an anesthetic solution with less dilution which

will have a greater cephalad spread. This will lead to a
prolonged sensory regression time from a bupivacaine SAB.
20

Chapter Two
Review of Literature
Bupivacaine Clearance in Obese Patients
Abernethy and Greenblatt (1984) studied lipophilic
drugs, such as bupivacaine. The population consisted of 56
men and women. Thirty-one of the patients were normal body
weight, and 25 were obese. They were all healthy adults
who were not taking medications. None of the patients had
congestive heart failure or renal failure, and they all had
normal liver function.
These lipophilic drugs were shown to have marked
increases in volume of distribution (Vd) and minimal change
in clearance resulting in a prolonged elimination half-life
and a prolonged time to reach steady-state plasma drug
concentrations. The prolongation of the elimination
h alf-life in obesity was due to the marked increase in the
Vd with no significant difference in rate of drug
clearance.
Obese patients have decreased hepatic blood flow due
to changes, such as cirr hosis or fatty infiltration of the
liver. Since hepatic blood flow is decreased in obese
21

22
patients, local anesthetic clearance will also be decreased
(Abernethy & Greenblatt, 1984). It is expected that the
obese group will have a prolonged sensory regression time
when compared to the non-obese group.
Effect of Body Mass on the Spread of Spinal Anesthesia
Pitkanen (1987) performed a study to determine if
there was a relationship between weight, -height, and the
spread of spinal anesthesia. The population consisted of
90 orthopedic patients, ASA I or I I, having surgery on
their lower extremities. The first 50 patients were
anesthetiz ed by SAB using 3 ml of 0. 75% isobaric
bupivacaine. The remaining 4 0 patients were randomly
selected to receive 3 ml of hyperbaric or isobaric 0. 75%
bupivacaine. The patients were divided into two groups.
One group consisted of patients with a normal body mass
index (BM I), defined as 20.2 to 24 .6 for females and 21.1
to 25.9 for males. The other group consisted of patients
with a BM I greater than 3 0. All patients were placed in
the lateral position for the SAB, and a lumbar puncture was
performed at the L3-4 interspace. Three milliliters of
0.5% bupivacaine were injected and the patients were placed
in the supine posicion. Responses to pin-prick sensation
and motor blockade were recorded every 1 0 minutes for the
first hour after injection.
Body mass index and sensory level of analgesia are of
interest to this study. The subarachnoid space is

2 3
significantly different in the obese versus the non-obese
patient. An individual with a high body mass index should
have a higher sensory block when equivalent doses and
volumes of anesthetics are injected into the subarachnoid
space as compared to non-obese patients. Pitkanen's (1987)
conclusions are consistent and support this theory.
There is a lack of clarity in the methodology making
this study impossible to repeat based solely on the
information presented ln the article. It is particularly
unclear why the author selected 50 patients to receive a
hyperbaric s olution and 4 0 patients to receive a hype rbaric
or isobaric solution. It is also unclear as to the method
used to select the 4 0 patients receiving the hyperbaric or
isobaric solution of bupivacaine and how the patients were
divided into obese and non-obese groups.
The Effect of pH on Anesthetiz ed Nerves
Ritchie (1975) demonstrated that the pH of the
solution surrounding the anestheti zed nerve was crucial to
the effect of the neural blockade. Non-myelinated fibers
of a nerve were bathed in a long-acting local anesthetic
until blockade had occurred. The anesthetic solution was
then removed. No recovery of conduction occurred as long
as the nerve was maintained in a neutral bathing solution.
However, when the pH of the bathing solution was increased,
conduction was restored. When the nerve was returned to a
neutral bathing solution, conduction block again occurred.
24
Conduction could be restored and abolished repeatedly by
switching the nerve between the alkaline and neutral
bathing solutions. The conclusion was that the uncharged
form was relatively inactive whereas; the charged form
produced local anesthesia.
The obese patient might have a lower pH CSF when
compared to the non-obese patient. This would result in
more local anesthetic in the charged and .active form when
compared to the non-obese patient. It would be predictable
that for this reason the obese patient would have a longer
sensory regression time than the non-obese patient.
Ritchie's (1975) study was very clear in the
methodology and would be easy to repeat. It supported the
theory that the pH of the environment into which the local
anesthetic was injected was crucial to the sensory
blockade. It also supported the theory that it was the
charged form of the local anesthetic that was active in
blocking nerve conduction.
Effects of Volume of Spinal Anesthetic in the Subarachnoid
Space
Sundnes, Vaagnes, Skretting, Lind, and Edstrom (1982)
showed that the duration of analgesia increased with larger
volumes of hyperbaric bupivacaine. All of the patients
were undergoing urological surgery and were randomly
assigned to receive 0.5% bupivacaine 1.5 ml, 2.0 mI, or 3.0
ml in 8.0% glucose. The results of this study showed that
25
the maximum spread and duration of analgesia increased with
volume.
The authors did not report the relationship of dose to
volume of 0.5% bupivacaine. It was conceivable that the
dose of bupivacaine could have been equal in each case with
the diluent added to increase the volume or CSF aspirated
from the subarachnoid space immediately prior to injection
to increase the volume required for their. study. I f this
is indeed the case, their results were consistent with
Norris' (1988) findings that maximum spread and duration of
analgesia increases with increased volume of anesthetic in
the subarachnoid space.
Inferior Vena Cava Compression
Barclay et ale (1968) , demonstrated that venous
compression affects the amount of CSF in the subarachnoid
space. The purpose of this study was to demonstrate that
compression of the inferior vena cava by an abdominal
binder or by a pregnant uterus resulted in vertebral venous
system engorgement that then decreased the si z e of the
subarachnoid space and thus, the amount of CSF. Therefore,
less anesthetic agent would be necessary to induce spinal
anesthesia. The sample consisted of three groups. Group
one consisted of 20 nonpregnant control patients of
childbearing age who received a spinal anesthetic prior to
hysterectomy or other gynecological surgery. Group two
consisted of 15 pregnant patients at term who received a

26
spinal anesthetic prior to cesarean section or delivery in
the late stages of labor. Group three was an experimental
group of 15 patients of childbearing age whose inferior
vena cava pressure was artificially increased to
approximately 250 mm of water, and who then received a
spinal anesthetic for a gynecological operation.
The patients in group three had a femoral catheter
inserted into the inferior vena cava and-connected to a
transducer to monitor pressures in the vessel. Prior to
the injection of an anesthetic agent, the abdomen was
compressed with an inflatable rubber bladder until the
inferior vena cava pressure was 250 mm of water. Each
patient was placed in the lateral Sims position and a
lumbar puncture was performed at the L3-4 interspace with a
19-9auge spinal needle. The projecting shaft of the needle
was bent parallel to the patient's back as the patient
shifted into the supine position. Four milligrams of
tetracaine (1.0 ml of a hyperbaric solution) was injected
as a test dose. The level of analgesia was assessed by
checking for the loss of sensation to pin-prick and was
recorded according to a standard dermatome chart.
The results were as follows: Group one, all of the
levels of anesthesia fell below the umbilicus except for
two patients; Group two, all the levels were above the
umbilicus, with two being higher than T7; Group three, all
the levels were higher than the umbilicus, with two being
at T5. The mean level in group one was TIl; in group two
27
it was T8; and in group three it was T7. The authors
concluded there was a reciprocal relationship between
venous blood volume and CSF volume that caused a decrease
in CSF volume in the subarachnoid space after compression
of the inferior vena cava by a pregnant uterus or an
abdominal binder.
A decreased amount of CSF volume indicated there is
less dilution of the local anesthetic af�er it is injected
into the subarachnoid space. This results in a larger
amount of local anesthetic being available to bathe the
spinal nerve roots. The decreased CSF volume also results
in a more cephalad spread of the local anesthetic. This
may explain why pregnant patients during the last half of
gestation and obese patients require less anesthetic agent
for spinal analgesia.
Influence of Obesity on Spinal Analgesia
McCulloch and Littlewood (1986) performed a study on
the influence of obesity on spinal analgesia with isobaric
0.5% bupivacaine. In this study, the height of the block
in relation to obesity was the main focus. They gave 50
patients, aged 51 to 89 years, 4 ml of 0.5% bupivacaine and
correlated the height of blockade and the degree of
obesity. The authors concluded that increased obesity
resulted in higher levels of sensory blockade. McCulloch
and Littlewood speculated on the reasons for this higher
sensory blockade, such as, increased vertebral blood flow,

fat deposits, and compression from abdominal fat, all
impinging on the subarachnoid space.
28
Additional useful information could have been added to
this study by correlating obesity with sensory regression
time. This added information would have strengthened these
authors' conclusions. In addition, there have been no
studies published to date that correlate obesity with
sensory regression time from subarachnoid.block with
isobaric or hyperbaric bupivacaine.

Chapter Three
Methodololgy
Research Design
A quasi-experimental design was used �o determine if
obesity affects the regression time from a SASe The
patients were separated into two groups; one group was
classified as obese and the other group as non-obese. The
demographic data consisted of age, height, weight, and sex.
All patients had the same surgical procedure, a postpartum
bilateral tubal ligation. The sensory levels were recorded
in the operating room using a standard dermatome chart (see
Appendix C) until the highest level was achieved. This
sensory level was then recorded on the data collection
form. The sensory levels were also recorded on the data
collection record immediately upon arrival in the recovery
room and continued until sensation was restored at the tip
of the 2nd and 3rd toes bilaterally.
Population, Sample, and Setting
The population consisted of inpatients at a
mid-Atlantic, university, teaching hospital. The sample
consisted of female patients presenting for postpartum
29

tubal ligations. They were all ASA I-I I classifications,
without major obstetrical or medical problems. A
convenience sample was selected from the operating room
schedule. All the procedures were performed In an
operating room of an obstetrical unit.
Data Collection
30
The patients were interviewed immediately prior to the
procedure. All the patients were weighed, had an
intravenous line started, and were preloaded with 2 liters
of lactated Ringer's solution. While in the sitting
position a 25-gauge spinal needle was used to perform a
subarachnoid puncture either at L2-3, L3-4, or L4 -5 spinal
interspace. An appropriate dose, based on the pa tient's
height and weight, of 10 to 15 mg of 0.75% bupivacaine in
8.4 % dextrose was then injected. Patients were immediately
placed in the Trendelenberg position. The dose of
bupivacaine, the time of injection, and the highest level
of sensory blockade were recorded. When the surgery was
completed the patients were transferred to the recovery
room. Levels of sensory blockade were checked every 10
minutes until recovery from the SAB was achieved at the tip
of the patient's 2nd and 3rd toes bilaterally. Total
sensory regression time was calculated from the time of
injection until the previously described sensory recovery
was achieved.
31
The patient's age, weight, height, sex, and surgical
procedure were recorded on the data collection form. The
time and level of sensory blockade was checked using
pin-prick from an IS-gauge needle bilaterally until sensory
recovery was achieved. The Dermatome Chart from Cousin's
(19S0) textbook, Neural Blockade, was used to record the
actual level at which loss and recovery of sensation was
noted (see Appendix C).
Instrumentation
Reliability and validity of tool. Each spinal nerve
provides innervation to a segmental field or portion of the
skin called a dermatome. By pin-pricking the dermatome
areas on the patient who has received a SAB, one can assess
whether or not the patient has sensation in that particular
area of the skin. Lack of sensation indicates the spinal
nerve innervating that area was "blocked" by the injection
of the local anesthetic into the subarachnoid space.
The Dermatome Chart's (see Appendix C) validity has
been determined throughout the years by its daily use in
the clinical setting. A Dermatome Chart can be found in
any basic anatomy book. Dermatome Charts are printed as
posters, papers, and on clipboards for use clinically.
Therefore, it is reasonable to conclude that the Dermatome
Chart is a valid, reliable, and commonly used tool for
assessment of sensory levels.
Consent
Approval for this study was obtained from the
Committee for the Conduct of Human Research (CCH R). Each
patient received a verbal explanation about the study and
was requested to sign a form of written consent (see
Appendix A).
Analysis
32
A regression analysis was used to build an analytical
model. This model explained the relationship between the
dependent and independent variables. A Q value less than
.05 was required for significance.

Chapter Four
Results
The sample consisted of 20 female patients divided
into two groups (see Table 1). Ten patients were obese,
weighing 137 to 203 pounds, age 22 to 37 years old, and
height from 59 to 67 inches. Ten patients were non-obese,
weighing 125 to 179 pounds, age 19 to 31 years old, and
height from 61 to 68 inches. All 20 patients received the
same operative procedure, a postpartum bilateral tubal
ligation (BTL). The variables recorded were: (a) time
from subarachnoid injection to sensory recovery (the
dependent variable), (b) age, (c) weight, (d) height, and
(e) dose (the independent variables).
The mean dose of hyperbaric 0.75% bupivacaine for the
combined group was 12.25 mg with the mean dose for obese
group 12.30 mg, and the mean dose for the non-obese group,
12.20 mg. The mean weight for the combined groups was 154
pounds with the mean for the obese group 178 pounds, and
the mean for the non-obese group 130 pounds. Patient
weight in each group was measured. The maximum and minimum
33

34
Table 1
Means, Standard Deviations, Minimum Values, and Maximum
Values, for Age, Weight, Height, Dose, and Regression Time
Variable
Time Weight Dose Height Age
Variable
Time Weight Dose Height Age
variable
Time Weight Dose Height Age
N
20 20 20 20 20
n
10 10 10 10 10
n
10 10 10 10 10
All
Mean
155.20 154.35
12.25 63.85 26.20
Mean
157.4 0 178.20
12.20 64 .00 27.50
Groups Combined
SD
16.4 4 28.00
1.20 2.2 3 3.83
Obese Group
SD
18.77 18.04
1.39 2.35 3.68
Non-obese Group
Mean
152.80 130.50
12.30 63.70 24 .90
SD
14 .36 8.08 1.05 2.21 3.78
Min
125 - 118
10 59 19
Min
137 14 2
10 59 22
Min
125 118
11 61 19
Max
195 203
15 68 33
Max
195 203
15 67 3 3
Max
179 14 5
15 68 31
Note. Number of patients (n), Minimum Value (Min), Maxi mum
Value ( Max), Age (years), Weight (pounds), Height (inches),
Time (minutes), Dose (milligrams).

35
weights in the obese group were 203 and 14 2 pounds, and in
the non-obese group 179 and 125 pounds. The time for
sensory regression was also measured. The maximum and
minimum time in the obese group was 195 minutes and 1 37
minutes, and in the non-obese group 179 minutes and 1 25
minutes. The mean sensory regression time for the obese
group was 157.4 minutes, and for the non-obese group was
152.8 minutes. There we re no significant - va riables at a £
.05 level.
All va riables in this study we re t reated as
continuous. Regression an alysis was used to build a model
t ll a t explained the relationship between time and the other
vari ables. A stepwise model building procedure was used to
determine which of the independent variables were important
in predicting senso ry regression time. Each vari able in
the regression model had a level of significance
calculated. Dose had the most significant £-value of the
vari ables included in the model (£ = .15). Weight,
however, was the va ri able of inte rest for this study. The
following model was tested :
Y = BO + (Bl) (Xl) + (B2) (X2)
Legend: Y = Time, Xl = Weight, X2 = Dose, BO = Ave rage of
Time, Bl = change in Y fo r a unit change in Xl, B2 = change
in Y for a unit change in X2
The coefficients of each selected independent va ri able
were calculated. The value for BO was 79. 091 ; the value
for Bl was .094 ; the value for B2 was 5.026. An R-square

36
value was calculated to determine the amount of variability
in time that can be explained by the above mode. An
R-square value of .16 78 was found. The hypothesis that 80
= 81 = 82 = 0 was tested. The E value of .2099 was found.
The following figures show sensory regression time
from SAB and weight (see Figure 1), age (see Figure 2) ,
height (see Figure 3) , and dose of bupivacaine (see Figure
4) •

(J) Q) � � c: .,.-1 �
TIME 200
*
1 90
*
1 80 +
1 70
+
160 * + *
+ + * +
150 + + *
*
140 * +
*
130 �
120l ,
+
-i
1 10 120 1 30 1�0 150 1 60 1 70 1 80 190 200
Weight l n Pounds
+ - NOFVoU.L .. - OBESE
Figure 1. Time for Sensory Regression from SAB versus
Weight of Patients .
Note. Time (minutes for sensory regression from SAB).
Weight (pounds).
37
*
2 1 0

3 8
TIME 2°° 1 *
190 1 *
.• o } I
CJ) 170 l
Q) � + +J 160 � * c: * +
.,-i + + * :z:: +
150 * + + * *
140 * +
*
'� 1 120
+
I 19 20 2 1 22 23 24 26 27 28 29 30 3 1 32
Age in Years
+ - NORMAL M - OBESE
Figure 2. Time for Sensory Regression for SAB versus Age
of Patients.
Note. Time (minutes for sensory regression from SAB). Age
(years) .
39
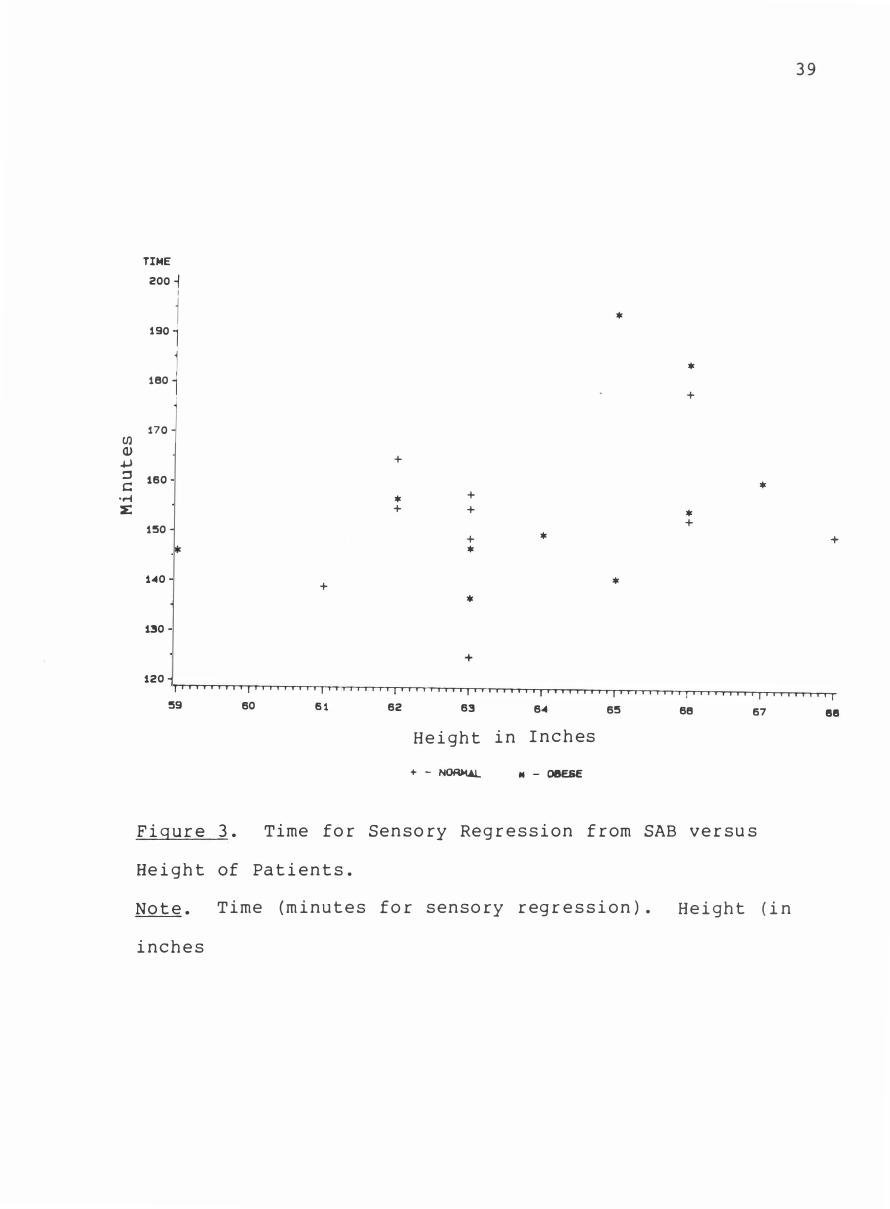
TIME 200 1
I
i * 190 1
'80 1 *
+
170 Ul (l) � + :s 160 c: *
..... * + � + + *
+ 150 + * + *
140 + * *
130
+
120
59 60 6 1 62 63 64 65 68 67 88
Height in Inches
+ - NORMAL N - 08ESE
Figure 3. Time for Sensory Regression from SAB versus
Height of Patients.
Note. Time (minutes for sensory regression). Height ( in
inches

4 0
TIME 200 1
J * I
190 j I � * I
I 180 '1
+
.70 j en Q) I
� � + ::l * c: '� t • ...-1 + *
� + + +
1!50 =*= *
. . 0 1 * *
* + *
130
+
120
10 1 1 12 13 1 4 1!5
Drug dose in Milligrams
+ - N()Rt(AL N - OBESE
Figure 4 . Time for Sensory Regression from S AS versus Dose
of Bupivacaine.
Note. Time (minutes for sensory regression). Dose
(milligrams of bupivacaine in 8.4 % dextrose)

Chapter Five
Discussion
It is not possible to single out all of the factors
that may effect sensory regression time in obese patients.
It is likely that a combination of factors are involved,
such as, decreased amount of C SF in the subarachnoid space,
decreased pH due to some degree of hypoventilation that may
result in slower speed of absorption of local anesthetic,
and increased volume of blood f lowing through the vertebral
veins and around the subarachnoid space. In addition, the
magnitude of these changes may be weight dependent.
Using a convenience sample from the operating room
schedule, the patients may not have been obese enough to
have a significant di fference in sensory regression time
when compared to the non-obese patients. Indeed, the
di fference in the mean weight between the obese and
non-obese groups is 48 pounds.
Patients receiving larger doses of bupivacaine, such
as 15 mg, had signif icantly longer sensory regression
times. This finding was consistent with Greene ' s ( 1 9 85)
study. Statistical analysis revealed no difference in mean
41

4 2
reg ression time when height and age we re studied. This was
not consistent with the results of G reene ' s (1 985) and
No r ris ' (1 988) studies. G reene reported that inc reasing
age resulted in increased time fo r sensory reg ression from
SAB. This inconsistency between Greene ' s results and the
results in this study could be explained. G reene ' s study
compa red patients that we re aged 60 or o1ger to a younge r
population that resulted in a la rge age diffe rence between
the g roups. In this study, all the patients we re
relatively young, less than 34 yea rs of age, with a mean
diffe rence between the obese and non-obese g roups of only
2.4 years. It could also be postulated that the failu re to
show a significant diffe rence in regression time when
analyzing the height of the patients was due to the small
diffe rence, 8 i n ches, between the tallest and shortest
patient.
Difficulties with Study
It was necessa ry, due to occasional conflicting
clinical and class obligations, for othe r in dividuals to
assist in data collection. Du ring those occasions, the
recove ry room nu rses, after inst ruction, assisted by
pe rfo rming the senso ry level physical assessments.
The mean diffe rence in weight between the obese and
non-obese g roups was 4 8 pounds. The re we re seve ral
patients close to the limits of the weight range. In these
cases just a few pounds more or less would have put an
obese patient in the non-obese group and vice versa.
4 3
Postpartum bilateral tubal ligations were elective
procedures. On several occasions, a patient scheduled for
a BTL would be delayed due to other more urgent procedures,
such as a cesarean section. During the delay, the patient
frequently changed her mind about proceeding with the BTL.
Conclusion
There were no variab les at the Q < . 05 level. An
R-square value of .17 was found, meaning there is a only
small positi ve relationship between sensory regression time
and patient weight and dose. The hypothesis, there will be
no difference in sensory regression time from SAB with
hyperbaric 0.75% bupivacaine, between obese and non-obese
patients, failed to be rejected.
Sug gestions for Future Research
The small weight difference between the obese group and
the non-obese group and the small sample si ze may be
responsible for the lack of di fference in sensory
regression time from SAB. Repeating this study with an
increased sample siz e and patients selected according to a
defined weight range, such as morbidly obese, may res ult in
a more signi ficant di fference in sensory regression times.
It will be easy to include, in a repeat study, a test of
the pH of the CS F of all the patients to determine if a

4 4
correlation exists between pH and sensory regression time.
Another factor that may have an influence on sensory
regression time is gender. This study can be repeated with
male patients having a different surgical procedure, such
as inguinal hernia repair, to see if there is a difference
in sensory regression time between obese and non-obese male
patients. Several other factors that may influence
regression time, such as age, type of surgical procedure,
height o f t he patient, and height of sensory block achieved
can also be studied. Although it is unlikely one f a c tor
can be considered the cause of regression time differences,
the results of these stud i es will have clinical
application.

References
4 5

References
Abernethy, D. R. , Greenblatt, D. J. (1984). Lidocaine disposition in obesity. The Ame rica n Journal of Cardiology, 53, 1183-1186.
4 6
Abernethy, D. , Greenblatt, D. , Divoll, M. , Harmatz , J. , & Shader, R. (1981). Alterations in drug distribution and clearance due to obesity. The Journal of Pharmacology and Experimental Therapeutics, 217, 681-685.
Barclay, D. L. , Renegar, O. J. , & Nelson, E. W. (1968). The influence of inferior vena cava compression on the level of spinal anesthesia. American Journal of Obstetrics and Gynecology, 101, 792-800.
Boyes, R. N. ( 1975). A review of the metabolism of amide local anaesthetic agents. British Journal of Anaesthesia, 4 7, 225-23 0.
Bridenbaugh, P. O. , & Kennedy, W. F. (1980). Spinal, subarachnoid neural blockade. In M. J. Cousins & P. o . Bridenbaugh ( Eds. ) , Neural blockade ( pp. 14 6-175). Philadelphia : J. B. Lippincott Company.
Green, J. (1979). Blood levels of local anesthetics during spinal and epidural anesthesia. Anesthesia and Analgesia, 58, 3 60-3 6 3 .
Greene, N. (1985). Distribution of local anesthetic solutions within the subarachnoid space. Anesthesia and Analgesia, 64, 715-73 0.
Howarth, F. (194 9). Studies with a radioactive spinal anaesthetic. British Journal of Pharmacology, A , 3 3 3 - 3 4 7.
Lee, A. (1979). A consumer ' s guide to models of local anesthetic action. Anesthesiology, 51, 64 -71.
Metropolitan Li fe Insurance Company. weights for men/desirable weights Actuaries and Association of Life Directors of America.
(1980). Desirable for women. Society of Insurance Medical
McCulloch, W. J. D. , & Littlewood, D. G. (1986). Influence of obesity on spinal analgesia with isobaric 0.5% bupivacaine. British Journal of Anaesthesia, 58, 610-614 .

Norris, M. C. (1988). Height, weight, and the spread of subarachnoid hyperbaric bupivacaine in the term parturient. Anesthesia and Analgesia, 67, 555-558.
Pitkanen, J. T. (1987). Body mass and spread of spinal anesthesia with bupivacaine. Anesthesia and Analgesia, .§.Q, 127-131.
Robinson, L. S. (194 9). The collateral circulation following ligation of the inferior vena cava. Surgery, 25, 329- 34 5.
Ritchie, J. M. (1975). Mechanism of action of local anaesthetic agents and biotoxins. British Journal of Anaesthesia, 4 7, 191-198.
4 7
Ritchie, J. M., & Green, N. (1985). Local Anesthetics. In A. Gilman, L. Goodman, T. RaIl, & F. Murad, (Eds.), The pharmacological basis of therapeutics. (7th ed.). (pp. 302- 321). New York: Macmillan Publishing Company.
Rocco, A., Raymond, S., Murray, E., Dhingra, V., &
Freiberger, D. (1985). Differential spread of blockade of touch, cold, and pin-prick during spinal anesthesia. Anesthesia and Analgesia, 64, 917-923.
Savarese, J. J., & Covino, B. G. (1986). Basic and clinical pharmacology of local anesthetic drugs. In R.D. Mill e r ( Ed. ), An est h e s i a ( 2 n d e d. ). ( p p . 1 0 0 2). New York: Churchill Livingstone.
Smith, T. C. (1968). The lumbar spine and subarachnoid block. Anesthesiology, 29, 60-64 .
Strichartz , G. R. (1973). The inhibition of sodium currents in myelinated nerve by quarternary derivatives of lidocaine. Journal of General Physiology, 62, 37-57.
Sundnes K. 0 . , Vaagnes P., Edstrom, H. H. (1982). bupivacaine: effects of Journal of Anaesthesia,
Skretting, P., Lind, B., &
Spinal analgesia with hyperbaric volume of solution. British 1.A, 69-73.
vaughan, R. W. (1982). Pulmonary and cardiovascular derangements in the obese patient. In B. R. Brown, Jr. (Ed.), Anesthesia and the obese patient ( pp. 19- 39).
Philadelphia: F.A. Davis Company.
Veering, B. T., Burm, A. G. L., & Spierdijk, J. (1988). Spinal anaesthesia with hyperbaric bupivaca ine. British
Journal of Ana esthesia, 60, 187- 194.

Wood, J. (19 82). Local anesthetic agents. In M. Wood &
A. J. J. Wood (Eds.), Drugs and anesthesi a (pp. 341-371). Baltimore: W i lli ams and W i lkins.
4 8
Widman, B . (1975) . Plasma concentration of local anaesthetic age nts in regard to absorption, distri bution and elim i nation, w i th special reference to bupi vacaine. Brit i sh Journal of Anaesthesia, 47, 231-236 .

Append i x A
4 9

1. Introduction
Appendix A
CONS ENT FO RM
George Hilton, RRNA I I
Department of Nurse Anesthesia
MCV office phone 6-9 808
Home phone
I am investigating the duration of the spinal
anesthetic bupivacaine. You have been selected as a
candidate to participate in this study because spinal
anesthesia is appropriate for your surgical procedure.
2. Benefits
50
Bupivacaine is a long acting spinal anesthetic . It
has a duration of 2.5 to 4 hours with lingering pain
suppression for many more hours. Your participatio n in
this study will h elp document the duration of a bupivacaine
spinal anesthetic. That information may then be used to
predict more precisely the duration of this anesthetic.
3. Alternative Therapy
You have been selected as a candidate for this study
because spinal anesthetic has been determin ed to be the
most appropriate form of anesthetic for your ca se. I f you
do not want spinal anesthetic, there are other forms of

anesthesia, such as general anes thesia and epidural
anesthesia that I can discuss wit h you.
4. Risks, I nconveniences, Discomforts
The risks associated with this study are the same
risks associat ed with spinal anesthesia. One of t hose
risks is the risk of neurologic problems from damage t o a
nerve. The risk of this complica tion is one in 1 0, 000.
There is also a risk that you may have a headache that is
caused by the spinal anesthesia procedure. There are
remedies available that are 9 9% effective for this risk .
51
Assessment of the level of anesthesia is a current
practice in the recovery area. For this study we will
assess the level of anesthesia every 1 0 t o 20 minutes un til
you have completely recovered. It is necessary to
regularly assess the level of spinal anesthesia during your
recovery. There will be no addit ional inconvenience to you
as a result of participa ting in this s tudy.
5 . Cost of Participation
There is n o cost t o you above the normal fee for
spinal anes thesia .
6. Pregnancy
Spinal anes thesia has a recogni zed use during labor
and delivery. In ad dition, bupivacaine SAB has no known
adverse effect s on your baby .
7 . Research Relat ed I nj ury

There are no risks of injury associated with this
study other than those associated with spinal anesthesia
discussed above.
8. Confidentiality of Records
52
The information that I obtain from you during this
study will remain confidential. I have taken steps to
assure that your name and hospitali zation number are not
associated with the data collection record. Therefore, no
future reference can be made to you as a result of this
study.
9. Withdrawal
If you have any questions regarding the study you are
encouraged to ask them now or at any time during the study.
In addition, you may withdraw from the study at anytime.
"You understand that in the event of any physical and/or
mental injury resulting from my participation in this
research project, Virginia Commonwealth University will not
offer compensation."
signed, ____________________ __ Witness ____________________ _
date ______________________ _ date ______________________ __

Appendix B
53
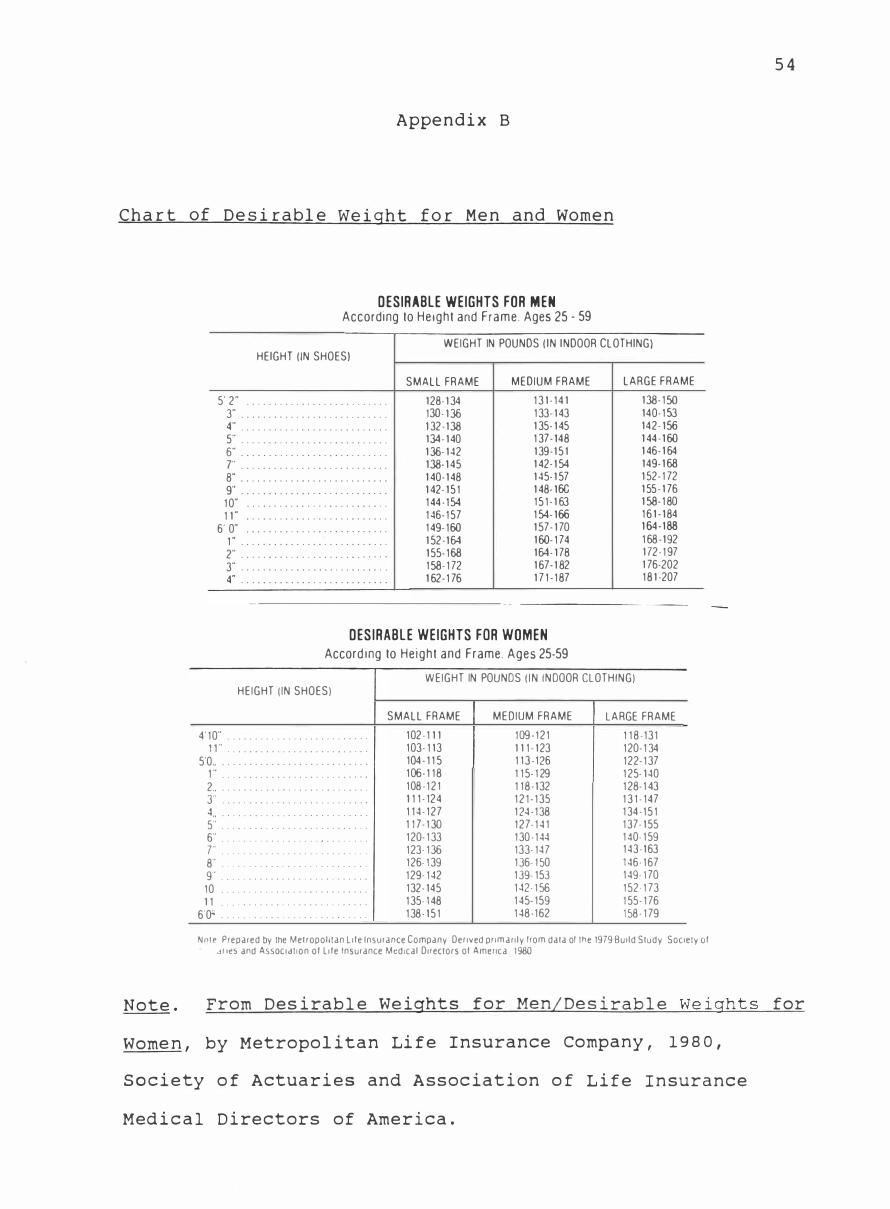
Appendix B
Chart of Desirable Weight for Men and Women
D ESIRABLE WEIGHTS FOR MEN Accord ing to He igh t and F rame . Ages 25 - 59
WEIGHT IN POUNDS ( I N I NDOOR CLOTHING) HEIGHT ( IN SHOES)
5' 2" . . . . . . . . . . . . . . . . . . . . . . . . . .
3" . . . . . _ . . . . . . . . . . . . . . . . . . . . .
4"
5" . . . . . . . . . . . . . . . . . . . . . . . . . . .
• • • • • • • • • • • • • " 0 • • • • • • • • • • •
6" . . . . . . . . . . . . . . . . . . . , . . . . . . .
7" . . . . . . . . . . . . . . . . . . . . . . . . . . .
8" . . . . . . . . . . . . . . . . . . . . . . . . . . .
9"
1 0"
1 1 "
6' 0"
I " 2"
3"
4"
• • • • • • • • • • • • 0 • • • • • • • • • • • • • •
• • • • • • • • • • • _ . , _ • • • • • 0 • • • • •
• • • • • • • • • • • • • • 0 • • 0 • • 0 _ • • • •
0 • • • • • • • • • • • • • 0 • • • • • • • • • • •
• • • • • • • • • • • • • • • 0 • • • • • 0 • • • • •
. . . . . . . . . . . . . . . . . . . . . . - . . . .
• • • • • • • • • • • • • • • • • • • _ • • • • 0 • •
• • • • • • • • • • • 0 • • • • • • • • • • • • • • •
SMALL FRAME
1 28- 1 34
130- 1 36
1 32 - 1 38
1 34 - 1 40
1 36- 1 42
1 38- 1 45
1 40- 1 48
1 42- 1 5 1
1 44 - 1 54
1 46- 1 57
1 49- 1 60
1 52 - 1 64
1 55- 1 68
1 58- 1 72
1 62- 1 76
MEDIUM FRAME LARGE F R A M E
1 3 1 - 1 4 1 1 38- 1 50
1 33- 1 43 140- 1 53
1 35- 1 45 142- 1 56
1 37- 148 1 44 - 1 60
1 39- 1 5 1 1 46- 1 64
1 42- 1 54 1 49- 1 68
1 45- 1 57 1 52- 1 72
1 48- 16C 1 55 - 1 76
1 5 1 - 1 63 1 58- 1 80
1 54- 166 1 6 1 - 1 84
1 57- 1 70 1 64 - 1 88
1 60- 1 74 1 68 - 1 92
1 64 - 1 78 1 72 - 1 97
1 67- 1 82 1 76-202
1 7 1 - 1 87 1 8 1 -207
------- - --
DES IRABLE WEIGHTS FOR WOMEN Accord ing to He igh t and Frame. Ages 25-59
WEIGHT IN POUNDS ( I N IN DOOR CLOTHING) HE IGHT ( IN SHOES)
SMALL FRAME MED IUM FRAME LA RGE FRAME
4' 1 0" . . . . . . . . . . . . . . . . . . . . . . . . . . 1 02 - 1 1 1 1 09 - 1 2 1 1 1 8 - 1 3 1
I I " • • • • • • • • • • • • • • • • • • • • • • • • 0 •
5'0"
I " 2"
J' 4"
5"
6" 7" 8"
9"
1 0
1 1
6'0::
· .
· .
. . . . . . . . . . . . . . . . . . . . . . . . .
• • • • • • • • _ • • • • • • • • • • • • 0 "
. ' • • 0 • • 0 0 0 . e o • • • o . 0 0 0 . 0 • • • •
• • • • • 0 . 0 • • 0 • • 0 • • 0 0 . 0 0 • • • ' .
• • • 0 . 0 • • • • 0 . • • • • 0 0 • • • • • • • 0 •
· . • • • 0 • • • 0 . 0 • • 0 0 0 0 • • • • 0 • • • 0
0 • • 0 • • 0 . 0 . ' 0 • • 0 " 0 0 • • • • • •
· . • • • • • • • • 0 • • 0 • • 0 0 • • • • • ' • • •
· . . , • • • • • • • • 0 • • 0 · • • • • • • • • • •
. . . . , • • • • • • • 0 • • • • • 0 • • 0 • • • • •
• • 0 · • • • • ' 0 . , • • • • 0 • • • e o • • 0
. . . • ' • • 0 0 . , . . . . . . . . , .
0 . 0 · · · · · · · · · · · · · · · · · •
• • • • • 0
. . . . .
1 03- 1 1 3 1 1 1 - 1 23 1 20- 1 34
104 - 1 1 5 1 1 3 - 1 26 1 22- 1 37
1 06- 1 1 8 1 1 5- 1 29 1 25- 1 40
1 08 - 1 2 1 1 1 8 - 1 32 1 28- 1 43
1 1 1 - 124 1 2 1 - 1 35 1 3 1 - 1 47
1 1 4 - 1 27 1 24 - 1 38 1 34 - 1 5 1
1 1 7 - 1 30 1 27- 1 4 1 1 37- 1 55
1 20- 1 33 1 30 - 1 44 1 40- 1 59
1 23- 1 36 1 33- 147 1 43 - 1 63
1 26- 1 39 1 36- 1 50 1 46- 1 67
1 29- 1 42 1 39- 1 53 1 49- 1 70
1 32- 145 W- I 56 1 52 - 1 73
1 35- 1 48 1 45- 1 59 1 55- 1 76
1 38- 1 5 1 1 48 - 1 62 1 58 - 1 79
No te Prepared by the Met ropol i tan L i f e Insur ance Company Derived p r i m a r i l y f rom data of the t979 Bui ld Study Society o f ,lfIes and ASSOC i a t i o n o f L i f e tnsur ance Medical D i rectors of America t 980
54
N o t e . From D e s i rab l e We igh t s f o r Me n/De s i rab l e We ights for
Wome n , by Met ropo l i t a n Li f e I n surance Company , 1 9 8 0 ,
s o c i e ty o f Actua r i e s and A s s oc i a t i on o f L i f e I n s u r a n c e
Med i c a l D i re c t o r s o f Ame r i c a .

Appendix C
5 5

56
Appendix C
Dermatome Chart
Note. From Neural Blockade ( p. 262) by M. J. Cousins and
P. o . Bridenbaugh ( Eds.), 1980 , Philadelphia: J. B.
Lippincott Company.

Appendix D
57

58
Appendix D
Data Sheet
Age: Weight: Height: Sex:
Procedure:
Bupivacaine dosage:
I njection time of bupivacaine in Operating Room:
Highest sensory level achieved in operating room:
In recovery room sensory levels every 10 minutes:
Time: Level: · Time: Level: ,
Time: Level: · Time: Level: ,
Time: Level: · Time: Level: ,
Time: Level: · Time: Level: ,
Time: Level: · Time: Level: ,
Time: Level: · Time: Level: ,
Time: Level: · Time: Level: ,
Time: Level: · Time: Level: ,
Time: Level: · Time: Level: ,
Time: Level: · Time: Level: ,
Total time of sensory block:
Comments:

5 9
Vita