Sensors & Transducers · clinical concentration range compared with that in cow milk in a 3D energy...
12
Sensors & Transducers, Vol. 203, Issue 8, August 2016, pp. 57-68 57 Sensors & Transducers © 2016 by IFSA Publishing, S. L. http://www.sensorsportal.com Human Milk Shows Immunological Advantages over Organic Milk Samples for Infants in the Presence of Lipopolysaccharide (LPS) in 3D Energy Maps Using an Organic Nanobiomimetic Memristor/Memcapacitor 1 S-H. DUH, 2 J. THORNTON, 3 P. T. KISSINGER and *4 E. T. CHEN 1 University of Maryland Medical System, 22 South Greene St, Baltimore, MD 21201, USA 2 Bruker Nano, 19 Fortune Dr., Billerica, MA 01821, USA 3 Department of Chemistry, Purdue University, West Lafayette, IN 47906, USA 4 Advanced Biomimetic Sensors, Inc., 11140 Rockville Pike, Suite 440, Unit 422, Rockville, MD 20852, USA * E-mail: [email protected] Received: 24 June 2016 /Accepted: 30 July 2016 /Published: 31 August 2016 Abstract: Human milk is well known for its immunological advantages of protection and support for healthy early childhood cognitive development and prevention of chronic diseases over cow milk for infants. However, little is known about how the immunological advantages are linked to reduce Pathological High Frequency Oscillation (pHFO) regarding neural synapse net energy outcomes when lipopolysaccharide (LPS) attacks at a clinical concentration range compared with that in cow milk in a 3D energy map. We developed a nanostructure biomimetic memristor/memcapacitor device with a dual function of chronoamperometric (CA) sensing/voltage sensing for the direct quantitative evaluation of immunological advantages between human milk and organic cow milk for infants in the presence of wide LPS concentration ranges; those ranges were between 5.0 pg/mL to 500 ng/mL and from 50 ng/mL to 1 μg/mL for both a CA and a voltage method, respectively. The Detection of Limit (DOL) results are as follows: 3.73×10 -18 g LPS vs. 1.2×10 -16 g LPS in 40 μL milk samples using the 3.11×10 -7 cm 3 voltage sensor and the 0.031cm 2 CA sensor, respectively, under antibody-free and reagent-free conditions. The 3D energy map results show that cow milk is ten-times more prone to E. Coli attack, and the positive link was revealed that Pathological High Frequency Oscillation (pHFO) formations occurred over the studied LPS concentration range from 50 ng/mL up to 1000 ng/mL from Rapid Eye Movement (REM) sleep frequency, fast gamma frequency to Sharp Wave-Ripple Complexes (SPW- R) frequency. There had no pHFO with human milk samples at Slow Wave Sleeping (SWS), REM and SPW- R frequencies. The microbiota in the human milk samples successfully overcame the endotoxin attack from E. coli bacteria, however the pHFO only occurred at fast gamma frequency linked with the LPS level ≥500 ng/mL. Organic milk samples show an order of magnitude lower synapse energy density compared with human milk at SWS for with or without LPS, respectively. Copyright © 2016 IFSA Publishing, S. L. Keywords: Nanobiomimetic neuronal memristor/memcapacitor, Spatial-temporal orientation, 3D energy map, Pathological High Frequency Oscillation (pHFO), Slow Wave Sleeping (SWS), Rapid Eye Movement (REM) sleeping, Dual sensing. http://www.sensorsportal.com/HTML/DIGEST/P_2853.htm
Transcript of Sensors & Transducers · clinical concentration range compared with that in cow milk in a 3D energy...
Sensors & Transducers, Vol. 203, Issue 8, August 2016, pp. 57-68
57
Sensors & Transducers
© 2016 by IFSA Publishing, S. L. http://www.sensorsportal.com
Human Milk Shows Immunological Advantages over Organic Milk Samples for Infants in the Presence of Lipopolysaccharide (LPS) in 3D Energy Maps
Using an Organic Nanobiomimetic Memristor/Memcapacitor
1 S-H. DUH, 2 J. THORNTON, 3 P. T. KISSINGER and *4 E. T. CHEN
1 University of Maryland Medical System, 22 South Greene St, Baltimore, MD 21201, USA 2 Bruker Nano, 19 Fortune Dr., Billerica, MA 01821, USA
3 Department of Chemistry, Purdue University, West Lafayette, IN 47906, USA 4 Advanced Biomimetic Sensors, Inc., 11140 Rockville Pike, Suite 440, Unit 422,
Rockville, MD 20852, USA * E-mail: [email protected]
Received: 24 June 2016 /Accepted: 30 July 2016 /Published: 31 August 2016 Abstract: Human milk is well known for its immunological advantages of protection and support for healthy early childhood cognitive development and prevention of chronic diseases over cow milk for infants. However, little is known about how the immunological advantages are linked to reduce Pathological High Frequency Oscillation (pHFO) regarding neural synapse net energy outcomes when lipopolysaccharide (LPS) attacks at a clinical concentration range compared with that in cow milk in a 3D energy map. We developed a nanostructure biomimetic memristor/memcapacitor device with a dual function of chronoamperometric (CA) sensing/voltage sensing for the direct quantitative evaluation of immunological advantages between human milk and organic cow milk for infants in the presence of wide LPS concentration ranges; those ranges were between 5.0 pg/mL to 500 ng/mL and from 50 ng/mL to 1 µg/mL for both a CA and a voltage method, respectively. The Detection of Limit (DOL) results are as follows: 3.73×10⁻¹⁸ g LPS vs. 1.2×10⁻¹⁶ g LPS in 40 µL milk samples using the 3.11×10⁻⁷cm3 voltage sensor and the 0.031cm2 CA sensor, respectively, under antibody-free and reagent-free conditions. The 3D energy map results show that cow milk is ten-times more prone to E. Coli attack, and the positive link was revealed that Pathological High Frequency Oscillation (pHFO) formations occurred over the studied LPS concentration range from 50 ng/mL up to 1000 ng/mL from Rapid Eye Movement (REM) sleep frequency, fast gamma frequency to Sharp Wave-Ripple Complexes (SPW- R) frequency. There had no pHFO with human milk samples at Slow Wave Sleeping (SWS), REM and SPW- R frequencies. The microbiota in the human milk samples successfully overcame the endotoxin attack from E. coli bacteria, however the pHFO only occurred at fast gamma frequency linked with the LPS level ≥500 ng/mL. Organic milk samples show an order of magnitude lower synapse energy density compared with human milk at SWS for with or without LPS, respectively. Copyright © 2016 IFSA Publishing, S. L. Keywords: Nanobiomimetic neuronal memristor/memcapacitor, Spatial-temporal orientation, 3D energy map, Pathological High Frequency Oscillation (pHFO), Slow Wave Sleeping (SWS), Rapid Eye Movement (REM) sleeping, Dual sensing.
http://www.sensorsportal.com/HTML/DIGEST/P_2853.htm

Sensors & Transducers, Vol. 203, Issue 8, August 2016, pp. 57-68
58
1. Introduction
There have been strong recommendations for mothers to breastfeed newborns and infants across the United States and around the world for the purpose of better immunological protection, the promotion and support of healthy early childhood cognitive development, and the prevention of obesity and other chronic diseases in order to fulfill critical public health goals published by the U.S. Center for Disease Control (CDC) and the World Health Organization (WHO) [1-2]. WHO published a detailed summary document that describes the advantages of human milk for infants’ development. This document is a good guidance to mothers for obtaining knowledge in breastfeeding [3]. That human milk offers advantages over cow milk for babies’ brain development is a well accepted truth. However, we are still far from the CDC’s 2010 breastfeeding rate goal [2]. In publications on the topic of infant milk research, there are very few, if any, in-depth studies on the correlations between neural synapse energy output and milk quality comparing human breast milk and cow milk, in particular, analyzing the correlations between harmful Lipopolysaccharide (LPS) potentially exists in cow milk induced pathological high frequency oscillation (pHFO) and potentially more beneficial human milk induced good high frequency oscillation (HFO) in order to draw the attention of parents and support of health care professionals to impart and implement the CDC and WHO breastfeeding guidance.
Newborns sleep an average 16-18 hours per day, of which 50% of the time is spent in rapid eye movement sleep (REM), and 50% of time is in Slow-Wave Sleeping (SWS); sleep quality is dominated by SWS [4-5]. As the literature reported, REM usually takes place at greater than 10 Hz (α frequency) and SWS is between 0.1-3.5 Hz (δ frequency) [4-5].
A normal neural network circuitry constantly fires HFO (150-200 Hz) producing synchronization within the connection between the hippocampus and neocortex for the purpose of long term memory storage during SWS. Where pHFO (200-600 Hz) fires randomly, it leads to seizures and epilepsy [6-8]. The biggest problem in epilepsy research, as the Editor Noebels explained in the book, is that researchers are “not clear how abnormal synchrony is generated during pHFO. Clearly there is a need for additional studies that will differentiate normal from pathologic HFO in vitro and in vivo.” [6]. Our prior published works have advanced the first step by attempting to identify the difference between pHFO and HFO. We used a 3D mapping technology to detect a sub pM level β-amyloidal induced abnormal neural network circuitry based on nanostructure biomimetic memcapacitors that have an amperometric/voltage sensing functions [9-12].
Lipopolysaccharide (LPS) is a common endotoxin from E. coli bacteria, and is a major cause of infectious diseases in over 20 million people
worldwide. LPS is a major contaminant found in commercially available proteins, and it is also the major contaminate in biological ingredients in drugs and injectables. Even small amounts of endotoxin can cause side effects such as endotoxic shock, injury, and even death; therefore a strengthened standard of drug purity is needed. However, removing LPS from pharmaceutical products, for intravenous application to 5 endotoxin units (EU) per kg of body weight per hr, is a challenge to researchers who thought this standard was unachievable [13-14]. E. coli bacteria covers 75 % its outer layer membrane with gram-negative endotoxin LPS, and it stimulates the host’s immune response of cytokines [15-16]. Recently, researchers reported LPS penetrates the gut-immune-barrier (GIB) causing liver infection [17]; LPS leaking from the tight junction in the gut membrane into the blood stream causes many diseases, autism, obesity, diabetes, Alzheimer’s, chronic pain, and inflammation [18-22]. Furthermore, LPS can break the blood-milk barrier and pass into cow milk and may cause harm, as reported from collected samples which were compromised by LPS and may have caused mastitis [23]. A recently published paper reported human milk offers an advantage to correlate positively with gut microbiota and to maintain healthy oligosaccharide (HMO) isomers, which are specific to human milk and necessary in the newborn infant’s gut in the first week of life [24].
A paramount challenge was put on researchers and the pharmaceutical industry as a whole: to improve the LPS detection methods with a simplified procedure, more accurate and precision, and faster, more affordable options. Previously, a lack of sensitivity associated with the protein interference plus time consuming antibody and tracer assays hampered the ability to realize the unmet goals and fulfill these needs.
It is a well-accepted fact that breast-feeding offers more benefits over feeding cow milk for human babies’ growth in both nutritional content and immune defense [1-3, 25-27]. Our group’s prior published work, based on a nanostructure biomimetic memrister/memcapacior [28,] was able to directly measure sub pg LPS spiked in different types of milk under reagent-free conditions. In facing LPS challenge, we also demonstrated that human milk has energy outcomes at SWS an order of magnitude higher than cow milk [28]. Our goal for this project is to evaluate the immunological advantage of human milk vs. organic cow milk regarding the pHFO formation at LPS challenges. The intention is that the memcapacitor/memristor device is a sensor that represents, in concept, a baby’s single neuron which is able to “feel” and react to the energy gain or loss in the presence of LPS. Our focus will be to determine how the pHFO occurs with dosage changes of LPS and the frequency change from SWS to 200 Hz. Of course, we will also demonstrate the memristor/memcapacitor’s immunological capability in 3D contour mapping is based on a dual quantitative measurement of LPS in amperometric

Sensors & Transducers, Vol. 203, Issue 8, August 2016, pp. 57-68
59
/voltage method while showing the advantage of human milk over cow milk. This project is based on our prior experience in using the memristor/memcapacitor to mimic hippocampus-neocortex neuronal network circuitry [9-12, 28-32]. 2. Experimental
2.1. Fabrication of the Nanostructure Self-
Assembling Membrane (SAM) Gold Memristor/memcapacitor Chips
The nanostructure biomimetic SAM was freshly
prepared according to the published procedures based on cross linked conductive polymers of triacetyl-ß-cyclodextrin (TCD), polyethylene glycol diglycidyl ether (PEG), poly(4-vinylpyridine) (PVP) and ß-CD copolymer with the appropriate amount of propositions on a gold chip [31-32]. The chemicals were purchased from Sigma and went through purification procedures before use. A mixture of o-nitrophenyl acetate (o-NPA) in a molar ratio 1000:1 to the TCD mixture was incubated for 2 hrs at 35 °C; then the mixture was injected onto the gold surface and incubated for 48 hrs at 35°C. After that, we followed the clean procedures for completion of the SAM fabrication [31-32]. 2.2. Characterization of the Membrane
The morphology of the AU/SAM was characterized using an Atomic Force Microscope (AFM) (model Multimode 8 ScanAsyst, Bruker, PA). Data Collected in PeakForce Tapping Mode. Probes used were ScanAsyst-air probes (Bruker, PA). The silicon tips on silicon nitride cantilevers have 2-5 nm radius. The nominal spring constant 0.4N/m was used. Fig. 1 on the left illustrates 3D horizontal conformational structure of the memristor/ memcapacitor in the presence of an embedded o-NPA. Fig. 2 shows the 3D AFM image before the o-NPA was embedded on gold.
2.3. Frequency Affects on Memristor/ Memcapacitor’s Performance
Evaluations of frequency’s affect on memristor
performance were conducted by Cyclic Voltammetric method (CV) in pH 7.0 saline solution at room temperature from a scan rate of 1 Hz to 1 kHz without using any biological specimen. Data are to be used for comparison between fresh human milk and USDA certified organic milk for infants with or without the presence of LPS covering the same range of real-time synapse action/resting potential pulses at different frequencies against controls.
2.4. Assessing Energy Outcomes under Challenges of LPS
The Double Step Chronopotentiometry (DSCPO) method, as the voltage method, was used for assessing energy outcomes of slow-wave-sleeping (SWS) at 0.25 Hz and 200 Hz under the challenge of LPS at concentration ranges from 0, 50, 100, 500, to 1000 ng/mL of 4-5 levels with triplicates at ±10 nA, respectively. Samples were tested at each level without prior sample preparation, such as dilution or heating. The experiments were conducted at room temperature. The milk samples compared were human milk and USDA certified organic cow milk for infants, with and without LPS. Human milk was collected from a normal subject who breastfeeds a 1 month-old newborn (Lee Biosolutions Corp.). An electrochemical workstation was used (Epsilon, BASi, IN) with a software package from BASi. OriginPro 2016 (Origin Lab Corp., MA) was used for all statistical data analysis and figure plotting.
Fig. 1. 3D memcapacitor proposed conformational structure and electro-relay blocks in the presence
of o-NPA.
Fig. 2. 3D AFM image before adding o-NPA.

Sensors & Transducers, Vol. 203, Issue 8, August 2016, pp. 57-68
60
2.5. Quantitation of LPS
Quantitation of LPS was conducted with two methods. The first was a Chronoamperometric (CA) method under two steps of fixed potential:-50 mV and -400mV with each step duration of 100ms, and the data rate is 20 kHz at room temperature under the conditions of antibody-free, radioactive tracer-free and reagent-free in certified organic milk for infants with seven LPS challenge levels from 5.0 pg/mL to 500 ng/mL against controls, each sample run triplicates.
The second quantitation method was the voltage method, i.e., the DSCPO method, and the conditions were the same as described in the section of Assessing Energy Outcomes under Challenges of LPS by using human milk and organic cow milk samples under 4-5 LPS challenges from 50 ng/mL to 1000 ng/mL, respectively at ± 10 A against controls at 0.25 and 200 Hz, respectively. Freshly obtained samples were without pretreatment. Human milk cooled by dry ice was delivered to the laboratory, and it was brought to room temperature naturally without any heating before spiking the LPS. All water used was autoclaved and double distillated from Fisher Scientific. LPS was purchased from Sigma, and it was dissolved in autoclaved and filtered PBS pH 7.0 buffers. 2.6. A 3D Contour Mapping Method for
Evaluation of Human Milk Immunological Advantage under the LPS Challenge
The data obtained from the quantitation using the voltage method was used for evaluation of human milk immunological advantage under LPS challenges compared with that of the organic cow milk samples in 3D mapping method. The energy density results were put into the “y” column, the spiked LPS concentration over 0.0 to 1000 ng/mL was put into the “x” column, and the frequency was at the “z” column having two levels of 0.25 to 200 Hz. After converting the three data columns into a random XYZ correlation matrix, one can plot the contour maps and analyze the spatiotemporal formation of the pHFO, if it exists among human milk or organic milk samples. The real-time data obtained from the DSCPO method was converted to volumetric energy density, E = Cs·(ΔV)2/(2 ×3600), where Cs is the specific volumetric capacitance, Cs= [-i·Δt/ΔV]/L, Cs is in F/cm3 [33-34], Δt is the time in second, ΔV is the voltage in V, i is the current in Amps, and L is the volume in cm3.
3. Results and Discussions
3.1. Biomimetic Fibroblast Growth Factor Receptor 1 (FGFR1) SAM Membrane
FGFR1 is one of family receptors of tyrosine kinases. It plays important roles in embryonic
development, angiogenesis, wound healing, and malignant transformation, bone development, and metabolism [35-36]. Y. Zhang’s group reported mice with deleted FGFR1 exhibited an increased mobilization of endothelial progenitor cells (EPCs) into peripheral blood undergoing endotoximia, and the endotoximia was induced by injection of LPS [36]. Our project’s initial step is to build a model device such that the device’s SAM membrane mimics the FGFR1 receptor in the presence of LPS, which acts as a model metabolic product to access the FGFR1 function. By using this model to compare the effects of fresh human milk and organic cow milk at different frequencies of neuronal action/resting pulses at SWS and fast gamma frequency with or without LPS conditions to find out whether or not milk samples are energy efficiency or deficiency on the biomimetic brain cells will provide useful information to reveal which type of milk samples is immunologically advantage to infants. Fig. 1 shows the electron-relay system, and Fig. 2 is the AFM in a gold chip with the TCD/PEG/PVP/copolymer before adding o-NPA for embedding. 3.2. Frequency Affects on Memristor/
Memcapacitor’s Performance
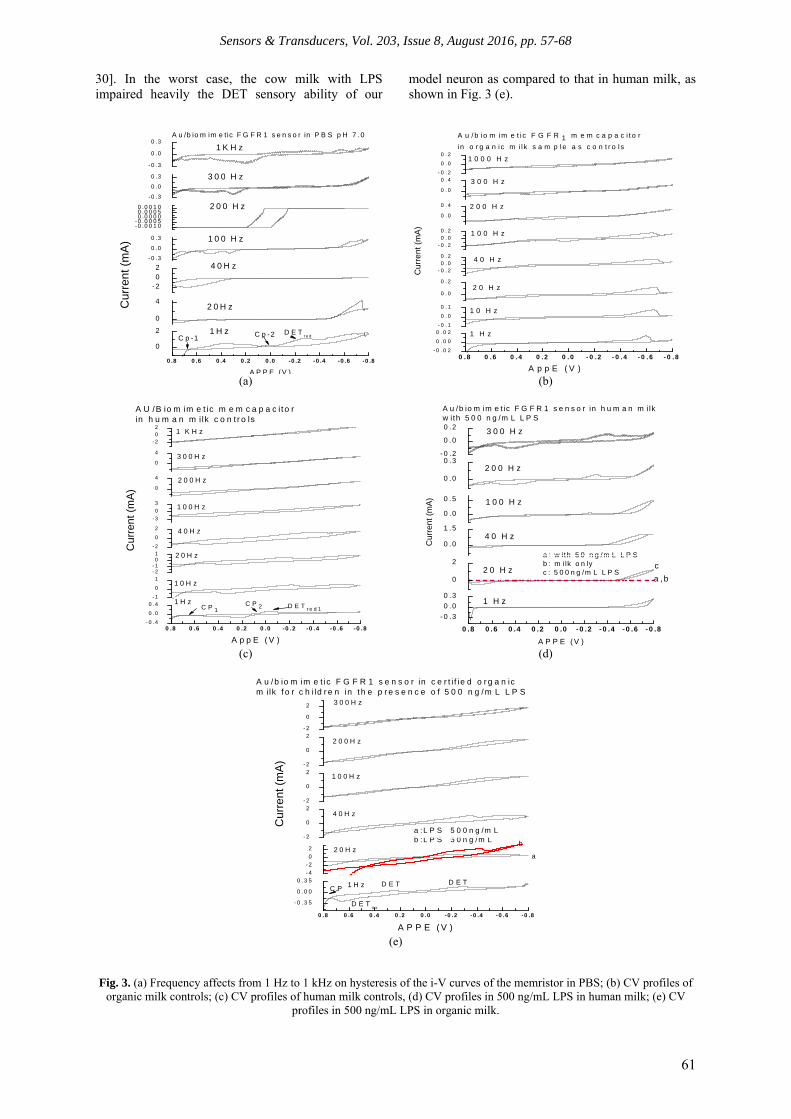
Fig. 3(a)’s i-V hysteresis curves were demonstrated with a switch point at the origin (0, 0) at almost all frequencies, except at kHz high frequency in the control medium PBS. When these perfect hysteresis behavior peaks occurred, especially at SWS frequency with a sensitive Direct Electron- Transfer (DET), and the switch point originates at origin, it indicates a healthy “newborn single neuron” exists before “feeding” it milk samples. Nonlinear frequency influence on current intensity is a characteristic of the memristor as reported in literature [9-12, 37-40]. Fig. 3(b) shows the controls in organic milk samples over 1 Hz to 1 kHz. The significant difference observed between the organic milk control, the PBS control, and the human milk control at SWS is that the organic milk did not have a butterfly type DETred peak near -0.1 to -0.2 V, where as PBS and human milk had this peak and cross-points near the origin. Rather, the organic milk control had a strange DETred peak at -0.595 V, and the control missed the cross-point near zero V. Further investigation is needed to determine what substances caused the unknown DET peak to occur. Fig. 3 (c) is the human milk controls with well-defined sensory DET butterfly peaks crossed near the origin at SWS. Fig. 3 (d) depicts that in human milk, 500 ng/mL LPS reduced the signal intensity at the SWS significantly. The LPS eliminated the original sensitive DET peaks, and that means the LPS first makes the neuron lose its sense of danger in the presence of toxins; this phenomenon matched our prior observations in the work of β-amyloidal (Aβ) that caused Alzheimer’s sensory loss at SWS [9-12,
Sensors & Transducers, Vol. 203, Issue 8, August 2016, pp. 57-68
61
30]. In the worst case, the cow milk with LPS impaired heavily the DET sensory ability of our
model neuron as compared to that in human milk, as shown in Fig. 3 (e).
0 .8 0 .6 0 .4 0 .2 0 .0 -0 .2 -0 .4 -0 .6 -0 .8
0
2 C p -2
A P P E (V )
C p -1D E T
re d
0
42 0 H z
1 H z
A u /b io m im e tic F G F R 1 s e n s o r in P B S p H 7 .0
-202
4 0 H z
Cu
rre
nt (
mA
)
- 0 .3
0 .0
0 .3 1 0 0 H z
-0 .0 0 1 0-0 .0 0 0 50 .0 0 0 00 .0 0 0 50 .0 0 1 0
2 0 0 H z-0 .3
0 .0
0 .3
1 K H z
3 0 0 H z
-0 .3
0 .0
0 .3
0 .8 0 .6 0 .4 0 .2 0 .0 - 0 .2 - 0 .4 - 0 .6 - 0 .8- 0 . 0 2
0 . 0 0
0 . 0 2
A p p E ( V )
Cu
rre
nt (
mA
)
1 H z- 0 . 1
0 . 0
0 . 1
4 0 H z
2 0 H z
1 0 H z
0 . 0
0 . 2
- 0 . 20 . 00 . 2
- 0 . 20 . 00 . 2 1 0 0 H z
0 . 0
0 . 4 2 0 0 H z
0 . 0
0 . 4 3 0 0 H z
- 0 . 2
0 . 0
0 . 21 0 0 0 H z
A u / b io m im e t i c F G F R 1 m e m c a p a c i t o r
i n o r g a n ic m i l k s a m p le a s c o n t r o l s
(a) (b)
0 .8 0 .6 0 .4 0 .2 0 .0 -0 .2 -0 .4 -0 .6 -0 .8- 0 .4
0 .0
0 .4
A p p E ( V )
D E T r e d 1C P 11 H z
- 1
0
1
C P 2
1 0 H z
- 2- 101
2 0 H z- 2
0
2
4 0 H z
- 3
0
3
Cu
rren
t (m
A)
1 0 0 H z
A U /B io m im e t ic m e m c a p a c i to rin h u m a n m i lk c o n t r o ls
0
4
2 0 0 H z
0
4
3 0 0 H z
- 202
1 K H z
0 .8 0 .6 0 .4 0 .2 0 .0 -0 .2 -0 .4 -0 .6 -0 .8
- 0 .3
0 .0
0 .3
A P P E ( V )
1 H z
0
22 0 H z
ca : w ith 5 0 n g /m L L P Sb : m ilk o n lyc : 5 0 0 n g /m L L P S
0 .0
1 .5
4 0 H z
0 .0
0 .5
1 0 0 H z
0 .0
0 .3
3 0 0 H z
2 0 0 H z
- 0 .2
0 .0
0 .2
A u /b io m im e t ic F G F R 1 s e n s o r in h u m a n m ilkw ith 5 0 0 n g /m L L P S
Cu
rre
nt
(mA
)
a , b
(c)
(d)
0 .8 0 .6 0 .4 0 .2 0 .0 -0 .2 - 0 .4 -0 .6 -0 .8
- 0 .3 5
0 .0 0
0 .3 5
A P P E ( V )
Cu
rren
t (m
A)
D E TD E T
D E To x
C P1 H z
- 4
- 2
0
2
A u /b io m im e t ic F G F R 1 s e n s o r in c e r t i f ie d o r g a n icm ilk f o r c h i ld r e n in t h e p r e s e n c e o f 5 0 0 n g /m L L P S
b
a :L P S 5 0 0 n g /m Lb :L P S 5 0 n g /m L
2 0 H za
- 2
0
2
4 0 H z
- 2
0
2
- 2
0
2
1 0 0 H z
2 0 0 H z
- 2
0
2
3 0 0 H z
(e)
Fig. 3. (a) Frequency affects from 1 Hz to 1 kHz on hysteresis of the i-V curves of the memristor in PBS; (b) CV profiles of
organic milk controls; (c) CV profiles of human milk controls, (d) CV profiles in 500 ng/mL LPS in human milk; (e) CV profiles in 500 ng/mL LPS in organic milk.

Sensors & Transducers, Vol. 203, Issue 8, August 2016, pp. 57-68
62
3.3. Assessing Energy Outcomes
Assessing energy outcomes was conducted by comparing human milk and certified organic milk, both with and without LPS, at 0.25 Hz and 200 Hz, respectively, using the voltage method. Fig. 4 (a-c) depict the synapse pulse control profiles using human milk, and compares samples using PBS media at 0.25, 40, 100, 200 and 250 Hz, respectively, without LPS. Curves overlap between the two media, and indicate human milk had no protein interference with the “single neuronal cell” as far as the neuron’s energy output is concerned. Fig. 4(d) compares the signal intensity when testing human milk in the presence of various LPS concentrations at 0.25 Hz,
and the results show the signal intensity is inversely proportional to a wide range of LPS concentrations from 50 ng/mL to 1000 ng/mL at 0.25 Hz. At 50 to 100 ng/mL, the biphasic pulse shape integrity is maintained; however the insert curves show that at 500 and 1000 ng/mL, the biphasic pulses are destroyed, and the cell net voltage intensity is close to zero. Fig. 4 (e) demonstrates a similar trend at 200 Hz, that the cell net voltage gets close to zero, at a higher concentration at 200 Hz, but at 50 ng/mL, the signal increases more than 30 % compared with that at zero LPS. This is a bad effect, a negative outcome of wasted energy. Fig. 5 (a) and 5 (b) depict LPS in organic milk’s impact on the synapse pulse intensity at 0.25 and 200 Hz, respectively.
0 2 4 6 8-6
-4
-2
0
2
4
6
0 2 4 6 8-0.10
-0.05
0.00
0.05
0.10
0.000 0.002 0.004 0.006 0.008 0.010-0.05
0.00
0.05
0.10
0.15
0.20
0.25
0 4 8 12 16 20-6
-4
-2
0
2
4
6
black: Human milkred line: PBS pH7.0
B 40 Hz
Vo
ltag
e (
V)
Time (s)
0.25 Hz
Au/Nanobiomimetic memristor/memcapacitor sensor with or w/o LPS each sample run triplicates at ± 10 nA in human milk
A
0.00 0.05 0.10-6
-4
-2
0
2
4
6
black: Human milkred line: PBS pH7.0
Time (s)
black: Human milkred line: PBS pH7.0
0.000 0.005 0.010 0.015 0.020-6
-4
-2
0
2
4
6 C
Time (s)
100Hz200Hz
250Hz
Vol
tage
(V
)
Time (s)
a: Human milk controlb: LPS 50ng/mL c: LPS 100 ng/mLd: LPS 500 ng/mLe: LPS 1000 ng/mL
0.25 HzDa
d, e
c
Time (s)
a: LPS 500ng/mLb: LPS 1μg/mL
0.25hz
a
b
Human milk in the presence of LPS in the final concentration
a: LPS 50ng/mL b LPS 500 ng/mLc LPS 1000 ng/mLd: Human milk control
Time (s)
a
d
E200Hz
b, c
Fig. 4. (a, b, c) Single neuronal pulse at 0.25, 40 and 250 Hz compared in pH 7.0 PBS buffer (red curve) and the human milk (black curve), respectively without LPS; (d, e) LPS effects on human milk over 0, 50, and 100 to 1000 ng/mL at 0.25 and
200 Hz, respectively.
0 2 4 6 8-0 .5
0 .0
0 .5
1 .0
1 .5
2 .0
T im e (s )
0 .25 H z
a: O rgan ic m ilk contro lb : LP S 50ng/m Lc: LP S 500ng/m Ld: LP S 1μg/m L
Vol
tag
e
(V-b
ackg
roun
d)
abcd
5A
0.000 0.005 0.010
0 .0
0 .5
1 .0
5B
A u/B iom im etic F ib rob las t g row th fac to rs recep to r 1 (F G F R1) o f T yros ine K inase
sensor w ith o r w /o LP S in o rgan ic m ilk , each sam ple run trip lica tes a t ± 10 nA
T im e (s )
a : O rgan ic m ilk contro lb : LP S 50ng/m Lc: LP S 500ng/m Ld: LP S 1μg/m L
200 H z
Fig. 5. (a, b) LPS effects on organic cow milk over 0, 50, and 500 to 1000 ng/mL at 0.25 and 200 Hz.
Sensors & Transducers, Vol. 203, Issue 8, August 2016, pp. 57-68
63
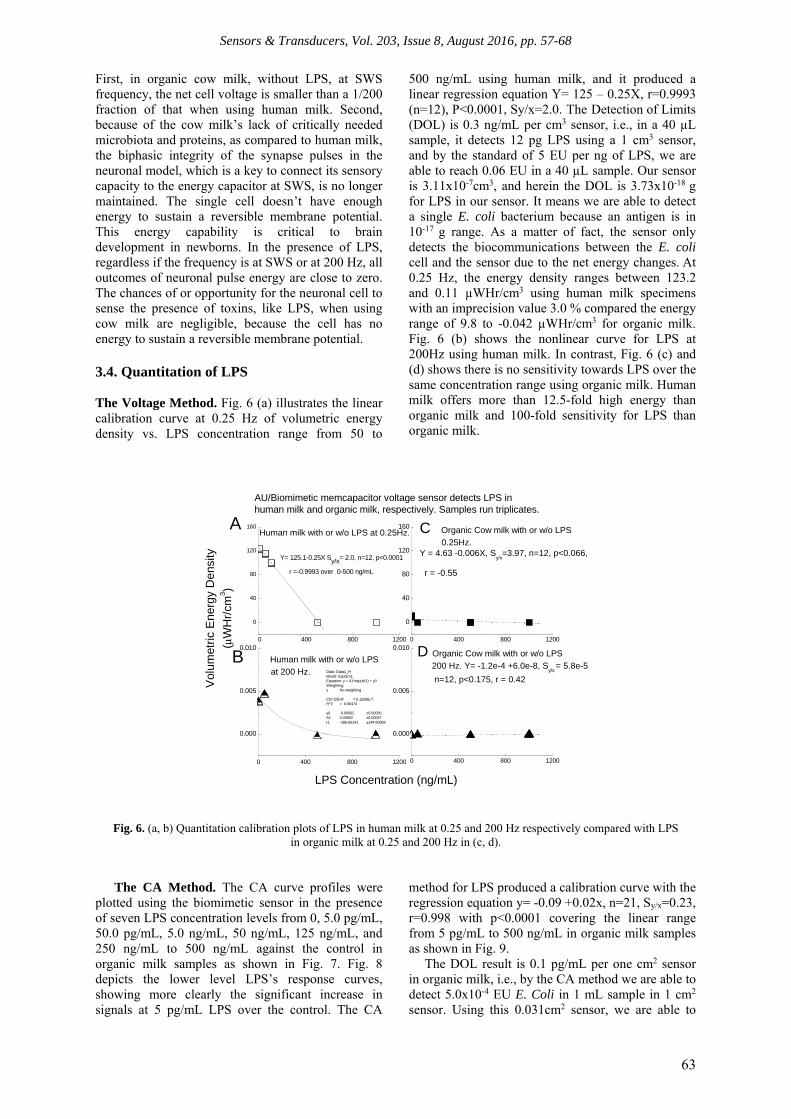
First, in organic cow milk, without LPS, at SWS frequency, the net cell voltage is smaller than a 1/200 fraction of that when using human milk. Second, because of the cow milk’s lack of critically needed microbiota and proteins, as compared to human milk, the biphasic integrity of the synapse pulses in the neuronal model, which is a key to connect its sensory capacity to the energy capacitor at SWS, is no longer maintained. The single cell doesn’t have enough energy to sustain a reversible membrane potential. This energy capability is critical to brain development in newborns. In the presence of LPS, regardless if the frequency is at SWS or at 200 Hz, all outcomes of neuronal pulse energy are close to zero. The chances of or opportunity for the neuronal cell to sense the presence of toxins, like LPS, when using cow milk are negligible, because the cell has no energy to sustain a reversible membrane potential. 3.4. Quantitation of LPS The Voltage Method. Fig. 6 (a) illustrates the linear calibration curve at 0.25 Hz of volumetric energy density vs. LPS concentration range from 50 to
500 ng/mL using human milk, and it produced a linear regression equation Y= 125 – 0.25X, r=0.9993 (n=12), P<0.0001, Sy/x=2.0. The Detection of Limits (DOL) is 0.3 ng/mL per cm3 sensor, i.e., in a 40 µL sample, it detects 12 pg LPS using a 1 cm3 sensor, and by the standard of 5 EU per ng of LPS, we are able to reach 0.06 EU in a 40 µL sample. Our sensor is 3.11x10⁻⁷cm3, and herein the DOL is 3.73x10⁻¹⁸ g for LPS in our sensor. It means we are able to detect a single E. coli bacterium because an antigen is in 10-17 g range. As a matter of fact, the sensor only detects the biocommunications between the E. coli cell and the sensor due to the net energy changes. At 0.25 Hz, the energy density ranges between 123.2 and 0.11 µWHr/cm3 using human milk specimens with an imprecision value 3.0 % compared the energy range of 9.8 to -0.042 µWHr/cm3 for organic milk. Fig. 6 (b) shows the nonlinear curve for LPS at 200Hz using human milk. In contrast, Fig. 6 (c) and (d) shows there is no sensitivity towards LPS over the same concentration range using organic milk. Human milk offers more than 12.5-fold high energy than organic milk and 100-fold sensitivity for LPS than organic milk.
0 400 800 1200
0
40
80
120
160
Y= 125.1-0.25X Sy/x= 2.0, n=12, p<0.0001
r =-0.9993 over 0-500 ng/mL
Vol
umet
ric
Ene
rgy
Den
sity
(μW
Hr/
cm3)
A
0 400 800 1200
0
40
80
120
160
C Organic Cow milk with or w/o LPS
0.25Hz. Y = 4.63 -0.006X, S
y/x=3.97, n=12, p<0.066,
r = -0.55
0 400 800 1200
0.000
0.005
0.010
Human milk with or w/o LPS at 0.25Hz.
Data: Data1_HModel: ExpGro1Equation: y = A1*exp(x/t1) + y0Weighting: y No weighting Chi^2/DoF = 6.1226E-7R^2 = 0.90474 y0 -0.00062 ±0.00066A1 0.00502 ±0.00067t1 -286.66141 ±144.60689
Human milk with or w/o LPS
at 200 Hz.
LPS Concentration (ng/mL)
B
0 400 800 1200
0.000
0.005
0.010
D Organic Cow milk with or w/o LPS
200 Hz. Y= -1.2e-4 +6.0e-8, Sy/x
= 5.8e-5
n=12, p<0.175, r = 0.42
AU/Biomimetic memcapacitor voltage sensor detects LPS inhuman milk and organic milk, respectively. Samples run triplicates.
Fig. 6. (a, b) Quantitation calibration plots of LPS in human milk at 0.25 and 200 Hz respectively compared with LPS in organic milk at 0.25 and 200 Hz in (c, d).
The CA Method. The CA curve profiles were plotted using the biomimetic sensor in the presence of seven LPS concentration levels from 0, 5.0 pg/mL, 50.0 pg/mL, 5.0 ng/mL, 50 ng/mL, 125 ng/mL, and 250 ng/mL to 500 ng/mL against the control in organic milk samples as shown in Fig. 7. Fig. 8 depicts the lower level LPS’s response curves, showing more clearly the significant increase in signals at 5 pg/mL LPS over the control. The CA
method for LPS produced a calibration curve with the regression equation y= -0.09 +0.02x, n=21, Sy/x=0.23, r=0.998 with p<0.0001 covering the linear range from 5 pg/mL to 500 ng/mL in organic milk samples as shown in Fig. 9.
The DOL result is 0.1 pg/mL per one cm2 sensor in organic milk, i.e., by the CA method we are able to detect 5.0x10⁻⁴ EU E. Coli in 1 mL sample in 1 cm2 sensor. Using this 0.031cm2 sensor, we are able to

Sensors & Transducers, Vol. 203, Issue 8, August 2016, pp. 57-68
64
detect E. Coli cells in the range of 0.2 - 5 cell assuming 5EU contains 2000-50000 E. Coli cells’ activity [13]. The percentage of Pooled Relative
Standard Deviation (PRSD %) of the organic milk samples over the entire linear range is 2.0 %.
0.00 0.05 0.10 0.15 0.20
0
2
4
6
8
10
12
a.... Organic milk controlb: 5 pg/mL LPSc: 50 pg/mLd: 5 ng/mLe: 50 ng/mLf: 125 ng/mLg: 250 ng/mLh: 500 ng/mL
Au/memcapacitor FGFR-1 biomimetic sensor with or w/o LPS
Cur
rent
Den
sity
(m
A/c
m2 )
Time (s)
a
h
0.00 0.05 0.10 0.15 0.20
0
5
10
15
20
Nor
mol
ized
sig
nal s
tre
ngth
Time (s)
bc
d
e
a.... Organic milk controlb: 5 pg/mL LPSc: 50pg/mLd: 5 ng/mLe: 50 ng/mL
Au/memcapacitor biomimetic sensor with or w/o LPSat lower level of LPS
a
Fig. 7. CA curve profiles for with or without LPS in
organic milk samples with each sample run triplicates.
Fig. 8. Normalized CA curves at lower LPS concentration
levels in organic milk.
0 100 200 300 400 500 600
0
2
4
6
8
10
12
14
Cur
rent
Den
sity
j(mA
/cm
2 )
LPS Concentration (ng/mL)
y= -0.09 + 0.02x, n=21, Sy/x =0.23r=0.998, p<0.0001covers LPS levels 0.005 to 500 ng/mL in organic milk
Fig. 9. Calibration curve using the CA method. 3.5. LPS Affects on the Energy Density in 3D
Contour Maps
The energy density contour maps associated with the images are presented in Fig. 10 with energy density as Z, LPS concentration as X, and discharge pulse frequency as Y. Fig. 10 (a, b) depict the contour map of energy density vs. LPS concentration in the frequency change using the human milk samples and Fig. 10 (c, d) depict the contour map of energy density vs. LPS concentration in the frequency change using the organic milk samples. It is obvious that human milk produced tremendous higher energy (showing as the light in the image) with an intensity more than 10-fold higher, especially at SWS even in the presence of LPS.
3.6. Evaluation of Immunological Advantage under LPS Challenges
The comparisons of the immunological
advantage under LPS challenges were evaluated
through the study of the formation of the pHFO using a 3D energy density map method. The energy density results were put into the “y” column, the spiked LPS concentration over 0.0 to 1000 ng/mL put into the “x” column and the frequency was into “z” column having two levels of 0.25 to 200 Hz. After converting the three data columns into a random XYZ correlation matrix, one can plot the contour maps and analyze the spatiotemporal formation of the pHFO if a pHFO exists among human milk or organic milk samples. Fig. 11 (a) depicts a 3D contour map of the relationship between energy density, LPS concentration and frequency using human milk. As we can see, at SWS, human milk held the highest neural synapse energy for with or without the presence of LPS challenge over the range from 0.0 ng/mL LPS to less than 200 ng/mL, until the LPS reaches 500 ng/mL, the energy gradually reduced to zero, in other words, human milk samples have an order of magnitude higher energy density at LPS=0 vs. organic milk at SWS and 200Hz, respectively as shown in Fig. 11 (a) compared with Fig. 11 (b). At 0.25 Hz, 50 ng/mL LPS caused 100 % energy reduce

Sensors & Transducers, Vol. 203, Issue 8, August 2016, pp. 57-68
65
in organic milk vs. human milk only 6.25% reduced. The rate of LPS reducing synapse energy is 10-times faster in organic milk samples than in human milk samples. It is estimated from the map at LPS
5 EU/ng, human milk maintained 96.6 % original energy strength vs. organic milk only 49 % strength at 0.25 Hz.
0 200 400 600 800 10000
50
100
150
200
LPS concentration (ng/mL)
Fre
qu
en
cy (
Hz)
05.0010.015.020.025.030.035.040.045.050.055.060.065.070.075.080.085.090.095.0100105110115120125
Energy Density
(μWHr/cm3)
Au/biomimetic FGFR1 memcapacitor sensor detect LPS using human milk, each sample run triplicates
0 100 200 300 400 500
0
50
100
150
200Human milk
(a)
(b)
0 200 400 600 800 10000
20
40
60
80
100
120
140
160
180
200
Energy Density
(μWHr/cm3)
Au/biomimetic FGFR1 memcapacitor sensor is unable to detect LPS when organic infant milk are used, each sample run triplicates
LPS concentration (ng/mL)
Fre
quen
cy (
Hz) 0
0.400.801.21.62.02.42.83.23.64.04.44.85.25.66.06.46.87.27.68.08.48.89.29.610
0 100 200 300 400 500
0
50
100
150
200organic milk
(c) (d)
Fig. 10. (a, b) Energy density (as Z) contour map and the image are shown using human milk. The LPS concentration (as X) and synapse frequency (as Y). (c, d) Contour maps and images with LPS are shown using organic milk.
0 200 400 600 800 1000-20
0
20
40
60
80
100
120
140
LPS concentration (ng/mL)
Ene
rgy
Den
sity
(μW
Hr/
cm3)
0.25010.220.230.240.250.260.270.280.190.1100110120130140150160170180190200
Frequency (Hz)
pHFO
Au/biomimetic memcapacitor sensor with or w/o LPS in human milk each sample run triplicates11A
0 200 400 600 800 1000
0
2
4
6
8
10
12
pHFO pHFO
Au/biomimetic memcapacitor sensor with or w/o LPS in organic milk each sample run triplicates
LPS concentration (ng/mL)
En
ergy
Den
sity
(μW
Hr/
cm3 )
0.25010.220.230.240.250.260.270.280.190.1100110120130140150160170180190200
Frequncy (Hz)
pHFO
11B
(a) (b)
Fig. 11. (a) 3D energy distribution map vs. frequency and LPS concentrations in human milk, (b) 3D energy distribution map vs. frequency and LPS concentrations in organic milk.

Sensors & Transducers, Vol. 203, Issue 8, August 2016, pp. 57-68
66
Table 1 demonstrates the results of the comparison of LPS induced occurrence of the pHFO spatiotemporal locations associated with energy density and frequency using human milk and organic cow milk samples, respectively. Human milk offers significant immunological advantage by avoiding pHFO formation over 0.25 Hz to 100 Hz at LPS concentration of less than 500ng/mL; even when LPS ≥ 500 ng/mL, the pHFO frequency is within fast gamma frequency range around 110-120 Hz. Our observation was confirmed within the literature that breastfed babies have less risk for seizure and epilepsy compared with cow milk fed babies when they grow up to adulthood [41]. Report revealed cow milk fed babies have significantly higher blood phosphorus levels and lower blood calcium levels than are seen in breastfed babies [42]. The CDC’s guidance for breastfeeding was well documented that breastfed babies are at an advantage in preventing chronic diseases [1-2]. Table 1 results show cow milk is ten-times more prone to E. Coli attack, and the positive link that was revealed is the formation of pHFO over the studied LPS concentration ranges which occurred in Rapid Eye Movement (REM) sleep (α frequency) to Sharp Wave-Ripple Complexes (SPW- R) (140-200 Hz) frequency [43].
Table 1. Comparison of the spatial-temporal pHFO locations induced by E.Coli in the 3D mapa in human milk
and organic cow milk samples.
Milk Frequency
(Hz)
Energy Density µWHr.(cm-3) Mean (s.d.)
LPS (ng/mL)
pHFO
Human milk
120 0.10 500 yes
Human milk
120 -0.10 1000 yes
Human milk
0.25 (SWS)
115.5(0.99) 50 no
Human milk
0.25 (SWS)
123.2(0.58) 0 no
Organic milk
0.25 (SWS)
9.8(1.19) 0 no
Organic milk
0.25 (SWS)
-0.20(0.005) 50 no
Organic milk
20-40
- 50 yes
Organic milk
200 -6.27e-5(5.9e-6) 50 yes
Organic milk
13-120 - 1000 yes
Organic milk
13-40 - 500 yes
a this table does not take into account the influence of the cross-point and the DET peak influences.
Compared with human milk samples at SWS in the presence of 50 ng/mL LPS and without LPS, respectively, there were 577-fold and 12.6-fold lower neural synapse energy density results obtained in organic cow milk samples. The results provide strong evidence that the poor energy outcomes at SWS may have participated in the initiation of pHFO formation at higher frequency. The pHFO link to LPS
concentration at REM and SPW-R frequency provides an explanation to the literature which reports that cow milk fed babies are more frequently seen in sudden infant death syndrome (SIDS) than are seen in breast milk fed babies [44-45]. A more detailed literature review regarding the advantages of breastfeeding over cow milk feeding to infants to reduce SIDS was reported in the literature [46]. Because our evaluation of the pHFO formation does not include the influence of the cross-point and DET peak’s sensory effects, we are therefore planning to study further the crucial factors impacting the pHFO dynamics so that when the results are obtained, we might be able to decipher and predict a fuller picture of the cause of SIDS.
4. Conclusion
We have demonstrated the advantage of the memristor/memcapacitor device with the biomimetic FGFR1 membrane: It behaves favorably with the microbiota in human milk, and it offers warning signs in orders of magnitude due to its sensitivity to a single bacterium’s LPS presence in human milk over organic milk. The same amount of LPS acted differently in organic cow milk, and the main difference is the absence of beneficial microbiota immune protection when it contacts with the neuronal sensor. The 577-fold and 12.6-fold lower neural synapse energy density results in organic cow milk samples when compared to human milk samples at SWS in the presence of 50 ng/mL LPS and without LPS, respectively, explained that the initiation of pHFO was possibly due to poor energy outcomes hampering brain development. The dual function CA/voltage sensor mamristor/memcapacitor device laid a foundation to quantitatively measure E. Coil’s biocommunication with the high sensitivity to energy changes in 78 fWHr with Detection of Limits (DOL) 3.73x10⁻¹⁸ g for the voltage method and a DOL of 1.2x10⁻¹⁶ g LPS for the CA method in 40 µL milk samples under antibody-free, tracers-free, and reagent-free conditions are demonstrated. Further study of the pHFO associated with sensory factors in a 3D dynamic mapping technology is needed to deepen our understanding of the immunological advantage of breastfeeding vs. cow milk feeding.
Acknowledgement
We would like to thank Matt Lee and his team for recruiting breastfeeding mothers and providing human milk samples as gifts for our projects. The authors want to thank Valerie Kitts for editing the manuscript.
References [1]. K. R. Shealy, R. Li, S. Benton-Davis, L. M.
Grummer-Struwn, The CDC guide to breastfeeding

Sensors & Transducers, Vol. 203, Issue 8, August 2016, pp. 57-68
67
interventions, Department of Health and Human Services, (DHHS), Center for Disease Control and Prevention, Atlanta, U.S.A., 2005. www.cdc.gov/breastfeed
[2]. U. S. DHHS, Healthy people 2010, 2nd ed., 2 volumes. U. S. Government Printing Office, Washington, November, 2000. www.healthypeople.gov/publications
[3]. Chapter five of breast feeding, J. of Tropical Pediatrics, Mother and Child Nutrition in Tropics and subtropics, World Health Organization: Breastfeeding: WHO, Geneva, 1981.
[4]. R. Wang, Ontogenetic development of the human sleep-dream cycle, Science, 152, 1966, pp. 604-619.
[5]. F. Simion, G. Butternworth (Eds.), The development of sensory, motor and cognitive capacities in early infancy: from perception to cognition, Psychology Press, 1998.
[6]. J. L. Noebels, M. Voli (Eds.), Jasper’s Basic Mechanisms of the Epilepsies, 4th edition, Oxford Press Publisher, NY, 2012.
[7]. L. Marshall, S. Binder, Transcranial oscillatory stimulation to research on neural networks, an emphasizes on hippocampus-neocortical rhythms, Frontiers in Human Neuroscience, 7, 614, 2013, pp. 1-6.
[8]. Anderson P., Morris R., Amaral D., Bliss T. and O’Keefe J. (Eds.), The hippocampus book, Oxford University Press, 2007.
[9]. E. T. Chen, J. Thornton and C. Mulchi Jr., Nanobiomimetic Memcapacitor Memory Devices Identify Circadian Rhythm Dysfunction and Predict Early Signs of, Epilepsy, Using Reentrant Energy-Sensory Images, in Proceedings of the Advanced Manufacturing, Electronics and Microsystems: TechConnect Briefs, 2015, pp. 200-203.
[10]. J. Thornton, C. Mulchi, Jr., P. T. Kissinger and E. T. Chen, Acetylcholine Repairs the Amyloid-beta Damage on Brain Circuitry and Memory Loss From a, Mutated Biomimetic Acetylcholinesterase, Neuronal Memcapacitor During Slow-Wave Sleeping, in Proceedings of the Advanced Manufacturing, Electronics and Microsystems: TechConnect Briefs, 2015, pp. 226-229.
[11]. E. T. Chen, J. T. Thornton and C. Mulchi, Jr., Early Forming a Hummingbird-like Hovering Neural Network Circuitry Pattern with Reentrant Spatiotemporal Energy-Sensory Orientation Privileged to Avoid, Epilepsy, Based on a Biomimetic Acetylcholinesterase Memcapacitor Prosthesis, Sensors & Transducers, Vol. 191, Issue 8, August 2015, pp. 84-99.
[12]. J. T. Thornton, C. Mulchi, Jr., P. T. Kissinger, E. T. Chen, In Vitro Restoration of an Amyloid-Beta Altered Network Circuitry in a 'Mutated Biomimetic Acetylcholinesterase' Memristor/Memcapacitor Neural Prosthesis, Sensors & Transducers, Vol. 191, Issue 8, August 2015, pp. 100-113.
[13]. P. O. Magalhães, A. M. Lopes, P. G. Mazzola et. al., Methods of endotoxin removal from biological preparations: a review, J. of Pharm Pharmaceutical Sci, 10, 3, 2007, pp. 388-404.
[14]. M. Daneshiam, A. Guenther, A. Wendel et. al, In drugs, J. of Immunological Methods, 313, 2006, pp. 169-175.
[15]. Y. A. Knirel, M. A. Valvano, Bacterial (Eds.), lipopolysaccharides, structure, chemical synthesis and interaction with host cells, Springer, 2011.
[16]. T. Reimer, M. Brcic, M. Schweizer, T. W. Jungi, poly(I:C) and LPS induce distinct IRF3 and NF-κB signaling during type-I IFN and TNF responses in human macrophages, J. Leukocyte Biology, 83, 2008, pp. 1249-1257.
[17]. G. I. Tsiaoussis, S. F. Assimakopoulos et. al., Intestinal barrier dysfunction in cirrhosis: Current concepts in pathophysiology and clinical implications, World J. of Hepatology, 7, 17, 2015, pp. 2058-2068.
[18]. LPS: the switch for inflammation in the gut and beyond, http://www.realfoodforager.com
[19]. A. I. Petra, S. Panagiotidou, E. Hatziagelaki, J. M. Stewart, P. Conti and T. C. Theoharides, Gut-Microbiota-Brain Axis and Its Effect on Neuropsychiatric Disorders With Suspected Immune Dysregulation, Clinical Therapeutics, 37, 5, 2015, pp. 984-995.
[20]. Anna Struncka (Ed.), Cellular and molecular biology of autism spectrum disorders, Prague University Press, 2010.
[21]. I. M. Chiu, B. A. Heeesters et. al., Bacteria activate sensory neurons that modulate pain and inflammation, Nature, 501, 2013, pp. 52-57.
[22]. B. Petschow, J. Dore, P. Hibberd, et. al., Probiotics, prebiotics, and the host microbiome: the science of translation, Annals of the New York Academy of Sciences, 1306, 2013, pp. 1-17.
[23]. M. Lehmann, O. Wellnitz, R. M. Bruckmaier, Concomitant lipopolysaccharide-induced transfer of blood-derived components including immunoglobulins into milk, J. of Diary Science, 96, 2, 2013, pp. 889-896.
[24]. M. Lorna, A. Deleoz, K. M. Kalanetra, et. Al., Human Milk Glycomics and Gut Microbial Genomics in Infant Feces Show a Correlation between Human Milk Oligosaccharides and Gut Microbiota: A Proof-of-Concept Study, J. of Proteome Research, 14, 2015, pp. 491-502.
[25]. M. L. Marin, R. Avrovo et. al., Cold storage of human milk: effect on its bacterial composition, J. Pediatric. Castroenterol. Nutrition, 49, 3, 2009, pp. 343-348.
[26]. N. Khaldi, V. Vijayakumar et al., Predicting the important enzymes in human breast milk digestion, J. Of Food Chem., 62, 29, 2014, pp. 7225-7232.
[27]. M. L. Marin, R. Avrovo et. al., Cold storage of human milk: effect on its bacterial composition, J. Pediatric. Castroenterol. Nutrition, 49, 3, 2009, pp. 343-348.
[28]. S-H. Duh, J. Thornton, P. T. Kissinger and E. T. Chen, Nanobiomimetic Memristor/memcapacitors’ Function as a Voltage Sensor for Direct and Reagent-free Detection of sub pg Lipopolysaccharide (LPS) in Different Types of Milks for Infants, in Proceedings of the Sensors, Diagnostics & Imaging, TechConnect Briefs, Chapter 4, 2016, pp. 140-143.
[29]. E. T. Chen, J. Thorten, C. Ngatchou, S-H Duh, P. T. Kissinger, Nanostructured biomimetic pyruvate dehydrogenase complex (PDC) sensors selectively detect single brain cancer cell having the ability to mimic the “ATP Lid” Proceedings of the NSTi-NanoTech, 2, 2013, pp. 107-110.
[30]. E. T. Chen, J. Thornton, C. Ngatchou and S-H Duh, Nanostructured memristor sensor mimics acetylcholinesterase (ACHE) active sites in the gorge for fM detection of acetylcholine, Proceedings of the NSTi-Nanotech, 2, 2014, pp. 169-172.

Sensors & Transducers, Vol. 203, Issue 8, August 2016, pp. 57-68
68
[31]. E. T. Chen, J. Thornton, C. Ngatchou, S-H. Duh, P. T. Kissinger, Study of the correlations between direct electron transfer rate constants and the effectiveness of cancer inhibitors using nanobiomimetic sensors Proceedings of the NSTi-Nanotech, 3, 2013, pp. 115-118.
[32]. E. T. Chen and C. Ngatchou, Study of the factors that effect on the power storage and generation of a nano-biomimetic membrane electrode-assembling (NBMEA) for battery/fuel cell dual applications Clean Technology, 3, 2011, pp. 204-207.
[33]. M. F. El-Kady, V. Strong, S. Dubin, R. B. Kaner, Laser Scribing of High-Performance and Flexible Graphene-Based Electrochemical Capacitors, supplement materials, Science, 335, 2012, pp. 1326-1330.
[34]. J. R. Miller, R. A. Outlaw, B. C. Holloway, Graphene double-layer capacitor with ac line-filtering performance, Science, 329, 2010, pp. 1637-1639.
[35]. M. Mohammadi, G. McMahon, L. Sun, C. Tang, P. Hirth, Structures of the tyrosine kinase domain of fibroblast growth factor receptor in complex with inhibitors, Science, 276, 1997, pp. 955-959.
[36]. Y. Zhang, N. Su, F. Luo et. al., Deletion of Fgfr1 in Osteoblasts Enhances Mobilization of EPCs into Peripheral Blood in a Mouse Endotoxemia Model, Int. J. Biol. Sci, 10, 9, 2014, pp. 1064-1071.
[37]. J. Martinez-Rincon, M. D. Ventra, Y. V. Pershin, Solid-State Memcapacitive System with Negative
and Diverging Capacitance, Physical Review B, 81, 19, 2010, pp. 195430-1-195430-7.
[38]. M. D. Pickett, G. Medeiros-Ribeiro and R. S. Williams, A Scalable neuristor built with Mott memristors, Nature Materials, 12, 2013, pp. 114–117.
[39]. R. Kozma, R. E. Pino, G. E. Pazienza, Advances in neuomorphic memristor science and applications, Springer Publisher, 2012.
[40]. M. D. Ventra, Y. V. Pershin, On the physical properties of memristive, memcapacitive and meminductive systems, Nanotechnology, 24, 2013, pp. 255201.
[41]. L. K. Boerner, Breastfeeding linked to fewer seizures in kids, www.reuters.com/article/us-breastfeeding-seizures-idUSTRE71663T20110207.
[42]. Hypocalcemia in newborn infants fed cow’s milk, Nutrition Reviews, 26, 10, 1968, pp. 299-301.
[43]. Sharp wave-ripple complexes, http://en.wikipedia.org [44]. W. Sears, Eight reasons breastfeeding reduces SIDS,
http://www.askdrsears.com [45]. R. A. Darnall, M. H. Goodstein, F. R. Hauck, R. Y.
Moon, American Academy of Pediatric’s Task Force on SIDS fully supports breastfeeding, Breastfeeding Medicien, 9, 9, 2014, pp. 486-487.
[46]. B. Alm, G. Wennergren, P. Mollborg, H. Lagercrantz, Breastfeeding and dummy use have a protective effect on sudden infant death syndrome, Acta Pediatrica, 105, 2016, pp. 31-38.
___________________ 2016 Copyright ©, International Frequency Sensor Association (IFSA) Publishing, S. L. All rights reserved. (http://www.sensorsportal.com).