sensors-13-01539.pdf
24
Sensors 2013, 13, 1539-1562; doi:10.3390/s130201539 sensors ISSN 1424-8220 www.mdpi.com/journal/sensors Article Motion Mode Recognition and Step Detection Algorithms for Mobile Phone Users Melania Susi † , Valérie Renaudin ‡ and Gérard Lachapelle * PLAN Group, Schulich School of Engineering, The University of Calgary, 2500 University Drive NW, Calgary, AB T2N 1N4, Canada; E-Mails: [email protected] (M.S.); [email protected] (V.R.) † Present address: Nottingham Geospatial Institute, University of Nottingham, Nottingham, NG8 1BB, UK. ‡ Present address: GEOLOC Lab, IFSTTAR, 44344 Bouguenais, France. * Author to whom correspondence should be addressed; E-Mail: [email protected]. Received: 1 December 2012; in revised form: 18 January 2013 / Accepted: 22 January 2013 / Published: 24 January 2013 Abstract: Microelectromechanical Systems (MEMS) technology is playing a key role in the design of the new generation of smartphones. Thanks to their reduced size, reduced power consumption, MEMS sensors can be embedded in above mobile devices for increasing their functionalities. However, MEMS cannot allow accurate autonomous location without external updates, e.g., from GPS signals, since their signals are degraded by various errors. When these sensors are fixed on the user’s foot, the stance phases of the foot can easily be determined and periodic Zero velocity UPdaTes (ZUPTs) are performed to bound the position error. When the sensor is in the hand, the situation becomes much more complex. First of all, the hand motion can be decoupled from the general motion of the user. Second, the characteristics of the inertial signals can differ depending on the carrying modes. Therefore, algorithms for characterizing the gait cycle of a pedestrian using a handheld device have been developed. A classifier able to detect motion modes typical for mobile phone users has been designed and implemented. According to the detected motion mode, adaptive step detection algorithms are applied. Success of the step detection process is found to be higher than 97% in all motion modes. Keywords: pedestrian navigation; handheld MEMS; step detection; mobile phone; gait analysis OPEN ACCESS
-
Upload
tran-nhat-hung -
Category
Documents
-
view
8 -
download
1
Transcript of sensors-13-01539.pdf
Sensors 2013, 13, 1539-1562; doi:10.3390/s130201539
sensors ISSN 1424-8220
www.mdpi.com/journal/sensors
Article
Motion Mode Recognition and Step Detection Algorithms for
Mobile Phone Users
Melania Susi †, Valérie Renaudin
‡ and Gérard Lachapelle *
PLAN Group, Schulich School of Engineering, The University of Calgary, 2500 University Drive NW,
Calgary, AB T2N 1N4, Canada; E-Mails: [email protected] (M.S.); [email protected] (V.R.)
† Present address: Nottingham Geospatial Institute, University of Nottingham, Nottingham,
NG8 1BB, UK.
‡ Present address: GEOLOC Lab, IFSTTAR, 44344 Bouguenais, France.
* Author to whom correspondence should be addressed; E-Mail: [email protected].
Received: 1 December 2012; in revised form: 18 January 2013 / Accepted: 22 January 2013 /
Published: 24 January 2013
Abstract: Microelectromechanical Systems (MEMS) technology is playing a key role in
the design of the new generation of smartphones. Thanks to their reduced size, reduced
power consumption, MEMS sensors can be embedded in above mobile devices for
increasing their functionalities. However, MEMS cannot allow accurate autonomous
location without external updates, e.g., from GPS signals, since their signals are degraded
by various errors. When these sensors are fixed on the user’s foot, the stance phases of the
foot can easily be determined and periodic Zero velocity UPdaTes (ZUPTs) are performed
to bound the position error. When the sensor is in the hand, the situation becomes much
more complex. First of all, the hand motion can be decoupled from the general motion of
the user. Second, the characteristics of the inertial signals can differ depending on the
carrying modes. Therefore, algorithms for characterizing the gait cycle of a pedestrian
using a handheld device have been developed. A classifier able to detect motion modes
typical for mobile phone users has been designed and implemented. According to the
detected motion mode, adaptive step detection algorithms are applied. Success of the step
detection process is found to be higher than 97% in all motion modes.
Keywords: pedestrian navigation; handheld MEMS; step detection; mobile phone;
gait analysis
OPEN ACCESS

Sensors 2013, 13 1540
1. Introduction
A consequence of the booming market of smartphones and other types of Personal Digital Assistant
(PDAs) is that the possibility of using mobile devices for locating a person is becoming more and more
attractive for many applications. Among them are health care services, commercial applications and
safety services. The trend is evolving from applications dedicated to professional market to the
consumer market. This explains the increasing interest for research in handheld based positioning for
Location Based Services (LBS) as it could broaden the offer of services based on user’s locations. For
example, mobile phone users can automatically receive information about places of interest, such as
restaurants or shops according to their actual locations or they can be constantly updated about the
location of their friends’ network. Knowing a subject’s location can also help to quickly provide
assistance services in emergency situations or help in the assistance of elderly or impaired people.
Subsequently, it is necessary to guarantee accuracy, continuity and availability of provided services in
different environments. It is known that Global Navigation Satellite Systems (GNSS) are the primary
source for tracking user’s position. In indoor environments, in urban canyons and in other challenging
surroundings the availability of satellite signals cannot be guaranteed and GNSS based services can be
highly degraded or totally denied. In these cases, micro-electromechanical systems (MEMS), such as
accelerometers and gyroscopes, can aid the geolocation process. The main advantage of using these
sensors is that they are already embedded in most emerging mobile devices.
However, the main drawback of low grade MEMS sensors is that, since their signal is affected by
various noises and drifts [1], they cannot constitute a self-contained system. In order to bound the
above error sources, frequent GNSS updates can be used. When GNSS aiding is not available other
approaches have to be investigated in order to geolocate users. A widespread approach consists in
applying Pedestrian Dead Reckoning (PDR) using embedded inertial sensors. Contrary to strap-down
navigation, PDR offers an interesting strategy because it exploits the kinematic of the human gait [2]
instead of doubly integrating the inertial data. Given a starting known position, PDR algorithm
propagates the user’s position by estimating the heading and the user’s travelled distance or the user’s
speed. Traditionally, PDR algorithms compute the travelled distance by detecting the user’s steps and
determining their length. This technique has been used for navigation application in many research
works, as detailed in Section 2.
2. Background and Related Works
The PDR approach is very effective when the sensor is rigidly mounted on the user’s body,
especially when it is located on the user’s foot. In this case, the stance phases of the foot (when the
foot is flat on the ground) can be identified and associated with step events. Periodic zero velocity
updates (ZUPTs) and/or zero angular rate updates (ZARUs) are then performed to bound the position
error accumulation [3–5]. The same techniques can be adopted when the sensor is mounted on the
user’s leg or ankle. In fact, as in the above cases, quasi-static periods, even if shorter than the ones
identified for the foot case, are still present [6]. The case of inertial sensors fixed on the user’s torso or
belt is also explored [7–10]. In the above situations, the inertial force experienced by the sensor is
directly linked to the motion of the human body’s Centre Of Mass (COM) and, subsequently, to the

Sensors 2013, 13 1541
global user’s motion. However, body fixed locations are not realistic for consumer grade applications
since generic users usually carry their mobile devices in their hands, lower pockets or handbags. The
case of unmounted sensors for inertial pedestrian navigation is only marginally explored. Some
research deals with the case of the sensors in the user’s pocket [11,12]. When the subject is walking
with the sensor in the pocket, the IMU signal is generally undistorted and reflects the global user’s
motion. Subsequently, in this case, approaches similar to the body fixed case can be adopted. Indeed, a
handheld mobile device can be subjected to various types of motions and the pattern of the sensor
signal is less predictable than in the above mentioned cases. Gusenbauer et al. [13] analyse the
situation where the user carries the mobile device in his/her hand looking at the screen to consult
navigation instructions. The mentioned work does not consider different carrying modes, which is a
limitation for realistic applications. Another promising approach for navigation purposes using
handheld devices is based on the integration of inertial sensor signals with a camera, nowadays
embedded in all smart phones [10,14,15]. This approach is based on specific assumptions regarding the
light conditions and the camera orientation determined by the device orientation.
For devices carried without any assumption about their orientation or position the continuous
identification of the device carrying mode and the user motion can help to constrain and properly tune
the navigation algorithms according to the specific situation and, consequently, to the characteristics of
the sensor signal pattern. For body fixed sensors, it has been shown that knowledge about the user
motion can be exploited to aid PDR systems and refine the user’s location estimate, e.g., [9,16]. The
identification of human motion and gestures by using inertial sensors is an active and proliferating
research field finding many applications included medical diagnosis, sport rehabilitation [17],
elderly assistance [18], emergency services [19], monitoring systems [20], offender tracking [21],
navigation [9,22] etc. Each application has specific requirements determining the number and type of
sensors to be used, the sensor position and carrying mode, and the motions/activities to be recognized.
For instance, the use of multiple sensors is a common approach for medical applications and
rehabilitation purposes since more sources of information increase the accuracy of the classification
process. The use of multiple body fixed sensors for human activity recognition has been deeply
investigated in the literature. An extensive comparison of classification techniques using inertial body
worn sensors can be found in [23–25]. In the recent years, human activity recognition by exploiting the
capabilities of modern handheld smart phones or devices is also becoming an active field of research.
However, the identification of human activities recognition by using mobile phones introduces many
peculiar issues [26,27]. One of the main requirements is that the classification should be robust,
regardless of the device carrying mode and its orientation. Some research work focuses on the
identification of human activities using portable devices in order to localize users in the outdoors
relying on the combination of GPS and other technologies or external source information, e.g.,
Geographic Information System (GIS) and inertial sensors data [28,29]. However these algorithms,
which rely on GPS measurements, are designed for outdoor applications and, consequently, are not
suitable for navigation purposes in satellite signal denied environments. A very few recent papers
propose navigation algorithms for handheld devices based only on inertial sensors data and taking in
account different sensor carrying modes including the swinging hand case. The latter is the most
critical situation. Indeed, when an inertial sensor is held in a swinging hand, the hand motion can hide
the global pedestrian motion making the step identification difficult. For this reason, the techniques

Sensors 2013, 13 1542
used for ―body fixed‖ sensors cannot be applied to the swinging case and a dedicate analysis is
required. Recently Pei et al. [30] proposed a Least Square-Support Vector Machines for identifying
eight motion states, considering different carrying modes including the swinging situation. Based on
accelerations and magnetic field data recorded with a handheld unit, this classifier performs with
successful recognition rates varying between 80.45% and 95.53% depending on the considered
features. Then, human activity recognition is combined with wireless positioning for indoor navigation.
Kamisaka et al. [31] propose the design and implementation of a PDR system for mobile phone
applications. This work deals with different carrying modes including the swinging case. The latter is
distinguished from other sensor carrying modes by analysing the output of a magnetometer.
Specifically, the magnetometer measurements are used to evaluate the variation in the angular
difference detected by the sensor. This approach is motivated by the observation that arm swinging
produces a sinusoidal magnetometer output. Once the specific carrying mode is identified, user steps
are detected by exploiting the magnetometer outputs in the swinging case and the accelerometer
outputs in all the other analysed carrying modes. However, magnetic fields experience rapid variations
in indoor spaces due to surrounding ferromagnetic compounds, which may perturb the sinusoidal
pattern analysis.
3. Motivation and Paper Outline
In this paper, different kinds of motions commonly experienced by handheld inertial sensors are
considered and identified using a dedicated classifier. In particular, the case of an IMU carried in the
user’s swinging hand is distinguished from the situation when the user is interacting with the mobile
device, for example when the walking subject is phoning or texting a message on his/her mobile device.
In order to identify the swinging case, the proposed approach uses angular rates instead of magnetometer
measurements exploited in [30,31]. Indeed, this appears to be a more robust source of information. A
further element of novelty is the analysis of ―irregular motions‖. The irregular motion class includes all
motions inducing an inertial force on the sensor that does not reflect a real change of user’s
displacement. The identification of this type of motion, which is frequently neglected in PDR
algorithms, is fundamental for navigation purposes in order to discard parasite motions in the
navigation process. This aspect is also pointed out in [9] where a waist mounted IMU is exploited to
detect different types of motions including irregular motions, such as ―bending over‖, which are not
linked to a change of the user’s geographical position. Such irregular motions are even more likely to
occur when the sensor is freely carried in a hand, which is the case considered here, but are also more
difficult to identify due to the possible decoupling between hand and body motions. Knowledge of the
motion mode is then exploited to develop step detection algorithms that are adapted to the mode
experienced by the user. In fact, as shown in [32], the algorithms proposed here can be exploited in
conjunction with a step length model to effectively compute the user’s linear travelled distance by
using handheld devices freely carried by the user. The challenging task of robustly detecting steps with
handheld inertial sensors is essential for free-inertial PDR and is the motivation of this work.
The remainder of the paper is organized as follows: in Section 4, the signal model is introduced and
in Section 5, the selected motion modes are illustrated. The features and the decision tree algorithm
used for classifying the pedestrian and hand motion modes are described in Section 6. The step

Sensors 2013, 13 1543
detection algorithm is described in Section 7. Section 8 details the data collections and assesses the
proposed algorithms. Finally, Section 9 draws conclusions.
4. Signal and System Model
The motion mode recognition and the user’s step recognition are performed using signals recorded
with a six-degree-of freedom handheld Inertial Measurement Unit (IMU). The device is constituted by
a tri-axis accelerometer and tri-axis gyroscope that respectively measure the acceleration and angular
velocity of the rigid body with respect to the navigation frame. The output of the IMU n can
be modelled as the sum of the response to the experienced inertial force and a noise term [5]. It is
composed by the accelerometer output n and the gyroscope output and n . It can be
expressed as:
(1)
where:
represents the temporal index of the signal with sampling frequency fs = 1/Ts equals to
100Hz,
is the raw acceleration vector at the output of the tri-axis accelerometer,
is the noise vector associated to the accelerometer output,
is the raw angular rate vector at the output of the tri-axis gyroscope and
is the noise vector associated to the gyroscope output.
Due to their low grade nature, the sensors embedded in most common mobile devices are strongly
affected by errors degrading their accuracy [1]. To cope with such errors, specific signal pre-processing
is required as described in Section 6.1. In particular, the algorithms presented in this paper are
extracting information from moving windows whose mean is removed in order to mitigate the slowly
varying sensor errors, i.e., the sensor bias drift.
5. Motion Mode Definition
As analysed in [27,33], portable handheld devices experience a large variety of motions producing
different patterns in the recorded signals. The success rate of signal processing techniques for
analysing pedestrian gait is therefore related to the design of adaptive analyses. Subsequently, knowing
not only the user’s global motion mode, but also his/her hand’s motion is fundamental. Moreover it is
important to identify all hand motions that do not reflect a real change in the user’s location and should
be only considered as perturbations for tracking the global displacement. Otherwise in these cases, the
user position would be incorrectly propagated in any navigation filter. Such event occurs, for example,
when the user is standing and looking for his/her phone in the bag. In these situations the subject is not
changing his geographical position although a significantly inertial force is experienced by the
handheld IMU.
a an n nn = = +
nn n
s a ηs
ωs η
na
a nη
nω
nη

Sensors 2013, 13 1544
In this paper, the following four different classes have been identified in order to better characterize
the sensor carrying modes and motions typical for mobile phone users.
Class 1: this class includes all situations when user is static. The user is considered as static when
his/her location does not change during the analysis temporal window. More specifically,
it also includes the situation when the user is slightly moving but not significantly enough
to be considered as a global locomotion. This is the case when the user is stepping on spot
while answering a phone call. All these types of activities have to be recognized as static
activities, so that the user position is not wrongly affected.
Class 2: this class refers to all cases when the device is quasi stable and the inertial force
experienced by the sensor is mainly produced by the user global motion. It includes the
following cases
− Hand texting: in this case the mobile handheld device is almost stationary. For
example, the user is walking, texting or reading a message on the phone. The situation
when the subject is walking watching his/her mobile phone’s screen to follow
navigation instructions is included as well.
− Hand phoning: the user walks while making or receiving a call.
− Bag carrying: the user is walking with the mobile device in a bag held in one hand.
Class 3: it refers to the hand swinging case. The user is walking while holding the mobile device in
his/her swinging hand.
Class 4: it includes the irregular motions. They are all motions that the user performs while he is
standing and that do not contribute to the global locomotion. For example, the subject is
searching the phone in a bag without walking.
6. Motion Mode Classification
The goal of a classification system is to automatically assign a given input pattern to known classes
of objects, according to specific decision rules. In general, any classification process is performed
according to the three following phases [34].
Data pre-processing: the main purpose of this phase is to remove the noise from raw data
enabling next phases.
Features extraction and evaluation: this phase aims at extracting and evaluating meaningful
parameters able to univocally characterize each class, therefore enabling the classification process.
Decision Making: this phase refers to the last stage that is the association of the input pattern to
a specific class.
As shown in Figure 1, where the general block scheme of a classifier for motion mode recognition
is reported, the raw data are first pre-processed and then the extraction and evaluation of features is
performed. The optimum features for characterizing the input pattern are found during the training
phase. The latter has also the aim to learn the classifier according to a specific model. Finally, the class
selection is performed. Following sections detail the above three phases that have been implemented
for identifying the user’s motion mode.

Sensors 2013, 13 1545
Figure 1. Scheme of a classifier for motion mode recognition.
6.1. Pre-Processing
Since most of the energy captured by the accelerations and angular rates associated to human
movements is below 15 Hz [35], the components in Equation (1) are first low-pass filtered using a 10th
order Butterworth filter with a 15 Hz cut-off frequency. This filtering removes the high-frequency
components of the noise. This phase is necessary for extracting useful information from the low-cost
sensor signals enabling the human motion recognition process. It is worth pointing out that
high-frequency components could be exploited to identify other types of contexts [36,37], such as
driving a car, which are not considered in this paper.
Moreover processing is performed on the norm of the inertial signals. Indeed when the sensor is not
body fixed, the orientation of the sensor cannot easily be determined, which affects the analysis of
inertial signals along a specific axis. In addition, due to fast motions that are generally performed by
hand, the orientation of the sensor can suddenly change and distorts a component-wise processing. To
remove any dependence upon the sensor’s orientation, the norm of the IMU signal is considered. The
following notation is used to denote the filtered acceleration and angular rate norm:
(2)
where:
It has to be noted that the presence of a non-zero DC component can hide important information
and reduce the effectiveness of frequency domain estimation techniques, which will be used later.
Thus, the DC component is removed as follows:
(3)

Sensors 2013, 13 1546
The second term of Equation (3) is the signal mean computed using a moving average filter and N
is the length of the moving average. The criterion used to select the analysis window length is
explained in Section 6.2.
6.2. Feature Extraction
To perform any classification process a set of features has to be extracted. They are attributes able
to characterize without ambiguity each motion mode. The features selection plays a key role in the
entire classification process and strongly affects the final performance of the designed classifier. In
particular, to reduce the probability of miss-classification, features have to be chosen in order to [34]:
minimize the distance among different features belonging to the same class
maximize the distance among different features belonging to different classes.
In this work, feature extraction is performed by dividing the norm of pre-processed inertial data in
sliding windows of N samples with 50% overlap. The effectiveness of this choice for motion mode
recognition has already been shown in previous work (e.g., [27,32]). The window’s size has to be
selected in order to be big enough for including at least a cycle gait but small enough to allow
identifying sudden motion mode transitions. In this work N was chosen to be 256 samples that
correspond to 2.56 seconds using a 100 Hz sampling frequency.
In addition, this size allows the fast computation of the Fast Fourier Transform (FFT) [38] used for
the frequency analysis of the examined signals. The following features have been identified for the
classification process:
the gyroscope energy ,
the accelerometer energy ,
the gyroscope variance ,
the accelerometer variance and
the dominant frequencies of the gyroscope and accelerometer, respectively and
They are described in the next sections.
6.2.1. Signal Energy
Energy features allow distinguishing low and high intensity activities. The energy is computed here
by squaring the norm of the accelerometer and gyroscope data and summing and normalizing them
over a moving window as:
(4)
(5)
where N is the length of the analysis window and and
are the norms, of the filtered
accelerometer and gyroscope data. This feature mainly contributes to the identification of static and
dynamic states. Figure 2 shows the results of an actual user walking along a straight line with the IMU
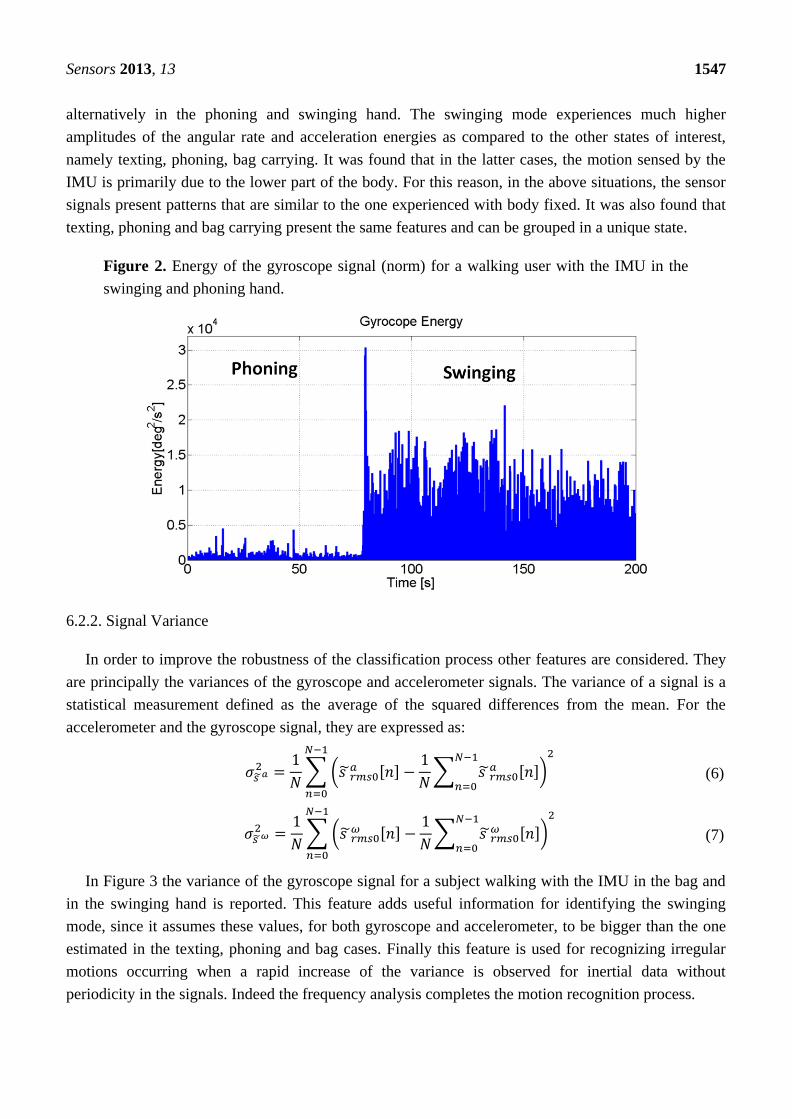
Sensors 2013, 13 1547
alternatively in the phoning and swinging hand. The swinging mode experiences much higher
amplitudes of the angular rate and acceleration energies as compared to the other states of interest,
namely texting, phoning, bag carrying. It was found that in the latter cases, the motion sensed by the
IMU is primarily due to the lower part of the body. For this reason, in the above situations, the sensor
signals present patterns that are similar to the one experienced with body fixed. It was also found that
texting, phoning and bag carrying present the same features and can be grouped in a unique state.
Figure 2. Energy of the gyroscope signal (norm) for a walking user with the IMU in the
swinging and phoning hand.
6.2.2. Signal Variance
In order to improve the robustness of the classification process other features are considered. They
are principally the variances of the gyroscope and accelerometer signals. The variance of a signal is a
statistical measurement defined as the average of the squared differences from the mean. For the
accelerometer and the gyroscope signal, they are expressed as:
(6)
(7)
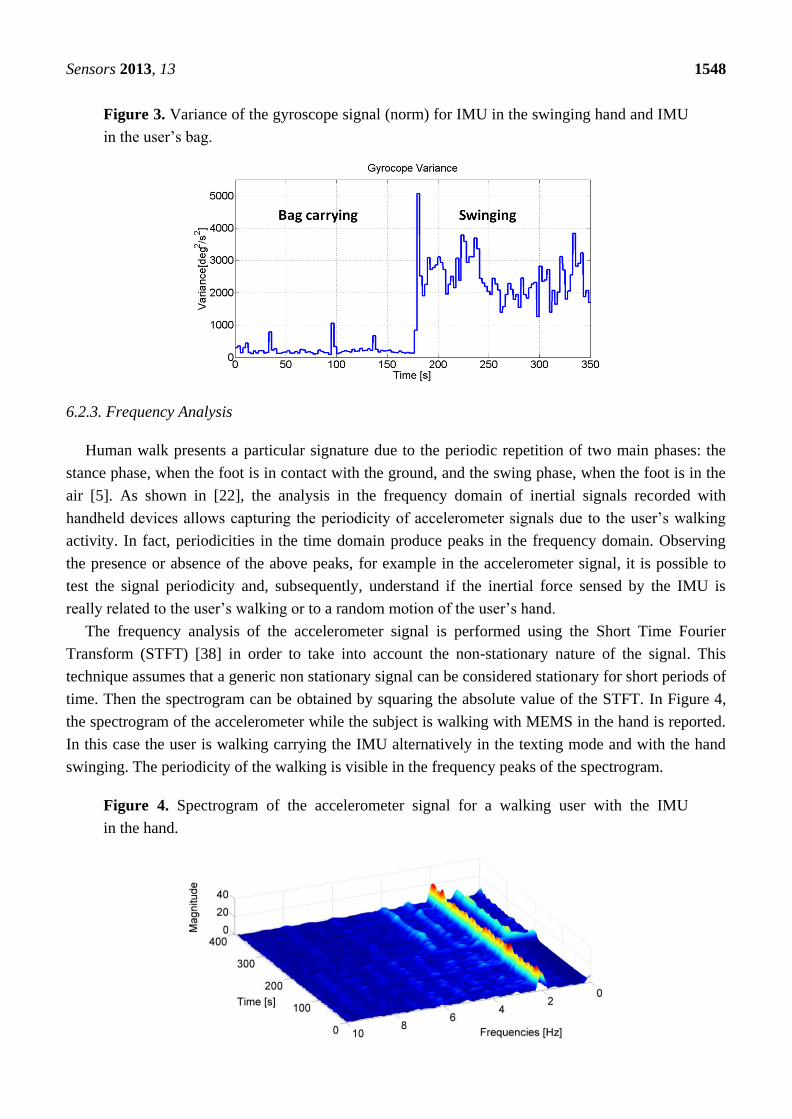
In Figure 3 the variance of the gyroscope signal for a subject walking with the IMU in the bag and
in the swinging hand is reported. This feature adds useful information for identifying the swinging
mode, since it assumes these values, for both gyroscope and accelerometer, to be bigger than the one
estimated in the texting, phoning and bag cases. Finally this feature is used for recognizing irregular
motions occurring when a rapid increase of the variance is observed for inertial data without
periodicity in the signals. Indeed the frequency analysis completes the motion recognition process.
Sensors 2013, 13 1548
Figure 3. Variance of the gyroscope signal (norm) for IMU in the swinging hand and IMU
in the user’s bag.
6.2.3. Frequency Analysis
Human walk presents a particular signature due to the periodic repetition of two main phases: the
stance phase, when the foot is in contact with the ground, and the swing phase, when the foot is in the
air [5]. As shown in [22], the analysis in the frequency domain of inertial signals recorded with
handheld devices allows capturing the periodicity of accelerometer signals due to the user’s walking
activity. In fact, periodicities in the time domain produce peaks in the frequency domain. Observing
the presence or absence of the above peaks, for example in the accelerometer signal, it is possible to
test the signal periodicity and, subsequently, understand if the inertial force sensed by the IMU is
really related to the user’s walking or to a random motion of the user’s hand.
The frequency analysis of the accelerometer signal is performed using the Short Time Fourier
Transform (STFT) [38] in order to take into account the non-stationary nature of the signal. This
technique assumes that a generic non stationary signal can be considered stationary for short periods of
time. Then the spectrogram can be obtained by squaring the absolute value of the STFT. In Figure 4,
the spectrogram of the accelerometer while the subject is walking with MEMS in the hand is reported.
In this case the user is walking carrying the IMU alternatively in the texting mode and with the hand
swinging. The periodicity of the walking is visible in the frequency peaks of the spectrogram.
Figure 4. Spectrogram of the accelerometer signal for a walking user with the IMU
in the hand.

Sensors 2013, 13 1549
In order to better analyse how these frequency peaks change over time, the three main frequencies,
obtained by evaluating the first three maxima in the spectrogram, are reported over time. The estimated
three dominant frequencies for a pedestrian test are reported in Figure 5 and are now further analysed.
Figure 5. Dominant frequencies of the accelerometer signal over time. The IMU is carried
in the user’s hand.
When the user is walking, the first two frequencies are almost stationary since the user is not
significantly changing speed. However when the user is performing an irregular motion, i.e., he is
looking for his mobile phone in a bag, the two main frequencies show a very irregular trend. In
opposition, when the user is static the frequencies are almost equal to zero. As illustrated, the
frequency analysis can be used to distinguish irregular motion modes from normal walking. Similar
analysis is also performed on the gyroscope’s signal while the subject is walking with a swinging hand.
In fact, during hand swing a periodic rotation of the arm is observed in the gyroscope signal inducing
evident peaks in the frequency domain and that would not be observed when the subject is texting or
phoning. Subsequently, the presence of the above peaks can help distinguishing between different
sensor carrying modes. Indeed as shown in Figure 6, for the texting cases and in opposition to the
swinging mode, no frequency peak is present except in the case when the user is making a rapid
change of direction.
Figure 6. Spectrogram of the gyroscope signal for a walking user. The IMU is alternatively
carried in the texting and swinging hand of the user.
Sensors 2013, 13 1550
6.3. Decision Making
In general a classification process can be considered as a mapping function [34] that given an input
pattern characterized by a set of d features, assigns each feature vector to one of n
possible classes . In our case, the features are the attributes defined in Section 6.1 and
the classes are the user’s motion modes.
Classifier algorithms are traditionally divided in two groups:
Supervised classifier: the labelled data, whose class is known, is used to train the classifier and
then to assign unlabeled data to one of the known classes.
Unsupervised classifier: here the classes are not known a priori but are defined when the
classification is completed, this is the case, for example, of the clustering classification.
For the proposed classification algorithm using handheld MEMS signals, the classes and their
characteristics are defined during the classifier’s design process and a supervised approach has been
adopted. The classification of the user’s state is performed by a decision tree classifier. The effectiveness
of the decision tree classifier for motion mode recognition has been shown previously [22,33].
A decision tree is a non-parametric classifier with the form of a tree whose leaves consist of all the
possible classes. In correspondence of each tree’s internal node a test regarding one (univariate
decision tree) or more features (multivariate decision tree) is specified. Traversing the decision tree
from the root to the leaves, any input observation can be classified. The multivariate decision tree,
shown in Figure 7, initially distinguishes static and dynamic activities using an approach that evaluates
the energies and variances of gyroscope and accelerometer signals [33]. The periodicities of the
accelerometer signal reflect the periodicities of human gait allowing recognition of the walking state.
Subsequently, the gyroscope measurements are evaluated to identify walking with a swinging hand. In
fact, due to the periodic rotation of the arm during the swinging mode, the gyroscope signal shows
frequency peaks that are not present when the arm is almost stationary. In addition, high values of the
gyroscope and accelerometer variances induced by the motion of the arm, characterize the swinging
mode. Conversely, when the user is texting, phoning or walking with his/her mobile device in a bag,
the arm is not moving significantly and the IMU experiences low energies and variances. The latter
cases show a similar pattern for both accelerometer and gyroscope signals. Consequently, for
adequately tuning the step detection algorithm proposed in Section 7, the mentioned motion modes can
be considered as a unique class, as shown in Figure 7. However, it is worth mentioning that for other
aims, beyond the focus of this paper, it could be of interest to assign the above motion modes to
different classes. For example, different device’s carrying modes, such as texting and phoning, can
strongly influence the orientation information provided by the handheld sensor and, consequently, the
distinction of these two states could improve the heading estimation. Finally, irregular motion modes
are identified analyzing the IMU signal’s variance. In fact the above class is characterized by very high
values of the gyroscope and accelerometer variances in short temporal periods.
1 2 d= f , f ,..., ff
1 2 n= c ,c ,..., cc

Sensors 2013, 13 1551
Figure 7. Decision tree for motion mode classification.
7. Step Detection Algorithm
Once the pedestrian motion mode is identified, it is of interest to track effective displacements by
detecting steps for a pedestrian dead-reckoning navigation strategy. Indeed contrary to strapdown
filtering, dead-reckoning is less sensitive to the errors inherent to low cost inertial sensors but
dependant to the correct detection rate of step events. Therefore the next step toward handheld based
navigation using embedded inertial sensors consists in detecting the steps performed by the user. When
the sensor is placed on the user’s foot, step detection can easily be performed by identifying the stance
phases of the foot corresponding to zero velocity periods. This approach cannot be applied when the
sensor is in the hand since in this case there isn’t any period of zero velocity. However, bio-mechanic
studies (e.g., [39]) show that the swinging of the arm is synchronized with the foot motion. Thanks to
this relationship between arm’s motion and foot’s motion, from the swing of the subject’s arm the step
events can be detected. In fact, the periodic rotation of the arm produces an evident sinusoidal pattern
in the gyroscope signal. Consequently, identifying the peaks of the gyroscope signal, the proposed
algorithms are able to detect the up and forward motions of the user’s hand and the synchronized
swing phase of the user’s foot.
During activities, such as walking on a straight line while texting a message, phoning or carrying
the mobile phone in the bag, the signal recorded by the gyroscope is mainly due to the noise
components and to random motions of the hand. Therefore gyroscope signals provide less useful
information about the motion of the subjects and tend to perturb the detection of step events. In these
cases only the accelerometer signals are used in the step detection algorithm. In fact, in these situations
the accelerometer signal shows also a sinusoidal pattern due to the up and down motion of the
subject’s torso. In both cases, step detection can be considered as a peak detection problem. In this

Sensors 2013, 13 1552
paper, signal peak detection is performed by recognizing a local maximum or minimum within the
sliding window and using an algorithm based on adaptive thresholds. The use of adaptive threshold
renders the peak detection algorithm immune to variations of the signal energy and consequently to
any change of the user’s pace.
In addition, for minimizing the probability of false detection a dedicated pre-processing phase of
IMU signals is first performed. Similar to preceding pre-filtering, accelerometer and gyroscope signals
are low-pass filtered using a 10th order Butterworth filter with a 3 Hz cut-off frequency. The purpose
of above pre-processing phase is to extract the signal’s fundamental frequency that is induced by step
events only and therefore only from an undistorted signal. Then the algorithm evaluates the maximum
value within the sliding window that is assumed as a threshold value for the peak detection. In other
words, if a sample in the window experiences a bigger value than the evaluated mean, a peak is
identified In the upper part of Figure 8, the norm of the gyroscope signal recorded by the IMU in the
swinging hand of the user is reported and the bottom part shows the norm of the acceleration signals
recorded on the foot. Signals recorded in the hand and on the foot are synchronised.
Figure 8. (Upper) Gyroscope signal (norm) recorded by the IMU in the swinging hand.
The dots represent the detected step events. (Down)Accelerometer signal (norm) recorded
by the IMU on the foot (the mean has been removed).
The magenta dots mark the minima extracted from the signal. From the comparison between the
signals recorded in the hand and on the foot, it is clear that these minima are directly related to the
stride events that have been identified from the accelerometer signals recorded by the IMU on the
user’s foot. Indeed each minimum corresponds to a step event and subsequently for each couple of
minimum points a stride can be identified. In Figure 9 (upper part), the norm of accelerometer signals
recorded by the IMU in the texting hand is reported. Again in this case the magenta dots identify
the minimum values of the signal that are related to the step events in the same way as for the
swinging case.

Sensors 2013, 13 1553
Figure 9. (Upper) Accelerometer signal (norm) recorded by the IMU in the texting hand.
The dots represent the detected step events. (Down) Accelerometer signal (norm) recorded
by the IMU on the foot (the mean has been removed).
8. Field Tests
Several tests have been conducted in order to obtain a sufficient amount of data for the training and
the testing phases of the designed and implemented motion mode detector. In addition, using a
reference that is extracted from foot mounted IMU data, the performance of the step detection
algorithm was also assessed. The data collections were performed using the Navcube, a multi-sensor
navigation platform including a Novatel receiver and able to support up to 10 six-degree of freedom
Analog Devices ADIS16375 inertial sensors [40]. All data are synchronised with GPS time and
therefore can be used for comparative analyses. For the data collections at least two IMUs were used,
one in the hand and one rigidly attached to the user’s foot as shown in Figure 10.
Figure 10. IMU attached on the foot and used as a reference for step detection assessment.

Sensors 2013, 13 1554
The wires connecting the NavCube to the inertial sensors were firmly fixed to the user’s body in
order not to disturb the user’s motion and keep natural walking gait cycles. The sensor on the user’s
foot was used as reference for assessing the performance of the proposed algorithms using handheld
IMUs. ―True‖ pedestrian’s gait cycle was characterized using moving variances on the norm of the
foot mounted accelerometer’s signal [5]. Even if the identification of the stances phases of the foot by
using foot mounted sensor is not immune by errors, these errors can be neglected with good
approximation when the user is performing a normal walk on a flat plane. A first data collection was
performed indoor for obtaining the data required for the training phase of the motion mode classifier.
Two women and two men were equipped with the above hardware setup and walked along two curved
routes of about 50 and 120 metres each. The subjects were requested to walk with swinging hand, then
texting, phoning and carrying the IMU in a bag. Finally the subjects were requested to simulate a
phone call. The users started walking with the IMU in the bag, answered a phone call while walking
and then putted back the IMU in the bag. All performed motions were registered annotating the exact
time of occurrence for each motion mode. This set of data was used for the training of the thresholds
reported in Figure 7 in correspondence to each node of the classification decision tree. Then, two
different types of field tests were performed for the algorithms assessment, namely a ―free motion‖
data collections where the subjects could freely chose the sequence of motions to be performed and a
second field test where the subjects were instructed regarding the sequence of motions. The data
collections performed for the assessing stage are described in Sections 8.1 and 8.2.
8.1. “Free Motion” Data Collection
The ―free motion‖ data collection was performed in a parking lot with four different subjects, two
men and two women. This environment was selected to use the GPS data as reference for the user
travelled path. However, it is worth underlining that since the algorithms here proposed are only based
on accelerometer/gyroscope data the same performances would be obtained indoor. As shown in
Figure 11, the test subjects, equipped with the same hardware used for the training phase, were
requested to perform a free motion. Practically, pedestrians were walking over a distance of about
300 metres freely carrying the IMU in their hand without following instructions about the sensor’s
orientation and freely choosing one among the carrying modes described in Section 5. This ―free
motion‖ data collection was performed with the purpose to test a realistic situation. The subjects were
nevertheless requested to perform all considered motion modes. Again the time of occurrence of each
motion mode was carefully annotated. This last data set was used to test the performance of the motion
mode classifier reported in Section 6.
8.1.1. Motion Mode Classifier Performance
The performances of the motion mode detector are summarized in the confusion matrix given in
Table 1. The rows of the confusion matrix report the performed activities while the columns report the
predicted activities. Along the principal diagonal of the confusion matrix, the accuracy (in light blue),
i.e., that is the percentage of correctly classified samples, is reported for each motion mode. Instead
along the off diagonal elements the percentages of misclassified activities are reported (in green). The
percentage of occurrence for each motion mode is also reported.

Sensors 2013, 13 1555
Figure 11. Handheld data collection setup. One IMU is located in the hand and the other
one is rigidly attached to the foot. Data is recorded by the NavCube placed in the user’s
backpack.
Table 1. Confusion matrix for the motion mode classifier in the “free motion‖ data collection.
Activity Classified as:
Swinging Texting/Phoning/Bag Irregular motion
Occurrence 42% 53% 5%
Swinging 95% 2% 3%
Texting/Phoning/Bag 1% 98% 3%
Irregular motion 6% 0% 94%
Globally the proposed motion mode recognition algorithm based on signals collected with handheld
IMU classifies the activity in the correct category more than 94% of the time no matter what activity is
performed by the pedestrian.
The percentage of irregular motions detection is equal to 94%. As previously explained, when an
irregular motion is identified the step detection algorithm is not applied, since this state does not
correspond to a real change of geographical user position. Consequently, the identification of this class
is essential to avoid wrongly propagating the user’s position leading to unbounded position errors in
any PDR algorithm. However, from Table 1, one can observe that 6% of irregular motions are wrongly
classified as swinging motion. The explanation comes from the fact that swinging and irregular
motions have the closest features, therefore when irregular motion happens during hand swing, it may
be miss detected. The analysis of the periodicities of the gyroscope signal for both motion modes
allows reducing this ambiguity in most of the cases. Indeed one motion mode is periodic whereas the
other is expected to be random. In these 6%, the step detection will still be applied in case where it
Sensors 2013, 13 1556
should not. The consequence is that false steps might be detected, leading to non-existing
displacement. However the step detection algorithm described in Section 7 relies on adaptive
thresholds that will mitigate this impact. The error induced in the PDR navigation solution will be
proportional to the amount of false detected steps.
Moreover, 3% of swinging cases and 3% of texting/phoning/bag carrying cases are wrongly
identified as irregular motion. Such miss classifications will also affect the propagation of the user
position, since in these cases the step detection algorithm will not be applied, keeping the navigation
solution unchanged instead of potentially moving few steps. Again the error will be proportional to the
amount of miss-detected steps.
Globally the test confirms that the identification of an irregular motion state with a handheld device
is the most challenging task but also a critical point for achieving good performance in inertial PDR
navigation. Indeed, the kinds of irregular motions performed by the user are unpredictable and various,
rendering their identification a difficult task. Further investigations could be performed to reduce this
misclassification percentage by increasing the types of irregular motions analyzed in the training
phase. For the texting/phoning/bag modes, it has been observed that the majority of misclassifications
occurred when the pedestrian was changing direction.
When the swinging case is wrongly identified as a texting, phoning or bag carrying case, the step
detection algorithm is still applied but by exploiting the accelerometer signal instead of the gyroscope
signal. Although it has been empirically found that gyroscope measurements constitute a more robust
information source for detecting steps in the swinging case, the accelerometer signal still allows the
identification of step events. The accuracy gets slightly reduced especially in the presence of irregular
motions. Conversely, the probability of error in the step detection algorithms and consequently in the
final position computation could increase if the swing state is identified instead of the texting, phoning,
or back carrying state. In these cases, the step detection algorithm could be applied to the angular rates
providing potential noisy information unrelated to the user gait events.
Overall the observed maximum percentage of motion state misclassification is 6%. For a 10-minute
walk, this corresponds to 36 miss or false detected gait cycles with a two-step per second frequency.
The maximum induced localization error is 7.2% of the travelled distance with a 1.2 m/s average
walking speed. However this number is overstated since the step detection algorithm is still able to
successfully detect steps when misclassification of motion state occurs, as previously discussed.
Finally, it should be considered that carrying the NavCube in a backpack and the sensor mounted on
the user’s foot could affect the characteristics of the analysed motion modes and, subsequently,
condition the motion mode recognition process. For this purpose, a specific test has been conducted
using only a handheld inertial sensor. This analysis has allowed observing that the only motion mode
affected by the test equipment is walking with the sensor in the swinging hand. Specifically, in some
cases the amplitude of the arm’s swing is decreased when the user carries the backpack with the test
equipment. However, also in these cases the gyroscope’s variance is significantly bigger than the one
induced by other motion modes and, subsequently, the performance of the motion mode classifier is
not affected.

Sensors 2013, 13 1557
8.1.2. Step Detection Algorithm Performance
The data collected have been also used to assess the proposed algorithms for detecting steps using
inertial signals collected with handheld MEMS. Several statistics have been extracted by comparing
the step events detected from handheld device with the ones from the foot mounted IMU. All results
are summarized in Table 2.
Table 2. Step detection algorithm performance for the ―free motion data collection‖.
Step in… …hand swinging …texting …phoning …bag
Occurrence 42% 25% 20% 8%
Pdet 99% 100% 99% 97%
Pfa 1% 0% 0% 1%
Pmd 1% 0% 1% 3%
The probability of detection (Pdet), the probability of false alarm (Pfa) and the probability of miss
detection (Pmd) have been evaluated. The probability of detection reflects the percentage of correctly
identified samples as compared with the reference from the foot. The probability of false alarm gives
the percentage of incorrectly identified samples. The probability of miss detection is given by the
percentage of samples that are missed. The percentage of occurrence of each motion mode is also
reported. The results for each motion mode are summarized in Table 2 where we can see that for each
motion mode the performance of the algorithm is higher than 98%.
It is important to highlight that the adaptivity of the algorithms to the identified motion mode
renders the performances of step detection process nearly immune to the nature of the action
performed by the pedestrian both in terms of global locomotion and hand’s motion.
8.2. “Controlled” Data Collection
To further confirm the validity of the algorithms another extensive data collection has been
performed. This time the subjects were required to perform the activities in a specific sequence. In
order to increase the robustness of the classification assessment, the subjects used for this data
collection were different from the ones who performed the free data collection described in Section 8.1.
Specifically, five women and five women carrying again the Navcube at the waist, with one sensor on
the foot and one in the hand, walked twice along a route of around 300 m, for a total path length of
about 600 m. The same number of male and female subjects was chosen for testing the effectiveness of
the algorithms regardless of gender. As shown in Figure 11, in the first route, the user had to walk
carrying the sensor in swinging mode while during the second route the subjects were asked to keep
the sensor in texting mode. The sequence of motions to be performed has been a priori defined in order
to allow a consistent comparison of the results obtained for all subjects. However, in order to maintain
the scenario realistic each test subject could perform the considered motion in the preferred way.
Indeed, again any indication was given about the sensor orientation and, for example, the subjects
could choose if perform the texting mode using one or both hands.

Sensors 2013, 13 1558
Figure 11. (Left) Test subject walking with the IMUs in his swinging hands; (Right) Test
subject walking with the IMUs in his texting hands.
Furthermore, the texting mode is representative also of the phoning and bag carrying states, since
all these modes have been included in unique class, as detailed in Section 6. The subjects were
performing the two modes without stopping in order to do not affect their natural walking style.
Finally, the same number of female and male subjects was selected in order to guarantee the
effectiveness of the algorithm regardless of walking characteristics related to the gender of the subject.
The performance of the motion mode classifier for this data collections have been reported in Table 3.
Again the high probabilities of correct motion identification are reported along the principal diagonal
(in light blue). Also for this test the probabilities of misclassification, shown by the off diagonal
elements (in green), are very low. Moreover, in Table 4 the performance of the motion mode detector
and the step identification algorithms are reported for each test subject. The male subjects are indicated
with the letter M and the women with the W. The algorithms achieve high performance regardless of
the sensor position for all 10 subjects.
Table 3. Confusion matrix for the ―controlled‖ data collection [13].
Test Motions Classified as:
Texting Swinging Irregular
Texting 100% 0% 0%
Swinging 0% 98% 2%

Sensors 2013, 13 1559
Table 4. Step detection algorithm performance for the ―controlled‖ data collection [13].
Subject %Pdet (motion) %Pdet (steps)
M1 100 99
M2 100 100
M3 99 100
M4 100 99
M5 100 100
W1 98 97
W2 100 100
W3 98 99
W4 100 98
W5 100 100
Mean 99.6 99.2
9. Conclusions
Algorithms for characterizing the gait of pedestrian using accelerometer and gyroscope signals
recorded in a handheld device have been developed and presented. They consist of two parts. First the
motion mode, both in terms of global locomotion but also hand motion, is identified. Second step
events are detected. For improving the robustness of step detection in a context where the hand is
undergoing a lot of motion, a priori knowledge about the user’s motion state is used. For this purpose,
before detecting step events, a decision tree classifier able to recognize several motions, including
phoning texting and walking with swinging hand is applied. Moreover, an important state corresponding
to irregular motion that is often ignored in motion classification algorithms using handheld IMUs has
been investigated. This state is of particular interest as it does not contribute to the pedestrian
displacement. For the purpose of motion classification, several features in the frequency and time
domains have been extracted from the tri-axis accelerometer and tri-axis gyroscope signals. Novel step
detection algorithms using handheld device and their capacity of adapting to the detected motion mode
have been presented. Experimental tests using MEMS sensors, conducted with four test subjects for
the training phase and four other test subjects for the final assessment show a percentage of correct
classification above 95% and of correct step event detection above 97% for all motion modes here
considered. The step events extracted using the proposed algorithm together with a step length model
allow propagating the user position by applying a PDR algorithm for handheld devices [13]. These
results open new research options toward free-inertial tracking of pedestrian using handheld inertial
sensors, which are already widely embedded in smartphones nowadays.
Acknowledgments
The financial support of Research In Motion (RIM), the Natural Science and Engineering Research
Council of Canada, Alberta Advanced Education and Technology and Western Economic
Diversification Canada is acknowledged. The authors wish to thank Aiden Morrison for the design and
the realization of the NavCube and for his kind help during the field tests. Finally, thanks are due to
Haris Afzal for his support during the data collections and to all test subjects for their important
contribution to this work.

Sensors 2013, 13 1560
References
1. Titterton, D.H.; Weston, J.L. Strapdown Inertial Navigation Technology, 2nd ed.; The Institution
of Electrical Engineers: Stevenage, UK, 2004.
2. Beauregard, S. Omnidirectional Pedestrian Navigation for First Responder. In Proceedings of the
4th Workshop on Positioning, Navigation and Communication, Hannover, Germany, 22 March
2007; pp. 33–36.
3. Godha, S.; Lachapelle, G; Cannon, M.E. Integrated GPS/INS System for Pedestrian Navigation in
a Signal Degraded Environment. In Proceedings of the 19th International Technical Meetings of
the Satellite Division of the Institute of Navigation, Forth Worth, TX, USA, 26–29 September
2006, pp. 2151–2164.
4. Foxlin, E. Pedestrian tracking with shoe-mounted inertial sensors. IEEE Comput. Graph. Appl.
2005, 25, 38–46.
5. Skog, I.; Händel, P.; Nilsson, J.O.; Rantakokko, J. Zero-velocity detection—An algorithm
evaluation. IEEE Trans. Biomed. Eng. 2010, 57, 2657–2665.
6. Bancroft, J.B.; Afzal, M.H.; Lachapelle, G. High Performance GNSS Augmented Pedestrian
Navigation in Signal Degraded Environments. In Proceedings of the International Global
Navigation Satellite Systems Society (IGNSS) Symposium, Sydney, Australia, 15–17 November
2011.
7. Alvarez, D.; Gonzalez, R.C.; Lopez, A.; Alvarez, J.C. Comparison of Step Length Estimators
from Wearable Accelerometer Devices. In Proceedings of 28th Annual International Conference
on IEEE Engineering in Medicine and Biology Society, New York, NY, USA, 30 August–3
September 2006; pp. 5964–5967.
8. Jahn, J.; Batzer, U.; Seitz, J.; Patino-Studencka, L.; Boronat, J.G. Comparison and Evaluation of
Acceleration Based Step Length Estimators for Handheld Devices. In Proceedings of IEEE 2nd
Conference on Indoor Positioning and Indoor Navigation, Zurich, Switzerland, 15–17 September
2010; pp. 1–6.
9. Kourogi, M; Ishikawa, T; Kurata, T. A Method of Pedestrian Dead Reckoning Using Action
Recognition. In Proceeding of PLANS 2010, Indian Wells, CA, USA, 4–6 May 2010; pp. 85–89.
10. Kourogi, M.; Kurata, T. Personal Positioning Based on Walking Locomotion Analysis with
Self-Contained Sensors and a Wearable Camera. In Proceedings of the Second IEEE and ACM
International Symposium, 7–10 October 2003; pp. 103–112.
11. Steinhoff, U.; Schiele, B. Dead Reckoning from the Pocket—An Experimental Study. In
Proceedings of 2010 IEEE International Conference on Pervasive Computing and
Communications (PerCom), Mannheim, Germany, 29 March–2 April 2010; pp. 162–170.
12. Bylemans, M; Weyn, M; Klepal, M. Mobile Phone-Based Displacement Estimation for
Opportunistic Localisation Systems. In Proceedings of the 2009 Third International Conference
on Mobile Ubiquitous Computing, Systems, Services and Technologies, Sliema, Malta, 11–16
October 2009; pp. 113–118.
13. Gusenbauer, D.; Isert, C.; Krosche, J. Self-Contained Indoor Positioning on Off-The-Shelf Mobile
Devices. In Proceedings of IEEE 2nd Conference on Indoor Positioning and Indoor Navigation,
Zurich, Switzerland, 15–17 September 2010; pp. 15–17.
Sensors 2013, 13 1561
14. Hide, C.; Moore, T.; Botterill, T. Low cost vision aided IMU for pedestrian navigation. J. Glob.
Position. Syst. 2011, 10, 3–10.
15. Ruotsalainen, L.; Bancroft, J; Kuusniemi, H; Lachapelle, G; Chen, R. Utilizing Visual
Measurements for Obtaining Robust Attitude and Positioning for Pedestrians. In Proceedings of
GNSS12 , Nashville, TN, USA, 18–21 September 2012; pp. 2454–2461.
16. Altun, K; Barshan, B. Pedestrian dead reckoning employing simultaneous activity recognition
cues. Measur. Sci. Technol. 2012, 23, 1–20.
17. Tunçel, O.; Altun, K.; Barshan, B. Classifying human leg motions with uniaxial piezoelectric
gyroscopes. Sensors 2009, 9, 8508–8546.
18. Zhu, C; Sheng, W. Recognizing Human Daily Activity Using a Single Inertial Sensor. In
Proceedings of the 8th World Congress on Intelligent Control and Automation (WCICA),
Stillwater, OK, USA, 7–9 July 2010; pp. 282–287.
19. Olivares, A.; Ramírez, J.; Górriz, J.M.; Olivares, G.; Damas, M. Detection of inactivity periods
in human body motion using inertial sensors: A comparative study. Sensors 2012, 12, 5791–5814.
20. Mathie, M.J.; Coster, A.C.F.; Lovell, N.H; Celler, B.G. Accelerometry: Providing an integrated,
practical method for longterm, ambulatory monitoring of human movement. Physiol. Measur.
2004, 25, 1–20.
21. Bancroft, J.; Garrett, D; Lachapelle, G. Activity and Environment Classification Using Foot
Mounted Navigation Sensors. In Proceedings of International Conference on Indoor Positioning
and Indoor Navigation, Sydney, Australia, 13–15 November 2012.
22. Susi, M.; Borio, D.; Lachapelle, G. Accelerometer Signal Features and Classification Algorithms
for Positioning Applications. In Proceedings of International Technical Meeting of Institute of
Navigation, San Diego, CA, USA, 24–26 January 2011.
23. Mannini, A.; Sabatini, A.M. Machine learning methods for classifying human physical activity
from On-Body accelerometers. Sensors 2010, 10, 1154–1175.
24. Altun, K.; Barshan, B; Tuncel, O. Comparative study on classifying human activities with
miniature inertial and magnetic sensors. Pattern Recogn. 2010, 43, 3605–3620.
25. Kononen,V; Mantyjarvi, J; Simila, H; Parkka, J; Ermes, M. Automatic feature selection for
context recognition in mobile devices. Pervasive Mob. Comput. 2010, 6, 181–197.
26. Yang, J.; Lu, H.; Liu, Z.; Boda, P.P. Physical activity recognition with mobile phones: challenges,
methods, and applications. Multimedia Interact. Intell. User Interfaces Adv. Patt. Recogn. 2010,
doi:10.1007/978-1-84996-507-1_8.
27. Susi, M; Gait Analysis for Pedestrian Navigation Using MEMS Handheld Devices. M.S. Thesis,
Department of Geomatics Engineering, the University of Calgary, Calgary, AB, Canada, 2012.
28. Reddy, M; Mun, J; Burke, D; Estrin, M; Hansen, Srivastava, M. Using mobile phones to
determine transportation modes. ACM Trans. Sen. Netw. 2010, 6, 1–27.
29. Stenneth, L.; Wolfson, O.; Yu, P.S.; Xu, B. Transportation Mode Detection Using Mobile Phones
and GIS Information. In Proceeding of ACM SIGSPATIAL GIS „11, Chicago, IL, USA, 1–4
November 2011; pp. 54–63.
30. Pei, L.; Liu, J.; Guinness, R.; Chen, Y.; Kuusniemi, H.; Chen, R. Using LS-SVM based motion
recognition for smartphone indoor wireless positioning. Sensors 2012, 12, 6155–6175.

Sensors 2013, 13 1562
31. Kamisaka, D; Muramatsu, S; Iwamoto, T; Yokoyama, H. Design and implementation of
pedestrian dead reckoning system on a mobile phone. IEICE Trans. 2011, 94, 1137–1146.
32. Renaudin, V.; Susi, M.; Lachapelle, G. Step length estimation using handheld inertial sensors.
Sensors 2012, 12, 8507–8525.
33. Susi, M.; Renaudin, V.; Lachapelle, G. Quasi-Static Detection from MEMS Handheld Devices.
In Proceedings of the International Conference on Indoor Positioning and Navigation (IPIN),
Guimarães, Portugal, 21–23 September 2011.
34. Jain, K. Statistical pattern recognition: A review. IEEE Trans. Patt. Anal. Mach. Intell. 2000, 22,
4–37.
35. Mathie, M.J. Monitoring and Interpreting Human Movement Patterns Using a Triaxial
Accelerometer. Ph.D. Thesis, University of New South Wales, Sydney, Australia, 2003.
36. Kantola, M.; Perttunen, M.; Leppanen, T.; Collin, J.; Riekki, J. Context Awareness for
GPS-Enabled Phones. In Proceedings of ION Technical Meeting, Manassas, VA, USA, 25–27
January 2010; pp. 117–124.
37. Dargie, W. Analysis of Time and Frequency Domain Features of Accelerometer Measurements.
In Proceeding of the 3rd IEEE Workshop on Performance Modeling and Evaluation of Computer
and Telecommunication Networks (PMECT 2009), San Francisco, CA, USA, 2–6 August 2009.
38. Cohen, L. Time Frequency Analysis: Theory and Applications; Prentice Hall, Inc.: Upper Sadle River,
NJ, USA, 1995.
39. Park, J. Synthesis of natural arm swing motion in human bipedal walking. J. Biomech. 2008, 41,
1417–1426.
40. Morrison, A.; Renaudin, V.; Bancroft, J.B.; Lachapelle, G. Design and testing of a multi-sensor
pedestrian location and navigation platform. Sensors 2012, 12, 3720–3738.
© 2013 by the authors; licensee MDPI, Basel, Switzerland. This article is an open access article
distributed under the terms and conditions of the Creative Commons Attribution license
(http://creativecommons.org/licenses/by/3.0/).


![[1] sensors-13-16146](https://static.fdocuments.net/doc/165x107/577c7d011a28abe0549cf761/1-sensors-13-16146.jpg)