
Sensor Introduction - Acconeer Developer
27
Sensor Introduction
Transcript of Sensor Introduction - Acconeer Developer

Sensor Introduction

Contents
1 Welcome! 31.1 Radar basics and the Acconeer pulsed coherent radar . . . . . . . . . . . 31.2 The Acconeer offer . . . . . . . . . . . . . . . . . . . . . . . . . . . . . . . 51.3 The Acconeer tools . . . . . . . . . . . . . . . . . . . . . . . . . . . . . . . 8
2 Services and Detectors 92.1 Services . . . . . . . . . . . . . . . . . . . . . . . . . . . . . . . . . . . . . 92.2 Detectors . . . . . . . . . . . . . . . . . . . . . . . . . . . . . . . . . . . . 13
3 System overview 143.1 Reflectivity . . . . . . . . . . . . . . . . . . . . . . . . . . . . . . . . . . . 163.2 Radar cross section . . . . . . . . . . . . . . . . . . . . . . . . . . . . . . 163.3 Typical ranges for different objects . . . . . . . . . . . . . . . . . . . . . . 173.4 Radar sensor performance metrics . . . . . . . . . . . . . . . . . . . . . . 18
4 Configuring the Acconeer sensor 204.1 Profiles . . . . . . . . . . . . . . . . . . . . . . . . . . . . . . . . . . . . . 204.2 Signal averaging and gain . . . . . . . . . . . . . . . . . . . . . . . . . . . 224.3 Sweep and update rate . . . . . . . . . . . . . . . . . . . . . . . . . . . . 234.4 Repetition modes . . . . . . . . . . . . . . . . . . . . . . . . . . . . . . . . 234.5 Power save modes . . . . . . . . . . . . . . . . . . . . . . . . . . . . . . . 234.6 Configuration summary . . . . . . . . . . . . . . . . . . . . . . . . . . . . 24
5 Physical integration aspects 24
6 Summary 26
7 Disclaimer 26
8 Document history 27

1 Welcome!
We are very happy that you have decided to have a closer look at what Acconeer’s pulsedcoherent radar technology can offer. We are working hard to give you the right tools to“Explore the Next Sense”, whether it is for remote monitoring of vital signs, smart cityIoT, robot navigation or any other imaginable sensing application where precision, size,and power consumption are key parameters. This document serves as an introductionto Acconeer’s sensor technology and product offer. The Acconeer radar system is de-scribed based on established radar theory to give you the right knowledge to integrateand configure the sensor in your product.
When starting to use the Acconeer sensor there are different alternatives for both hard-ware and software setup and we are adding more as we get to know your needs. Checkout our website to see our current offer of sensors, modules, and evaluation kits. A typicaldevelopment flow to get started is to setup one of our evaluation kits and:
• Use the Exploration Tool to get data from sensor into Python to start applicationdevelopment for your use case
• Use our Reference applications to get guidance on use case specific software so-lutions
• Use Acconeer SDK or Acconeer Module Software to start software development
To further support and guide you through the development process we also provide sev-eral user guides, data sheets, reference schematics, and reference layouts, which youcan find at acconeer.com. Also check out our demo videos and application page to getinspiration on how you can solve different use cases and how the Acconeer sensor canbe used in your application.
1.1 Radar basics and the Acconeer pulsed coherent radar
Radar is a well-established technology which has been used in many different applica-tions where accurate and robust distance measurement is required. You can find radar incars, in the process industry, in airplanes etc. However, most often these radar systemsare big, power hungry and expensive, what Acconeer offer is a way to take radar intoapplications where size, cost and power consumption matter. Radar is an acronym forRadio Detection and Ranging and is a way of determining range to an object by trans-mitting and detecting radio waves. Acconeer’s radar system is a time-of-flight system,which means that a radio wave is transmitted by a first antenna, reflected by an object,and then received by a second antenna. The time of flight between transmission andreception of the signal is measured, as illustrated in Fig. 1.1.
3

Fig. 1.1: Illustration of the pulsed coherent radar system where the time of flight is mea-sured to determine distance to object
The distance to the object can then be calculated by multiplying the time-of-flight withthe speed of the radio wave (same as speed of light) and then dividing by two as thedistance the signal has traveled is equal to two times the distance to the object. Moredetails about the radar and the Acconeer approach can be found in the chapter SystemOverview .
There are different approaches to building radar systems, each with its own pros andcons that typically results in a trade-off between accuracy and power consumption, seeFig. 1.2. At Acconeer we have solved this by combining two important features of aradar system, the first is that it is pulsed, which means that the radio part is shut downin between transmission of signals. In fact, the Acconeer radar is pulsed so fast that,typically, the radio is active less than 1 % of the time even when transmitting at maximumrate. This is how the power consumption can be kept low and optimized dependent onthe update rate required by your application.
Fig. 1.2: Pulsed coherent radar.
The second feature is that it is coherent, which means that each transmitted signal has astable time and phase reference on the pico second scale, which allows for high accuracymeasurements. Coherent radar systems usually rely on a continuous generation of theradio signal, which consumes a lot of current independent on update rate, hence one ofthe innovations Acconeer has made is to combine the benefits of pulsed systems andthe benefits of coherent systems into one product, the Pulsed Coherent Radar (PCR).The unique selling points of the PCR sensor are summarized in Fig. 1.3. The sensormakes it possible to perform high accuracy measurements while consuming very littlepower and the fast pulsing of the system makes it possible to track fast movements.
4

Fig. 1.3: Unique selling points of the Acconeer pulsed coherent radar.
Another benefit of the pulse coherent radar is that amplitude, time and phase of the re-ceived signal can be handled separately and allow for classification of different materialsthat the signal has been reflected on. These are all benefits when compared to sensorssuch as infra-red and ultrasonic. Additional benefits are that the Acconeer radar can behidden behind colored plastic or glass and hence do not need an open or visible aper-ture, we call this optimized integration. The sensor is also robust as it is not sensitive toambient light or sound and not sensitive to dust or even color of the object.
1.2 The Acconeer offer
The Acconeer offer consists of two parts, hardware and software, as illustrated in Fig. 1.4.In addition, Acconeer also provides various tools to aid the customer in the developmentprocess.
The A111 sensor is the core of the hardware offer and is available in modules and in eval-uation kits. The purpose of the evaluation kit is to provide a platform to get acquaintedwith the pulsed coherent radar and to start use case evaluation. The sensor evaluationkits are based on Raspberry Pi, which is a well-known and available platform which alsoallows you to connected other types of sensors. The module is an integration of theA111 and a microcontroller unit (MCU) and has its own evaluation kit. Just as the sensorevaluation kit it can be used to get familiar with the pulsed coherent radar technology andget started with use case development. It can also be included as a single unit in yourproduct to decrease your development cost and decrease time to market.
Fig. 1.5 outlines the software structure, platform for running it, and communication inter-faces. The software for controlling the A111 sensor and retrieving data from it is calledRadar System Software (RSS) and provides output at two levels:
• Service, provides pre-processed sensor data
5

Fig. 1.4: The Acconeer offer.
• Detector, provides results based on the sensor data - all Detectors are based onServices
Fig. 1.5: System structure, the RSS software runs on a host that controls the sensor.
RSS is provided as library files and is written in C and designed to be portable betweendifferent platforms, a list of currently supported processor architectures and toolchainsare available at the Acconeer developer site. Apart from RSS, Acconeer provides Exam-ple applications and stubbed software integration source code in the Software develop-ment kits (SDKs) as well as full reference integrations for selected platforms.
Acconeer provides four types of applications:
• Example applications: Example of how to use RSS, available in SDK at Acconeerdeveloper site
• Reference applications: Use case specific reference application available in SDKat Acconeer developer site
• Streaming server: Application streaming data from sensor evaluation kit to PC,
6

available in SDK for Raspberry Pi at Acconeer developer site
• Module server: Application providing a register write based interface to Acconeermodules, available in Module software image at Acconeer developer site.
Both RSS and Applications run on a host platform and Acconeer provides a softwareintegration reference with guidance on how to integrate to your host platform as well asspecific integration for the modules and evaluation kits that Acconeer provides.
• For our EVK platforms we provide a software package and for
– Raspberry Pi it includes hardware abstraction layer, device drivers, and buildenvironment provided as source code
– Modules it includes hardware abstraction layer and build environment pro-vided as source code
• For STM32 platforms we provide example integration files and instructions for howto set up a project in STM32CubeIDE.
• Other ARM Cortex M0, M4 and M7 based platform can easily be used by writinga custom implementation of the HAL integration layer. A handful functions thatuse MCU specific driver functions for accessing timers, SPI and GPIO have to beimplemented.
For more detailed information on how to implement the HAL integration layer used byRSS, there is a user guide available at acconeer.com.
Based on these deliveries it is possible for the customer to create their own integra-tion layer for any platform that uses a supported processor architecture. The currentlyavailable products and corresponding software deliveries are listed in Fig. 1.6, refer todocumentation for each specific product for further details.
Fig. 1.6: Products and software deliverables.
At acconeer.com, there are modules and SDK variants and they all contain RSS, Soft-ware integration, and Example applications. The Module software image contains RSS,software integration, and Module server. The module can be used in two different setups:
7

• Stand-alone module: The module has got no dependency on external controllers.The application is customized to a specific use case by the customer and runs onthe embedded MCU. The customers application is accessing the RSS API via asoftware interface.
• Controlled module: The module is connected to an external controller where thecustomer runs their application software. The customers are accessing the RSSAPI via a hardware interface through the module software, that provided registermapped protocol.
The two setups listed above are also illustrated in Fig. 1.7.
Fig. 1.7: Setup.
For the Stand-alone module setup the customer should use the RSS library and Softwareintegration source code provided in the corresponding SDK and build their own applica-tion on these deliveries. For the Controlled module regime, i.e. the modules designed byAcconeer, the complete software that runs on the module is delivered as an image. Thecustomer can freely select between these two options, Acconeer supports both.
1.3 The Acconeer tools
To help you to get to know the Acconeer products and get started quickly with applicationdevelopment we provide a Python based tool which consists of several scripts that givesyou access to real time data and sensor configuration to easily start developing signalprocessing for specific use cases. The scripts can also be used to graphically displaythe radar output and to investigate the reflective properties of different objects. TheExploration Tool requires that the Streaming server or Module server is installed on yoursensor evaluation kit or module evaluation kit, respectively. The Streaming Server andModule server reflects the RSS API, which helps to understand how to manage the RSSAPI in your application. The Exploration Tool is provided for all our evaluation kits andis available at Acconeer GitHub. An overview of how Exploration Tool interface softwareand hardware for the evaluation kits is presented in Fig. 1.8.
8
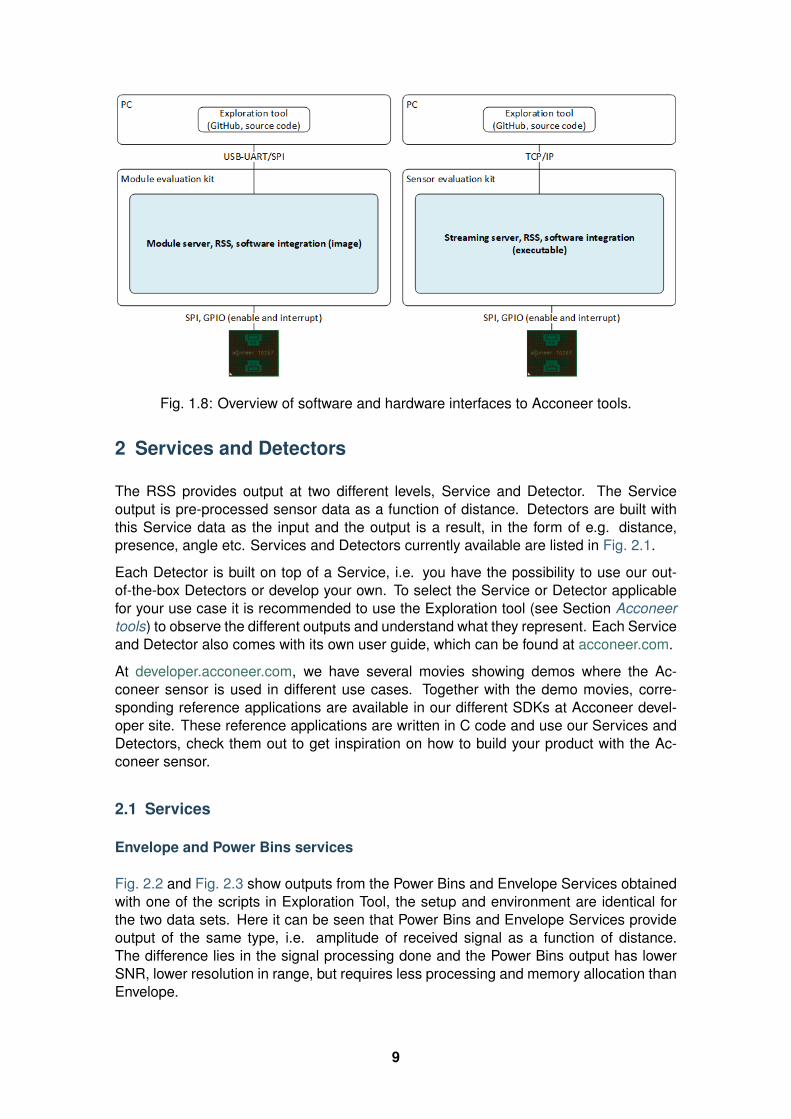
Fig. 1.8: Overview of software and hardware interfaces to Acconeer tools.
2 Services and Detectors
The RSS provides output at two different levels, Service and Detector. The Serviceoutput is pre-processed sensor data as a function of distance. Detectors are built withthis Service data as the input and the output is a result, in the form of e.g. distance,presence, angle etc. Services and Detectors currently available are listed in Fig. 2.1.
Each Detector is built on top of a Service, i.e. you have the possibility to use our out-of-the-box Detectors or develop your own. To select the Service or Detector applicablefor your use case it is recommended to use the Exploration tool (see Section Acconeertools) to observe the different outputs and understand what they represent. Each Serviceand Detector also comes with its own user guide, which can be found at acconeer.com.
At developer.acconeer.com, we have several movies showing demos where the Ac-coneer sensor is used in different use cases. Together with the demo movies, corre-sponding reference applications are available in our different SDKs at Acconeer devel-oper site. These reference applications are written in C code and use our Services andDetectors, check them out to get inspiration on how to build your product with the Ac-coneer sensor.
2.1 Services
Envelope and Power Bins services
Fig. 2.2 and Fig. 2.3 show outputs from the Power Bins and Envelope Services obtainedwith one of the scripts in Exploration Tool, the setup and environment are identical forthe two data sets. Here it can be seen that Power Bins and Envelope Services provideoutput of the same type, i.e. amplitude of received signal as a function of distance.The difference lies in the signal processing done and the Power Bins output has lowerSNR, lower resolution in range, but requires less processing and memory allocation thanEnvelope.
9

Fig. 2.1: Available Detectors and Services.
Fig. 2.2: Output from the Power Bins service in Exploration Tool. Each bin correspond toa region of the scanned range, where Bin 1 is closest to the sensor.
10
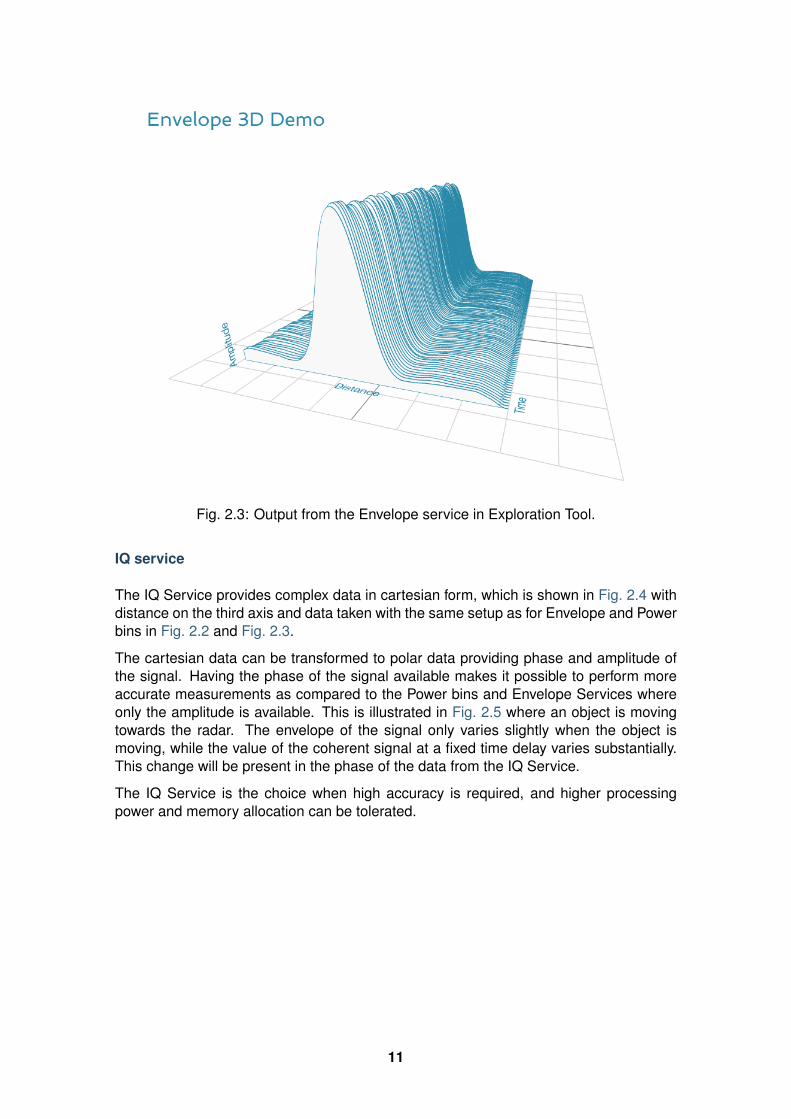
Fig. 2.3: Output from the Envelope service in Exploration Tool.
IQ service
The IQ Service provides complex data in cartesian form, which is shown in Fig. 2.4 withdistance on the third axis and data taken with the same setup as for Envelope and Powerbins in Fig. 2.2 and Fig. 2.3.
The cartesian data can be transformed to polar data providing phase and amplitude ofthe signal. Having the phase of the signal available makes it possible to perform moreaccurate measurements as compared to the Power bins and Envelope Services whereonly the amplitude is available. This is illustrated in Fig. 2.5 where an object is movingtowards the radar. The envelope of the signal only varies slightly when the object ismoving, while the value of the coherent signal at a fixed time delay varies substantially.This change will be present in the phase of the data from the IQ Service.
The IQ Service is the choice when high accuracy is required, and higher processingpower and memory allocation can be tolerated.
11

Fig. 2.4: Output from the IQ Service in Exploration Tool.
Fig. 2.5: Illustration of envelope and phase change of a received pulse for a reflectionfrom a moving object, what is returned from the IQ Service is in cartesian form.
12

Sparse service
The other services, envelope-service, iq-service, and pb-service, are all based on sam-pling the incoming waves several times per wavelength (effectively ~2.5 mm). In theSparse service, the incoming waves are instead sampled approximately every 6 cm andthe amount of processing is minimal, which makes Sparse data fundamentally differentfrom data generated by the other services.
Due to the highly undersampled signal from the sparse service, it should not be usedto measure the reflections of static objects. Instead, the sparse service should be usedfor situations, where detecting moving objects is desired. Sparse is optimal for this, asit produces sequences of very time accurate measurements at these sparsely locatedsampling points. More details here.
2.2 Detectors
Detectors take Service data as input and produce a result as the output that can be usedby the application. Currently we have four Detectors available that produce different typesof results and that are based on different Services. User guides for the different Detectorsare available at acconeer.com and the Detectors are also available in the ExplorationTool.
In addition, we provide several Reference applications which use Services or Detectorsto demonstrate how to develop applications based on our technology, you can find thesein the various SDKs at Acconeer developer site.
Distance detector
This is a distance detector algorithm built on top of the envelope-service service – basedon comparing the envelope sweep to a threshold and identifying one or more peaks inthe envelope sweep, corresponding to objects in front of the radar. The algorithm bothdetects the presence of objects and estimates their distance to the radar. More detailsabout the detector is found here.
Presence detector
Detects changes in the environment over time based on data from the Sparse service.More details about the detector is found here.
Obstacle detector
Assumes that the Acconeer sensor is placed on a moving object with a known velocity,such as a robotic vacuum cleaner or lawn mower. The detector creates a virtual antennaarray and uses synthetic aperture radar (SAR) signal processing to localize objects. Thisdetector is used in the Obstacle localization demo movie. More details about the detectoris found here.
13

3 System overview
The Acconeer sensor is a mm wavelength pulsed coherent radar, which means thatit transmits radio signals in short pulses where the starting phase is well known, asillustrated in Fig. 3.1.
Fig. 3.1: Illustration of the time domain transmitted signal from the Acconeer A111 sen-sor, a radar sweep typically consists of thousands of pulses. The length of the pulsescan be controlled by setting Profile.
These transmitted signals are reflected by an object and the time elapsed between trans-mission and reception of the reflected signal (𝑡𝑑𝑒𝑙𝑎𝑦) is used to calculate the distance tothe object by using
𝑑 =𝑡𝑑𝑒𝑙𝑎𝑦𝑣
2(3.1)
𝑣 =𝑐0√𝜀𝑟
(3.2)
where 𝜀𝑟 is the relative permittivity of the medium. The ‘2’ in the denominator of (3.1)is due to the fact that 𝑡𝑑𝑒𝑙𝑎𝑦 is the time for the signal to travel to the object and back,hence to get the distance to the object a division by 2 is needed, as illustrated in Fig. 1.1.As 𝑓𝑅𝐹 is 60.5 GHz one wavelength (𝜆) is roughly 5 mm, which then corresponds to adistance to the object of 2.5 mm.
Fig. 3.2 shows a block diagram of the A111 sensor. The signal is transmitted from theTx antenna and received by the Rx antenna, both integrated in the top layer of the A111package substrate. In addition to the mmWave radio the sensor consists of power man-agement and digital control, signal quantization, memory and a timing circuit.
Fig. 3.3 shows a typical radar sweep obtained with the Envelope Service, with one objectpresent. The range resolution of the measurement is ~0.5 mm and each data pointcorrespond to transmission of at least one pulse (depending on averaging), hence, tosweep 30 cm, e.g. from 20 cm to 50 cm as in Fig. 3.3, requires that 600 pulses aretransmitted. The system relies on the fact that the pulses are transmitted phase coherent,which makes it possible to send multiple pulses and then combine the received signalfrom these pulses to improve signal-to-noise ratio (SNR) to enhance the object visibility.
14

Fig. 3.2: Block diagram of the A111 sensor package, further details about interfaces canbe found in the A111 data sheet.
Fig. 3.3: Output from Envelope service for a typical radar sweep with one object present.
15

3.1 Reflectivity
The amount of energy received back to the Rx antenna depends on the reflectivity of theobject (𝛾), the radar cross section (RCS) of the object (𝜎), and the distance to the object(𝑅). A reflection occurs when there is a difference in relative permittivity between twomedia that the signal is propagating through. 𝛾 is then given as
𝛾 =
(︂√𝜀1 −
√𝜀2√
𝜀1 +√𝜀2
)︂2
(3.3)
where 𝜀1 and 𝜀2 is the relative permittivity, at 60 GHz, on either side of the boundary.The relative permittivity for common materials can be found in various data bases, butkeep in mind that it is frequency dependent. As an example, Table 3.1 lists approximatevalues for the real part of the relative permittivity for some common materials.
Table 3.1: Relative permittivity of common materialsMaterial Real(𝜀) at 60 GHz 𝛾 with air boundaryABS plastic 2.48 0.049Mobile phone glass 6.9 0.02Plaster 2.7 0.059Concrete 4 0.11Wood 2.4 0.046Textile 2 0.029Metal – 1Human skin 8 0.22Water 11.1 0.28Air 1 0
Table 3.1 shows that some materials are semi-transparent to 60 GHz signals and it ishence possible to detect reflecting objects behind a surface of these materials, eachboundary with a change in permittivity gives a reflection. This is a useful property inapplications where the use case requires that the sensor measures through, e.g., a wall,clothing or plastic housing.
3.2 Radar cross section
The radar cross section is the effective area of the object that the signal is reflectedagainst, for simple geometrical shapes, where the size is larger than the wavelength ofthe signal (~5 mm) and is in the far-field distance, it can be expressed analytically as inFig. 3.4. The far-field distance depends on the object size and its distance to the radarsource. Generally speaking, far-field applies when the waves reflected by the objectcan be considered plane-waves. Representative back scattering pattern of a sphere,flat plate and trihedral corner reflector are shown in the polar plots. It is seen that theobjects can have different maximum RCS, but also different radiation patterns, a flat platefor instance is very directive and if tilted away from the radar, the received energy willbe decreased, whereas the corner has less angular dependence and is a more robustreflector in terms of angle with respect to the radar.
For most objects it is not possible to analytically calculate 𝜎, instead it needs to be mea-sured or modelled.
16

Fig. 3.4: Radiation pattern and analytical expressions for simple geometrical shapes.
3.3 Typical ranges for different objects
In Table 3.2 and Table 3.3 the visibility for a range of objects with common shapes (cylin-der, plate, etc.) and of varying reflectivity, i.e. materials, is shown. Objects are at normalincidence and the governing system parameters are 𝜎, 𝛾, and C, as shown in Eq. (3.4).The envelope service was used to collect the data with Profile 2. The object counts asdistinguishable from the noise with a SNR > 10 dB (Y), barely visible between 5 dB and10 dB (-) and not visible with a SNR < 5 dB (N). The range can be further increasedbased on the configuration of the sensor, as described in Section Configuring the Ac-coneer sensor and by optimizing the physical integration, as will be described in SectionPhysical integration aspects. As an example for such an optimization Table 3.2 showsresults with an added radar Fresnel lens.
Table 3.2: Typical ranges using the envelope service andProfile 2, without radar lens.
Object 0.5 m 1 m 2 m 5 m 10 mCorner reflector (a = 4 cm) Y Y Y Y NPlanar water surface Y Y Y Y YDisc (r = 4 cm) Y Y Y Y YCu Plate (10x10 cm) Y Y Y Y YPET plastic Plate (10x10 cm) Y Y Y Y –Wood Plate (10x10 cm) Y Y – N NCardboard Plate (10x10 cm) Y Y Y N NAl Cylinder (h = 30, r = 2 cm) Y Y – N NCu Cylinder (h = 12, r = 1.6 cm) Y Y Y N NPP plastic Cylinder (h = 12, r = 1.6 cm) Y N N N NLeg Y Y – N NHand (front) Y Y N N NTorso (front) Y Y Y N NHead Y Y N N NGlass with water (h = 8.5, r = 2.7 cm) Y Y N N NPET Bottle with water (h = 14, r = 4.2 cm) Y Y N N NFootball Y Y N N N
17

Table 3.3: Typical ranges using the envelope service andProfile 2, with 7 dB radar lens.
Object 0.5 m 1 m 2 m 5 m 10 mCorner reflector (a = 4 cm) Y Y Y Y YPlanar water surface Y Y Y Y YDisc (r = 4 cm) Y Y Y Y YCu Plate (10x10 cm) Y Y Y Y YPET plastic Plate (10x10 cm) Y Y Y Y YWood Plate (10x10 cm) Y Y Y Y NCardboard Plate (10x10 cm) Y Y Y Y –Al Cylinder (h = 30, r = 2 cm) Y Y Y Y –Cu Cylinder (h = 12, r = 1.6 cm) Y Y Y Y –PP plastic Cylinder (h = 12, r = 1.6 cm) Y Y Y N NLeg Y Y Y Y NHand (front) Y Y Y N NTorso (front) Y Y Y Y NHead Y Y Y – NGlass with water (h = 8.5, r = 2.7 cm) Y Y Y – NPET Bottle with water (h = 14, r = 4.2 cm) Y Y Y N NFootball Y Y Y N N
3.4 Radar sensor performance metrics
Radar sensor performance metrics (RSPMs) for the Acconeer radar system providesuseful information on the performance of the system: sensor, RSS and reference inte-gration. The list contains the RSPMs that are applicable to services that produce radardata. However, not all RSPMs are applicable to all radar services. The RSPMs is usedin our Radar Datasheet.
Radar loop gain
The SNR can be modelled as a function of a limited number of parameters: the RCS ofthe object (𝜎), the distance to the object (𝑅), the reflectivity of the object (𝛾), and a radarsensor dependent constant referred to as radar loop gain (𝐶). The SNR (in dB) is thengiven by
SNR𝑑𝐵 = 10 log10𝑆
𝑁= 𝐶𝑑𝐵 + 𝜎𝑑𝐵 + 𝛾𝑑𝐵 − 𝑘10 log10𝑅 (3.4)
Fig. 3.5 shows how the received energy drops with increasing 𝑅 for objects where theexponent 𝑘 is equal to 4, which applies for objects which are smaller than the area whichis illuminated coherently by the radar. For objects that are larger than this area the 𝑘 issmaller than 4, with a lower limit of 𝑘 = 2 when the object is a large flat surface.
18

Fig. 3.5: Received signal power versus distance. Note: signal, S, is plotted in dB.
Depth resolution
The depth resolution determines the minimum distance of two different objects in orderto be distinguished from each other.
Distance resolution
The Acconeer radar systems are based on a time diluted measurement that splits up as avector of energy in several time bins it is important to know the bin separation. This is thedelay resolution of the system and in A111 radar sensor the target is ~3 ps on average,which corresponds to a distance resolution of ~0.5 mm between distance samples.
Half-power beamwidth
The half-power beamwidth (HPBW) radiation pattern determines the angle be-tween the half-power (-3 dB) points of the main lobe of the radiation pattern. The ra-diation pattern of the sensor depends on both the antenna-in-package design and thehardware integration of the sensor, such as surrounding components, ground plane size,and added di-electric lenses for directivity optimizations, valid for both vertical and hori-zontal plane.
Distance jitter
The distance jitter determines the timing accuracy and stability of the radar system be-tween sweep updates. The jitter is estimated by calculating the standard deviation of thephase, for the same distance bin, over many IQ sweeps.
19

Distance linearity
The distance linearity deterministic the deterministic error from the ideal delay transferfunction. Linearity of the service data is estimated by measuring the phase change ofthe IQ data vs distance.
Update rate accuracy
The update rate accuracy determines the accuracy of the time between sweep updatesor similarly the accuracy of the update rate, typically important when the radar data isused for estimating velocity of an object.
Close-in range
The close-in range determines the radar system limits on how close to the radar sensorobjects can be measured.
Power consumption
The power consumption determines the radar sensor power usage for different config-urations as service depends, the power save mode, the update rate, downsampling,sweep length, etc.
4 Configuring the Acconeer sensor
The Acconeer sensor is highly configurable and can operate in many different modeswhere parameters are tuned to optimize the sensor performance for specific use cases.
4.1 Profiles
The first step is to select pulse length profile to optimize on either depth resolution orradar loop gain, or in terms of use cases, optimized for multiple objects/close range orfor weak reflections/long range, respectively.
Depth resolution, 𝑑𝑟𝑒𝑠, is the ability to resolve reflections which are closely spaced, andhence depends on 𝑡𝑝𝑢𝑙𝑠𝑒 according to
𝑑𝑟𝑒𝑠 ≈𝑡𝑝𝑢𝑙𝑠𝑒𝑣
2(4.1)
Fig. 4.1 illustrates how the ability to resolve closely spaced reflections can be improvedby decreasing 𝑡𝑝𝑢𝑙𝑠𝑒. On the other hand, decreasing 𝑡𝑝𝑢𝑙𝑠𝑒 means that the total energy inthe pulse is decreased and hence decrease the SNR in the receiver, this is the trade-offthat is made by selecting between the five profiles. Each service can be configured withfive different pulse length profiles (see Table 4.1), where
• shorter pulses provides higher distance resolution at the cost of a reduced SNR
• longer pulses provides higher SNR at a cost of reduced depth resolution
20

Fig. 4.1: Illustration of received signal containing 2 echoes. A longer pulse increases theradar loop gain, but also limits the depth resolution. The displayed data corresponds tothe two setups in Fig. 4.2.
Fig. 4.2: Illustration of scenarios that can produce the data in Fig. 4.1. A strong reflector,such as a flat metallic surface, can give a moderate radar signal if the angle to the radaris high. 𝑅1 is identical in the two illustrations as well as 𝑅2.
21

Optimizing on depth resolution also means that close-in range performance is improved.The A111 sensor has both the Tx and Rx antenna integrated and since they are soclosely spaced, there will be leakage between the two antennas. This means that anyobject close to the sensor will have to be filtered from this static leakage. The ability todo this is improved if a short 𝑡𝑝𝑢𝑙𝑠𝑒 is used, as illustrated in Fig. 4.3.
If angular information is needed one possibility is to mechanically move the sensor toscan an area and produce a synthetic aperture radar (SAR). One such case is for au-tonomous robots using sensor input for navigation. Another option is to use multipleA111 sensors and merge data from them to calculate the position of the object by trilat-eration. This can be achieved by running the sensors sequentially and merge the data inthe application.
Fig. 4.3: Illustration of how the leakage between the Tx and Rx antenna will appear inthe Envelope Service data for Profile 1 and Profile 2 pulse lengths.
Table 4.1: Rough comparison of the envelope service be-havior for different profiles.
Profile Relative SNR improvement [dB] Direct leakage [m]Profile 1 0 ~0.06Profile 2 ~7 ~0.10Profile 3 ~11 ~0.18Profile 4 ~13 ~0.36Profile 5 ~16 ~0.60
4.2 Signal averaging and gain
In addition to the Profile configuration parameter, two main configuration parameters areavailable in all Services to optimize the signal quality:
• Hardware Accelerated Average Samples (HWAAS) is related to the number ofpulses averaged in the radar to produce one data point. A high number will in-crease the radar loop gain but each sweep will take longer to acquire and thereforelimit the maximum update rate.
• The gain of the amplifiers in the sensor. Adjusting this parameter so the ADCisn’t saturated and at the same time the signal is above the quantization noise isnecessary. A gain figure of 0.5 is often a good start.
22

4.3 Sweep and update rate
A sweep is defined as a distance measurement range, starting at the distance start rangeand continues for sweep length. Hence, every sweep consists of one or several distancesampling points.
A number of sweeps 𝑁𝑠 are sampled after each other and the time between each sweepis ∆𝑡𝑠, which is configurable. We usually refer to this as the update rate 𝑓𝑠 = 1/∆𝑡𝑠.
In addition, the sparse service introduces a concept of frames defined here.
4.4 Repetition modes
RSS supports two different repetition modes. They determine how and when data ac-quisition occurs. They are:
• On demand: The sensor produces data when requested by the application.Hence, the application is responsible for timing the data acquisition. This is thedefault mode, and may be used with all power save modes.
• Streaming: The sensor produces data at a fixed rate, given by a configurable accu-rate hardware timer. This mode is recommended if exact timing between updatesis required.
Note, Exploration Tool is capable of setting the update rate also in on demand mode.Thus, the difference between the modes becomes subtle. This is why on demand andstreaming are called host driven and sensor driven respectively in Exploration Tool.
4.5 Power save modes
The power save mode configuration sets what state the sensor waits in between mea-surements in an active service. There are five power save modes, see Table 4.2. Thedifferent states differentiate in current dissipation and response latency, where the mostcurrent consuming mode Active gives fastest response and the least current consumingmode Off gives the slowest response. The absolute response time and also maximumupdate rate is determined by several factors besides the power save mode configuration.These are profile, length, and hardware accelerated average samples. In addition, thehost capabilities in terms of SPI communication speed and processing speed also im-pact on the absolute response time. Nonetheless, the relation between the power savemodes are always kept such that Active is fastest and Off is slowest.
Another important aspect of the power save mode is when using the service in repeti-tion mode Streaming. In streaming mode the service is also configured with an updaterate at which the sensor produces new data. The update rate is maintained by the sen-sor itself using either internally generated clock or using the externally applied clock onXIN/XOUT pins. Besides the fact that power save mode Active gives the highest pos-sible update rate, it also gives the best update rate accuracy. Likewise, the power savemode Sleep gives a lower possible update rate than Active and also a lower update rateaccuracy. Bare in mind that also in streaming mode the maximum update rate is not onlydetermined by the power save mode but also profile, length, and hardware acceleratedaverage samples. Power save mode Off and Hibernate is not supported in streamingmode since the sensor is turned off between its measurements and thus cannot keep an
23

update rate. In addition, the power save mode Hibernate is only supported when usingSparse service.
Table 4.2 concludes the power save mode configurations.
Table 4.2: Power save modes.Power save mode Current consumption Response time Update rate accuracyOff Lowest Longest Not applicableHibernate . . . . . . Not applicableSleep . . . . . . WorstReady . . . . . . . . .Active Highest Shortest Best
As part of the deactivation process of the service the sensor is disabled, which is thesame state as power save mode Off.
4.6 Configuration summary
Table 4.3 shows a list of important parameters that are available through our API andthat can be used to optimize the performance for a specific use case, refer to productdocumentation and user guides for a complete list of all parameters and how to usethem.
Table 4.3: List of sensor parametersParameter CommentProfile Selects between the pulse length profiles. Trade off between SNR and
depth resolution.Start Start of sweep [m].Length Length of sweep, independently of Start range [m].HWAAS Amount of radar pulse averaging in the sensor.Receivergain
Adjust to accommodate received signal level.
Repetitionmode
On demand or Streaming.
Update rate Desired rate at which sweeps are generated [Hz] (in repetition modeStreaming).
Power savemode
Tradeoff between power consumption and rate and accuracy at whichsweeps are generated.
5 Physical integration aspects
The A111 sensor contains the mmWave front-end, digital control logic, digitization ofreceived signal and memory, all in one package. To integrate it in your application it isrequired to have a reference frequency or XTAL (20-80 MHz), 1.8 V supply, and a hostprocessor, as illustrated in Fig. 5.1, supported platforms and reference schematics areavailable at developer.acconeer.com.
In addition to the above it is also important for optimized integration to consider the elec-tromagnetic (EM) environment, both in terms of what is placed on top of the sensor as
24

Fig. 5.1: Illustration of integration into host platform, the A111 is marked with the Ac-coneer logo.
well as to the side of the sensor. To evaluate the EM integration a Radar loop mea-surement can be conducted by placing an object in front of the sensor and rotating thesensor around its own axis, as illustrated in Fig. 5.2. The received energy from e.g. theEnvelope Service can then be used to plot the amplitude versus rotation angle (𝜃).
Fig. 5.2: Setup configuration for radar loop pattern measurements.
The radiation pattern of the integrated antennas will be affected by anything that is put ontop of the sensor as a cover. The transmission through a material is given by 1-𝛾, where𝛾 is the reflectivity calculated in Equation 3. Hence, materials with low reflectivity aregood materials to use as a cover on top of the sensor, plastic is a good choice and thesensor is not sensitive to the color of the material. Figure 21 shows the measured Radarloop pattern for 3 different scenarios, plastic (ABS), gorilla glass (GorillaGlass) and freespace (FS). To further optimize the cover integration the thickness of the material shouldbe considered. One can also use a layered cover which uses materials of different 𝜀 foroptimum matching to the medium in which the signal is going to propagate or even to in-crease the directivity, as shown in Figure 21, where the beam width has been decreasedby adding material on top of the sensor. More information on the EM integration aspectscan be found in “Electromagnetic Integration - Basic Guidelines” document available atdeveloper.acconeer.com.
25

Fig. 5.3: Integration of sensor cover and how different materials impact the radiationpattern on the H-plane. The object used is a trihedral corner of radius 5 cm.
6 Summary
Acconeer’s Pulsed coherent radar technology is unique as it combines high precision andlow power consumption into a tiny package and for the first time enables radar in productswhere size, cost and power consumption matters. We are committed to making thetechnology available to everyone and we are working hard to make it easy for you to takeyour product to the market, whether you need pre-integrated hardware or new Detectorswe will help you to get the product to your customers. Sign up for our newsletter or checkout our website and Github for updates on new cool features that we have released, weare constantly innovating, “Explore the next sense!”.
7 Disclaimer
The information herein is believed to be correct as of the date issued. Acconeer AB(“Acconeer”) will not be responsible for damages of any nature resulting from the useor reliance upon the information contained herein. Acconeer makes no warranties, ex-pressed or implied, of merchantability or fitness for a particular purpose or course ofperformance or usage of trade. Therefore, it is the user’s responsibility to thoroughlytest the product in their particular application to determine its performance, efficacy andsafety. Users should obtain the latest relevant information before placing orders.
Unless Acconeer has explicitly designated an individual Acconeer product as meetingthe requirement of a particular industry standard, Acconeer is not responsible for anyfailure to meet such industry standard requirements.
Unless explicitly stated herein this document Acconeer has not performed any regulatoryconformity test. It is the user’s responsibility to assure that necessary regulatory condi-tions are met and approvals have been obtained when using the product. Regardless ofwhether the product has passed any conformity test, this document does not constituteany regulatory approval of the user’s product or application using Acconeer’s product.
Nothing contained herein is to be considered as permission or a recommendation toinfringe any patent or any other intellectual property right. No license, express or implied,
26

to any intellectual property right is granted by Acconeer herein.
Acconeer reserves the right to at any time correct, change, amend, enhance, modify,and improve this document and/or Acconeer products without notice.
This document supersedes and replaces all information supplied prior to the publicationhereof.
8 Document history
Author Comments Version DateAcconeer AB Product sw offer figure updated. 2.7 2020-09-29Acconeer AB Product offer figure updated. 2.6 2020-09-28Acconeer AB Updated with new distance detector. 2.5 2020-08-14Acconeer AB Minor fixes. 2.4 2020-05-27Acconeer AB Minor fixes. 2.3 2020-03-13Acconeer AB Minor fixes. 2.2 2020-02-27Acconeer AB Added power save mode Hibernate. 2.1 2020-01-17Acconeer AB Initial version for API 2.0. 2.0 2019-12-01
27