sensor A performance of radio frequency and signal ...
13
See discussions, stats, and author profiles for this publication at: https://www.researchgate.net/publication/339367052 A performance of radio frequency and signal strength of LoRa with BME280 sensor Article in TELKOMNIKA Indonesian Journal of Electrical Engineering · April 2020 DOI: 10.12928/telkomnika.v18i2 CITATIONS 3 READS 526 2 authors: Some of the authors of this publication are also working on these related projects: Real-time and continuous output power monitoring of photovoltaic (PV) systems View project Analyzes of Radio Frequency and QoS LoRa 915 MHz (920-928 MHz) japan View project Puput Dani Prasetyo Adi Universitas Merdeka Malang 16 PUBLICATIONS 64 CITATIONS SEE PROFILE Akio Kitagawa Kanazawa University 87 PUBLICATIONS 537 CITATIONS SEE PROFILE All content following this page was uploaded by Puput Dani Prasetyo Adi on 20 February 2020. The user has requested enhancement of the downloaded file.
Transcript of sensor A performance of radio frequency and signal ...

See discussions, stats, and author profiles for this publication at: https://www.researchgate.net/publication/339367052
A performance of radio frequency and signal strength of LoRa with BME280
sensor
Article in TELKOMNIKA Indonesian Journal of Electrical Engineering · April 2020
DOI: 10.12928/telkomnika.v18i2
CITATIONS
3READS
526
2 authors:
Some of the authors of this publication are also working on these related projects:
Real-time and continuous output power monitoring of photovoltaic (PV) systems View project
Analyzes of Radio Frequency and QoS LoRa 915 MHz (920-928 MHz) japan View project
Puput Dani Prasetyo Adi
Universitas Merdeka Malang
16 PUBLICATIONS 64 CITATIONS
SEE PROFILE
Akio Kitagawa
Kanazawa University
87 PUBLICATIONS 537 CITATIONS
SEE PROFILE
All content following this page was uploaded by Puput Dani Prasetyo Adi on 20 February 2020.
The user has requested enhancement of the downloaded file.

TELKOMNIKA Telecommunication, Computing, Electronics and Control
Vol. 18, No. 2, April 2020, pp. 649~660
ISSN: 1693-6930, accredited First Grade by Kemenristekdikti, Decree No: 21/E/KPT/2018
DOI: 10.12928/TELKOMNIKA.v18i2. 14843 649
Journal homepage: http://journal.uad.ac.id/index.php/TELKOMNIKA
A performance of radio frequency and signal strength of LoRa
with BME280 sensor
Puput Dani Prasetyo Adi1, Akio Kitagawa2 1,2Department of Electrical Engineering, University of Merdeka Malang, Indonesia
2Micro Electronics Research Laboratory, (MeRL), Kanazawa University, Japan
Article Info ABSTRACT
Article history:
Received Aug 15, 2019
Revised Jan 13, 2020
Accepted Feb 4, 2020
LoRa is a Radio Frequency module that can send packet data up to 3 km in
FSPL.LoRa has 3 different Frequency Radios i.e, 915 MHz, 868 MHz, and
433 MHz. LoRa testing is based on different distances, BME280 provides
Barometric Pressure, Temperature, and Humidity data. An analysis from
the results of the Received Signal Strength to the distance (m) to the farthest
point to prove and provide QoS data from LoRa 915 MHz. Sensor nodes are
built using ADR and Automatic sleep mode algorithms. Communication
systems between nodes are built dynamic sensor nodes in mesh networking.
Monitoring signal transferring on the 915 MHz Frequency waveform is
carried out using the Textronix Spectrum analyzer. Based on the BME280
Data packet transmission from the LoRa 915 MHz Transmitter to
the Receiver Receiver at a distance of 100m is -84 dBm and at a distance of
500m is -107 dBm. The LoRa Internet Gateway has 2 types of settings, i.e,
application, and gateway, this setting is to find out the location of
the gateway with longitude and latitude. Furthermore, the gateway holds
Sensor data from the End node, while the Application Server displays sensor
data in the form of Graphics in realtime.
Keywords:
Barometric
BME280
IoT
LoRa
Pressure
Temperature
This is an open access article under the CC BY-SA license.
Corresponding Author:
Puput Dani Prasetyo Adi,
Department of Electrical Engineering,
University of Merdeka Malang,
Taman Agung Street Number 1, Malang, Post Code 65146, Indonesia
Email: [email protected]
1. INTRODUCTION
The internet of things (IoT) technology is growing rapidly, the development of radio frequency or
module e.g., GPRS, Narrowband-IoT, SigFox, and LoRa. the development of Internet gateway devices
technology (LoRa Gateway, Digi Zigbee Gateway, Raspberry Pi Gateway, etc.), Security type [1], protocol
type, node sensor technology, power consumption that supports lifetime of sensor nodes, routing protocol,
long rangeability on radio frequency or frequency band is very influential in the development of the internet
of things (IoT) technology, at present the company's demand (DSM) on LPWAN [1] and the internet of
things (IoT)-based technology is increasing [2], this study is detailed in research [1]. In research [3] surveyed
the differences between LoRa and NarrowBand-IoT, survey parameters included QoS, latency, reliability,
and range. therefore, In research [4] the comparison of radiofrequency modules such as GPRS, Narrowband-
IoT, SigFox, and LoRa was tested at a very long distance of 7800 km2, proving that Radio module capability
is capable of reaching very long distances. In research [5] LoRa communication was built to make smart
energy Campus Testbed [5-7]. So that an appropriate architecture is needed to handle complex sensor node

ISSN: 1693-6930
TELKOMNIKA Telecommun Comput El Control, Vol. 18, No. 2, April 2020: 649 - 660
650
connections in the internet of things (IoT) and how to build architecture in various systematical domains [8].
Not only in indoor capabilities and short distances such as using bluetooth RN42 [9] which shows
the transferring of data from the transmitter to the receiver is 20 meters then supported by the Raspberry Pi 3
Model B as an Internet gateway. furthermore, In research [7] the Raspberry Pi is used as a web server in
monitoring the energy of LPWAN [10] on each sensor nodes supported by Linux script and radio module
under testing, the testbed's components parameter includes the App inventor App on the tablet to create
a GUI on a tablet based on blockly programming. In research [1] using the same board, Raspberry Pi, which
is built security level method using the ARSy Framework on communication between Raspberry Pi 3 Model
B and DS18B20 sensor, from this research we can determine the level of security of data in the Wireless
Sensor Network. In research [11, 12], the radio frequency used is Zigbee with the farthest range of 120
meters [13], so a long-range frequency radio is needed to cover the outdoor area. So it is necessary to expand
the capacity of the RF signals to the outdoor. For this reason, this research was made, namely analyzing
the ability of the LoRa 915 MHz module in sending BME280 data at distant distances and locations.
therefore, a scope on this research is transferring the BME280 data packet at LoRa transmitter to LoRa
receiver at frequency 915 MHz which will produce receiver signal strength (RSS) value in -dBm at different
distances. In research [14] One important reason for IoT is the Power consumption factor. e.g, LoRa and
the global positioning system (GPS) require high power consumption, one method that can be used to reduce
power consumption is fingerprint positioning method. The sender and receiver program on LoRa uses
C language on the Arduino integrated development environment (IDE). accordingly, Problems that occur
when sending packet data using the LoRa radio frequency module is the presence of obstacles in the form of
mountains, buildings, trees, etc. which causes a greater percentage of the attenuation signal (-dBm).
2. RESEARCH METHOD
2.1. Research architecture
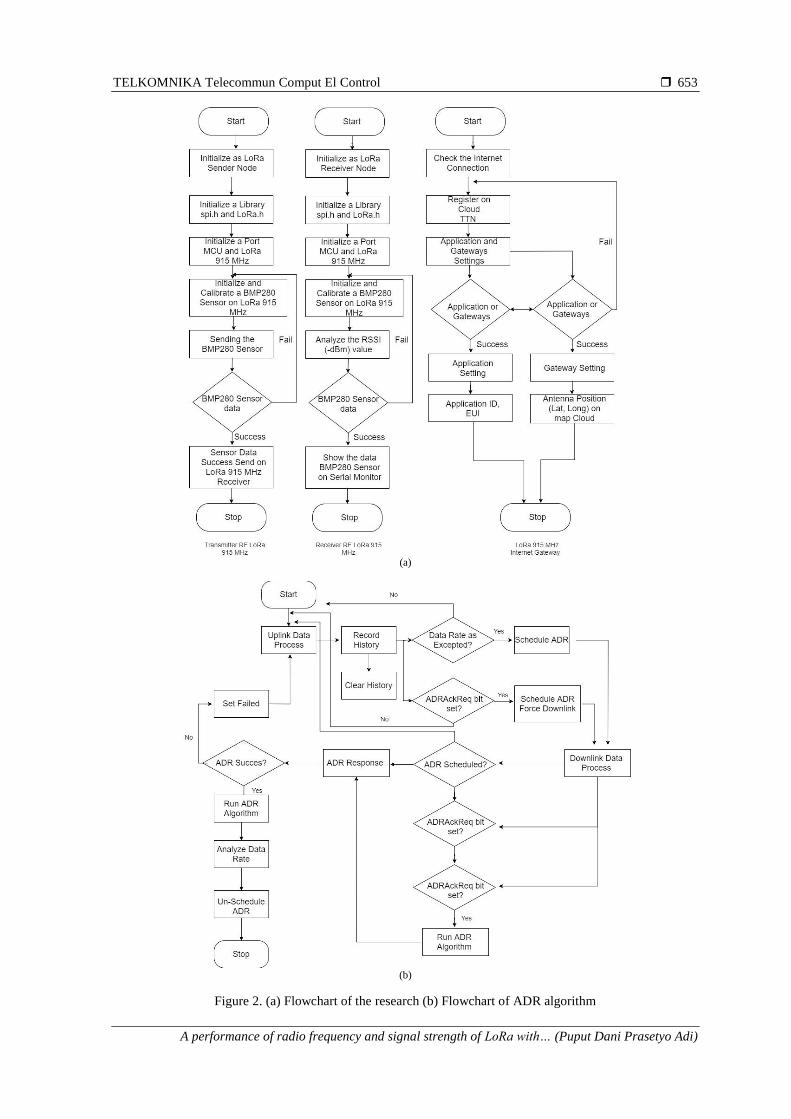
Figure 1 shows the overall research architecture, there are 3 parts shown in Figure 1. On the left
(case_analytic_1) is an analysis of ADR (adaptive data rate) algorithm [15] which aims to maximize
the lifetime of sensor nodes and the effectiveness of the overall networking if added with a large number of
nodes, in the center (receiver sensitivity), transmitting multi-point data signals Tx node LoRa to Rx Node
LoRa produces an analysis of the budget link consisting of transmission power, antenna gain, connector loss,
factor fresnel zone equation, etc (Case_Analytic_2) [16]. In Case_Analytic2 the analyzed signal is Chirps
(compressed high-intensity radar pulse) [17-19]. furthermore, Case_Analytic_3 is the result of an internet
gateway analysis consisting of an internet server and application server and its analytic data, i.e, uplink and
downlink which can be analyzed in detail.
Figure 1. The architecture of this research

TELKOMNIKA Telecommun Comput El Control
A performance of radio frequency and signal strength of LoRa with… (Puput Dani Prasetyo Adi)
651
The flow diagram of Figure 1 shows the process of beginning to the end of this research, therefore,
three parts of the flowchart are interrelated ie, end nodes/mote/end devices of LoRa and this transmitter will
be added up so that the data rate will increase for that it needs an algorithm that maintains network stability
and maximizes the lifetime of the sensor node using the ADR algorithm. Adaptive data rate (ADR)
the algorithm focused on the algorithm used in the internet of things radio frequency LoRa communication
system, this algorithm is used as an approach in handling data transmission rate on the network (LoRaWAN)
[20] that is being built and has many sensor nodes that are being built interconnected, this has to do with how
to increase the effectiveness of IoT-based networks and maintain the level of life-time for sensor nodes on
complex networks. In this case, all end nodes/endpoints or motes can dynamically adjust the data rate that
will be sent in the process of transmitting uplink and downlink data. If the end point/end node/mote is in
ADR Active mode, the Server will be able to determine the data rate via the ADR (adaptive data rate) as
documented in LoRaWAN [21, 22]. ADR algorithm parameters include RSSI (dBm) and SNR (dB), uplink
and downlink processes between the application server and the server node. furthermore, three transmission
parameters [23, 24] in adaptive data rate (ADR) i.e, spreading factor (SF), bandwidth (BW), and transmission
power (dB). Further explanation of the ADR Algorithm can be seen in the flowchart of ADR algorithm in
Figure 2 (b).
2.2. Hardware spesification and equation
2.2.1. BME sensor
The BME280 Sensor in Figure 3 is a multi-sensory and applied in the health care application
(e.g. Spirometry). in previous research, health care application using different sensors in research
[11, 20, 25, 26] i.e, blood pressure and pulse sensor. In research [27] the sensors used are
the electrocardiogram (ECG) sensor, body temperature sensor, pulse rate, and oxygen saturation signal using
MySignals and LoRa. There are 3 data on the BME280 sensor i.e. atmospheric pressure (hPa), temperature
(DegC) and humidity (%). Atmospheric pressure (hPa) is the pressure at any point in the Earth's atmosphere.
Almost the same as the hydrostatic pressure caused by the weight of the air above the measurement point.
The formula for calculating atmospheric pressure is following the formula 2. Log10 P≈ 5-(h -15500), where
the value of P is pressure (Pascal) and h is the height (meters). Furthermore, the temperature has the default
unit Degree Celcius. the BME280 sensor, the unit used is degree celsius and detects conditions in
the environment and results in precision. furthermore, to change to Kelvin (K), Reamur (ºRé) or Fahrenheit
(°F) C language is used in the Arduino IDE. If the DegC value is known, to be changed to another
temperature unit to r=c * 4/5; f=(c * 9/5) +32; k=c + 273.16; furthermore, humidity (%) is the amount of
water vapor in the air that is not visible to the human eye, this amount of water vapor will determine rainfall,
dew or fog. Furthermore, Figure 3 describes the BME280 sensor diagram block, There is a Pressure and
temperature sensing element that is converted from analog to digital using analog to digital converter (ADC)
to logic gate and continues to 6 output pins ie.SDI, SDO, SCK, CSB, VDD and GND, and just 4 pins used
i.e. SDA, SCL, VDD (3.3 volt) and GND.
2.2.2. RFM95W/96W for dragino LoRa
The LoRa type used is the Dragino LoRa 915 MHz, which is compatible with the Arduino UNO
Board. therefore, on the Dragino LoRa 915 MHz, the chip device used is RMF96, the transmit power is 20
dB, as shown in Figure 4 and the hardware specification in Table 1.
2.2.3. RSSI of LoRa
The RSSI stands for received signal strength indicator which is expressed in mW and dBm
(when measuring), the RSSI range is -30 dBm (strength signal) and -120 dBm (weak signal). In this research,
RSSI of LoRa radio signals will be analyzed within a distance of the free space area and obstacle area
(tree, building, and hill). This Obstacle will cause attenuation of the signal due to three factors,
i.e, diffraction, detailed reflection and scattering will be explained further. RSSI is also caused by
SNR (signal noise ratio) [8] which is expressed in units of dB. The SNR range is -20 dB and +10 dB.
A signal that is close to +10 dB, signal reception becomes poor or slightly corrupted. furthermore, In general,
the RSSI formula is shown in (1).
RSSI (dBm)=-10n log10(d) + A (1)
Where value A is the signal strength at a distance of 1 meter in units of dBm and n is the value of path loss
exponent value [28]. moreover, This RSSI can be developed in cases of research such as the coal mine
underground locomotive [4], the reason for taking cases in this research is because the poor environment of

ISSN: 1693-6930
TELKOMNIKA Telecommun Comput El Control, Vol. 18, No. 2, April 2020: 649 - 660
652
coal mine underground, so that it is difficult to determine the position of locomotive so that it can be solved
with an approach to positioning algorithm. The RSSI approach to path loss (PL) can be seen in (2).
PL (𝑑) = 𝑃𝐿 (𝑑0) + 10 𝑥 𝑛 𝑥 log𝑑
𝑑0+ 𝑋𝜎 (2)
Where 𝑃𝐿 (𝑑) is a path loss from transmitter to receiver at a certain distance (d), 𝑑0 is a reference distance at
1 meter. Xσ is a gaussian distribution random variable, where the mean or average is 0 and the standard
deviation is σ (4-10). furthermore, From the PL formula above, it can be seen that the value of RSSI of node
at distance d is as in (3).
𝑅𝑆𝑆𝐼 (𝑑) = 𝑃𝑠𝑒𝑛𝑑 + 𝑃𝑎𝑚𝑝𝑙𝑖𝑓𝑦 − 𝑃𝐿 (𝑑) (3)
𝑃𝑠𝑒𝑛𝑑 is a Power Transmitter, 𝑃𝑎𝑚𝑝𝑙𝑖𝑓𝑦 is a gain of antenna [29, 30]. and the RSSI formula is the same as
looking for the value of A (4).
𝐴 = 𝑃𝑠𝑒𝑛𝑑 + 𝑃𝑎𝑚𝑝𝑙𝑖𝑓𝑦 − 𝑃𝐿 (𝑑) (4)
Where A is the RSSI value at a distance of d_0 or a distance of 1 meter. So to get an estimate of the distance
(d) between nodes of the RSSI parameter and A, it can be seen in (5). The value of n is path loss exponent
2-5, each environment is different [28], for example, Free Space, n value is 2.
𝑑 = 10((𝐴−𝑅𝑆𝑆𝐼−𝑋𝜎)/10𝑛)𝑑0 (5)
2.2.4. Energy and power signals
On a signal x(t) can be known the average value of energy signal E with range 0 < E < ∞, as in (6).
𝐸 = ∫ |𝑥(𝑡)|2∞
−∞𝑑𝑡 (6)
And to get a power signal x(t) 0 < P < ∞ for average power, stated in (7).
𝑃 = lim𝑇=∞
1
2𝑇∫ |𝑥(𝑡)|2T
−T𝑑𝑡 (7)
2.2.5. PathLoss (dB) and attenuation signal
Linear path loss can be stated with (8), where a Pt devided a Pr.
Pr =𝑃𝑡
𝑃𝑟 (8)
Path Loss can also be defined as dB, where the dB value is not negative, as in (9)
PL dB =10 log10 𝑃𝑡
𝑃𝑟 𝑑𝐵 (9)
Free space equation can be expressed as friss free space as in (10),
𝑃𝑟 = 𝑃𝑡𝐺𝑡𝐺𝑟𝜆2
(4𝜋𝑑)2 10
a distance (d) affects a signal strength at the Receiver (Rx). [29, 30] accordingly, the receiver signal strength
is expressed by the parameter 𝑃𝑟 (mW) or dB. In (11), the size of the power receiver (𝑃𝑟) is determined by
the power transmitter (𝑃𝑡), gain on the transmitter (Gt) and receiver gain (Gr) and the length of the direct
line-of-sight (LOS). in (11) there are 2 conditions where d ≥ ds (cross over) and d < ds (cross over).
𝑃𝑟 = { 𝐺𝑡 𝐺𝑟 𝜆
2
(4𝜋𝑑)2𝑙 if 𝑑 <𝑑𝑠 ,
𝑃𝑡 𝐺𝑡 𝐺𝑟 ℎ𝑡 2ℎ𝑟
2
𝑑4 if 𝑑≥ 𝑑𝑠 ,
(11)
TELKOMNIKA Telecommun Comput El Control
A performance of radio frequency and signal strength of LoRa with… (Puput Dani Prasetyo Adi)
653
(a)
(b)
Figure 2. (a) Flowchart of the research (b) Flowchart of ADR algorithm

ISSN: 1693-6930
TELKOMNIKA Telecommun Comput El Control, Vol. 18, No. 2, April 2020: 649 - 660
654
Figure 3. BME280 sensor and block diagram of BME280 sensor
Figure 4. RF96 chip for LoRa 915 MHz from MeRL keyence VHX digital microscope
Table 1. RFM95W spesification Parameter Details
Link Budget Constant RF Output vs V.Supply
Low RX Current
Modulation type
Dynamic Range RSSI
Packet engine
168 dB (Maximum) +20 dBm–100 mW
10.3 mA, 200 nA register retention
FSK, GFSK, MSK, GMSK, LoRa Tm and OOK modulation
127 dB
256 bytes with CRC
2.2.6. Signal to noise ratio (SNR) of LoRa
Signal to noise ratio (SNR) of LoRa is the amount of signal received or signal strength (dB)
compared to noise level. SNR can be used to classify signal strength. Therefore, SNR equation can be
seen in (12).
SNR_1=𝑅𝑒𝑐𝑒𝑖𝑣𝑒 𝑆𝑖𝑔𝑛𝑎𝑙 𝑃𝑜𝑤𝑒𝑟 (𝑑𝐵)
𝑁𝑜𝑖𝑠𝑒 𝑃𝑜𝑤𝑒𝑟 (𝑑𝐵) (12)
and the magnitude of SNR is also influenced by Channel gain, the amount of channel gain depends on
the frequency of the radio wave transmitter (Hz) and distance (d). In (13) explains about the channel gain.
Channel gain_1=10 𝑙𝑜𝑔10 (𝜆 2
4𝜋2 .1
𝑑2) 𝑑𝐵 (13)

TELKOMNIKA Telecommun Comput El Control
A performance of radio frequency and signal strength of LoRa with… (Puput Dani Prasetyo Adi)
655
From (13), furthermore develop to (14).
Channel gain_2=10 𝑙𝑜𝑔10 (𝜆 2
4𝜋2) − 20 𝑙𝑜𝑔10 (𝑑) 𝑑𝐵 (14)
In (12), receive signal power (dB) is equal to transmit power multiply channel gain, therefore, the equation
becomes to (15).
SNR_2=𝑇𝑟𝑎𝑛𝑠𝑚𝑖𝑡 𝑃𝑜𝑤𝑒𝑟 .𝐶ℎ𝑎𝑛𝑛𝑒𝑙 𝐺𝑎𝑖𝑛 (𝑑𝐵)
𝑁𝑜𝑖𝑠𝑒 𝑃𝑜𝑤𝑒𝑟 (𝑑𝐵) (15)
Therefore, from (14), it can be concluded that SNR is influenced by the magnitude of radio wave frequency
(Hz) and distance. The farther the distance between Tx and Rx, the greater the signal to noise ratio (dB) value
means the greater the interference that occurs in the signal or the lower the signal reception (RSSI) (dBm).
In this case, RSSI (dBm) is affected by the Noise value and signal interference.
2.2.7. LoRa parameters packet
Lora Packet is initialized with explicit header and implicit header mode, explicit header consists of
preamble, header, payload, and payload CRC, while implicit headermode consists of preamble, payload and
payload CRC. Other important parameters owned by LoRa are spreading factor (SF), bandwidth (BW) and
code rate (CR), the value of CR is 1-4. SF value is 7-12, this value is given to LoRa when transmitting data
based on factor distances (m). Bandwidth is also called RC (Chip Rate) LoRa consists of 500 kHz, 250 kHz
and 125 kHz. furthermore, the process of transmitting LoRa data in 1 second expressed by TS, TS calculation
can be seen in (16).
TS=2𝑆𝐹
𝐵𝑊 (16)
Furthermore, LoRa data transmission can be determined per 1 second, with different spreading factor values
that will produce different data transmission. The next parameter is the symbol rate (RS). RS is formulated
as in (17).
RS=𝐵𝑊
2𝑆𝐹 (17)
Therefore, from (17) a symbol rate can be generated. Symbol rate values differ based on bandwidth width
(KHz) and spreading factor (SF). The next parameter is Rb, Rb is the data rate or bit rate (bps), this parameter
is very important in the analysis of LoRa data transmission in (18) and (19), by analyzing the value of
Rb means that it can find out the Quality of Services (QoS) of LoRa data transmission.
Rb =𝑆𝐹 𝑥 𝐵𝑊
2𝑆𝐹 𝑥 𝐶𝑅 (18)
Rb =𝑆𝐹 𝑥 [
4
4+𝐶𝑅]
[2𝑆𝐹
𝐵𝑊]
𝑥 1000 (19)
ToA or TPacket= TPreamble + TPaylaod (20)
ToA or time on air (ms) is the sum of time preamble and time payload in second units. And to get
the value of 𝑇𝑃𝑟𝑒𝑎𝑚𝑏𝑙𝑒 can be seen in (21).
𝑇𝑃𝑟𝑒𝑎𝑚𝑏𝑙𝑒= (𝑛𝑃𝑟𝑒𝑎𝑚𝑏𝑙𝑒 + 4.25 )𝑇𝑠 (21)
as for 𝑇𝑃𝑎𝑦𝑙𝑎𝑜𝑑 , it can be formulated in (22).
𝑇𝑃𝑎𝑦𝑙𝑜𝑎𝑑=𝑇𝑠 (8 + max (ceil((8PL-4SF+28+16CRC-20H)/4(SF-2DE)) (CR+4),0)) (22)
2.2.8. Packet BME280 sensor data delivery
The BME280 sensor data transmission is done in 2 ways, the free space path loss (FSPL) method
and obstacle, obstacle here e.g, tree, building, hill or mountain, for the resulting output is the receiver signal
strength indicator (RSSI (-dBm) parameter) ), for more details, add the SNR (signal noise ratio (-dB))

ISSN: 1693-6930
TELKOMNIKA Telecommun Comput El Control, Vol. 18, No. 2, April 2020: 649 - 660
656
parameter. furthermore, sensor data BME280 e.g, temperature (DegC), barometric pressure (hPa), and
humidity (%). The output is obtained from the Arduino serial monitor on the transmitter, receiver, and
application server IoT (Thingspeak). Figure 5 (a) is sending Tx LoRa 915 MHz data at free space path loss
(FSPL) and Figure 5 (b) is sending Tx LoRa 915 MHz data when obstacles are present.
(a)
(b)
Figure 5. (a) Communication Tx and Rx LoRa 915 MHz on FSPL,
(b) Communication Tx and Rx LoRa 915 MHz on Obstacles
3. RESULTS AND ANALYSIS
3.1. Radio frequency LoRa 915 MHz with signal analyzer
Figures 6 (a), 6 (b), 7 (a), and 7 (b) are various outputs of the RSA 3408B Realtime Spectrum
Analyzer DC-8 GHz DPX technology electronic analyzer, signal LoRa E32915T20D at frequency 915 MHz
as center value. Therefore, the analyzer records LoRa transmitting data activity at frequency 915 MHz as
center frequency, this signal shows signal LoRa with receiver sensitivity (dBm) value and signal noise
ratio (dB) value. Data rate or Bit rate (Br) is also determined by the Spreading Factor, from the Spreading Factor (SF)
parameter another parameter can be obtained e.g, Payload, data rate, bit rate, and receiver sensitivity. More
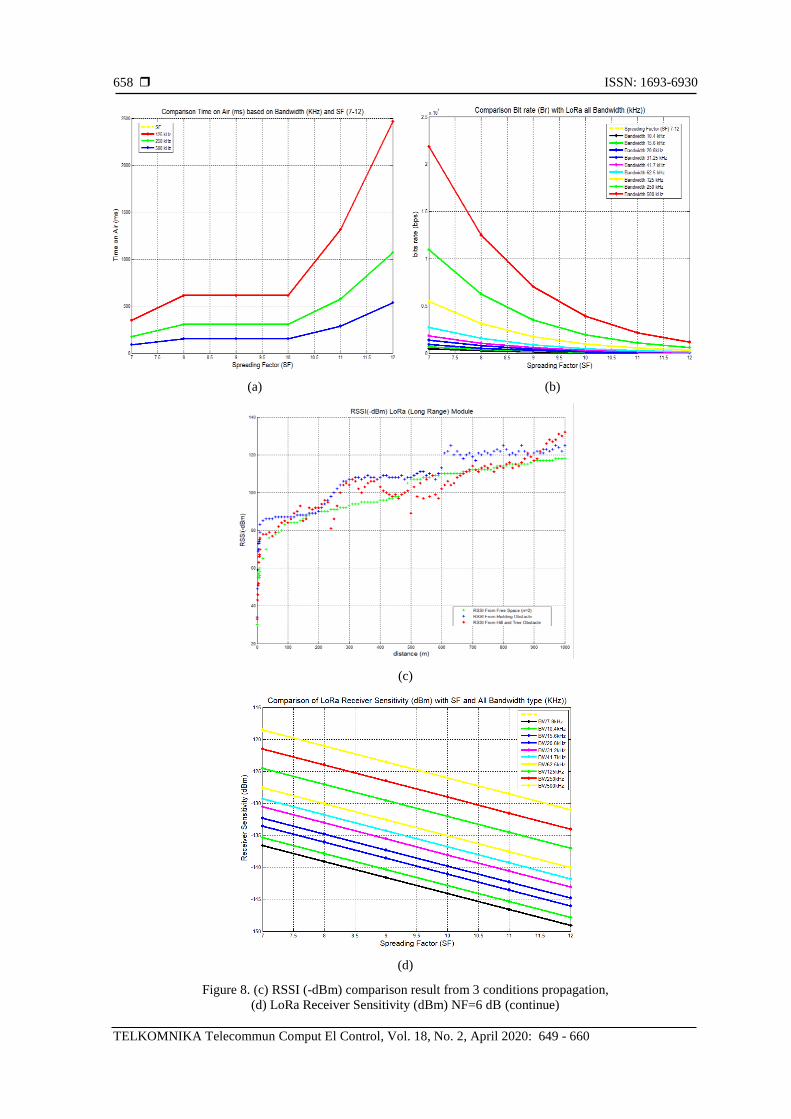
fully, about LoRa Spreading Factor and Data Rate can be seen in Figure 8 (a, b) shows the relationship
between LoRa Bandwidth and Spread Factor which determines the speed of transmitting LoRa data or time
on air (ms) and determines the bit rate (bps). In Figure 8(a) can be seen that the 125 kHz Bandwidth has
the longest Time on Air of 2465.79 ms on Spreading Factor 12, and the bandwidth of 500 kHz is 534.53 ms.
meaning that the wider the bandwidth the faster the data transmits even though it is in Spreading Factor 12.
In this case, Bandwidth determines the quality of the receiving signal from tx to Rx, the greater
the bandwidth, the better the quality of the signal produced. The value of Time on Air is shown in (20).
furthermore, Thingspeak Application Server, in the Application server important data that can be used
as a key is the Application Programming Interface (API), i.e, Write API and Read API. therefore, the sensor

TELKOMNIKA Telecommun Comput El Control
A performance of radio frequency and signal strength of LoRa with… (Puput Dani Prasetyo Adi)
657
data output can be seen in Figure 9. moreover, RSSI (-dBm) shows a value of -34 dBm at a distance
of 1 meter, for further analysis a Receiver Receiver will be placed at a distance of up to 1 Km, to ensure
the strength of LoRa at a great distance, and to the Free Space area (Figure 5(a)) and Obstacle
(Tree, Building, Hill, etc.) (Figure 5(b)). From the comparison signals in 3 conditions, i.e. Free Space,
Building Obstacle and Hill+Tree Obstacle, it was concluded that Building and Hill had a great value in terms
of attenuation. Free Space is the lowest at a distance of 1 when it is compared to the obstacle, this is
influenced by the Reflected signal factor, diffraction signal, and scattering signal during data transmission
from Transmitter to Receiver in Figure 5.
(a) (b)
Figure 6. (a) Signal LoRa 915 MHz with peak setting, (b) LoRa 915 MHz signal with trace bitmap
(a) (b)
Figure 7. (a) Signal LoRa with a normal setting, (b) Signal LoRa with intermediate surges
ISSN: 1693-6930
TELKOMNIKA Telecommun Comput El Control, Vol. 18, No. 2, April 2020: 649 - 660
658
(a) (b)
(c)
(d)
Figure 8. (c) RSSI (-dBm) comparison result from 3 conditions propagation,
(d) LoRa Receiver Sensitivity (dBm) NF=6 dB (continue)

TELKOMNIKA Telecommun Comput El Control
A performance of radio frequency and signal strength of LoRa with… (Puput Dani Prasetyo Adi)
659
Figure 9. Output temperature (C) and humidity (%) of BME280 sensor on application server
4. CONCLUSION
The process of sending BME280 sensor data uses long range 915 MHz radio frequency at a distance
of more than 1 km in the Kakuma-Machi-Ishikawa Kanazawa mountain range-Japan has difficulties due to
tight obstacle problems, but the research can be carried out in 3 different conditions (free space area, building
obstacle and hills and tree obstacle) that produce different values, where building obstacle gives a greater
attenuation (-dBm) value. And free space is the best condition for sending BME280 sensor signals using
LoRa at a distance of > 1 km. moreover, the LoRa 915 MHz signal can be analyzed using the signal analyzer
and produces a signal strength value (-dBm). Signal LoRa 915 MHz can also be analyzed using signal
analyzer. But this research needs to be developed with a more complex communication system, i.e, mesh
networking uses 915 MHz LoRa with multi-sensor nodes, parameters of quality of service (QoS) are added to
add quality and contribution to paper, budget link parameters such as byte rate, throughput, packet loss, air
data rate, etc. The BME280 sensor output can be sent via sensor nodes to the graphical internet via the LoRa
internet gateway, with the halpeak application server. The analysis process is on the internet of things (IoT)
system and data analysis on the LoRa internet gateway and analysis on uplink, downlink processes and
quality of service (QoS) on the internet gateway.
ACKNOWLEDGEMENTS
Thank you to the Micro Electronics Research Laboratory (MeRL), Kanazawa University-Japan,
which allows the author to do research, thank you for the equipment that can be used, e.g, Textronix Signal
Analyzer. Furthermore, Thanks to Professor Akio Kitagawa who assisted in the process of correcting
the manuscript and providing opportunities in developing research in the field of Wireless Communication
and the Internet of Things.
REFERENCES
[1] Parenreng J. M., Kitagawa A., “Resource optimization techniques and security levels for wireless sensor networks
based on the ARSY framework,” Sensors, vol. 18, no. 5, 2018. DOI: 10.3390/s18051594.
[2] Cilfone A., Davoli L., Belli L., Ferrari G., "Wireless Mesh Networking: An IoT-Oriented Perspective Survey on
Relevant Technologies," Future Internet, vol. 11, no.4, pp. 99, 2019.
[3] Rashmi Sharan Sinha, Yiqiao Wei, Seung-Hoon Hwang, “A Survey on LPWA technology:LoRa and NB-IoT,”
ScienceDirect, ICT Express 3, pp. 14-21, 2017. DOI: 10.1016/j.icte.2017.03.004.
[4] Lauridsen Mads, Nguyen Huan Cong, Vejlgaard Benny, Kovacs Istvan, Mogensen Preben Elgaard, Sørensen Mads,
"Coverage comparison of GPRS, NB-IoT, LoRa, and SigFox in a 7800 km2 area," Aalborg Universitet, 2017 IEEE
85th Vehicular Technology Conference (VTC Spring), 2017. DOI: 10.1109/VTCSpring.2017.8108182.
[5] Kim D. H., Lee E. K., Kim J., "Experiencing LoRa Network Establishment on a Smart Energy Campus Testbed,"
Sustainability, vol. 11, no. 7, 2019. DOI: 10.3390/su11071917.
[6] Bin Ge, Kai Wang, Jianghong Han, and Bao Zhao, "Improved RSSI Positioning Algorithm for Coal Mine
Underground Locomotive," Journal of Electrical and Computer Engineering, vol. 2015, no. 3, pp. 1-8, 2015.
[7] Dimitrios Loukatos, Ioannis Manolopoulos, Evangelia-Sofia Arvaniti, Kostas G. Arvanitis, Nick A. Sigrimis,
"Experimental Testbed for Monitoring the Energy Requirements of LPWAN Equipped Sensor Nodes,"
ScienceDirect, IFAC PapersOnLine, vol. 51, no. 17, pp. 309-313, 2018.
[8] P. P. Ray, “A survey on Internet of Things architectures,” Journal of King Saud University–Computer and
Information Sciences, ScienceDirect, vol. 30, no. 3, 2018. DOI: 10.1016/j.jksuci.2016.10.003.
[9] Puput Dani Prasetyo Adi and Akio Kitagawa, “Performance Evaluation WPAN of RN-42 Bluetooth based
(802.15.1) for Sending the Multi-Sensor LM35 Data Temperature and RaspBerry Pi 3 Model B for the Database
and Internet Gateway,” International Journal of Advanced Computer Science and Applications(IJACSA), vol. 9, no.
12, 2018. DOI: 10.14569/IJACSA.2018.091285.

ISSN: 1693-6930
TELKOMNIKA Telecommun Comput El Control, Vol. 18, No. 2, April 2020: 649 - 660
660
[10] Yonghua Song, Jin Lin, Ming Tang, Shufeng Dong, “An Internet of Energy Based on Wireless LPWAN,”
ScienceDirect, Engineering Journals, 2017. DOI: 10.1016/J.ENG.2017.04.011.
[11] Puput Dani Prasetyo Adi and Akio Kitagawa, “ZigBee Radio Frequency (RF) Performance on Raspberry Pi 3 for
Internet of Things (IoT) based Blood Pressure Sensors Monitoring,” International Journal of Advanced Computer
Science and Applications(IJACSA), vol. 10, no. 5, 2019. DOI: 10.14569/IJACSA.2019.0100504.
[12] Puput Dani Prasetyo Adi and Akio Kitagawa, “Quality of Service and Power Consumption Optimization on
the IEEE 802.15.4 Pulse Sensor Node based on Internet of Things,” International Journal of Advanced Computer
Science and Applications(IJACSA), vol. 10, no. 5, 2019. DOI: 10.14569/IJACSA.2019.0100518.
[13] Muhammad Niswar, Amil Ahmad Ilham, Elyas Palantei, Rhiza S.Sadjad, Andani Ahmad, Ansar Suyuti, Indrabayu,
Zaenab Muslimin,Tadjuddin Waris, Puput Dani Prasetyo Adi, “Performance evaluation of ZigBee-based wireless
sensor network for monitoring patients' pulse status,” 2013 International Conference on Information Technology
and Electrical Engineering (ICITEE), 2013. DOI: doi/10.1109/ICITEED.2013.6676255.
[14] Wongeun Choi, Yoon-Seop Chang, Yeonuk Jung and Junkeun Song, “Low-Power LoRa Signal-Based Outdoor
Positioning Using Fingerprint Algorithm,” International Journal of Geo-Information, MDPI, vol. 7, no. 11, 2018,
DOI: 10.3390/ijgi7110440.
[15] Li Shengyang, Usman Raza, and Khan Aftab, “How Agile is the Adaptive Data Rate Mechanism of LoRaWAN?,”
IEEE Globecom 2018 Abu Dhabi, UAE, 2018. DOI : 10.1109/GLOCOM.2018.8647469.
[16] Sergio Barrachina-Muñoz, Boris Bellalta, Toni Adame, Albert Bel, "Multi-hop communication in the uplink for
LPWANs," Computer Networks, vol. 123, pp. 153-168, 2017. DOI: 10.1016/j.comnet.2017.05.020.
[17] V. Fialho, F. Azevedo, “Wireless Communication Based on Chirp Signal for LoRa IoT Devices,” i-ETC:ISEL
Academic Journal of Electronics, Telecommunications and Computers, vol. 4, no. 1, 2018.
[18] Galati Gaspare, Gabriele Pavan, Francesco De Palo, “Chrip Signal and Noisy Waveforms for Solid-State
Surveillance Radars,” Aerospace, MDPI, 2017. DOI : 10.3390/aerospace4010015.
[19] Puput Dani Prasetyo Adi and Akio Kitagawa, “Performance Evaluation of E32 Long Range Radio Frequency
915 MHz based on Internet of Things and Micro Sensors Data,” International Journal of Advanced Computer
Science and Applications (IJACSA), vol. 10, no. 11, 2019. DOI: doi/10.14569/IJACSA.2019.0101106.
[20] Taoufik Bouguera, Jean-Francois Diouris, Jean-Jacques Chaillout, Randa Jaouadi and Guillaume Andrieux,
“Energy Consumption Model for Sensor Nodes Based on LoRa and LoRaWAN,” MDPI Sensor, vol. 18, no. 7,
2018. DOI: 10.3390/s18072104
[21] Dmitry Bankov, Evgeny Khorov, and Andrey Lyakhov, “On the Limits of LoRaWAN Channel Access,” 2016
International Conference on Engineering and Telecommunication (EnT), pp. 10-15, November 2016,
DOI: 10.1109/EnT.2016.011
[22] Ferran Adelantado, Xavier Vilajosana, Pere Tuset-Peiro, Borja Martinez, Joan Melià-Seguí, Thomas Watteyne,
"Understanding the Limits of LoRaWAN," IEEE Communications Magazine, vol. 55, no. 9, September 2017.
DOI: 10.1109/MCOM.2017.1600613.
[23] Martin Bor, John Vidler, Utz Roedig, “LoRa for the Internet of Things,” EWSN '16 Proceedings of the 2016
International Conference on Embedded Wireless Systems and Networks, Junction Publishing, AUT, pp. 361-366,
2016. ISBN 9780994988607.
[24] Martin Bor, Utz Roedig, "LoRa Transmission Parameter Selection," 2017 13th International Conference on
Distributed Computing in Sensor Systems (DCOSS), 2017. DOI: 10.1109/DCOSS.2017.10.
[25] Fan Wu, Taiyang Wu and Mehmet Rasit Yuce, “An Internet-of-Things (IoT) Network System for Connected
Safety and Health Monitoring Applications,” Sensor MDPI, 2019. DOI:10.3390/s19010021.
[26] Hayati,nur ;Suryanegara, Muhammad, "The IoT LoRa system design for tracking and monitoring patient with
mental disorder", 2017 IEEE International Conference on Communication, Networks and Satelite (Comnetsat),
2017. DOI: 10.1109/COMNETSAT.2017.8263587
[27] Mohammad Shahidul Islam, Mohammad Tariqul Islam, Ali F. Almutairi, Gan Kok Beng, Norbahiah Misran and
Nowshad Amin, "Monitoring of the Human Body Signal through the Internet of Things (IoT) Based LoRa Wireless
Network System," Applied Science, vol. 8, no. 9, 2019. DOI: 10.3390/app9091884.
[28] The Aloÿs Augustin, Jiazi Yi, Thomas Clausen and William Mark Townsley, “A Study of LoRa: Long Range
& Low Power Networks for the Internet of Things,” Sensor MDPI, vol. 16, no. 9, pp. 1466, 2016.
[29] Irawan Sukma, Akio Kitagawa, "Comparison Topologies of Resonant Tank from Class-C Wireless Power
Transfer," 2018 IEEE International Workshop on Electromagnetics: Applications and Student Innovation
Competition (iWEM), 2018. DOI: 10.1109/iWEM.2018.8536684.
[30] Muhammad Fauzan Edy Purnomo, Hadi Suyono, Panca Mudjirahardjo, Rini Nur Hasanah, “Analysis Performance
of Singly-Fed Circularly Polarized Microstrip Antenna For Wireless Communication,” Jurnal Teknologi, vol. 78,
no. 5-9, 2016. E-ISSN. 2180-3722.
View publication statsView publication stats