Seminar Series on Regional Economic Integration and Asian International Economists Network (AIEN)...
66
Seminar Series on Regional Economic Integration and Asian International Economists Network (AIEN) Speaker Series The PRC and its Exchange Rate: A Worldwide Stabilizing Influence? Ronald I. McKinnon Emeritus Professor of Economics Stanford University 17 October 2012
-
Upload
dulcie-gilmore -
Category
Documents
-
view
215 -
download
0
Transcript of Seminar Series on Regional Economic Integration and Asian International Economists Network (AIEN)...

Seminar Series on Regional Economic Integrationand
Asian International Economists Network (AIEN) Speaker Series
The PRC and its Exchange Rate: A Worldwide Stabilizing Influence?
Ronald I. McKinnonEmeritus Professor of EconomicsStanford University17 October 2012

The PRC and its Exchange RateA Worldwide Stabilizing Influence?
Ronald I. McKinnonStanford University
Asian Development BankManila
October 2012

Source: International Financial Statistics, IMF, author’s projection

Source: UBS
Trade as a Share of China’s GDP

0
10
20
30
40
50
60
-6
-4
-2
0
2
4
6
8
10
China Savings, Investment, and Trade Balance, as Percentage of GDP
Savings Gross Fixed Investment Net Export (rhs)Source: BIS-Ma, Lam McCauley, Land Lam

Year Trade Balance US$ Trade Balance percent of GDP Bilateral Trade
Balance billion US$Bilateral Trade Balance percent of GDP
1980 -1 -0.33% -2.8 -0.93%1982 4.8 1.63% -2.5 -0.86%1984 0.1 0.01% -1.5 -0.48%1986 -7.4 -2.43% -2.1 -0.69%1987 0.3 0.09% -1.8 -0.55%1988 -4.1 -0.98% -3.2 -0.78%1990 10.7 2.64% -1.3 -0.32%1992 5.1 1.00% -0.3 -0.06%1994 7.4 1.26% 7.4 1.28%1996 17.6 1.97% 10.5 1.18%1998 43.8 4.19% 21.0 2.01%2000 28.8 2.42% 29.8 2.50%2002 37.4 2.57% 42.8 2.94%2004 49.3 2.54% 80.4 4.14%2006 208.9 7.49% 144.6 5.19%2008 348.7 7.69% 171.1 3.77%2009 220.1 4.36% 143.6 2.84%2010 183.1 3.11% 181.2 3.08%2011 155.1 2.07% 202.3 2.70%
China’s Multilateral and Bilateral Trade Surplus vs. US

1985 1986 1987 1988 1989 1990 1991 1992 1993 1994 1995 1996 1997 1998 1999 2000 2001 2002 2003 2004 2005 2006 2007 2008 2009 2010 20110.0%
0.5%
1.0%
1.5%
2.0%
2.5%
3.0%
Figure 6: Bilateral Trade Balances of Japan and China versus the United States(percentage of U.S. GDP, 1955-2011)
China
Japan
China + Japan
Japan Bashing China Bashing

Source: Financial Times, November 11, 2010
Figure 9: Exchange Rate Valuations


Thesis• For a creditor country with a current account surplus
such as China, exchange appreciation need not reduce it.
• As with Japan’s earlier experience, exchange rate appreciation, or the threat thereof , caused macroeconomic distress without having any obvious effect on its trade surplus.
• If the country is an immature creditor and its trade surplus is large , even floating is infeasible. Because of currency mismatches, the private sector cannot risk financing the surplus.

U.S. Mercantile Pressure on China • China Bashing: 2000 to ?
-China surpasses Japan in 2000 as having the biggest bilateral trade surplus with the U.S
-Unlike Japan, export surge is “across the board” in low value added manufactures.Focus is primarily on appreciating the Renminbi:
-Schumer-Graham bill of March 2005 for a 27.5% tariff on U.S. imports from China unless RMB appreciates (withdrawn October 2006, but new threat in 2007) -Section 3004 of U.S. Public Law 100-418: U.S. Secretary of Treasury must report twice a year on whether countries with trade surpluses are “manipulating” their currencies.
• RMB rises by 2.1% on July 21 2005, and begins slow upward crawl to 2008• Sept, 2010, House of Rep, in bipartisan vote, authorizes Commerce Dept to
impose tariffs on imports from China to offset “unfair” exchange rate and other trade practices.
• Oct. 2012: Pre-election China bashing by both Democrats and Republicans

Source: Federal Reserve Economic Data
Figure 1: China’s monetary policy and the yuan/dollar rate(1994-2012)
Fixed Exchange Rate Anchor:Monetary Stability
One way bet on RMB appreciation:Loss of monetary control; inflation
“Accidental stabilization”:Regain monetary control
Appreciation;Loss of monetary control again
Note:before 1994 China's currency was inconvertible with multiple exchange rates

Source: IMF.
Real GDP Growth and Consumer Price Inflation, China, 1980-2010
-5
0
5
10
15
20
25
1980 1983 1986 1989 1992 1995 1998 2001 2004 2007 2010
perc
ent
cpi inflation
real growth

The Yuan/Dollar Rate: A Potted History
• 1995 to 2004 rate fixed at 8.28 Y/$ to stop inflation and anchor price level
• July 2005 to July 2008, one-way bet on gradual RMB appreciation: hot money inflows, buildup of
official exchange reserves, loss of monetary control, disruption of forward exchange market.
• Y/$ rate reset at 6.83 July 2008 through June 2010. Monetary control regained with a massive
expansion of bank credit offsetting sharp export fall. • June 2010, RMB officially unpegged from dollar but the
rate moves very little—about 3 percent as of Jan 2011• RMB little changed at 6.3 yuan per dollar for 2012

China’s Savings by source
Source: CEIC, GS Global ECS Research.
0
5
10
15
20
25
19921993
19941995
19961997
19981999
20002001
20022003
20042005
20062007
% of GDP
Household
Corporate
Government

Source: UBS
Share of Investment and Consumption of China’s GDP

Figure 16: Investment, Savings and Current Account of China (as a percent of GDP)
Source: EIU
0
10
20
30
40
50
60
2000 2001 2002 2003 2004 2005 2006 2007 2008
Investment
Savings
Current Account Surplus

Exchange Rate and the Trade Balance
X − M = S − I = Trade (Saving) SurplusX is exports and M is imports broadly defined, S and I are gross domestic saving and investment
Two theoretical Approaches:(1) Microeconomic focus on X − M : the elasticities
approach to the trade balance; and(2) Macroeconomic focus on S − I : the absorption
approach to the trade balance.

Effect of Appreciating the Renmimbi ?
• Elasticities Approach: X ↓ M↑ and trade surplus declines
• Absorption Approach:S ↕ I↓ and trade surplus ?But if I is sensitive to the exchange rate and slumps, trade surplus increases. Investment in China’s open economy, with multinational firms, is huge: more than 40% of GDP.
• Japan’s experience with ever-higher yen, 1971 – 95: Investment eventually slumped with general deflation, followed by “lost” decades, but the trade surplus remained.

Expected Appreciation of RMB
• “Hot” money flows into China - sharper build up of official exchange reserves
- threatened loss of monetary control as base money expands from foreign exchange intervention -sterilization disrupts normal flow of bank credit - domestic interest rates bid down with possible bubbles in asset markets such as real estate.
• No natural capital outflow to finance China’s huge trade (net saving) surplus

Source: Standard Chartered Research
Composition of China’s Foreign Exchange Reserve

Source: UBS
Figure 5: Historical Lending Activities of Chinese Commercial Banks
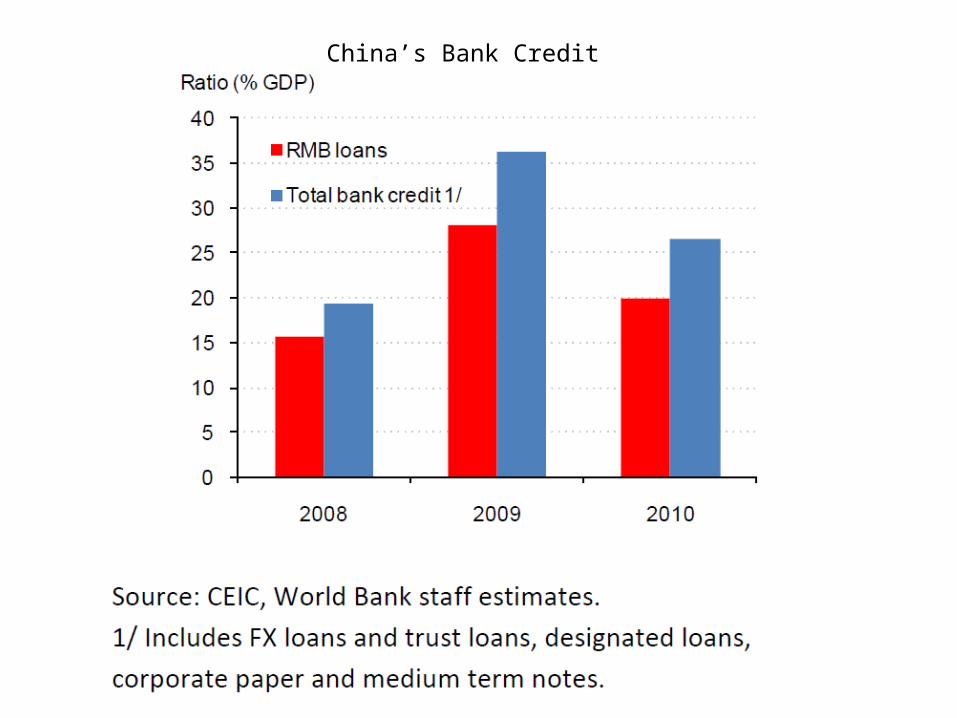
China’s Bank Credit


2007 2008 2009 2010 2011 2012 201380
90
100
110
120
130
140
150
160
170
180
World's real GDP in recoveries (2007=100)
WorldAdvanced EconomiesEmerging and Developing EconomiesChinaUS
Projections

Countercyclical Bank Lending: U.S. and China Compared (D.Malpass)
• United States: bank credit is pro-cyclical -animal spirits with few controls in booms - heavy controls after busts: increased bank capital, mark-to-market accounting, closer regulatory scrutiny.
• China: bank credit is counter-cyclical-lending restricted during booms with rationing- lending encouraged (required?) in a bust
• A natural consequence of indirect regulation in U.S. against state ownership of banks in China?

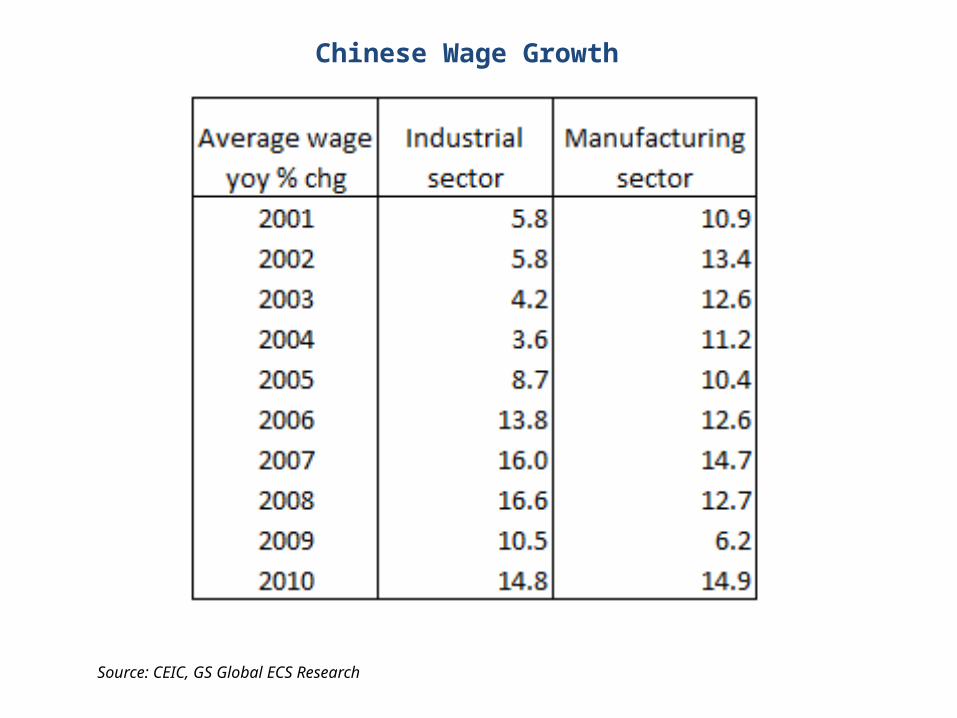
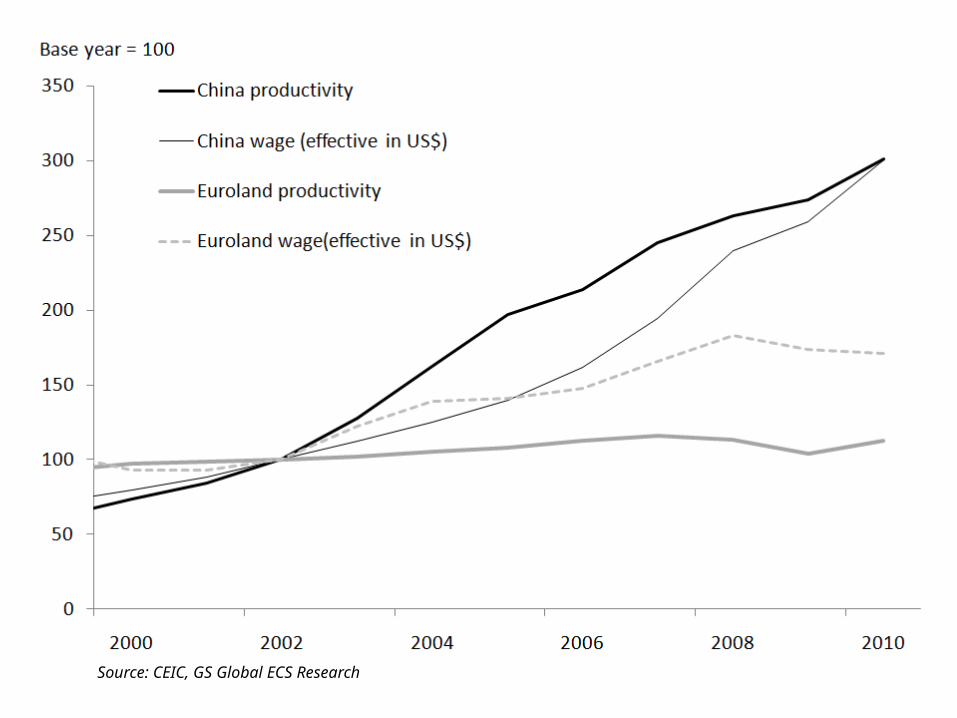
Wage and Labor Productivity Growth: Unit labor Costs in China
• Discrete changes in the yuan/dollar rate will not predictably affect the trade (net saving) balance.
• But to sustain a stable Y/$ rate, balancing “international competitiveness” still requires that Chinese unit labor costs (ULCs) approach those in the United States.
• Evidence suggests that if the nominal exchange rate is stable, money wages in the high-growth country rise sufficiently fast that ULCs converge.
• Conversely, with actual or expected appreciation, money wage growth slows with no tendency to converge to a stable equilibrium, e.g. Japan 1970-80s
Source: CEIC, GS Global ECS Research
Chinese Wage Growth

Source: CEIC, GS Global ECS Research

Source: CEIC, GS Global ECS Research
Source: CEIC, GS Global ECS Research

Earlier Evidence from Japan since 1950

Japan and the United States, 1950-1971, with the Yen Fixed at 360 per dollar (average annual percent change in key indicators)
Wholesale prices Money wages Consumer prices Industrial production
U.S. Japan U.S. Japan U.S. Japan U.S. Japan
1.63 0.69a 4.52 10.00 2.53 5.01 4.40 14.56
Real GDP Nominal GDP Narrow money Labor productivity
U.S. Japan U.S. Japan U.S. Japan U.S. Japan
3.84 9.45a 6.79 14.52a 3.94 16.10b 2.55 8.92c
Source: IFS, Japan Economic Yearbook, Economic Survey of Japan, OECD Economic Surveys and Bureau of Labor Statistics. a1952-1971.b1953-1971.c1951-1971.

Manufacturing Wage Growth for U.S. and Japan 1950-71with Exchange Rate Fixed at 360 Yen per Dollar
100
200
300
400
500
600
700
800
1950 1951 1952 1953 1954 1955 1956 1957 1958 1959 1960 1961 1962 1963 1964 1965 1966 1967 1968 1969 1970 1971
Japan
USA

Figure 2: Differential in Wage Growth between Japan and U.S., and Yen/Dollar Rate, 1950-2004
-10%
-5%
0%
5%
10%
15%
20%
1950 1954 1958 1962 1966 1970 1974 1978 1982 1986 1990 1994 1998 2002
per
cen
t
-20
60
140
220
300
380
yen
/do
llar
wage differential
yen/dollar

Source: Datastream
Yen and Yuan against the Dollar

Yuan/Dollar and Wage Growth• In the long run, nominal exchange appreciation
and money wage growth are substitutes .• But anticipated exchange appreciation induces
hot money inflows, upsets the financial markets, and inhibits wage growth.
• For a catch-up economy with high productivity growth like China, stabilize the nominal exchange rate and allow fast wage growth
• But additional steps to increase personal income and consumption remain necessary to reduce the trade (net saving) surplus

Real effective exchange rates for the renminbi and their components2005 = 100
Source: Ma, McCauley and Lam, 20121 The CPI–based REER and NEER of the broad BIS basket consisting of 61 trading partners’ currencies. 2 The ULC–based REER basket covers 43 trading partners’ currencies, with a combined trade weight of 95% of the broad BIS basket for the renminbi. The 43 BIS trade weights are renormalized for our ULC–based REER basket. 3 ULC of the industry sector for the euro area and of manufacturing sector for others; China’s ULC is estimated using the ratio of the total nominal manufacturing wage bills to the real GDP of the manufacturing sector. Refer to Box 1 for details of China’s ULC.Sources: OECD; CEIC; national data; authors’ own estimates.

Real bilateral and effective exchange rates for the renminbi2005 = 100
Against US dollar Against euro
Bilateral Japanese yen Against currencies of emerging market3
Source: Ma, McCauley and Lam, 20121 ULC of the manufacturing sector; China’s ULC is estimated using the ratio of the total nominal wage bills to the real GDP of the manufacturing sector; refer to Box 1 for details of China’s ULC. 2 Nominal bilateral rate adjusted for the relative ULC or CPI. 3 Argentina, Brazil, Chile, Chinese Taipei, Czech Republic, Hong Kong SAR, Hungary, India, Indonesia, Israel, Korea, Malaysia, Mexico, Poland, Singapore, Thailand and Turkey. Their trade weights of broad BIS basket for the renminbi are renormalized.Source: OECD; CEIC; national data; authors’ own estimates.

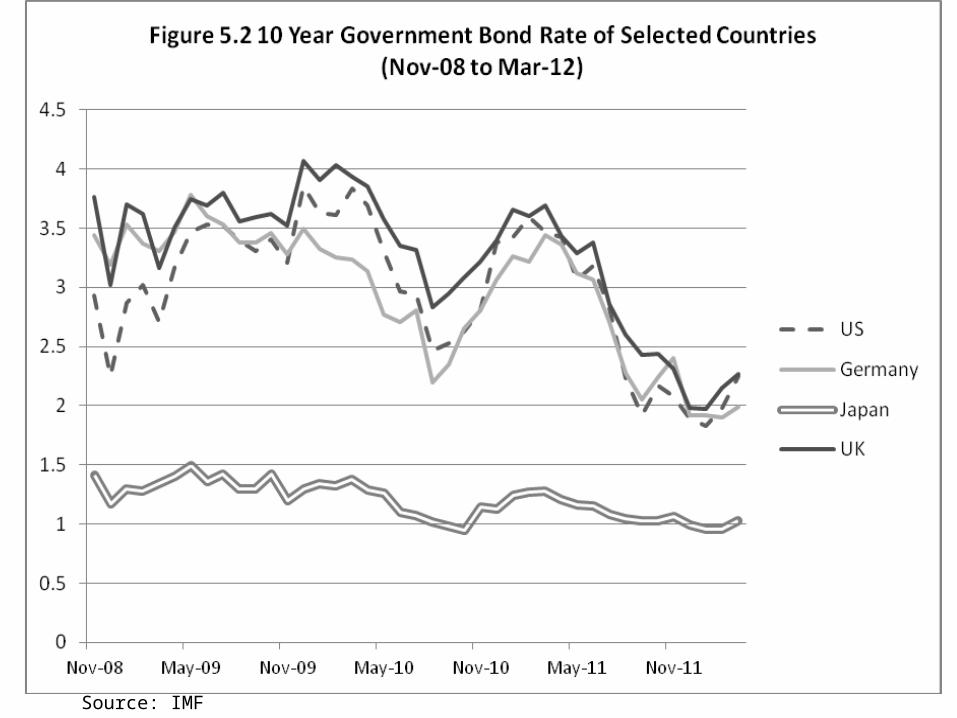
The Worldwide Inflation in 2010-11
• Near zero U.S. short-term interest rates, and QE2 to drive long-rates down, induce massive hot money outflows to emerging markets
• Officials in emerging markets from Brazil to China complain about their loss of monetary control and the welling up of inflation
• True to its past insularity, the Fed ignores these complaints and focuses on U.S. macroeconomic indicators—such as unemployment.

Source: Global Financial Data
Source: IMF

Interest Rate Structure, China and US
Source: IMF.
China United States
DepositRate
LendingRate
InterbankOvernight
GDP Growth
DepositRate
LendingRate
FederalFunds Rate
GDPGrowth
2000 2.25 5.85 8.37 6.65 9.23 6.24 6.39
2001 2.25 5.58 10.41 3.73 6.92 3.89 3.36
2002 1.98 5.31 2.4 10.50 1.88 4.67 1.67 3.46
2003 1.98 5.31 2.18 13.41 1.23 4.12 1.13 4.70
2004 2.25 5.58 2.01 17.69 1.79 4.34 1.35 6.51
2005 2.25 5.58 2.01 16.38 3.76 6.19 3.21 6.49
2006 2.52 6.12 1.31 18.76 5.27 7.96 4.96 6.02
2007 4.14 7.47 1.97 19.62 5.25 8.05 5.02 4.95
2008 2.25 5.31 2.21 18.46 3.05 5.09 1.93 2.19
2009 2.25 5.31 0.83 9.57 1.12 3.25 0.16 -1.74
2010 2.5 5.56 2.24 12.88 0.518 3.25 0.17 3.57

Source: Mehmet Yörükoğlu

2001 2002 2003 2004 2005 2006 2007 2008 2009 2010 2011 20120
1000
2000
3000
4000
5000
6000
7000
8000
Emerging Markets and China, Foreign Exchange Reserves (Billion USD)
Total Emerging Markets ChinaSource: IFSEmerging Markets (EM) include the following countries: Russia, Poland, Czech Republic, Hungary, Romania, Ukraine, Turkey, Israel, UAE, Saudi Arabia, South Africa, China, India, Hong Kong, Korea, Singapore, Indonesia, Malaysia, Thailand, Brazil, Mexico, Chile, Peru, Colombia, Argentina, Venezuela. For data missing on UAE in May to July 2012 and on China in July 2012, assuming no change in reserves in these months

China Japan Russia Taiwan Brazil Korea India Hong Kong Euro 17 Singapore0
500
1000
1500
2000
2500
3000
3500
168
355
24107
3296
38108
232
80
3223
1161
472379 348 310 284 277 257 234
Major Foreign Reserve Holders, Oil Exporters Excluded(2000 vs. 2011 Q3, in Billions of USD)
2000
2011 Q3

Source: Haver Analytics, Morgan Stanley ResearchDeveloped Markets (DM) include the following countries: United States, Germany, France, Italy, Spain, Japan, United Kingdom,
Canada, Sweden, Australia
Emerging Markets (EM) and Developed Markets (DM) Inflations

Source: Mehmet Yörükoğlu

Source: Bloomberg and Federal Reserve Economic Data
Figure 4: The Greenspan-Bernanke Bubble Economy

2005 2006 2007 2008 2009 2010 2011 201250
100
150
200
250
300
350
Food/Agriculture Product Price (2005=100)
UN Food And Agriculture World Cereals Price Index S&P GSCI Agriculture IndexSource: Bloomberg
Start of ArabSpring

Figure 4: World GDP*
Source: The Economist (Oct 30-Nov 5 2010)*Estimates based on 52 countries representing 90% of world GDP. Weighted by GDP at purchasing power parity

Source: Financial Times (November 12, 2010)
Figure 5: Two Speed Recovery
Source: World Bank
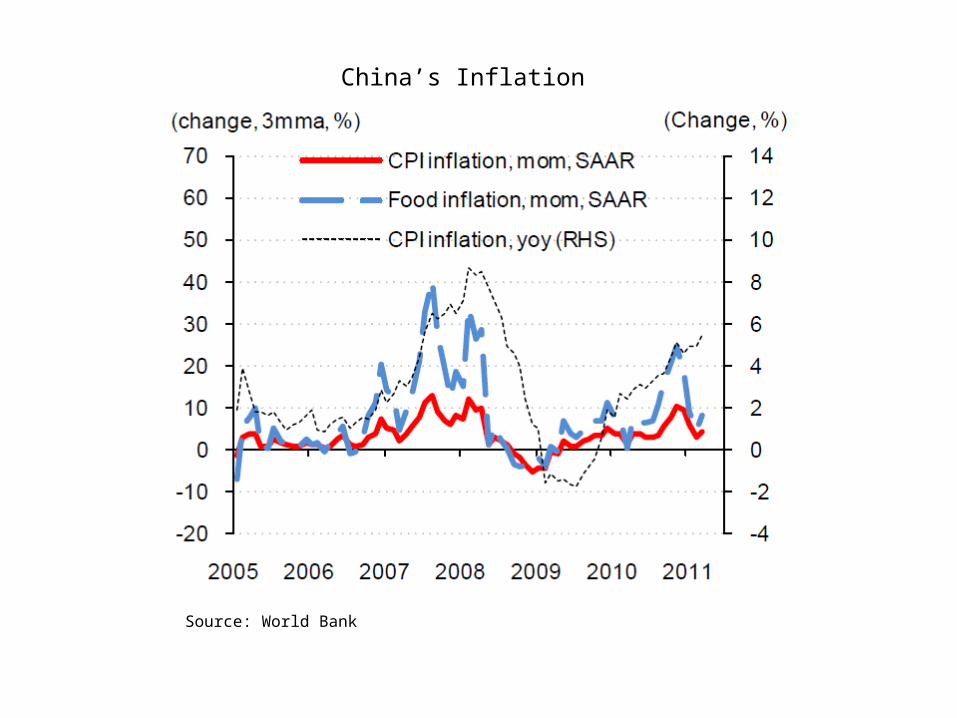
China’s Inflation

Source: Haver Analytics, Morgan Stanley ResearchEmerging Markets (EM) include the following countries: Russia, Poland, Czech Republic, Hungary, Romania, Ukraine, Turkey,
Israel, UAE, Saudi Arabia, South Africa, China, India, Hong Kong, Korea, Taiwan, Singapore, Indonesia, Malaysia, Thailand, Brazil, Mexico, Chile, Peru, Colombia, Argentina, Venezuela

Conclusion for US Monetary Policy• In 2010 into 2011, the Fed again ignores distress on the dollar
standard’s periphery by pursuing an inward-looking QE2• But near zero interest rates are not in America’s own best
interest either: - fall in retail bank credit - de-capitalization of defined-benefit pension funds - eventual import of inflation from abroad
• A mistake to ignore feedbacks from ROW• In 2012, QE3 and zero interest rates marginally effective in
U.S. while imposing financial repression on the rest of the world

China and Its Dollar Exchange RateA Worldwide Economic Stabilizer?
• China’s Economy• The East Asian Economy• The World Economy

Source: IMF.
Real GDP Growth and Consumer Price Inflation, China, 1980-2010
-5
0
5
10
15
20
25
1980 1983 1986 1989 1992 1995 1998 2001 2004 2007 2010
perc
ent
cpi inflation
real growth

0%
10%
20%
30%
40%
50%
60%
70%
80%
1980 1982 1984 1986 1988 1990 1992 1994 1996 1998 2000 2002 2004 2006 2008 2010 2012
perc
ent
Japan
China
East Asia 8
Economic Weights in East Asia (1)
as percent of East Asian GDP
Source: IMF.

Economic Weights in East Asia (2)
0
10
20
30
40
50
60
70
1980 1982 1984 1986 1988 1990 1992 1994 1996 1998 2000 2002 2004 2006 2008
per
cen
t of
tota
l in
tra-
reg
ion
al t
rad
e
China
Japan
East Asia 8
as percent of intra-East Asian exports
Source: IMF.

Source: Datastream
Yen and Yuan against the Dollar

Real Growth in East Asia
-15%
-10%
-5%
0%
5%
10%
15%
1989 1991 1993 1995 1997 1999 2001 2003 2005 2007 2009per
cen
t
China Hong Kong
Malaysia Singapore
Thailand Japan
Philippines South Korea
Taiwan Indonesia
Source: IMF.
East Asia

Global Growth Performance
-5%
-3%
-1%
1%
3%
5%
7%
9%
11%
13%
15%
1980 1983 1986 1989 1992 1995 1998 2001 2004 2007 2010 2013
per
cen
t
European UnionChinaJapanUS
Source: IMF.World

19801981
19821983
19841985
19861987
19881989
19901991
19921993
19941995
19961997
19981999
20002001
20022003
20042005
20062007
20082009
20102011
0
20
40
60
80
100
120
China GDP Composition, 1980-2011
NetExport
Stockbuilding
Gross Fixed Capital Formation
Government Consumption
Private Consumption

China as World Stabilizer: Conclusion as of 2011
• Since 1994, China’s stable dollar exchange rate and current account convertibility were followed by high noninflationary growth of 8 to 10%.
• In East Asia, as China surpassed Japan in trade and size by the mid 2000s, its high growth and more stable dollar rate better smoothed regional business cycles.
• In the global downturn of 2008-09, an ever larger Chinese economy with its counter-cyclical fiscal policy based on bank credit was an important stabilizer on a world scale.
• But China’s international stabilizing role could yet be unhinged by unduly low interest rates in the United States leading to inflationary inflows of hot money.
Can China Do it Again?Countering the World Downturn of 2012
• The unending crisis of the euro with negative economic growth in Europe in 2012.
• The faltering U.S. economic recovery from the 2008-09 slump