Semih Yildirim ADMS3530 11-1 Chapter 11 Risk, Return and Capital Budgeting Chapter Outline ...
29
Semih Yildirim ADMS3530 11-1 Chapter 11 Risk, Return and Capital Budgeting Chapter Outline Measuring Market Risk The Beta of an Asset Risk and Return Capital Asset Pricing Model – CAPM Security Market Line – SML Capital Budgeting and Project Risk
-
date post
21-Dec-2015 -
Category
Documents
-
view
218 -
download
0
Transcript of Semih Yildirim ADMS3530 11-1 Chapter 11 Risk, Return and Capital Budgeting Chapter Outline ...

Semih Yildirim ADMS3530
11-111-1
Chapter 11Risk, Return and Capital Budgeting
Chapter Outline Measuring Market Risk
The Beta of an Asset Risk and Return
Capital Asset Pricing Model – CAPMSecurity Market Line – SML
Capital Budgeting and Project Risk

Semih Yildirim ADMS3530
11-211-2
Measuring Market Risk• The Market Portfolio
We learned in the last chapter that we should be interested in market risk.
Market risk is a result of macroeconomic events which affect almost all companies and the returns on almost all stocks.
We can measure market risk by tracking the performance of a market portfolio of all securities.
But, in this chapter, we want to define and measure the relevant risk on an individual stock, not a portfolio of stocks.
Since we now know that unique risk is not of concern to investors, what we want to measure is the market risk of an individual stock.

Semih Yildirim ADMS3530
11-311-3
Measuring Market Risk• The Market Portfolio
We will measure a stock’s market risk by comparing the sensitivity of the stock’s returns to fluctuations in the market portfolio.
We will call this measure of sensitivity beta (). In theory, the market portfolio should contain all the
assets in the world economy. Not just stocks, but bonds, foreign securities, real estate, etc.
In reality, financial analysts use indexes of the stock market, such as the S&P/TSX Compsite Index as proxies for the market portfolio.

Semih Yildirim ADMS3530
11-411-4
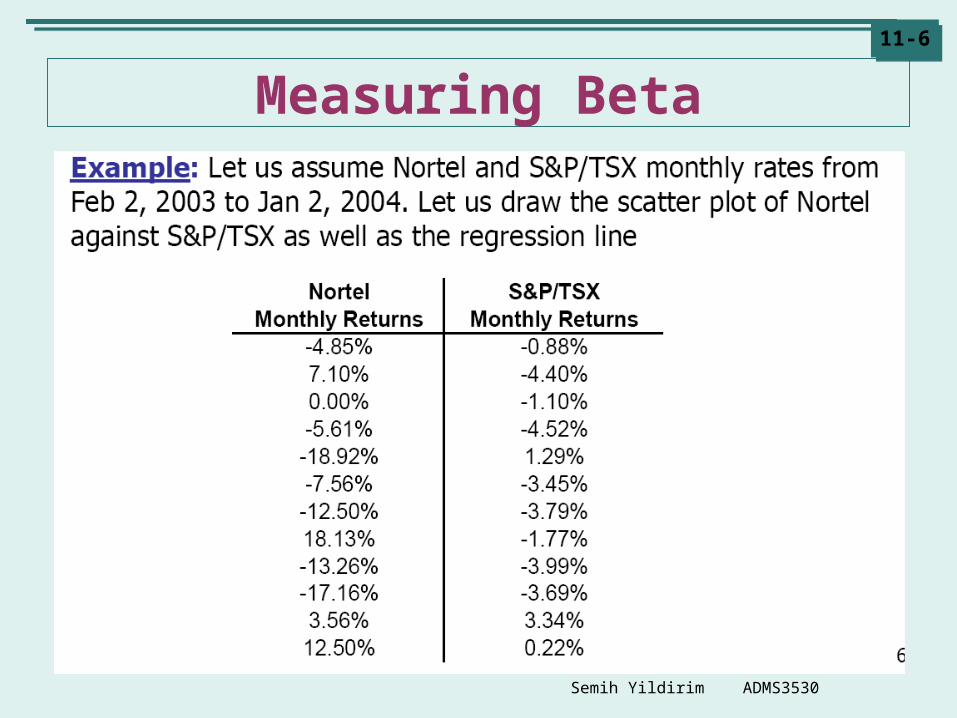
Measuring Beta• To measure a stock’s beta, the following steps should be
followed:
1. Collecting data on the returns on the market portfolio over a specified time period.
2. Collecting data on the returns on a stock over the same time period.
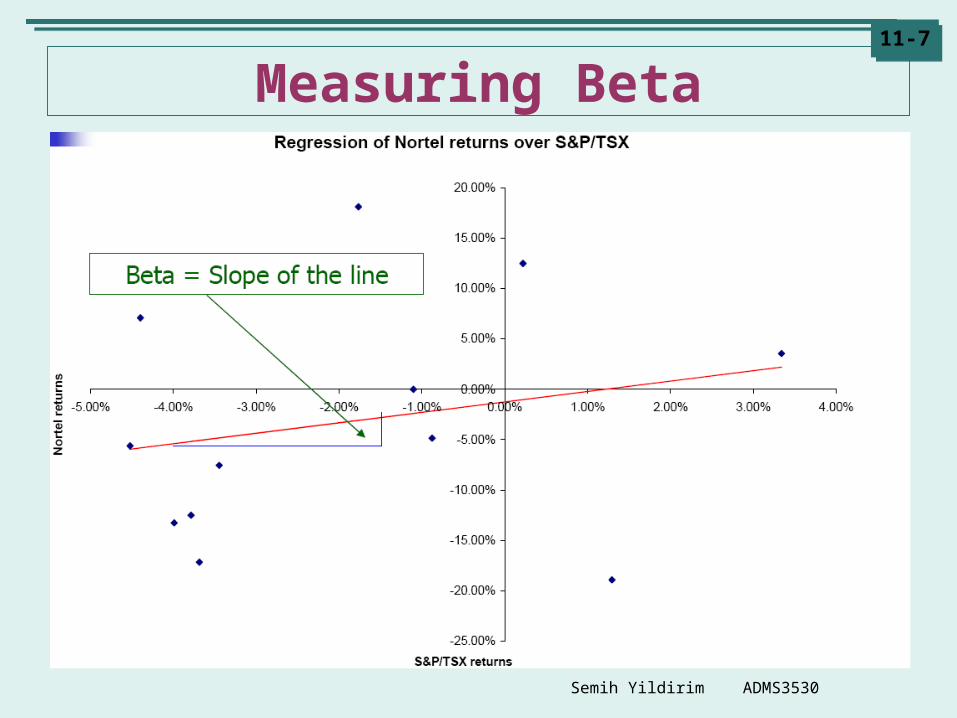
3. Graphing the returns on the stock against the returns on the market.
4. Drawing a regression line through the points and measuring its slope.
5. The slope of the regression line is the stock’s beta.

Semih Yildirim ADMS3530
11-511-5
-1
-0.5
0.5
1
1.5
-1.5 -1 -0.5 0.5 1 1.5
Market Return (%)
Sto
ck R
etu
rn (
%)
Calculating Beta
Measuring Beta
= slope of line = 0.804
Return to stock j vs return to market
Semih Yildirim ADMS3530
11-611-6
Measuring Beta
Semih Yildirim ADMS3530
11-711-7
Measuring Beta

Semih Yildirim ADMS3530
11-811-8
Measuring Beta

Semih Yildirim ADMS3530
11-911-9
Measuring Beta• Example, you know:• The correlation of the stock’s return with the market’s return (jm) = 0.70
• The covariance of the stock’s return with the market’s return (covjm) = 0.042
• The standard deviation of the market (m) = 20%.
• The standard deviation of the stock (j) = 30%.
Beta of Stockj = j =
jmj
m
=
=Beta of Stockj = j =
cov(rjrm)
m2

Semih Yildirim ADMS3530
11-1011-10
Measuring Beta

Semih Yildirim ADMS3530
11-1111-11
Measuring Market Risk• Example:
If you look at Table 11.1 of your text, you will see the betas for some selected Canadian common stocks.
Suppose you had invested 40% of your money in RIM and 60% of your money in RBC.
What would be the beta of the portfolio?

Semih Yildirim ADMS3530
11-1211-12
Risk and Return• Benchmark BetasThe return on a t-bill is fixed and unaffected by what happens in the
market. Thus, its beta is zero.A portfolio with average market risk is by definition set at a beta of
one. Its expected return equals the return on a t-bill plus the normal market
risk premium of 7%.Given these two benchmarks, is it possible to calculate the return on
an asset, or portfolio, with a beta other than zero or one?
• Measuring Return Given Beta For example, what is the expected return on a stock
with a beta of 0.5 if: A t-bill returns 4% and the market returns 11%.
As a result:Market risk premium = rm - rf = 11% - 4% = 7%
Semih Yildirim ADMS3530
11-1311-13
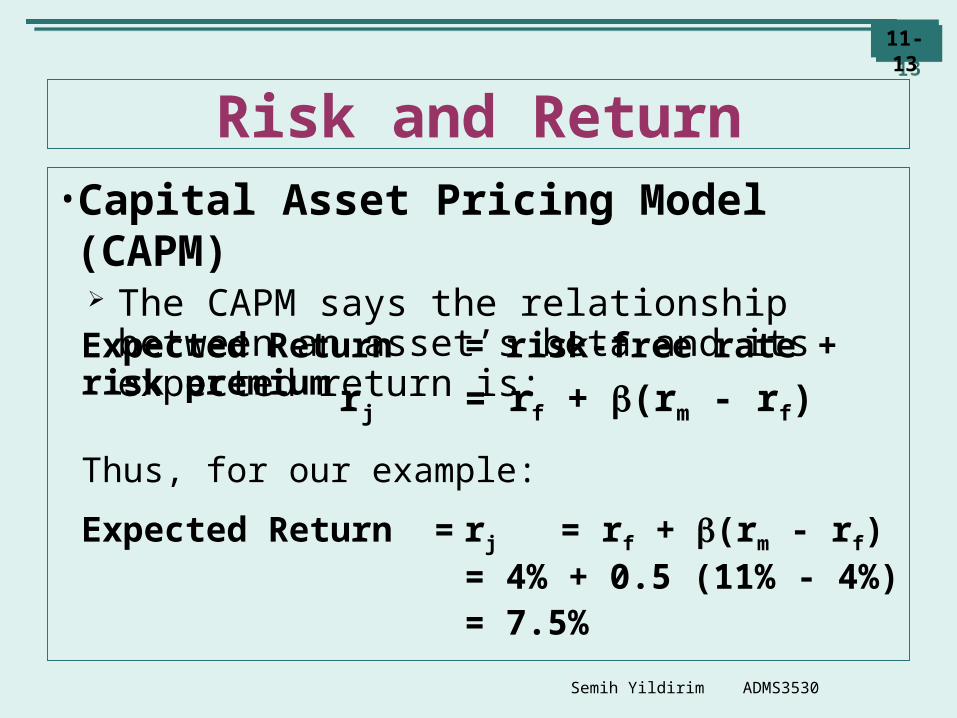
Risk and Return• Capital Asset Pricing Model (CAPM)
The CAPM says the relationship between an asset’s beta and its expected return is:
Expected Return = risk-free rate + risk premium
rj = rf + (rm - rf)
Expected Return = rj = rf + (rm - rf) = 4% + 0.5 (11% - 4%)
= 7.5%
Thus, for our example:

Semih Yildirim ADMS3530
11-1411-14
Risk and ReturnExample: The return on Tbills is 4%, the market portfolio return is 11%. What would be the returns on the stocks in slide 10?

Semih Yildirim ADMS3530
11-1511-15
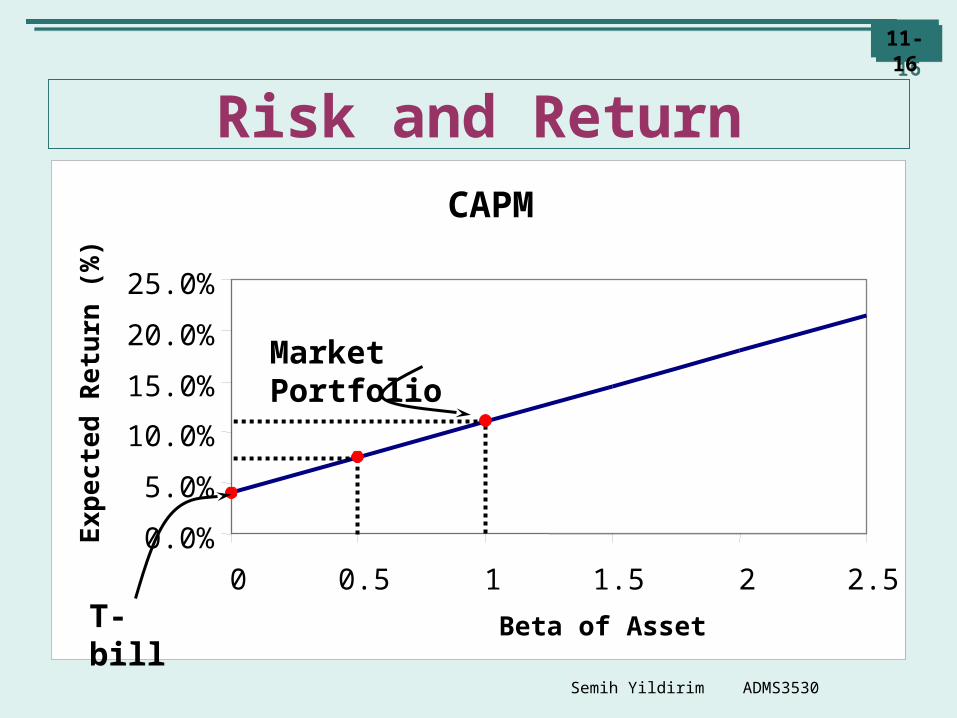
Risk and Return• Capital Asset Pricing Model (CAPM)
The CAPM says that given the risk-free rate is 4% and the market risk premium is 7%, an asset with a beta of 0.5 will have an expected return of 7.5%
This relationship is graphed on the next slide. Note that on this graph:
The beta of a t-bill is zero. Expected return = 4% + 0.0x(11% - 4%) = 4%
The beta is 1.0 for a market risk portfolio. Expected return = 4% + 1.0x(11% - 4%) = 11%
Semih Yildirim ADMS3530
11-1611-16
CAPM
0.0%
5.0%
10.0%
15.0%
20.0%
25.0%
0 0.5 1 1.5 2 2.5
Beta of Asset
Ex
pe
cte
d R
etu
rn (
%)
Risk and Return
Market Portfolio
T-bill

Semih Yildirim ADMS3530
11-1711-17
Risk and Return• Security Market Line (SML)
On the graph, the blue line which shows the relationship between the risk of the security (its beta) and the return on the security is called the Security Market Line (SML).
The SML sets the standard for other investments. Investors will hold other investments only if they offer equally
good prospects. For example, you are looking at investing in security
with a beta of 2.3 and an expected return of 16%. Is this pricing information sustainable?

Semih Yildirim ADMS3530
11-1811-18
CAPM
0.0%
5.0%
10.0%
15.0%
20.0%
25.0%
0 0.5 1 1.5 2
Beta of Asset
Ex
pe
cte
d R
etu
rn (
%)
Risk and Return
2.3
Proposed Holding

Semih Yildirim ADMS3530
11-1911-19
Risk and Return• Security Market Line (SML)
If you look at the graph, you will see that an asset with a beta of 2.3 should yield about 20%. This security is yielding only 16%. No one would buy it because the expected return is
insufficient for the risk. It is overpriced, don’t buy! The result:
The security’s price would drop, causing the expected return to rise.
The price would fall until the security’s expected return was pushed up to 20%.
At that price and expected return the CAPM holds.

Semih Yildirim ADMS3530
11-2011-20
Risk and Return

Semih Yildirim ADMS3530
11-2111-21
Risk and Return• Security Market Line (SML)
The reasoning we have just gone through holds for any asset with any level of risk.
The expected return on an asset should reflect its relevant risk, which is measured by its beta. If the expected return does not reflect the security’s
risk properly, then the price of the asset should adjust up, or down.
The price will adjust until the asset generates the return required by the market given the security’s risk level.

Semih Yildirim ADMS3530
11-2211-22
Risk and Return

Semih Yildirim ADMS3530
11-2311-23
Risk and Return

Semih Yildirim ADMS3530
11-2411-24
Risk and Return• How Well Does the CAPM Work?
Studies have found the CAPM is too simple to capture exactly how stock markets work.
However the CAPM does capture two fundamental financial principals in a simple way: Investors require extra return for taking on risk. Investors appear to be concerned primarily with the market risk
they cannot eliminate by diversification. Thus the CAPM is a good rule of thumb for pricing assets. There are other models such as multi-factor CAPM, APT.

Semih Yildirim ADMS3530
11-2511-25
Risk and Return• Using the CAPM to Estimate Project Returns
You can use the CAPM to estimate the discount rate for new capital projects.
For example, Biomira has a beta of 1.25. Thus:
Expected Return = 4% + 1.25x(11% - 4%) = 12.75%
If Biomira were proposing an expansion project, you would discount its estimated cash flows at 12.75%.
We just estimated the company cost of capital for Biomira which is the expected rate of return demanded by investors.
It is determined by the average risk of the company’s assets and operations.

Semih Yildirim ADMS3530
11-2611-26
Company vs Project Risk• What happens if the project and the company are not
equally risky? Suppose Biomira wants to invest in the broadcasting business, what would be the discount rate?
• The company cost of capital may be used to discount the cash flows of a project under certain conditions.
• Suppose Biomira is considering 3 projects: Project 1 is an expansion project with the same overall risk
as the company itself. Project 2 involves the introduction of a new product line and
its risk exceeds that of the company itself. Project 3 has no risk and involves the sale of a guaranteed
amount of product to the government at a guaranteed price.• For which of these projects should you use the company
cost of capital in analyzing the forecasted cash flows?

Semih Yildirim ADMS3530
11-2711-27
Capital Budgeting and Project Risk• Company vs Project Risk
Remember that the discount rate should reflect the risk of the project’s cash flows.
Only Project 1 has the same risk as Biomira. Thus, only Project 1’s cash flows should be discounted at
12.75%, the company’s cost of capital. You must use a different cost of capital for the other
two projects. Project 3 has no risk.
You should recognize that its cash flows would be discounted at the current t-bill rate.
Project 2 is more risky than the company itself, so we know its discount rate should be greater than 12.75%.

Semih Yildirim ADMS3530
11-2811-28
Capital Budgeting and Project Risk• Company vs Project Risk
This leads to another fundamental principal of finance: A project’s required rate of return depends on the project’s risk. Discount a project at the project cost of capital.
This is the minimum acceptable rate of return on a project given its risk level.
• Determinants of Project Risk We now know that a company’s cost of capital is the
correct discount rate for projects that have the same risk as the company’s existing business.
It is not appropriate for projects which are safer or riskier than the company’s average.
How can you estimate a project’s risk level? Estimating a project’s risk isn’t an exact science, but
here are a few things to bear in mind.

Semih Yildirim ADMS3530
11-2911-29
Capital Budgeting and Project Risk
Determinants of Project Risk• Operating leverage increases the risk of a project.
High fixed cost projects tend to have high betas.• Only market risk is important.
Ignore unique risk, that is, those risks which are specific only to that particular project.
Look for those risks in the project which reflect macroeconomic factors. That is, cyclical companies tend to have high betas.
• Look at the risk and the required returns of a similar risk project outside the company to find a proxy for the project.
Sometimes you can find a company which is exclusively involved in the type of project your firm is proposing.
You can use its beta as a proxy for the project’s beta. This approach is known as a pure play approach.