SEMICONDUCTOR INDUSTRY ASSOCIATION...semiconductor industry. In all major country and regional...
30
Transcript of SEMICONDUCTOR INDUSTRY ASSOCIATION...semiconductor industry. In all major country and regional...
www.semiconductors.org
SEMICONDUCTOR INDUSTRY ASSOCIATION FACTBOOKIntroduction
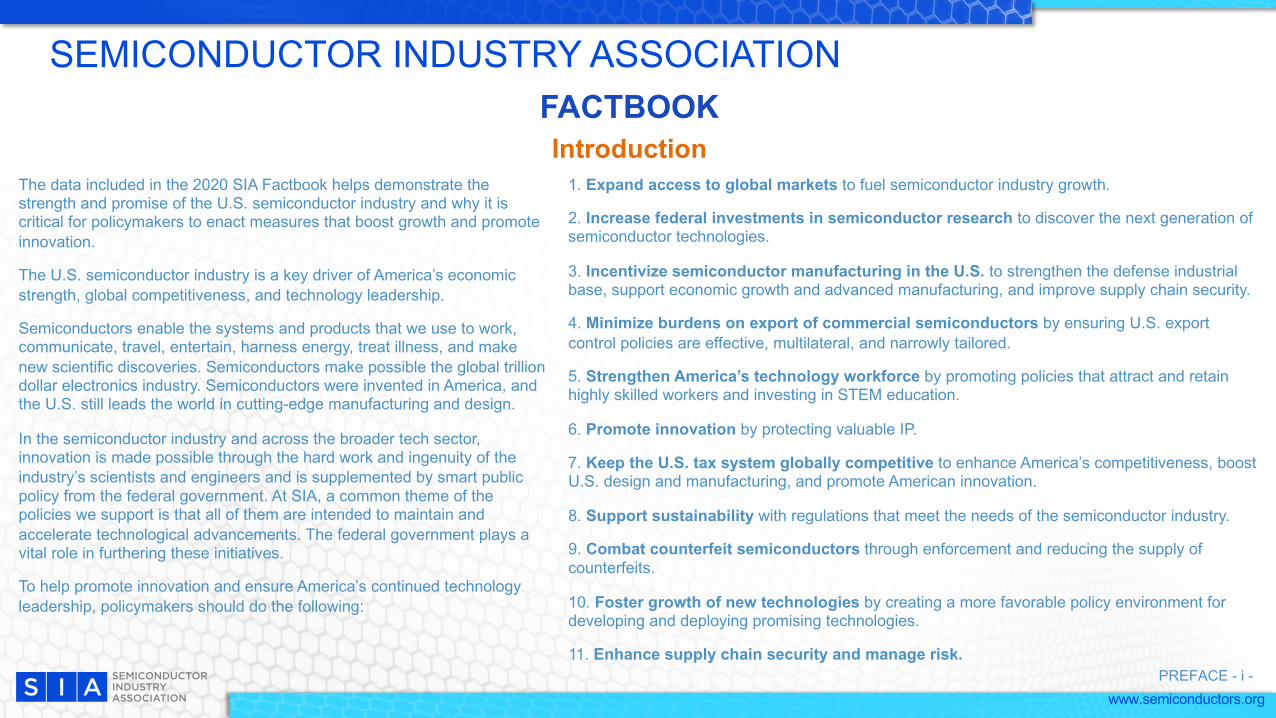
1. Expand access to global markets to fuel semiconductor industry growth.
2. Increase federal investments in semiconductor research to discover the next generation of semiconductor technologies.
3. Incentivize semiconductor manufacturing in the U.S. to strengthen the defense industrial base, support economic growth and advanced manufacturing, and improve supply chain security.
4. Minimize burdens on export of commercial semiconductors by ensuring U.S. export control policies are effective, multilateral, and narrowly tailored.
5. Strengthen America’s technology workforce by promoting policies that attract and retain highly skilled workers and investing in STEM education.
6. Promote innovation by protecting valuable IP.
7. Keep the U.S. tax system globally competitive to enhance America’s competitiveness, boost U.S. design and manufacturing, and promote American innovation.
8. Support sustainability with regulations that meet the needs of the semiconductor industry.
9. Combat counterfeit semiconductors through enforcement and reducing the supply of counterfeits.
10. Foster growth of new technologies by creating a more favorable policy environment for developing and deploying promising technologies.
11. Enhance supply chain security and manage risk.PREFACE - i -
The data included in the 2020 SIA Factbook helps demonstrate the strength and promise of the U.S. semiconductor industry and why it is critical for policymakers to enact measures that boost growth and promote innovation.
The U.S. semiconductor industry is a key driver of America’s economic strength, global competitiveness, and technology leadership.
Semiconductors enable the systems and products that we use to work, communicate, travel, entertain, harness energy, treat illness, and make new scientific discoveries. Semiconductors make possible the global trillion dollar electronics industry. Semiconductors were invented in America, and the U.S. still leads the world in cutting-edge manufacturing and design.
In the semiconductor industry and across the broader tech sector, innovation is made possible through the hard work and ingenuity of the industry’s scientists and engineers and is supplemented by smart public policy from the federal government. At SIA, a common theme of the policies we support is that all of them are intended to maintain and accelerate technological advancements. The federal government plays a vital role in furthering these initiatives.
To help promote innovation and ensure America’s continued technology leadership, policymakers should do the following:
www.semiconductors.org
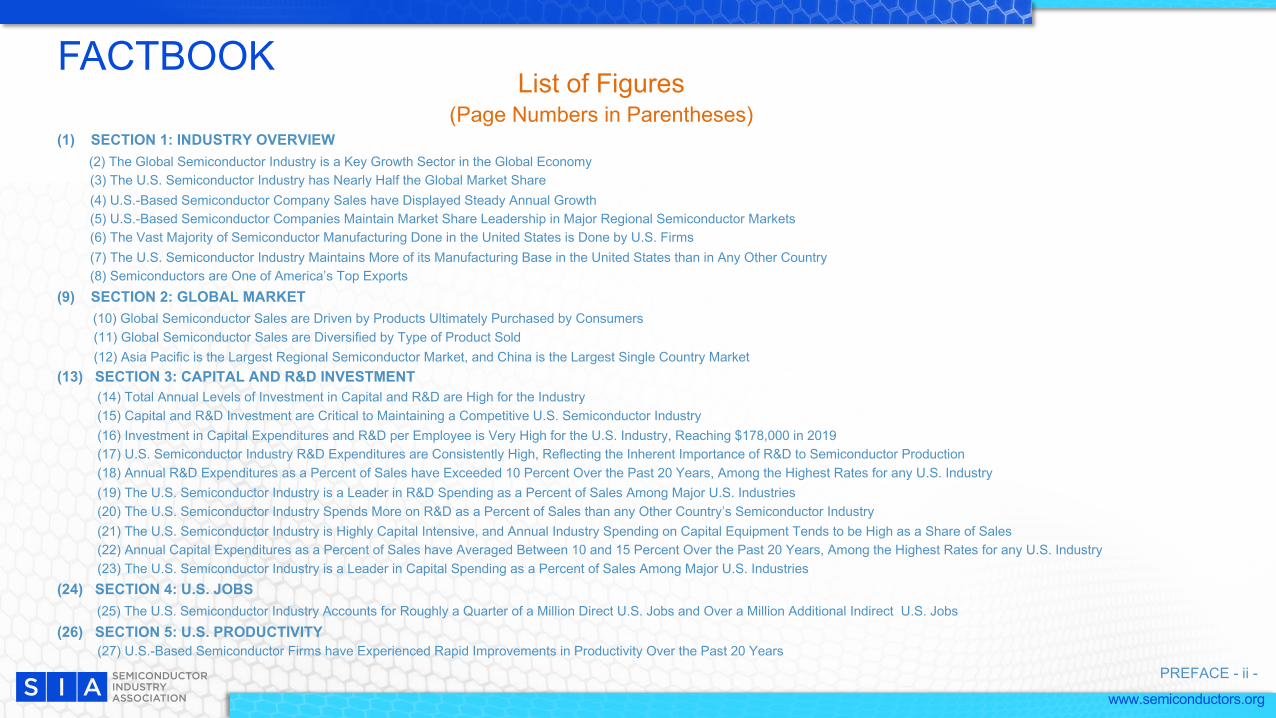
FACTBOOK List of Figures
(Page Numbers in Parentheses) (1) SECTION 1: INDUSTRY OVERVIEW
(2) The Global Semiconductor Industry is a Key Growth Sector in the Global Economy(3) The U.S. Semiconductor Industry has Nearly Half the Global Market Share(4) U.S.-Based Semiconductor Company Sales have Displayed Steady Annual Growth(5) U.S.-Based Semiconductor Companies Maintain Market Share Leadership in Major Regional Semiconductor Markets(6) The Vast Majority of Semiconductor Manufacturing Done in the United States is Done by U.S. Firms(7) The U.S. Semiconductor Industry Maintains More of its Manufacturing Base in the United States than in Any Other Country (8) Semiconductors are One of America’s Top Exports
(9) SECTION 2: GLOBAL MARKET(10) Global Semiconductor Sales are Driven by Products Ultimately Purchased by Consumers(11) Global Semiconductor Sales are Diversified by Type of Product Sold(12) Asia Pacific is the Largest Regional Semiconductor Market, and China is the Largest Single Country Market
(13) SECTION 3: CAPITAL AND R&D INVESTMENT (14) Total Annual Levels of Investment in Capital and R&D are High for the Industry(15) Capital and R&D Investment are Critical to Maintaining a Competitive U.S. Semiconductor Industry(16) Investment in Capital Expenditures and R&D per Employee is Very High for the U.S. Industry, Reaching $178,000 in 2019(17) U.S. Semiconductor Industry R&D Expenditures are Consistently High, Reflecting the Inherent Importance of R&D to Semiconductor Production(18) Annual R&D Expenditures as a Percent of Sales have Exceeded 10 Percent Over the Past 20 Years, Among the Highest Rates for any U.S. Industry(19) The U.S. Semiconductor Industry is a Leader in R&D Spending as a Percent of Sales Among Major U.S. Industries(20) The U.S. Semiconductor Industry Spends More on R&D as a Percent of Sales than any Other Country’s Semiconductor Industry (21) The U.S. Semiconductor Industry is Highly Capital Intensive, and Annual Industry Spending on Capital Equipment Tends to be High as a Share of Sales (22) Annual Capital Expenditures as a Percent of Sales have Averaged Between 10 and 15 Percent Over the Past 20 Years, Among the Highest Rates for any U.S. Industry(23) The U.S. Semiconductor Industry is a Leader in Capital Spending as a Percent of Sales Among Major U.S. Industries
(24) SECTION 4: U.S. JOBS(25) The U.S. Semiconductor Industry Accounts for Roughly a Quarter of a Million Direct U.S. Jobs and Over a Million Additional Indirect U.S. Jobs
(26) SECTION 5: U.S. PRODUCTIVITY(27) U.S.-Based Semiconductor Firms have Experienced Rapid Improvements in Productivity Over the Past 20 Years
PREFACE - ii -
www.semiconductors.org
Section 1INDUSTRY OVERVIEW
Section 1: Industry Overview - 1 -
www.semiconductors.org
0
50
100
150
200
250
300
350
400
450
500
'99 '00 '01 '02 '03 '04 '05 '06 '07 '08 '09 '10 '11 '12 '13 '14 '15 '16 '17 '18 '19
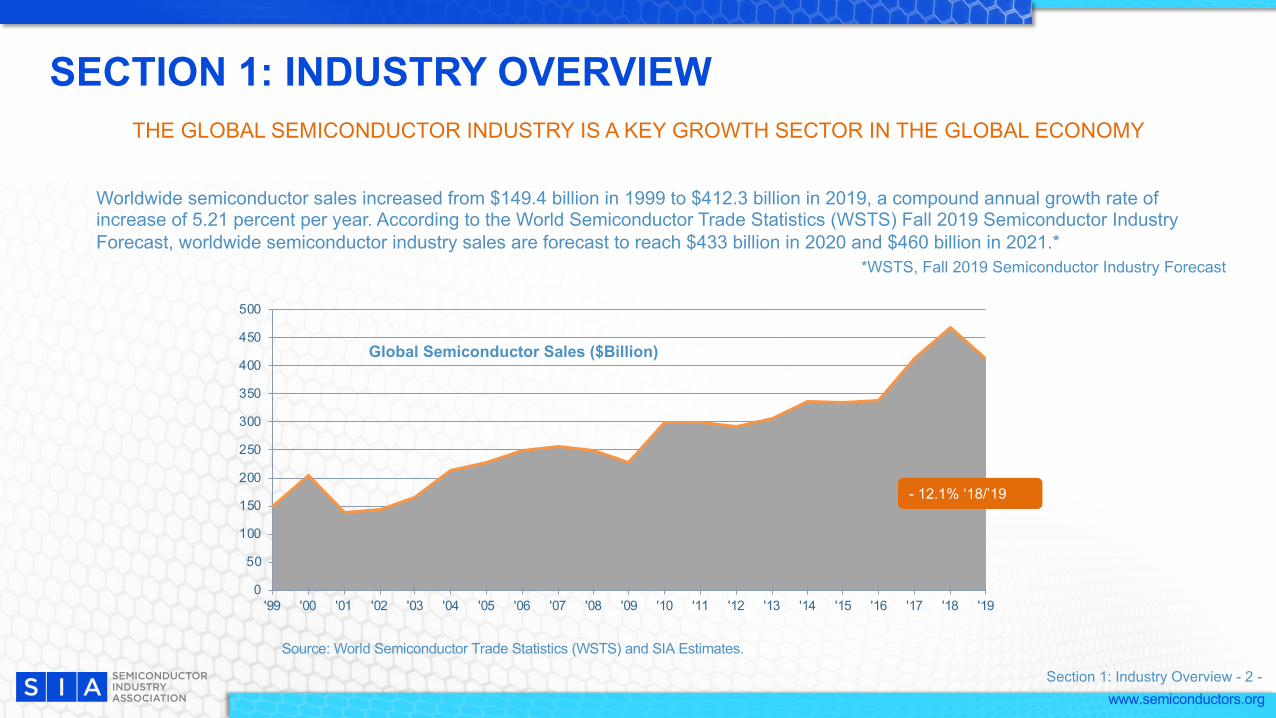
SECTION 1: INDUSTRY OVERVIEW THE GLOBAL SEMICONDUCTOR INDUSTRY IS A KEY GROWTH SECTOR IN THE GLOBAL ECONOMY
Worldwide semiconductor sales increased from $149.4 billion in 1999 to $412.3 billion in 2019, a compound annual growth rate of increase of 5.21 percent per year. According to the World Semiconductor Trade Statistics (WSTS) Fall 2019 Semiconductor IndustryForecast, worldwide semiconductor industry sales are forecast to reach $433 billion in 2020 and $460 billion in 2021.*
*WSTS, Fall 2019 Semiconductor Industry Forecast
Global Semiconductor Sales ($Billion)
Source: World Semiconductor Trade Statistics (WSTS) and SIA Estimates.
Section 1: Industry Overview - 2 -
- 12.1% ‘18/’19
www.semiconductors.org
U.S Japan Europe Korea Taiwan China
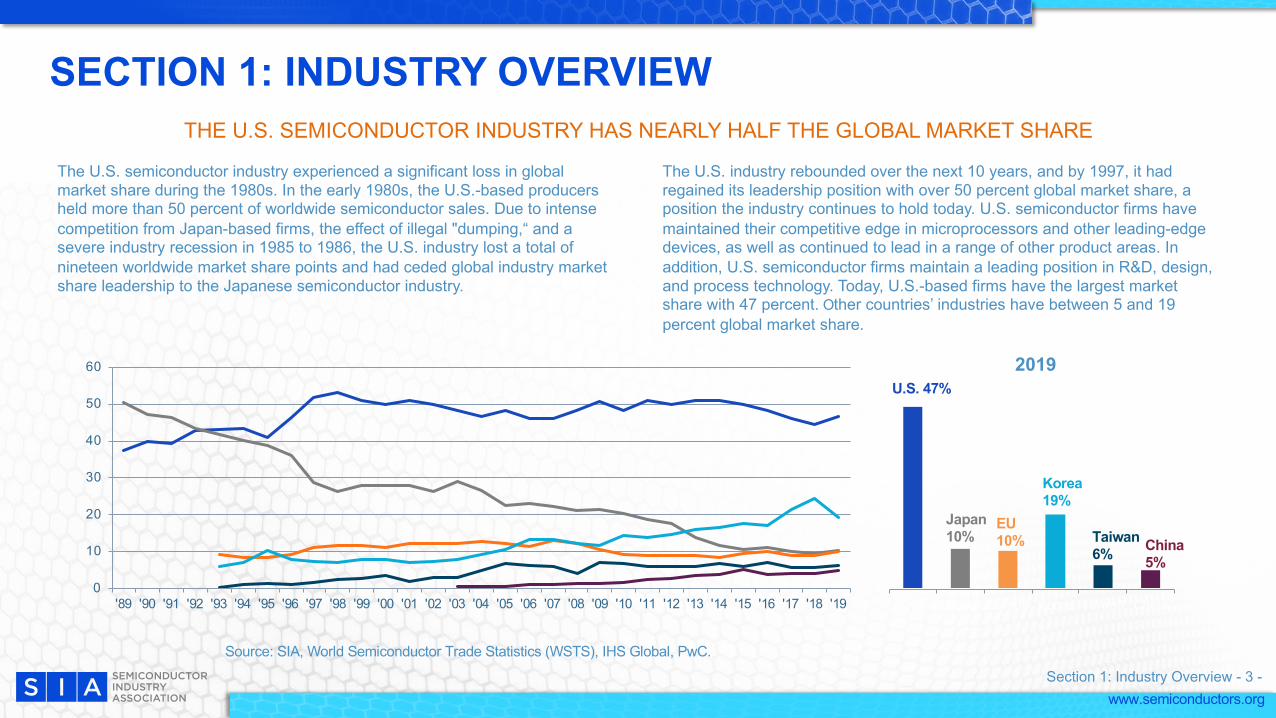
SECTION 1: INDUSTRY OVERVIEW THE U.S. SEMICONDUCTOR INDUSTRY HAS NEARLY HALF THE GLOBAL MARKET SHARE
The U.S. semiconductor industry experienced a significant loss in global market share during the 1980s. In the early 1980s, the U.S.-based producers held more than 50 percent of worldwide semiconductor sales. Due to intense competition from Japan-based firms, the effect of illegal "dumping,“ and a severe industry recession in 1985 to 1986, the U.S. industry lost a total of nineteen worldwide market share points and had ceded global industry market share leadership to the Japanese semiconductor industry.
The U.S. industry rebounded over the next 10 years, and by 1997, it had regained its leadership position with over 50 percent global market share, a position the industry continues to hold today. U.S. semiconductor firms have maintained their competitive edge in microprocessors and other leading-edge devices, as well as continued to lead in a range of other product areas. In addition, U.S. semiconductor firms maintain a leading position in R&D, design, and process technology. Today, U.S.-based firms have the largest market share with 47 percent. Other countries’ industries have between 5 and 19 percent global market share.
2019U.S. 47%
Japan 10%
EU 10%
Korea 19%
Taiwan 6% China
5%
Source: SIA, World Semiconductor Trade Statistics (WSTS), IHS Global, PwC.
Section 1: Industry Overview - 3 -
0
10
20
30
40
50
60
'89 '90 '91 '92 '93 '94 '95 '96 '97 '98 '99 '00 '01 '02 '03 '04 '05 '06 '07 '08 '09 '10 '11 '12 '13 '14 '15 '16 '17 '18 '19
www.semiconductors.org
0
50
100
150
200
250
'99 '00 '01 '02 '03 '04 '05 '06 '07 '08 '09 '10 '11 '12 '13 '14 '15 '16 '17 '18 '19
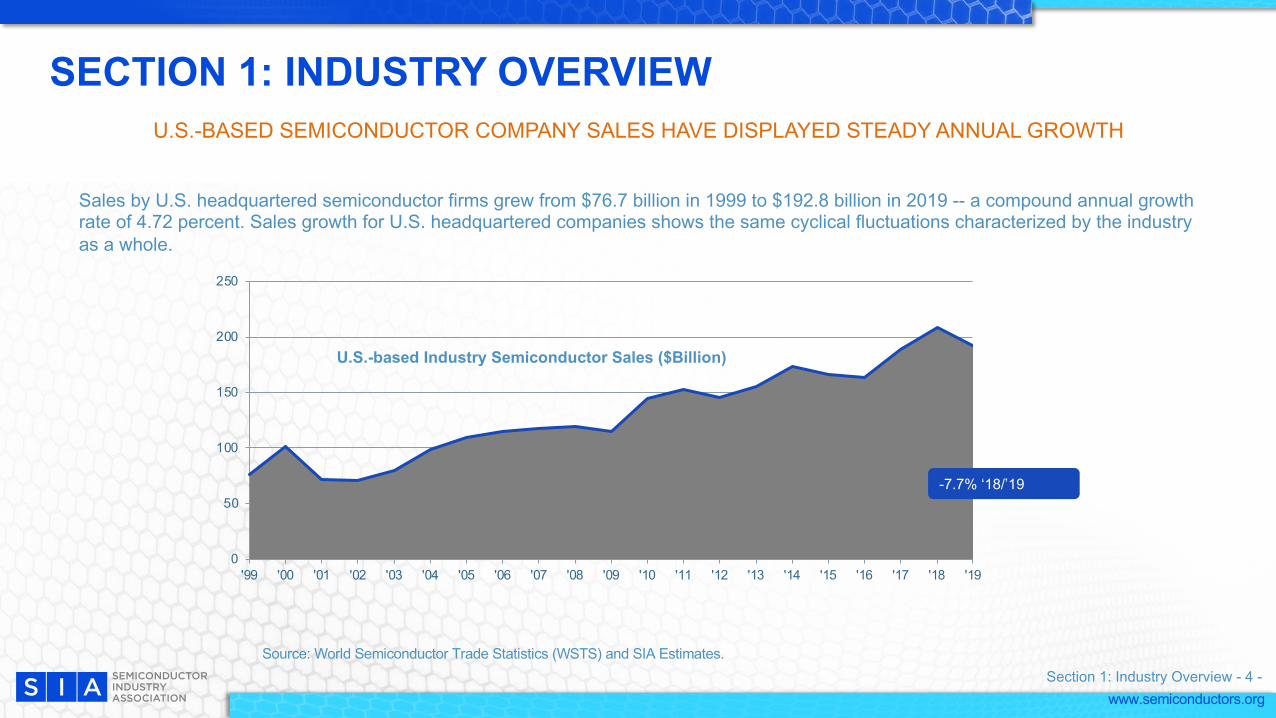
SECTION 1: INDUSTRY OVERVIEW U.S.-BASED SEMICONDUCTOR COMPANY SALES HAVE DISPLAYED STEADY ANNUAL GROWTH
Sales by U.S. headquartered semiconductor firms grew from $76.7 billion in 1999 to $192.8 billion in 2019 -- a compound annual growth rate of 4.72 percent. Sales growth for U.S. headquartered companies shows the same cyclical fluctuations characterized by the industry as a whole.
U.S.-based Industry Semiconductor Sales ($Billion)
Source: World Semiconductor Trade Statistics (WSTS) and SIA Estimates.Section 1: Industry Overview - 4 -
-7.7% ‘18/’19
www.semiconductors.org
SECTION 1: INDUSTRY OVERVIEW U.S.-BASED SEMICODUCTOR COMPANIES MAINTAIN MARKET SHARE LEADERSHIP IN MAJOR REGIONAL
SEMICONDUCTOR MARKETS
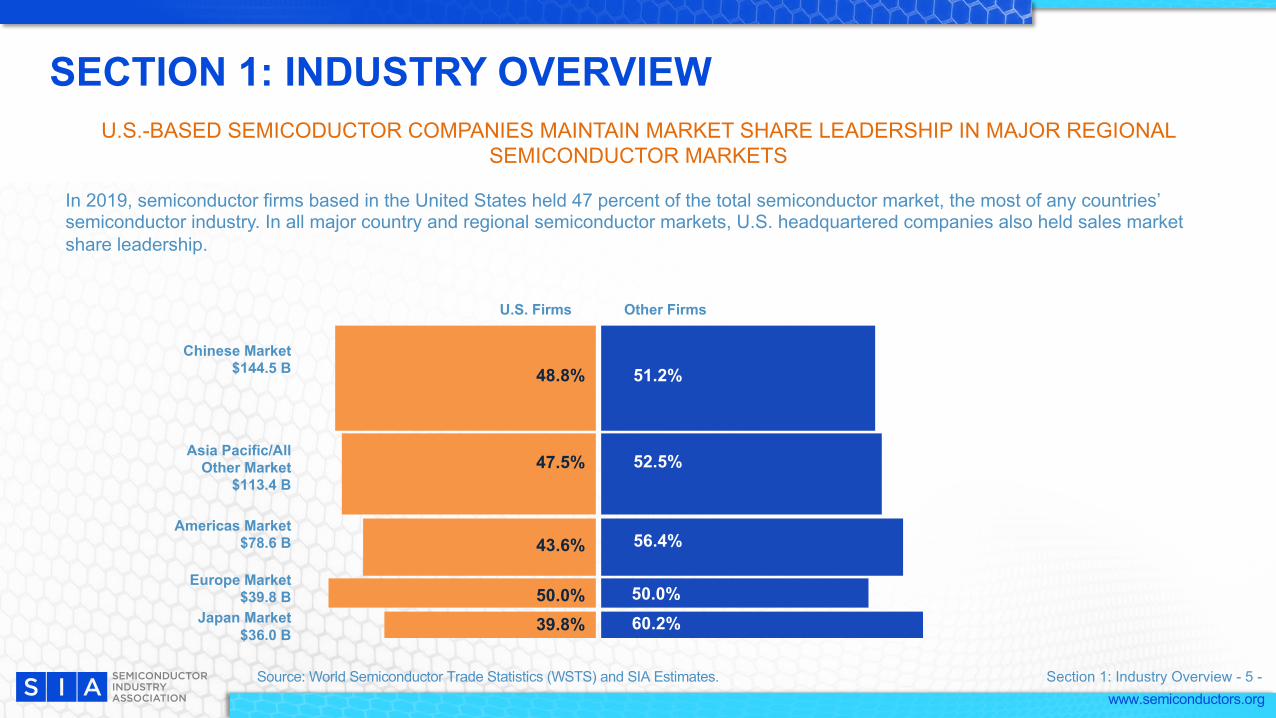
In 2019, semiconductor firms based in the United States held 47 percent of the total semiconductor market, the most of any countries’ semiconductor industry. In all major country and regional semiconductor markets, U.S. headquartered companies also held sales market share leadership.
U.S. Firms Other Firms
48.8% 51.2%
47.5% 52.5%
43.6% 56.4%
50.0% 50.0%39.8% 60.2%
Asia Pacific/All Other Market
$113.4 B
Chinese Market$144.5 B
Americas Market$78.6 B
Europe Market$39.8 B
Japan Market$36.0 B
Source: World Semiconductor Trade Statistics (WSTS) and SIA Estimates. Section 1: Industry Overview - 5 -
www.semiconductors.org
SECTION 1: INDUSTRY OVERVIEW THE VAST MAJORITY OF SEMICONDUCTOR MANUFACTURING DONE IN THE UNITED STATES IS DONE BY U.S. FIRMS
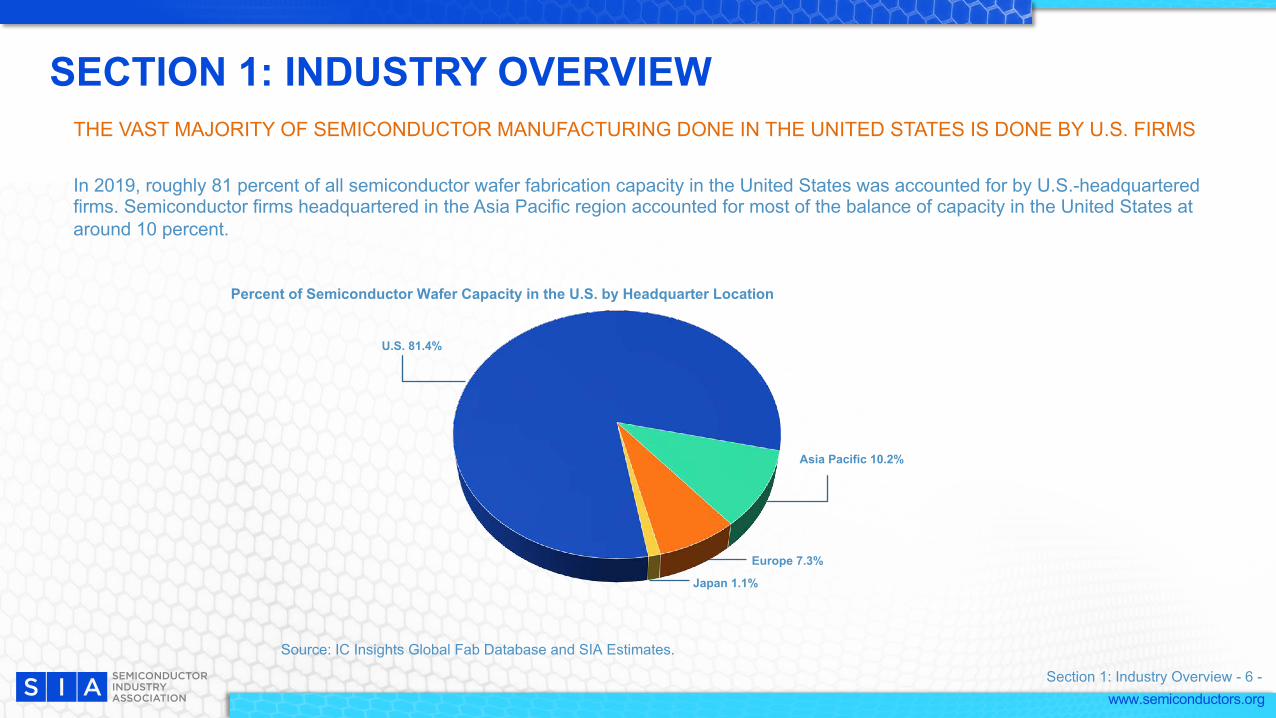
In 2019, roughly 81 percent of all semiconductor wafer fabrication capacity in the United States was accounted for by U.S.-headquartered firms. Semiconductor firms headquartered in the Asia Pacific region accounted for most of the balance of capacity in the United States at around 10 percent.
U.S. 81.4%
Asia Pacific 10.2%
Europe 7.3%
Japan 1.1%
Percent of Semiconductor Wafer Capacity in the U.S. by Headquarter Location
Source: IC Insights Global Fab Database and SIA Estimates.
Section 1: Industry Overview - 6 -
www.semiconductors.org
SECTION 1: INDUSTRY OVERVIEW THE U.S. SEMICONDUCTOR INDUSTRY MAINTAINS MORE OF ITS MANUFACTURING BASE IN THE UNITED STATES
THAN IN ANY OTHER COUNTRY
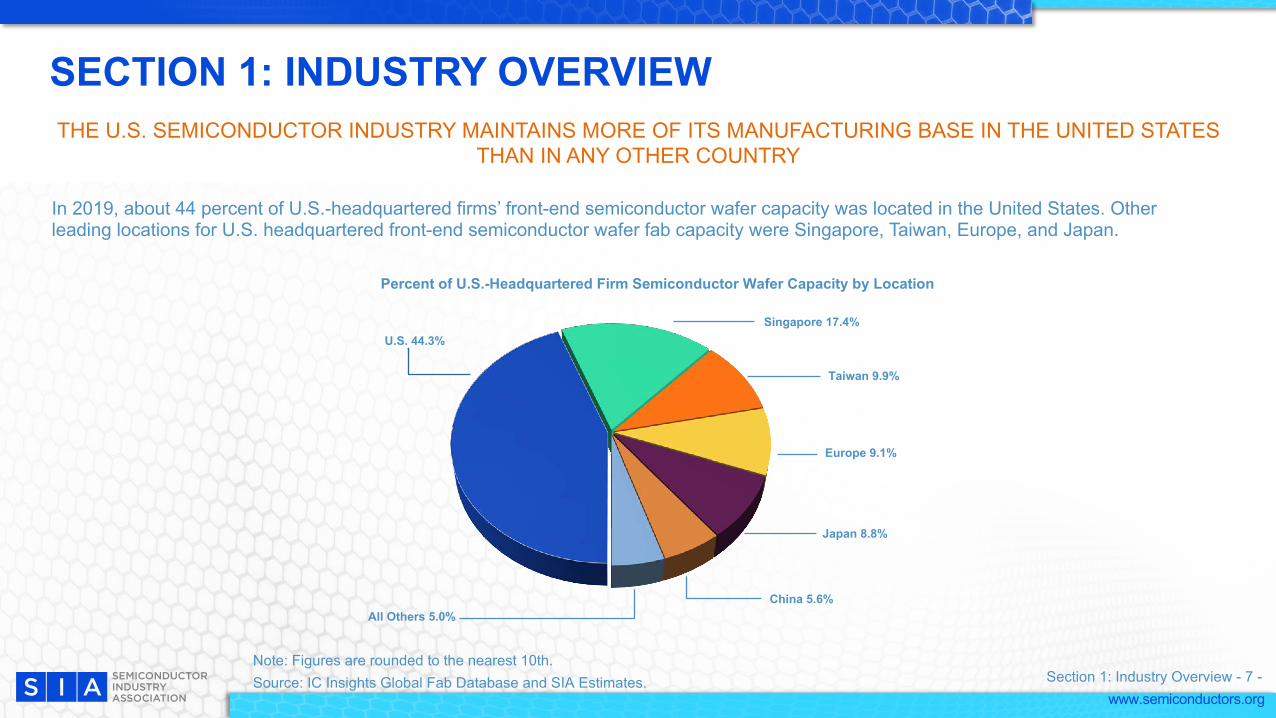
In 2019, about 44 percent of U.S.-headquartered firms’ front-end semiconductor wafer capacity was located in the United States. Other leading locations for U.S. headquartered front-end semiconductor wafer fab capacity were Singapore, Taiwan, Europe, and Japan.
Percent of U.S.-Headquartered Firm Semiconductor Wafer Capacity by Location
Taiwan 9.9%
U.S. 44.3%
Europe 9.1%
Japan 8.8%
China 5.6%
Source: IC Insights Global Fab Database and SIA Estimates. Note: Figures are rounded to the nearest 10th.
Singapore 17.4%
All Others 5.0%
Section 1: Industry Overview - 7 -
www.semiconductors.org
0
10
20
30
40
50
SECTION 1: INDUSTRY OVERVIEW SEMICONDUCTORS ARE ONE OF AMERICA’S TOP EXPORTS
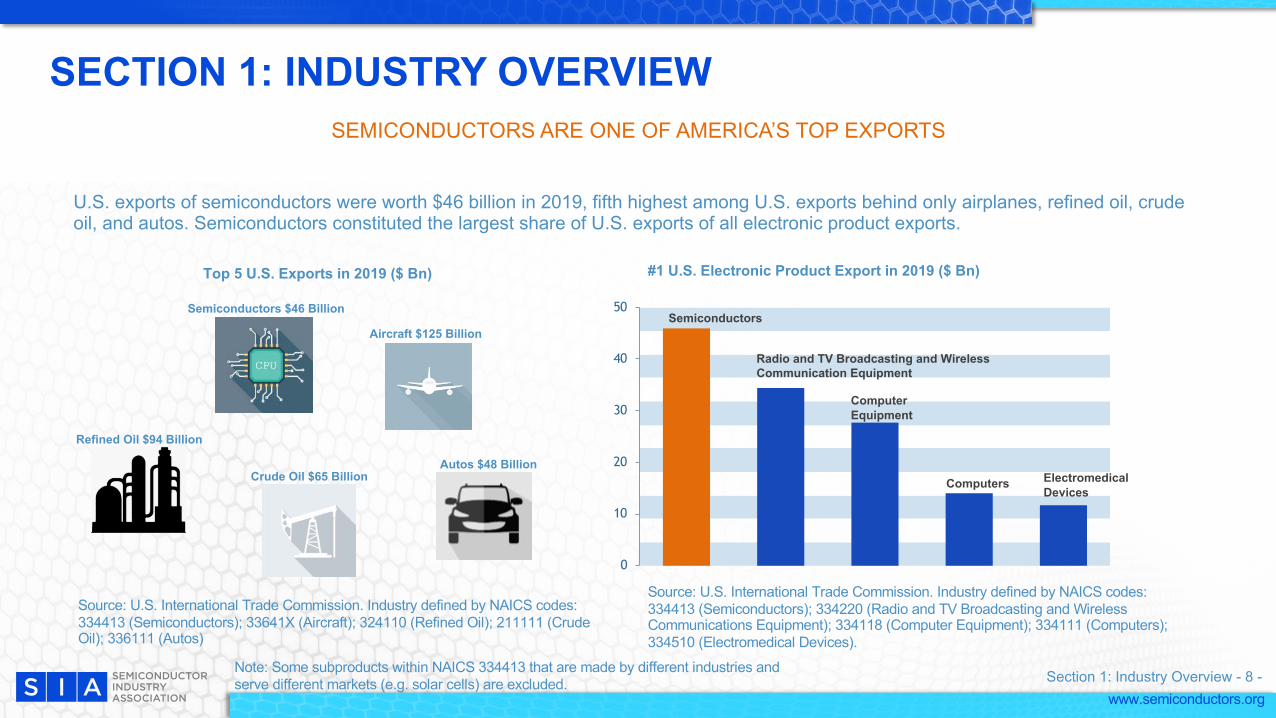
U.S. exports of semiconductors were worth $46 billion in 2019, fifth highest among U.S. exports behind only airplanes, refined oil, crude oil, and autos. Semiconductors constituted the largest share of U.S. exports of all electronic product exports.
Source: U.S. International Trade Commission. Industry defined by NAICS codes: 334413 (Semiconductors); 334220 (Radio and TV Broadcasting and Wireless Communications Equipment); 334118 (Computer Equipment); 334111 (Computers); 334510 (Electromedical Devices).
Source: U.S. International Trade Commission. Industry defined by NAICS codes: 334413 (Semiconductors); 33641X (Aircraft); 324110 (Refined Oil); 211111 (Crude Oil); 336111 (Autos)
Top 5 U.S. Exports in 2019 ($ Bn) #1 U.S. Electronic Product Export in 2019 ($ Bn)
Aircraft $125 Billion
Semiconductors $46 BillionSemiconductors
Computer Equipment
Electromedical Devices
Radio and TV Broadcasting and Wireless Communication Equipment
Computers
Refined Oil $94 Billion
Note: Some subproducts within NAICS 334413 that are made by different industries and serve different markets (e.g. solar cells) are excluded. Section 1: Industry Overview - 8 -
Crude Oil $65 BillionAutos $48 Billion
www.semiconductors.org
Section 2GLOBAL MARKET Diversified and Consumer-driven
Section 2: Global Market - 9 -
www.semiconductors.org
28.5%
13.3%
12.2%
1.3%
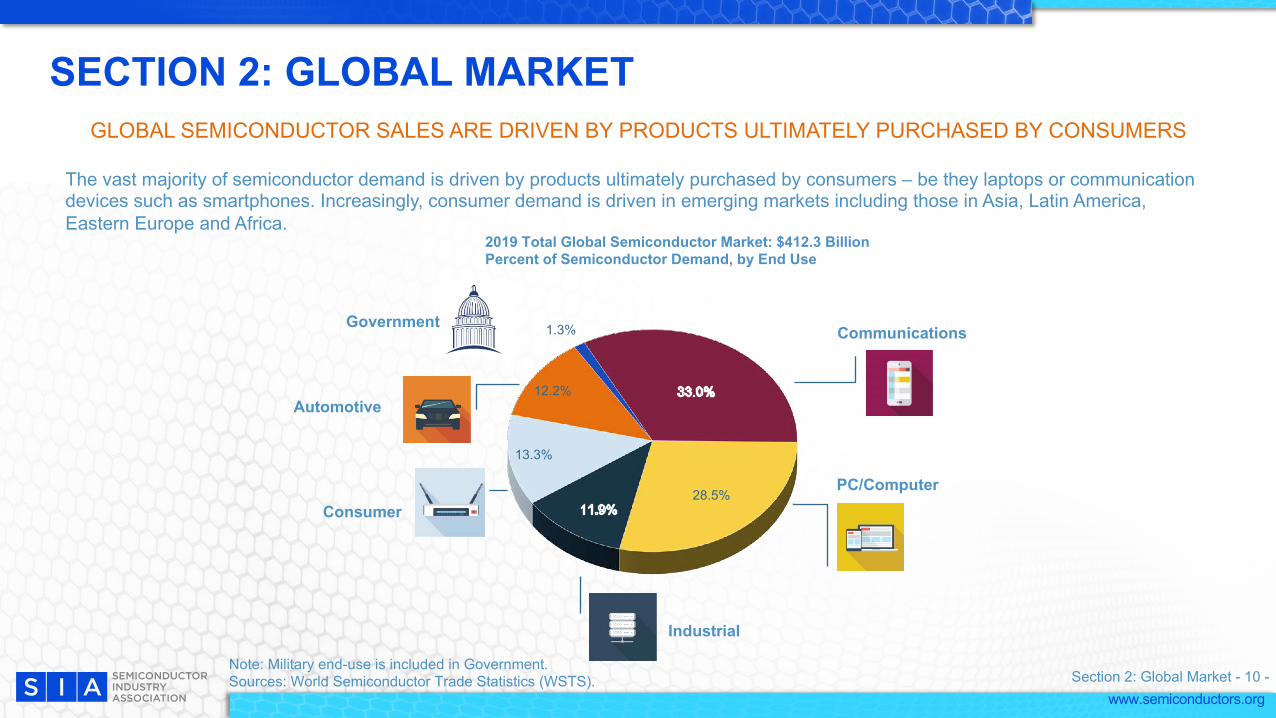
SECTION 2: GLOBAL MARKETGLOBAL SEMICONDUCTOR SALES ARE DRIVEN BY PRODUCTS ULTIMATELY PURCHASED BY CONSUMERS
The vast majority of semiconductor demand is driven by products ultimately purchased by consumers – be they laptops or communication devices such as smartphones. Increasingly, consumer demand is driven in emerging markets including those in Asia, Latin America,Eastern Europe and Africa.
Communications
Industrial
Automotive
2019 Total Global Semiconductor Market: $412.3 Billion Percent of Semiconductor Demand, by End Use
Note: Military end-use is included in Government.Sources: World Semiconductor Trade Statistics (WSTS).
PC/ComputerConsumer
Section 2: Global Market - 10 -
Government
www.semiconductors.org
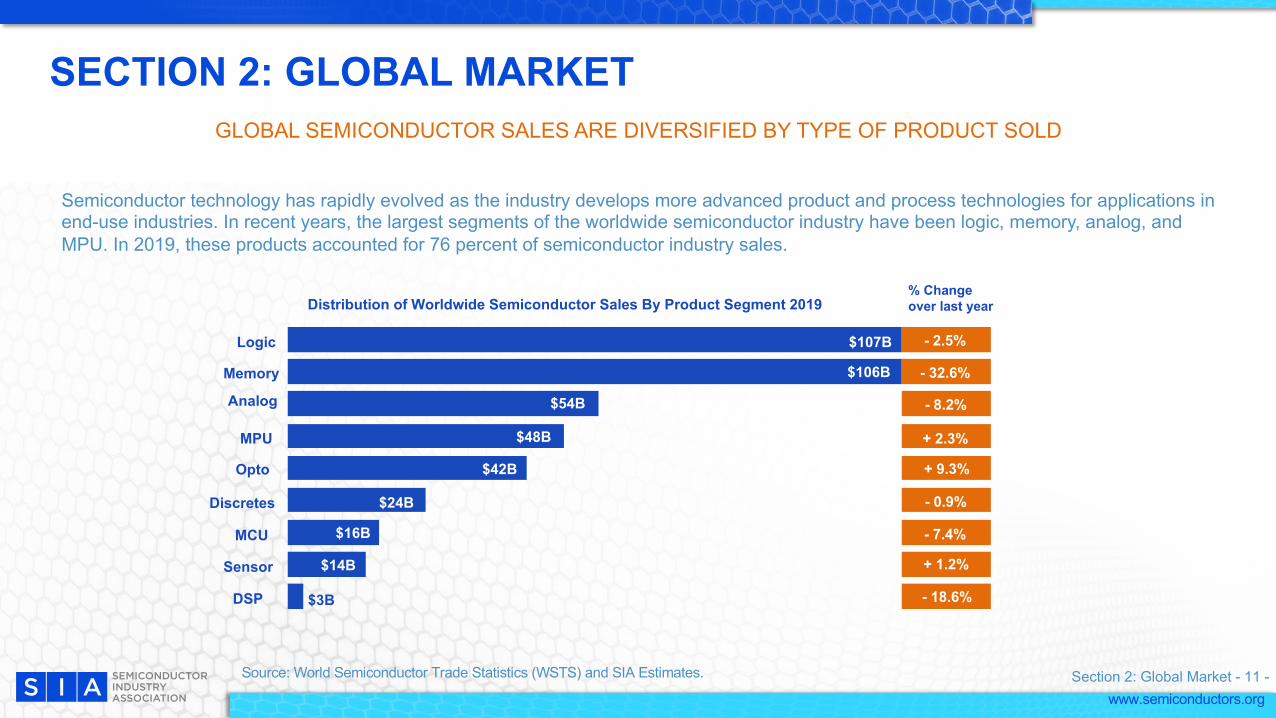
SECTION 2: GLOBAL MARKETGLOBAL SEMICONDUCTOR SALES ARE DIVERSIFIED BY TYPE OF PRODUCT SOLD
Semiconductor technology has rapidly evolved as the industry develops more advanced product and process technologies for applications in end-use industries. In recent years, the largest segments of the worldwide semiconductor industry have been logic, memory, analog, and MPU. In 2019, these products accounted for 76 percent of semiconductor industry sales.
Source: World Semiconductor Trade Statistics (WSTS) and SIA Estimates.
Logic
Memory
MPU
Analog
Opto
Discretes
MCU
Sensor
DSP
$107B
$106B
$54B
$48B
$42B
$24B
$16B
$14B
$3B
- 2.5%
- 32.6%
- 8.2%
+ 2.3%
+ 9.3%
- 0.9%
- 7.4%
+ 1.2%
- 18.6%
% Change over last yearDistribution of Worldwide Semiconductor Sales By Product Segment 2019
Section 2: Global Market - 11 -
www.semiconductors.org
0
50
100
150
200
250
300
'99 '00 '01 '02 '03 '04 '05 '06 '07 '08 '09 '10 '11 '12 '13 '14 '15 '16 '17 '18 '19
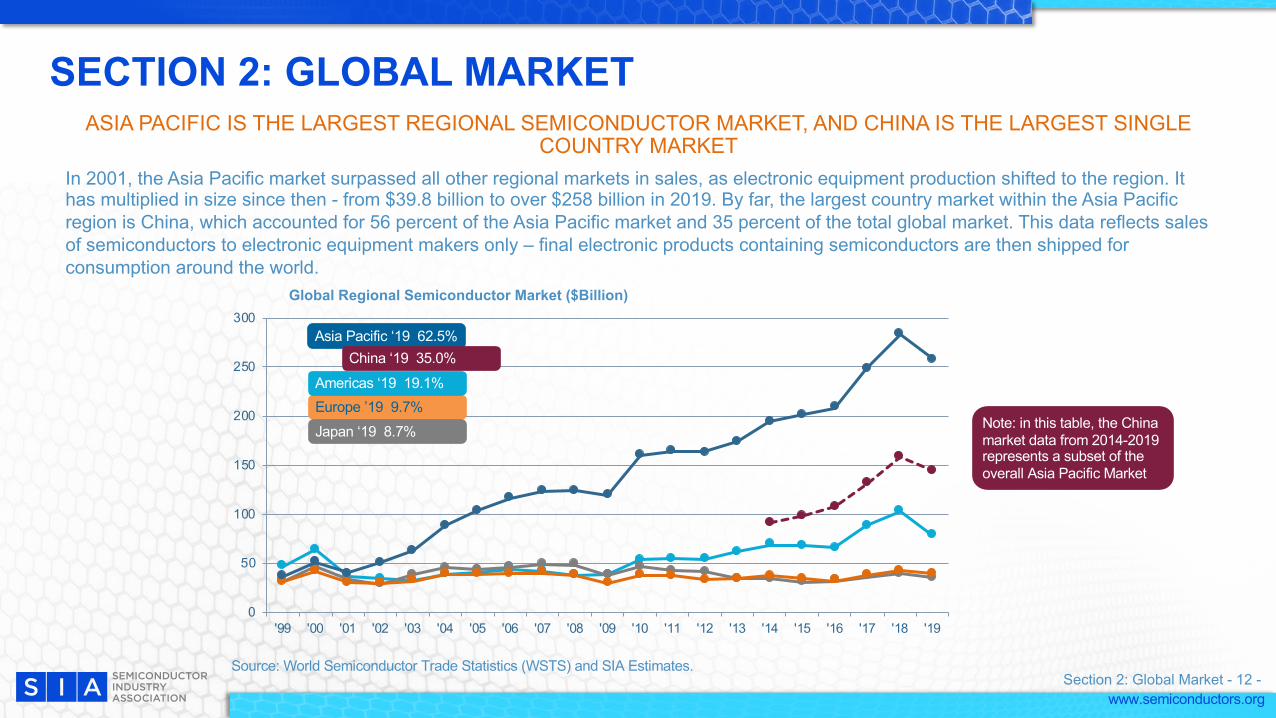
SECTION 2: GLOBAL MARKETASIA PACIFIC IS THE LARGEST REGIONAL SEMICONDUCTOR MARKET, AND CHINA IS THE LARGEST SINGLE
COUNTRY MARKET In 2001, the Asia Pacific market surpassed all other regional markets in sales, as electronic equipment production shifted to the region. It has multiplied in size since then - from $39.8 billion to over $258 billion in 2019. By far, the largest country market within the Asia Pacific region is China, which accounted for 56 percent of the Asia Pacific market and 35 percent of the total global market. This data reflects sales of semiconductors to electronic equipment makers only – final electronic products containing semiconductors are then shipped forconsumption around the world.
Europe ’19 9.7%Japan ‘19 8.7%
Americas ‘19 19.1%
Asia Pacific ‘19 62.5%
Global Regional Semiconductor Market ($Billion)
Source: World Semiconductor Trade Statistics (WSTS) and SIA Estimates.Section 2: Global Market - 12 -
China ‘19 35.0%
Note: in this table, the China market data from 2014-2019 represents a subset of the overall Asia Pacific Market
www.semiconductors.org
Section 3Capital and R&D Investment A Driving Force in Maintaining a Competitive U.S. Semiconductor Industry
Section 3: Capital and R&D Investment - 13 -

www.semiconductors.org
SECTION 3: CAPITAL AND R&D INVESTMENTTOTAL ANNUAL LEVELS OF INVESTMENT IN CAPITAL AND R&D ARE HIGH FOR THE INDUSTRY
Total R&D and capital expenditures by U.S. semiconductor firms including fabless companies was $71.7 billion in 2019. From 1999 to 2019, the compound annual growth rate was approximately 6.2 percent. Investment levels in share of sales terms have generally not been subject to fluctuations associated with market cyclicality.
R&D and Capital Expenditures ($Billion)
Source: U.S. Semiconductor Companies’ 10K and 10Q Fillings to the USSEC and SIA Estimates.
Section 3: Capital and R&D Investment - 14 -
0
10
20
30
40
50
60
70
80
'99 '00 '01 '02 '03 '04 '05 '06 '07 '08 '09 '10 '11 '12 '13 '14 '15 '16 '17 '18 '19
www.semiconductors.org
0%
5%
10%
15%
20%
25%
30%
35%
40%
45%
'99 '00 '01 '02 '03 '04 '05 '06 '07 '08 '09 '10 '11 '12 '13 '14 '15 '16 '17 '18 '19
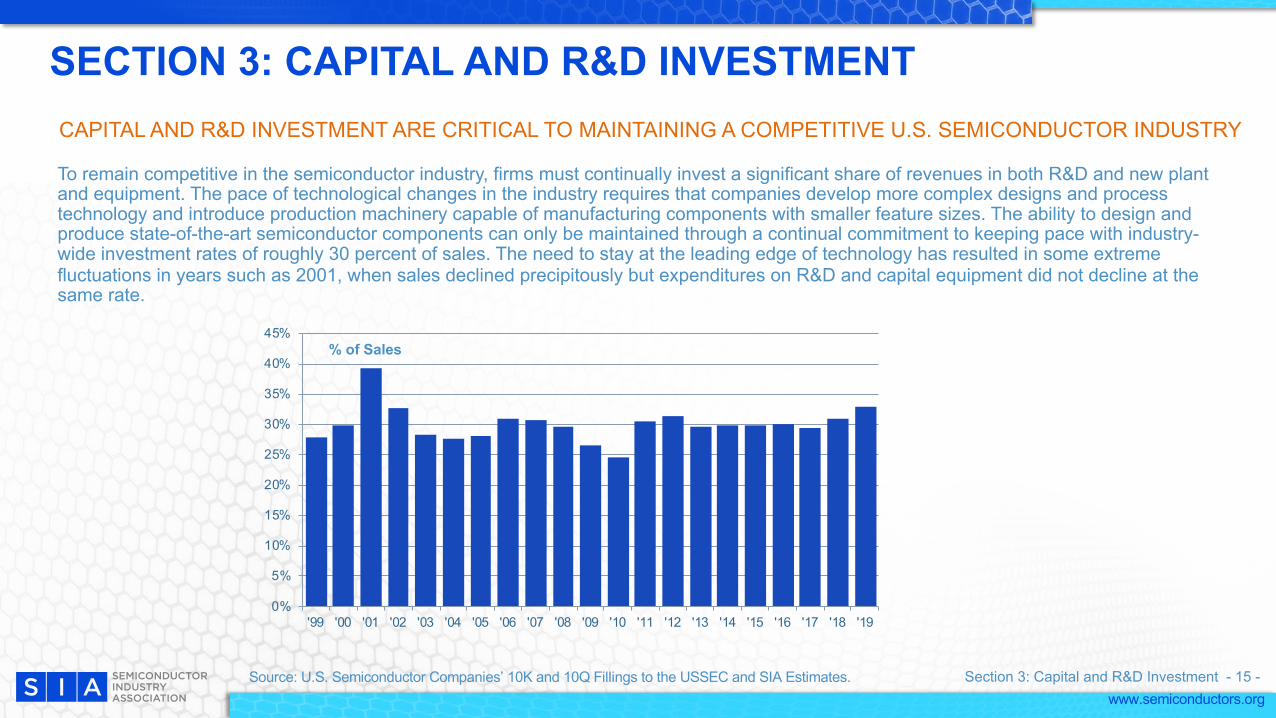
SECTION 3: CAPITAL AND R&D INVESTMENTCAPITAL AND R&D INVESTMENT ARE CRITICAL TO MAINTAINING A COMPETITIVE U.S. SEMICONDUCTOR INDUSTRY
To remain competitive in the semiconductor industry, firms must continually invest a significant share of revenues in both R&D and new plant and equipment. The pace of technological changes in the industry requires that companies develop more complex designs and process technology and introduce production machinery capable of manufacturing components with smaller feature sizes. The ability to design and produce state-of-the-art semiconductor components can only be maintained through a continual commitment to keeping pace with industry-wide investment rates of roughly 30 percent of sales. The need to stay at the leading edge of technology has resulted in some extreme fluctuations in years such as 2001, when sales declined precipitously but expenditures on R&D and capital equipment did not decline at the same rate.
% of Sales
Source: U.S. Semiconductor Companies’ 10K and 10Q Fillings to the USSEC and SIA Estimates. Section 3: Capital and R&D Investment - 15 -
www.semiconductors.org
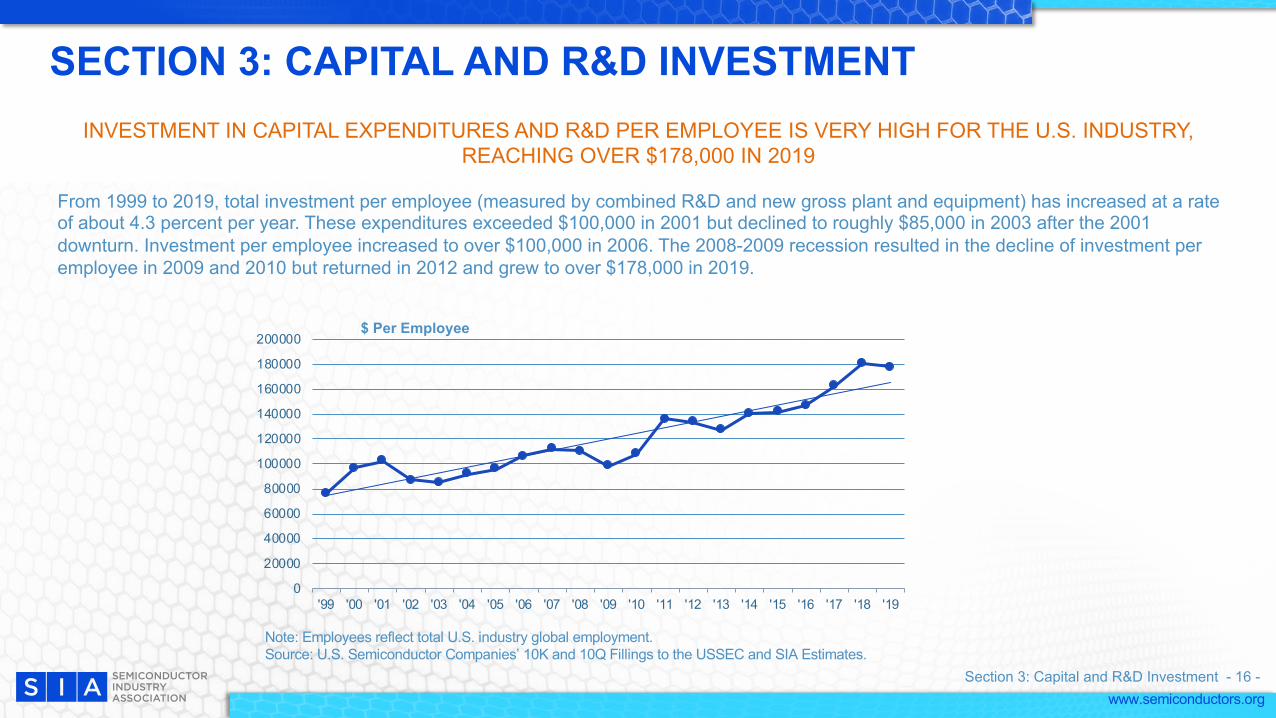
SECTION 3: CAPITAL AND R&D INVESTMENTINVESTMENT IN CAPITAL EXPENDITURES AND R&D PER EMPLOYEE IS VERY HIGH FOR THE U.S. INDUSTRY,
REACHING OVER $178,000 IN 2019
From 1999 to 2019, total investment per employee (measured by combined R&D and new gross plant and equipment) has increased at a rate of about 4.3 percent per year. These expenditures exceeded $100,000 in 2001 but declined to roughly $85,000 in 2003 after the 2001 downturn. Investment per employee increased to over $100,000 in 2006. The 2008-2009 recession resulted in the decline of investment per employee in 2009 and 2010 but returned in 2012 and grew to over $178,000 in 2019.
$ Per Employee
Note: Employees reflect total U.S. industry global employment. Source: U.S. Semiconductor Companies’ 10K and 10Q Fillings to the USSEC and SIA Estimates.
Section 3: Capital and R&D Investment - 16 -
0
20000
40000
60000
80000
100000
120000
140000
160000
180000
200000
'99 '00 '01 '02 '03 '04 '05 '06 '07 '08 '09 '10 '11 '12 '13 '14 '15 '16 '17 '18 '19
www.semiconductors.org
0
5
10
15
20
25
30
35
40
45
'99 '00 '01 '02 '03 '04 '05 '06 '07 '08 '09 '10 '11 '12 '13 '14 '15 '16 '17 '18 '19
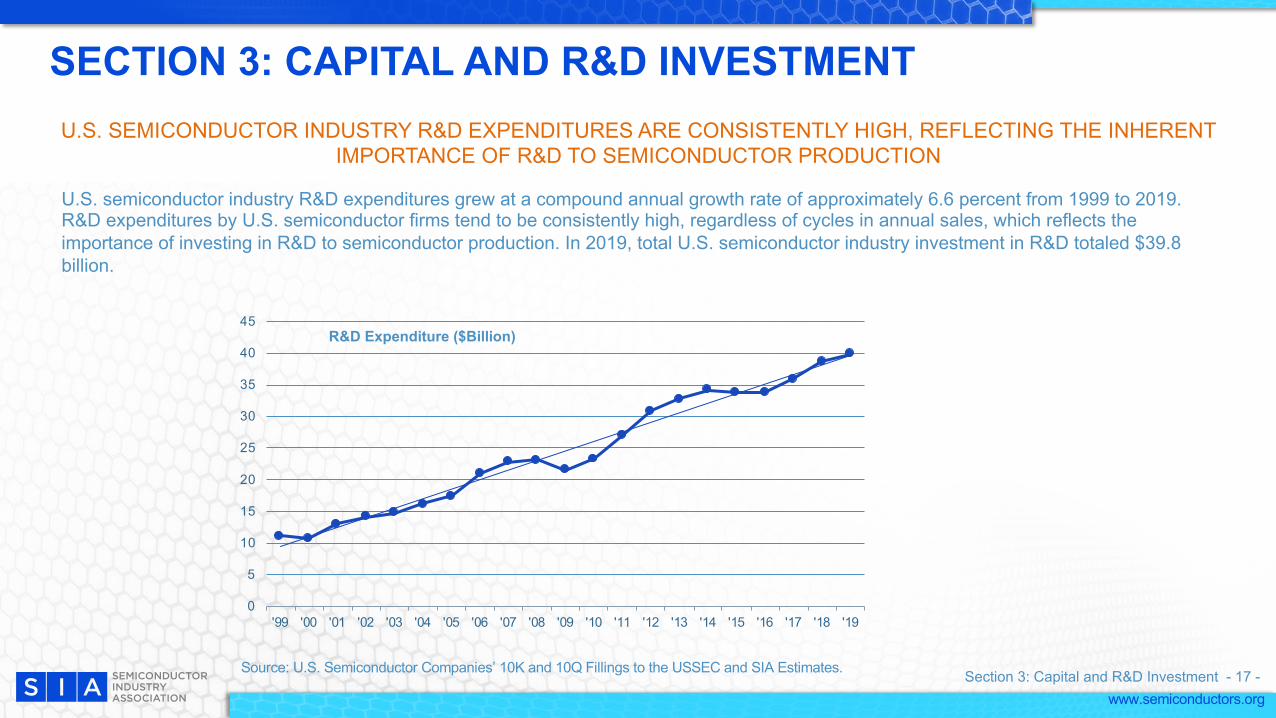
SECTION 3: CAPITAL AND R&D INVESTMENTU.S. SEMICONDUCTOR INDUSTRY R&D EXPENDITURES ARE CONSISTENTLY HIGH, REFLECTING THE INHERENT
IMPORTANCE OF R&D TO SEMICONDUCTOR PRODUCTION
U.S. semiconductor industry R&D expenditures grew at a compound annual growth rate of approximately 6.6 percent from 1999 to 2019. R&D expenditures by U.S. semiconductor firms tend to be consistently high, regardless of cycles in annual sales, which reflects the importance of investing in R&D to semiconductor production. In 2019, total U.S. semiconductor industry investment in R&D totaled $39.8 billion.
Source: U.S. Semiconductor Companies’ 10K and 10Q Fillings to the USSEC and SIA Estimates.
R&D Expenditure ($Billion)
Section 3: Capital and R&D Investment - 17 -
www.semiconductors.org
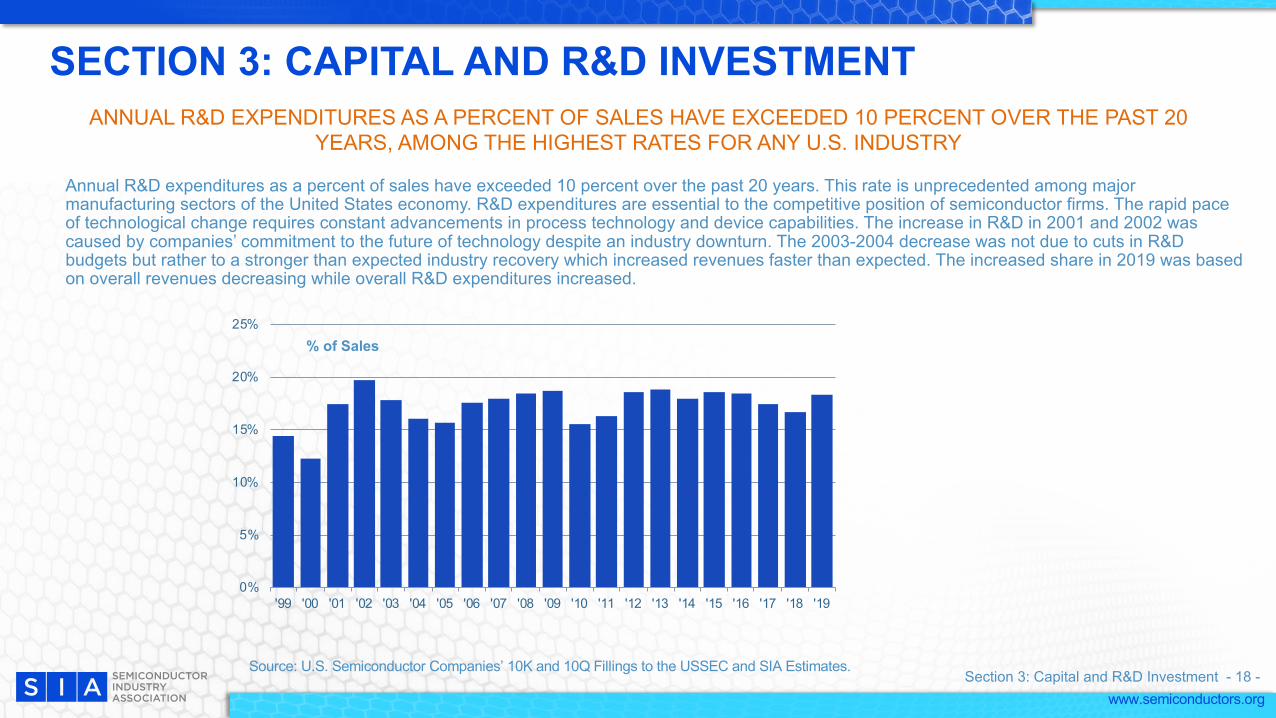
SECTION 3: CAPITAL AND R&D INVESTMENTANNUAL R&D EXPENDITURES AS A PERCENT OF SALES HAVE EXCEEDED 10 PERCENT OVER THE PAST 20
YEARS, AMONG THE HIGHEST RATES FOR ANY U.S. INDUSTRY
Annual R&D expenditures as a percent of sales have exceeded 10 percent over the past 20 years. This rate is unprecedented among major manufacturing sectors of the United States economy. R&D expenditures are essential to the competitive position of semiconductor firms. The rapid pace of technological change requires constant advancements in process technology and device capabilities. The increase in R&D in 2001 and 2002 was caused by companies’ commitment to the future of technology despite an industry downturn. The 2003-2004 decrease was not due to cuts in R&D budgets but rather to a stronger than expected industry recovery which increased revenues faster than expected. The increased share in 2019 was based on overall revenues decreasing while overall R&D expenditures increased.
% of Sales
Source: U.S. Semiconductor Companies’ 10K and 10Q Fillings to the USSEC and SIA Estimates.Section 3: Capital and R&D Investment - 18 -
0%
5%
10%
15%
20%
25%
'99 '00 '01 '02 '03 '04 '05 '06 '07 '08 '09 '10 '11 '12 '13 '14 '15 '16 '17 '18 '19
www.semiconductors.org
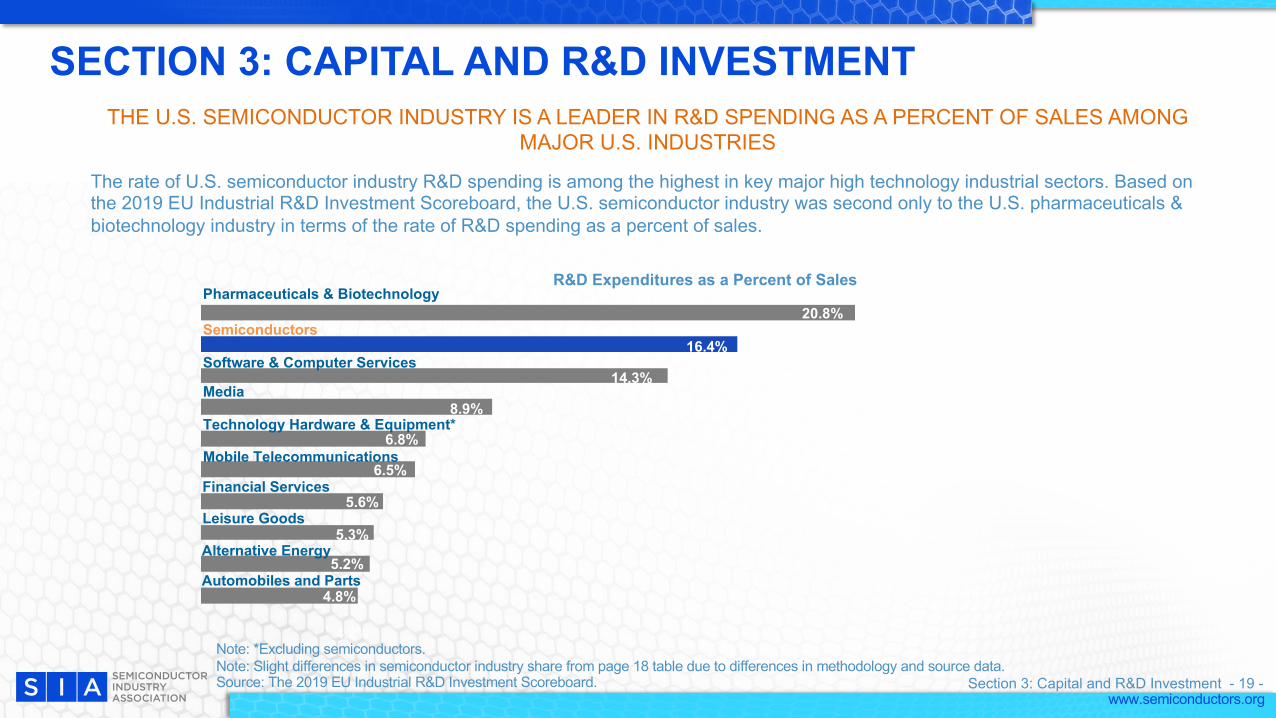
SECTION 3: CAPITAL AND R&D INVESTMENTTHE U.S. SEMICONDUCTOR INDUSTRY IS A LEADER IN R&D SPENDING AS A PERCENT OF SALES AMONG
MAJOR U.S. INDUSTRIES
The rate of U.S. semiconductor industry R&D spending is among the highest in key major high technology industrial sectors. Based on the 2019 EU Industrial R&D Investment Scoreboard, the U.S. semiconductor industry was second only to the U.S. pharmaceuticals & biotechnology industry in terms of the rate of R&D spending as a percent of sales.
R&D Expenditures as a Percent of SalesPharmaceuticals & Biotechnology
Software & Computer Services
Semiconductors
Technology Hardware & Equipment*
Mobile Telecommunications
Media
Financial Services
Automobiles and Parts
Alternative Energy
20.8%
16.4%
14.3%
8.9%
6.8%
6.5%
5.3%
5.6%
5.2%
4.8%
4.2% Note: *Excluding semiconductors.Note: Slight differences in semiconductor industry share from page 18 table due to differences in methodology and source data. Source: The 2019 EU Industrial R&D Investment Scoreboard. Section 3: Capital and R&D Investment - 19 -
Leisure Goods
www.semiconductors.org
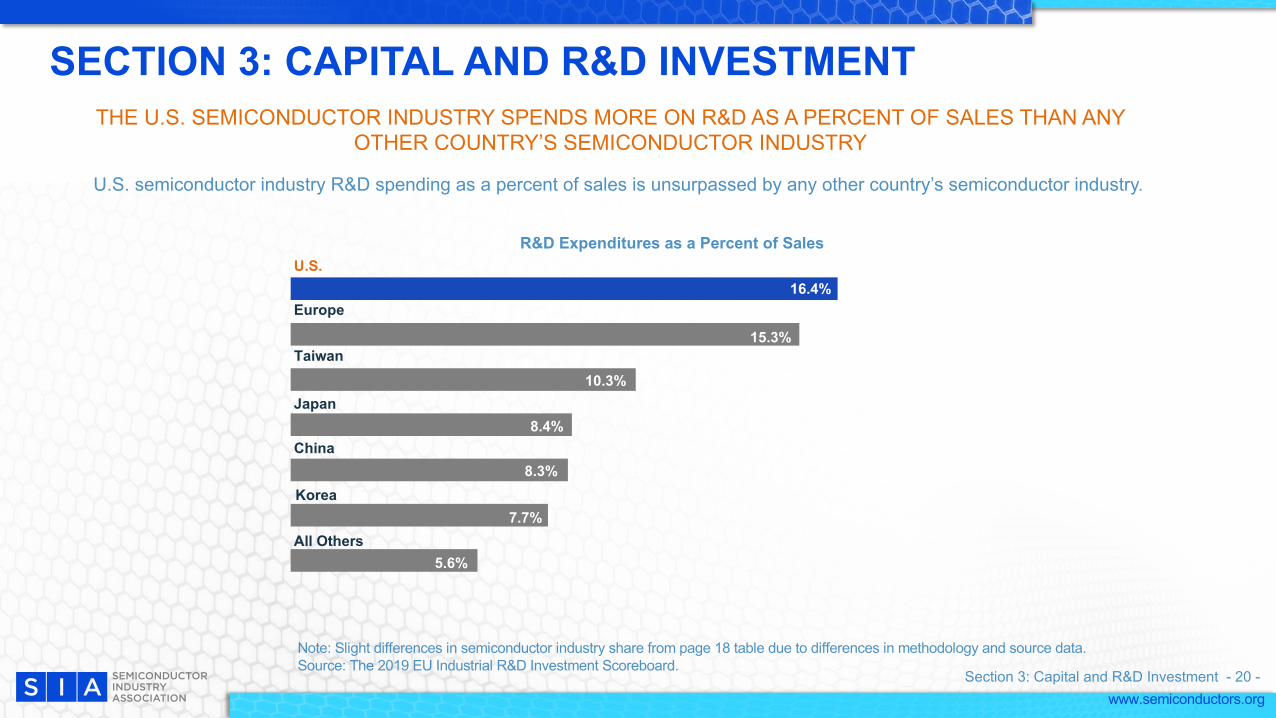
SECTION 3: CAPITAL AND R&D INVESTMENTTHE U.S. SEMICONDUCTOR INDUSTRY SPENDS MORE ON R&D AS A PERCENT OF SALES THAN ANY
OTHER COUNTRY’S SEMICONDUCTOR INDUSTRY
U.S. semiconductor industry R&D spending as a percent of sales is unsurpassed by any other country’s semiconductor industry.
R&D Expenditures as a Percent of Sales
Japan
U.S.
All Others
China
Korea
Taiwan
Europe16.4%
15.3%
10.3%
8.4%
8.3%
7.7%
5.6%
Note: Slight differences in semiconductor industry share from page 18 table due to differences in methodology and source data. Source: The 2019 EU Industrial R&D Investment Scoreboard.
Section 3: Capital and R&D Investment - 20 -
www.semiconductors.org
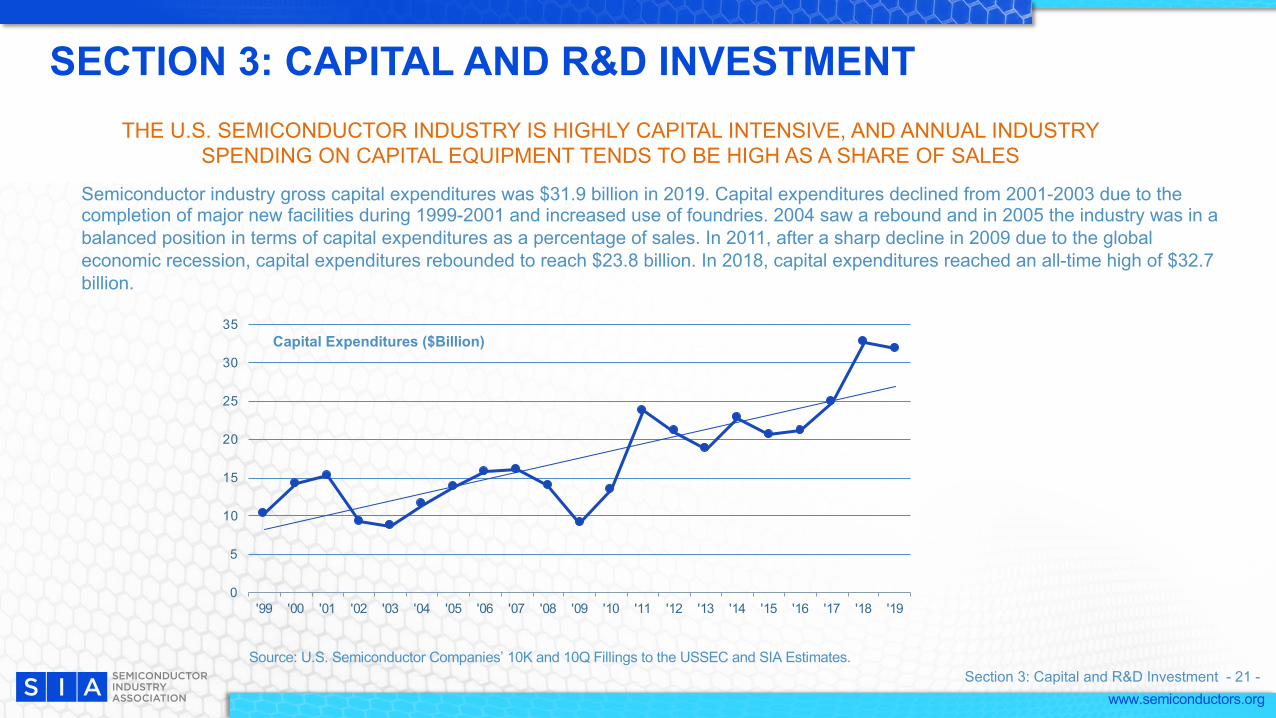
SECTION 3: CAPITAL AND R&D INVESTMENTTHE U.S. SEMICONDUCTOR INDUSTRY IS HIGHLY CAPITAL INTENSIVE, AND ANNUAL INDUSTRY
SPENDING ON CAPITAL EQUIPMENT TENDS TO BE HIGH AS A SHARE OF SALES
Semiconductor industry gross capital expenditures was $31.9 billion in 2019. Capital expenditures declined from 2001-2003 due to the completion of major new facilities during 1999-2001 and increased use of foundries. 2004 saw a rebound and in 2005 the industry was in a balanced position in terms of capital expenditures as a percentage of sales. In 2011, after a sharp decline in 2009 due to the global economic recession, capital expenditures rebounded to reach $23.8 billion. In 2018, capital expenditures reached an all-time high of $32.7 billion.
Capital Expenditures ($Billion)
Source: U.S. Semiconductor Companies’ 10K and 10Q Fillings to the USSEC and SIA Estimates.Section 3: Capital and R&D Investment - 21 -
0
5
10
15
20
25
30
35
'99 '00 '01 '02 '03 '04 '05 '06 '07 '08 '09 '10 '11 '12 '13 '14 '15 '16 '17 '18 '19
www.semiconductors.org
0%
5%
10%
15%
20%
25%
'99 '00 '01 '02 '03 '04 '05 '06 '07 '08 '09 '10 '11 '12 '13 '14 '15 '16 '17 '18 '19
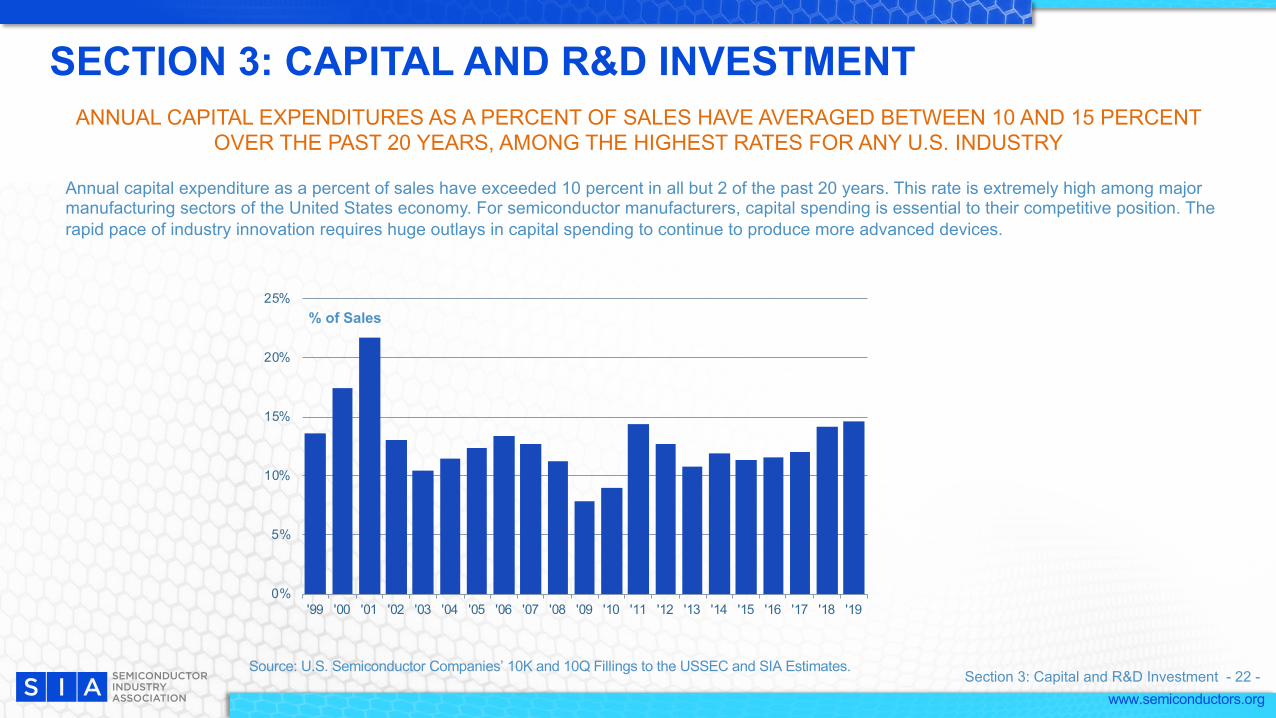
SECTION 3: CAPITAL AND R&D INVESTMENTANNUAL CAPITAL EXPENDITURES AS A PERCENT OF SALES HAVE AVERAGED BETWEEN 10 AND 15 PERCENT
OVER THE PAST 20 YEARS, AMONG THE HIGHEST RATES FOR ANY U.S. INDUSTRY
Annual capital expenditure as a percent of sales have exceeded 10 percent in all but 2 of the past 20 years. This rate is extremely high among major manufacturing sectors of the United States economy. For semiconductor manufacturers, capital spending is essential to their competitive position. The rapid pace of industry innovation requires huge outlays in capital spending to continue to produce more advanced devices.
% of Sales
Source: U.S. Semiconductor Companies’ 10K and 10Q Fillings to the USSEC and SIA Estimates.Section 3: Capital and R&D Investment - 22 -
www.semiconductors.org
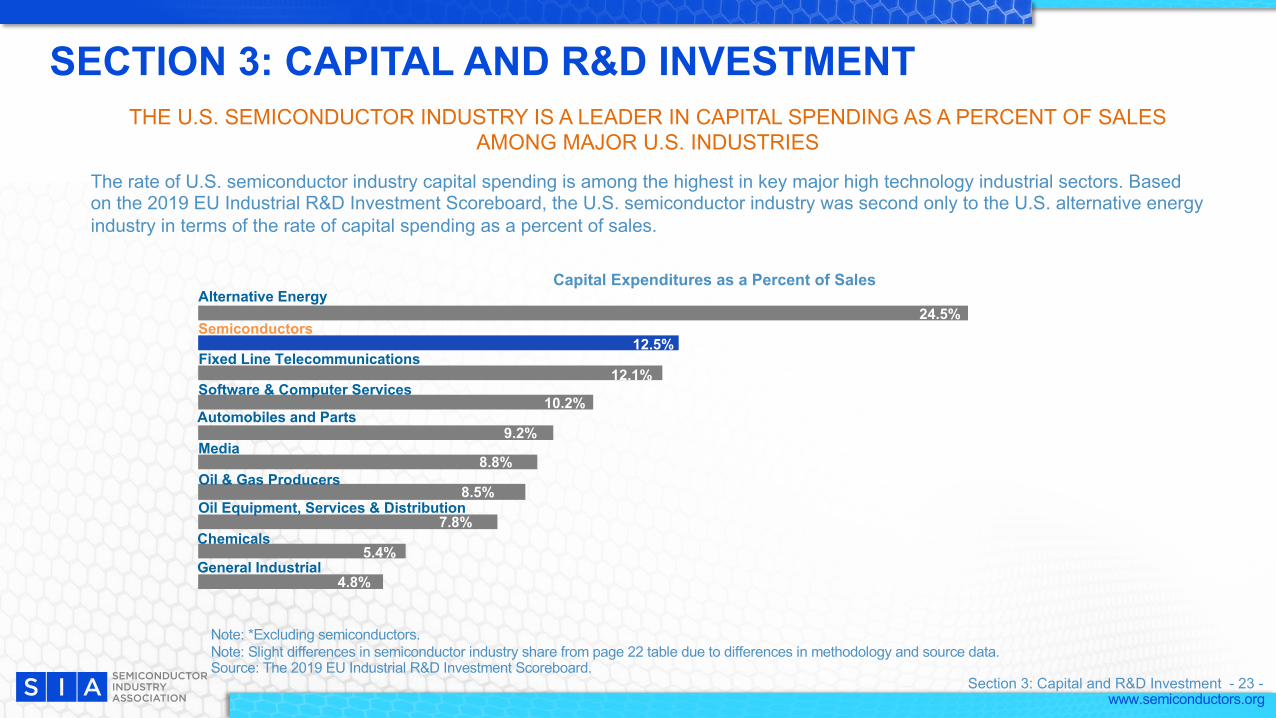
SECTION 3: CAPITAL AND R&D INVESTMENTTHE U.S. SEMICONDUCTOR INDUSTRY IS A LEADER IN CAPITAL SPENDING AS A PERCENT OF SALES
AMONG MAJOR U.S. INDUSTRIES
The rate of U.S. semiconductor industry capital spending is among the highest in key major high technology industrial sectors. Based on the 2019 EU Industrial R&D Investment Scoreboard, the U.S. semiconductor industry was second only to the U.S. alternative energy industry in terms of the rate of capital spending as a percent of sales.
Capital Expenditures as a Percent of SalesAlternative Energy
Fixed Line Telecommunications
Semiconductors
General Industrial
Media
Software & Computer Services
Oil & Gas Producers
Automobiles and Parts
Chemicals
24.5%
12.5%
12.1%
10.2%
9.2%
8.8%
7.8%
8.5%
5.4%
4.8%
4.2% Note: *Excluding semiconductors.Note: Slight differences in semiconductor industry share from page 22 table due to differences in methodology and source data. Source: The 2019 EU Industrial R&D Investment Scoreboard.
Section 3: Capital and R&D Investment - 23 -
Oil Equipment, Services & Distribution
www.semiconductors.org
Section 4U.S. JOBS
Section 4: Jobs - 24 -
www.semiconductors.orgSource: U.S. Bureau of Labor Statistics and SIA estimates.
direct jobs in the U.S. semiconductor industry
jobs in other parts of the U.S. economy…
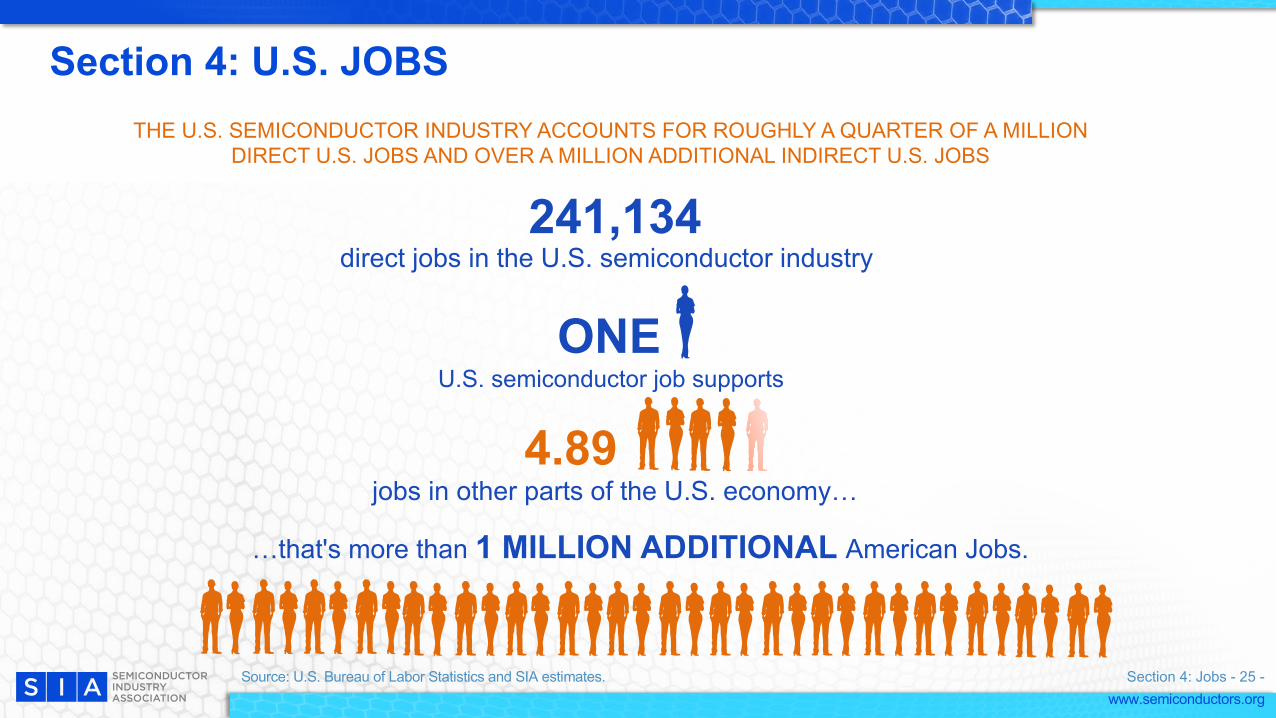
…that's more than 1 MILLION ADDITIONAL American Jobs.
241,134
ONE U.S. semiconductor job supports
4.89
Section 4: U.S. JOBSTHE U.S. SEMICONDUCTOR INDUSTRY ACCOUNTS FOR ROUGHLY A QUARTER OF A MILLION
DIRECT U.S. JOBS AND OVER A MILLION ADDITIONAL INDIRECT U.S. JOBS
Section 4: Jobs - 25 -
www.semiconductors.org
Section 5U.S. PRODUCTIVITY
Section 5: Productivity - 26 -
www.semiconductors.org
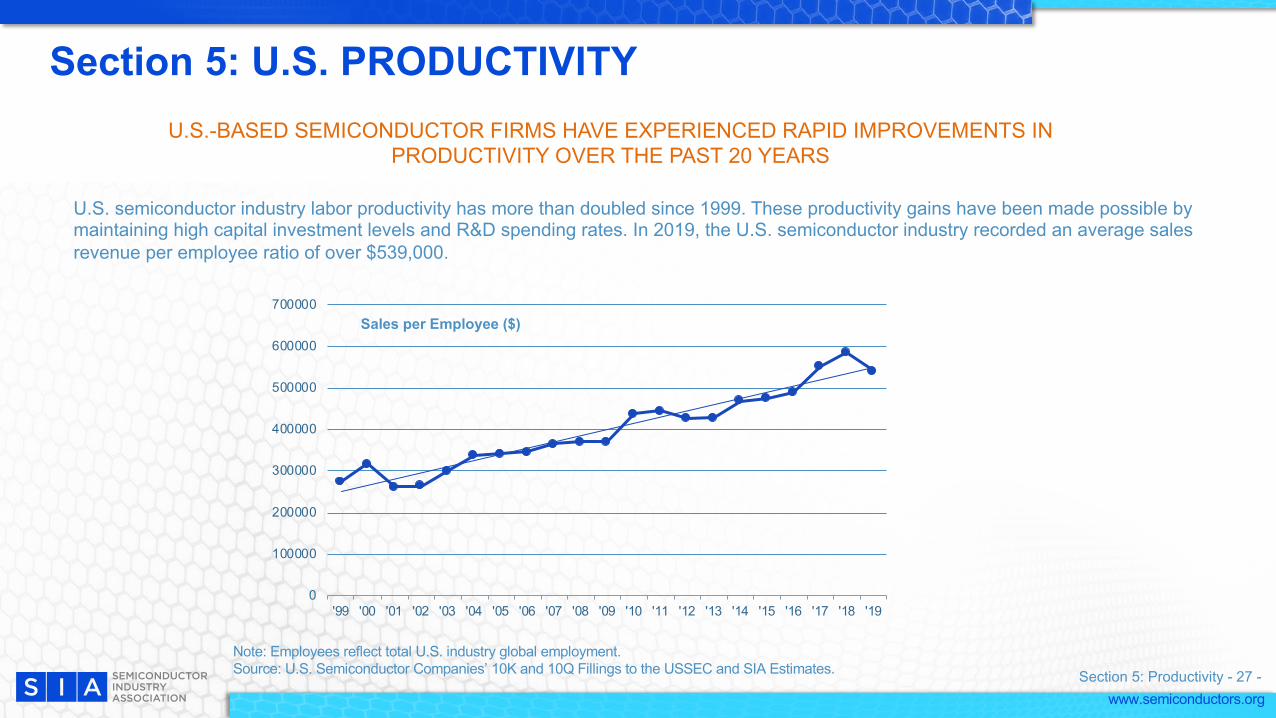
Section 5: U.S. PRODUCTIVITYU.S.-BASED SEMICONDUCTOR FIRMS HAVE EXPERIENCED RAPID IMPROVEMENTS IN
PRODUCTIVITY OVER THE PAST 20 YEARS
U.S. semiconductor industry labor productivity has more than doubled since 1999. These productivity gains have been made possible by maintaining high capital investment levels and R&D spending rates. In 2019, the U.S. semiconductor industry recorded an average sales revenue per employee ratio of over $539,000.
Note: Employees reflect total U.S. industry global employment. Source: U.S. Semiconductor Companies’ 10K and 10Q Fillings to the USSEC and SIA Estimates.
Sales per Employee ($)
Section 5: Productivity - 27 -
0
100000
200000
300000
400000
500000
600000
700000
'99 '00 '01 '02 '03 '04 '05 '06 '07 '08 '09 '10 '11 '12 '13 '14 '15 '16 '17 '18 '19