Semi Annual Report · Hotel & Resort REITS 6.9 Diversified REITS 2.7 Short-Term Investments 1.9...
48
Semi-Annual Report December 31, 2019 SPDR ® Series Trust - Equity Funds SPDR Dow Jones REIT ETF SPDR S&P Biotech ETF SPDR S&P Dividend ETF Beginning on January 1, 2021, as permitted by regulations adopted by the U.S. Securities and Exchange Commission, paper copies of a Fund’s annual and semi-annual shareholder reports will no longer be sent by mail, unless you specifically request paper copies of the reports from the Fund (or from your financial intermediary, such as a broker-dealer or bank). Instead, the reports will be made available on a Fund’s website (www.spdrs.com), and you will be notified by mail each time a report is posted, and provided with a website link to access the report. If you already elected to receive reports electronically, you will not be affected by this change and you need not take any action. You may elect to receive shareholder reports and other communications by contacting your financial intermediary. You may elect to receive all future reports in paper free of charge. If you invest through a financial intermediary, you can contact your financial intermediary to request that you continue to receive paper copies of your shareholder reports. Your election to receive reports in paper will apply to all funds held in your account. The information contained in this report is intended for the general information of shareholders of the Trust. This report is not authorized for distribution to prospective investors unless preceded or accompanied by a current Trust prospectus which contains important information concerning the Trust. You may obtain a current prospectus and SAI from the Distributor by calling 1-866-787-2257 or visiting www.spdrs.com. Please read the prospectus carefully before you invest.
Transcript of Semi Annual Report · Hotel & Resort REITS 6.9 Diversified REITS 2.7 Short-Term Investments 1.9...
Semi-Annual ReportDecember 31, 2019
SPDR® Series Trust - Equity FundsSPDR Dow Jones REIT ETF
SPDR S&P Biotech ETF
SPDR S&P Dividend ETF
Beginning on January 1, 2021, as permitted by regulations adopted by the U.S. Securities andExchange Commission, paper copies of a Fund’s annual and semi-annual shareholder reportswill no longer be sent by mail, unless you specifically request paper copies of the reports fromthe Fund (or from your financial intermediary, such as a broker-dealer or bank). Instead, thereports will be made available on a Fund’s website (www.spdrs.com), and you will be notifiedby mail each time a report is posted, and provided with a website link to access the report. Ifyou already elected to receive reports electronically, you will not be affected by this changeand you need not take any action. You may elect to receive shareholder reports and othercommunications by contacting your financial intermediary.
You may elect to receive all future reports in paper free of charge. If you invest through afinancial intermediary, you can contact your financial intermediary to request that youcontinue to receive paper copies of your shareholder reports. Your election to receive reportsin paper will apply to all funds held in your account.
The information contained in this report is intended for the general information ofshareholders of the Trust. This report is not authorized for distribution to prospectiveinvestors unless preceded or accompanied by a current Trust prospectus which containsimportant information concerning the Trust. You may obtain a current prospectus and SAIfrom the Distributor by calling 1-866-787-2257 or visiting www.spdrs.com. Please read theprospectus carefully before you invest.

TA B L E O F C O N T E N T S ( U N A U D I T E D )
Portfolio Statistics (Unaudited)SPDR Dow Jones REIT ETF (RWR) . . . . . . . . . . . . . . . . . . . . . . . . . . . . . . . . . . . . 1SPDR S&P Biotech ETF (XBI). . . . . . . . . . . . . . . . . . . . . . . . . . . . . . . . . . . . . . . . . 2SPDR S&P Dividend ETF (SDY). . . . . . . . . . . . . . . . . . . . . . . . . . . . . . . . . . . . . . . 3
Schedules of Investments (Unaudited)SPDR Dow Jones REIT ETF (RWR) . . . . . . . . . . . . . . . . . . . . . . . . . . . . . . . . . . . . 4SPDR S&P Biotech ETF (XBI). . . . . . . . . . . . . . . . . . . . . . . . . . . . . . . . . . . . . . . . . 8SPDR S&P Dividend ETF (SDY). . . . . . . . . . . . . . . . . . . . . . . . . . . . . . . . . . . . . . . 13
Financial Statements (Unaudited) . . . . . . . . . . . . . . . . . . . . . . . . . . . . . . . . . . . . . 20Financial Highlights (Unaudited) . . . . . . . . . . . . . . . . . . . . . . . . . . . . . . . . . . . . . . 25Notes to Financial Statements (Unaudited). . . . . . . . . . . . . . . . . . . . . . . . . . . . . 28Other Information (Unaudited) . . . . . . . . . . . . . . . . . . . . . . . . . . . . . . . . . . . . . . . 38
The information contained in this report is intended for the general information ofshareholders of the Trust. This report is not authorized for distribution to prospectiveinvestors unless preceded or accompanied by a current Trust prospectus whichcontains important information concerning the Trust. You may obtain a currentprospectus and SAI from the Distributor by calling 1-866-787-2257 or visitingwww.spdrs.com. Please read the prospectus carefully before you invest.

[This Page Intentionally Left Blank]
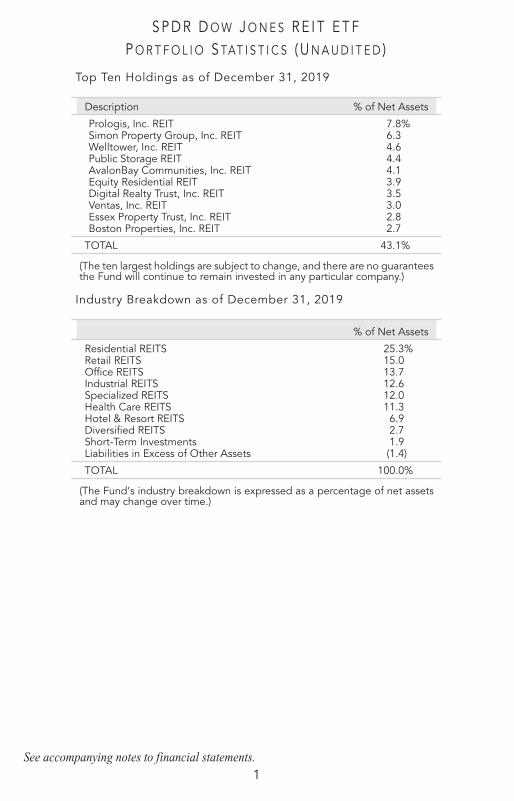
S P D R D O W J O N E S R E I T E T FP O R T F O L I O S TAT I S T I C S ( U N A U D I T E D )
Top Ten Holdings as of December 31, 2019
Description % of Net Assets
Prologis, Inc. REIT 7.8%Simon Property Group, Inc. REIT 6.3Welltower, Inc. REIT 4.6Public Storage REIT 4.4AvalonBay Communities, Inc. REIT 4.1Equity Residential REIT 3.9Digital Realty Trust, Inc. REIT 3.5Ventas, Inc. REIT 3.0Essex Property Trust, Inc. REIT 2.8Boston Properties, Inc. REIT 2.7
TOTAL 43.1%
(The ten largest holdings are subject to change, and there are no guaranteesthe Fund will continue to remain invested in any particular company.)
Industry Breakdown as of December 31, 2019
% of Net Assets
Residential REITS 25.3%Retail REITS 15.0Office REITS 13.7Industrial REITS 12.6Specialized REITS 12.0Health Care REITS 11.3Hotel & Resort REITS 6.9Diversified REITS 2.7Short-Term Investments 1.9Liabilities in Excess of Other Assets (1.4)
TOTAL 100.0%
(The Fund’s industry breakdown is expressed as a percentage of net assetsand may change over time.)
See accompanying notes to financial statements.1
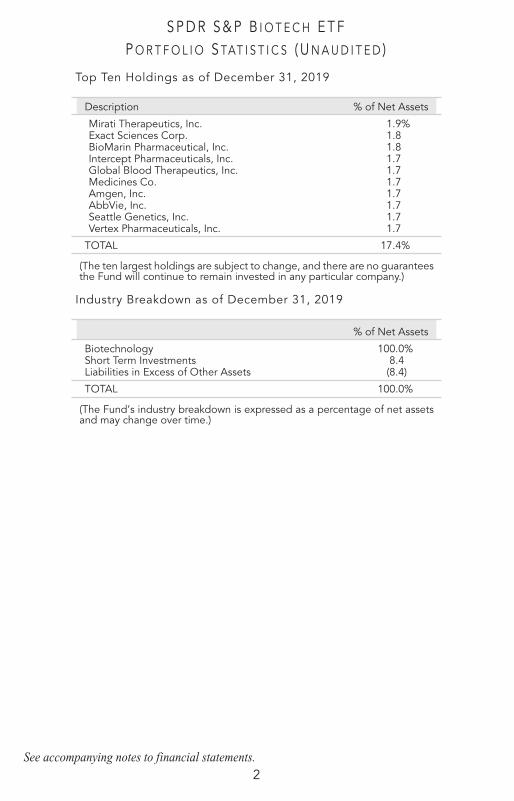
S P D R S & P B I O T E C H E T FP O R T F O L I O S TAT I S T I C S ( U N A U D I T E D )
Top Ten Holdings as of December 31, 2019
Description % of Net Assets
Mirati Therapeutics, Inc. 1.9%Exact Sciences Corp. 1.8BioMarin Pharmaceutical, Inc. 1.8Intercept Pharmaceuticals, Inc. 1.7Global Blood Therapeutics, Inc. 1.7Medicines Co. 1.7Amgen, Inc. 1.7AbbVie, Inc. 1.7Seattle Genetics, Inc. 1.7Vertex Pharmaceuticals, Inc. 1.7
TOTAL 17.4%
(The ten largest holdings are subject to change, and there are no guaranteesthe Fund will continue to remain invested in any particular company.)
Industry Breakdown as of December 31, 2019
% of Net Assets
Biotechnology 100.0%Short Term Investments 8.4Liabilities in Excess of Other Assets (8.4)
TOTAL 100.0%
(The Fund’s industry breakdown is expressed as a percentage of net assetsand may change over time.)
See accompanying notes to financial statements.2
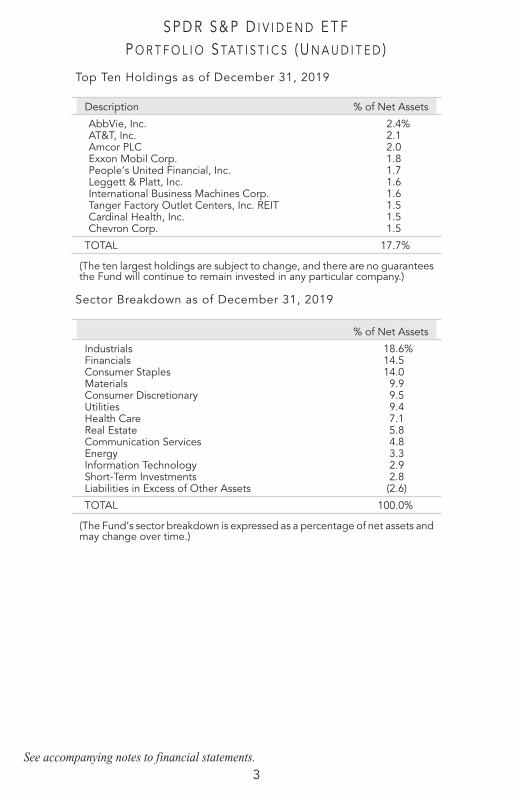
S P D R S & P D I V I D E N D E T FP O R T F O L I O S TAT I S T I C S ( U N A U D I T E D )
Top Ten Holdings as of December 31, 2019
Description % of Net Assets
AbbVie, Inc. 2.4%AT&T, Inc. 2.1Amcor PLC 2.0Exxon Mobil Corp. 1.8People’s United Financial, Inc. 1.7Leggett & Platt, Inc. 1.6International Business Machines Corp. 1.6Tanger Factory Outlet Centers, Inc. REIT 1.5Cardinal Health, Inc. 1.5Chevron Corp. 1.5
TOTAL 17.7%
(The ten largest holdings are subject to change, and there are no guaranteesthe Fund will continue to remain invested in any particular company.)
Sector Breakdown as of December 31, 2019
% of Net Assets
Industrials 18.6%Financials 14.5Consumer Staples 14.0Materials 9.9Consumer Discretionary 9.5Utilities 9.4Health Care 7.1Real Estate 5.8Communication Services 4.8Energy 3.3Information Technology 2.9Short-Term Investments 2.8Liabilities in Excess of Other Assets (2.6)
TOTAL 100.0%
(The Fund’s sector breakdown is expressed as a percentage of net assets andmay change over time.)
See accompanying notes to financial statements.3
Security Description Shares Value
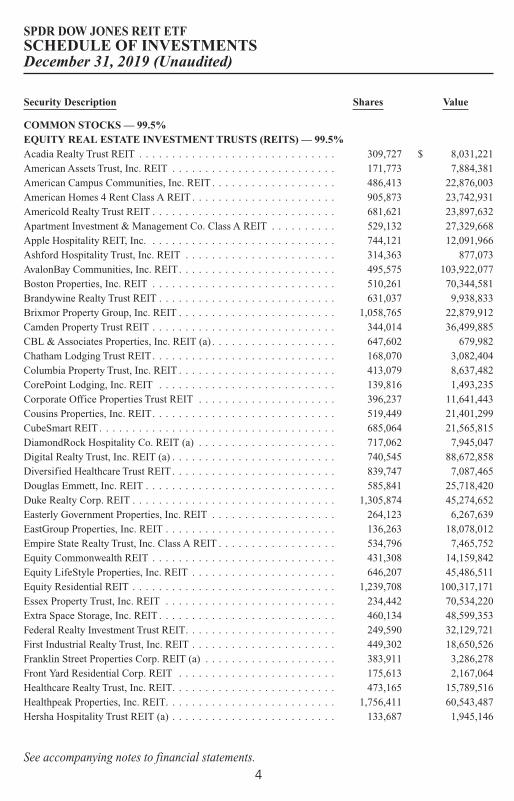
COMMON STOCKS — 99.5%EQUITY REAL ESTATE INVESTMENT TRUSTS (REITS) — 99.5%Acadia Realty Trust REIT . . . . . . . . . . . . . . . . . . . . . . . . . . . . . . 309,727 $ 8,031,221American Assets Trust, Inc. REIT . . . . . . . . . . . . . . . . . . . . . . . . . 171,773 7,884,381American Campus Communities, Inc. REIT . . . . . . . . . . . . . . . . . . . 486,413 22,876,003American Homes 4 Rent Class A REIT . . . . . . . . . . . . . . . . . . . . . . 905,873 23,742,931Americold Realty Trust REIT . . . . . . . . . . . . . . . . . . . . . . . . . . . . 681,621 23,897,632Apartment Investment & Management Co. Class A REIT . . . . . . . . . . 529,132 27,329,668Apple Hospitality REIT, Inc. . . . . . . . . . . . . . . . . . . . . . . . . . . . . 744,121 12,091,966Ashford Hospitality Trust, Inc. REIT . . . . . . . . . . . . . . . . . . . . . . . 314,363 877,073AvalonBay Communities, Inc. REIT. . . . . . . . . . . . . . . . . . . . . . . . 495,575 103,922,077Boston Properties, Inc. REIT . . . . . . . . . . . . . . . . . . . . . . . . . . . . 510,261 70,344,581Brandywine Realty Trust REIT . . . . . . . . . . . . . . . . . . . . . . . . . . . 631,037 9,938,833Brixmor Property Group, Inc. REIT . . . . . . . . . . . . . . . . . . . . . . . . 1,058,765 22,879,912Camden Property Trust REIT . . . . . . . . . . . . . . . . . . . . . . . . . . . . 344,014 36,499,885CBL & Associates Properties, Inc. REIT (a) . . . . . . . . . . . . . . . . . . . 647,602 679,982Chatham Lodging Trust REIT. . . . . . . . . . . . . . . . . . . . . . . . . . . . 168,070 3,082,404Columbia Property Trust, Inc. REIT . . . . . . . . . . . . . . . . . . . . . . . . 413,079 8,637,482CorePoint Lodging, Inc. REIT . . . . . . . . . . . . . . . . . . . . . . . . . . . 139,816 1,493,235Corporate Office Properties Trust REIT . . . . . . . . . . . . . . . . . . . . . 396,237 11,641,443Cousins Properties, Inc. REIT. . . . . . . . . . . . . . . . . . . . . . . . . . . . 519,449 21,401,299CubeSmart REIT . . . . . . . . . . . . . . . . . . . . . . . . . . . . . . . . . . . . 685,064 21,565,815DiamondRock Hospitality Co. REIT (a) . . . . . . . . . . . . . . . . . . . . . 717,062 7,945,047Digital Realty Trust, Inc. REIT (a) . . . . . . . . . . . . . . . . . . . . . . . . . 740,545 88,672,858Diversified Healthcare Trust REIT . . . . . . . . . . . . . . . . . . . . . . . . . 839,747 7,087,465Douglas Emmett, Inc. REIT . . . . . . . . . . . . . . . . . . . . . . . . . . . . . 585,841 25,718,420Duke Realty Corp. REIT . . . . . . . . . . . . . . . . . . . . . . . . . . . . . . . 1,305,874 45,274,652Easterly Government Properties, Inc. REIT . . . . . . . . . . . . . . . . . . . 264,123 6,267,639EastGroup Properties, Inc. REIT . . . . . . . . . . . . . . . . . . . . . . . . . . 136,263 18,078,012Empire State Realty Trust, Inc. Class A REIT . . . . . . . . . . . . . . . . . . 534,796 7,465,752Equity Commonwealth REIT . . . . . . . . . . . . . . . . . . . . . . . . . . . . 431,308 14,159,842Equity LifeStyle Properties, Inc. REIT . . . . . . . . . . . . . . . . . . . . . . 646,207 45,486,511Equity Residential REIT . . . . . . . . . . . . . . . . . . . . . . . . . . . . . . . 1,239,708 100,317,171Essex Property Trust, Inc. REIT . . . . . . . . . . . . . . . . . . . . . . . . . . 234,442 70,534,220Extra Space Storage, Inc. REIT . . . . . . . . . . . . . . . . . . . . . . . . . . . 460,134 48,599,353Federal Realty Investment Trust REIT. . . . . . . . . . . . . . . . . . . . . . . 249,590 32,129,721First Industrial Realty Trust, Inc. REIT . . . . . . . . . . . . . . . . . . . . . . 449,302 18,650,526Franklin Street Properties Corp. REIT (a) . . . . . . . . . . . . . . . . . . . . 383,911 3,286,278Front Yard Residential Corp. REIT . . . . . . . . . . . . . . . . . . . . . . . . 175,613 2,167,064Healthcare Realty Trust, Inc. REIT. . . . . . . . . . . . . . . . . . . . . . . . . 473,165 15,789,516Healthpeak Properties, Inc. REIT. . . . . . . . . . . . . . . . . . . . . . . . . . 1,756,411 60,543,487Hersha Hospitality Trust REIT (a) . . . . . . . . . . . . . . . . . . . . . . . . . 133,687 1,945,146
SPDR DOW JONES REIT ETFSCHEDULE OF INVESTMENTSDecember 31, 2019 (Unaudited)
See accompanying notes to financial statements.4
Security Description Shares Value
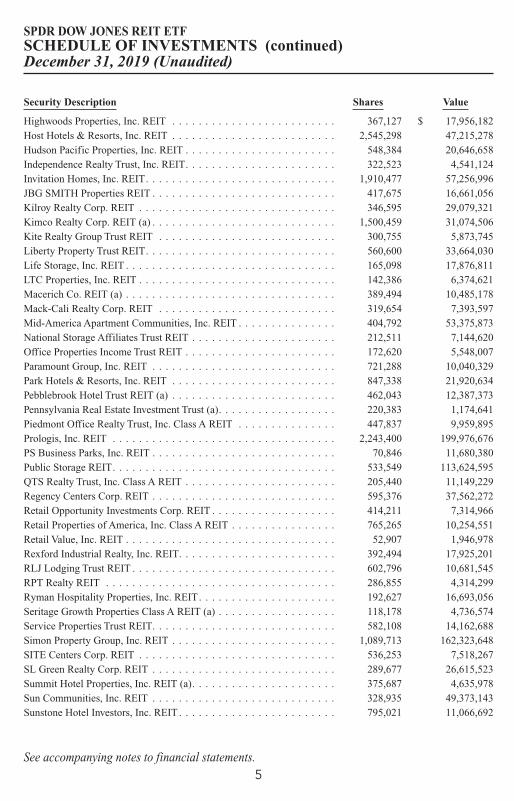
Highwoods Properties, Inc. REIT . . . . . . . . . . . . . . . . . . . . . . . . . 367,127 $ 17,956,182Host Hotels & Resorts, Inc. REIT . . . . . . . . . . . . . . . . . . . . . . . . . 2,545,298 47,215,278Hudson Pacific Properties, Inc. REIT . . . . . . . . . . . . . . . . . . . . . . . 548,384 20,646,658Independence Realty Trust, Inc. REIT. . . . . . . . . . . . . . . . . . . . . . . 322,523 4,541,124Invitation Homes, Inc. REIT. . . . . . . . . . . . . . . . . . . . . . . . . . . . . 1,910,477 57,256,996JBG SMITH Properties REIT . . . . . . . . . . . . . . . . . . . . . . . . . . . . 417,675 16,661,056Kilroy Realty Corp. REIT . . . . . . . . . . . . . . . . . . . . . . . . . . . . . . 346,595 29,079,321Kimco Realty Corp. REIT (a) . . . . . . . . . . . . . . . . . . . . . . . . . . . . 1,500,459 31,074,506Kite Realty Group Trust REIT . . . . . . . . . . . . . . . . . . . . . . . . . . . 300,755 5,873,745Liberty Property Trust REIT. . . . . . . . . . . . . . . . . . . . . . . . . . . . . 560,600 33,664,030Life Storage, Inc. REIT . . . . . . . . . . . . . . . . . . . . . . . . . . . . . . . . 165,098 17,876,811LTC Properties, Inc. REIT . . . . . . . . . . . . . . . . . . . . . . . . . . . . . . 142,386 6,374,621Macerich Co. REIT (a) . . . . . . . . . . . . . . . . . . . . . . . . . . . . . . . . 389,494 10,485,178Mack-Cali Realty Corp. REIT . . . . . . . . . . . . . . . . . . . . . . . . . . . 319,654 7,393,597Mid-America Apartment Communities, Inc. REIT . . . . . . . . . . . . . . . 404,792 53,375,873National Storage Affiliates Trust REIT . . . . . . . . . . . . . . . . . . . . . . 212,511 7,144,620Office Properties Income Trust REIT . . . . . . . . . . . . . . . . . . . . . . . 172,620 5,548,007Paramount Group, Inc. REIT . . . . . . . . . . . . . . . . . . . . . . . . . . . . 721,288 10,040,329Park Hotels & Resorts, Inc. REIT . . . . . . . . . . . . . . . . . . . . . . . . . 847,338 21,920,634Pebblebrook Hotel Trust REIT (a) . . . . . . . . . . . . . . . . . . . . . . . . . 462,043 12,387,373Pennsylvania Real Estate Investment Trust (a). . . . . . . . . . . . . . . . . . 220,383 1,174,641Piedmont Office Realty Trust, Inc. Class A REIT . . . . . . . . . . . . . . . 447,837 9,959,895Prologis, Inc. REIT . . . . . . . . . . . . . . . . . . . . . . . . . . . . . . . . . . 2,243,400 199,976,676PS Business Parks, Inc. REIT . . . . . . . . . . . . . . . . . . . . . . . . . . . . 70,846 11,680,380Public Storage REIT. . . . . . . . . . . . . . . . . . . . . . . . . . . . . . . . . . 533,549 113,624,595QTS Realty Trust, Inc. Class A REIT . . . . . . . . . . . . . . . . . . . . . . . 205,440 11,149,229Regency Centers Corp. REIT . . . . . . . . . . . . . . . . . . . . . . . . . . . . 595,376 37,562,272Retail Opportunity Investments Corp. REIT . . . . . . . . . . . . . . . . . . . 414,211 7,314,966Retail Properties of America, Inc. Class A REIT . . . . . . . . . . . . . . . . 765,265 10,254,551Retail Value, Inc. REIT . . . . . . . . . . . . . . . . . . . . . . . . . . . . . . . . 52,907 1,946,978Rexford Industrial Realty, Inc. REIT. . . . . . . . . . . . . . . . . . . . . . . . 392,494 17,925,201RLJ Lodging Trust REIT . . . . . . . . . . . . . . . . . . . . . . . . . . . . . . . 602,796 10,681,545RPT Realty REIT . . . . . . . . . . . . . . . . . . . . . . . . . . . . . . . . . . . 286,855 4,314,299Ryman Hospitality Properties, Inc. REIT. . . . . . . . . . . . . . . . . . . . . 192,627 16,693,056Seritage Growth Properties Class A REIT (a) . . . . . . . . . . . . . . . . . . 118,178 4,736,574Service Properties Trust REIT. . . . . . . . . . . . . . . . . . . . . . . . . . . . 582,108 14,162,688Simon Property Group, Inc. REIT . . . . . . . . . . . . . . . . . . . . . . . . . 1,089,713 162,323,648SITE Centers Corp. REIT . . . . . . . . . . . . . . . . . . . . . . . . . . . . . . 536,253 7,518,267SL Green Realty Corp. REIT . . . . . . . . . . . . . . . . . . . . . . . . . . . . 289,677 26,615,523Summit Hotel Properties, Inc. REIT (a). . . . . . . . . . . . . . . . . . . . . . 375,687 4,635,978Sun Communities, Inc. REIT . . . . . . . . . . . . . . . . . . . . . . . . . . . . 328,935 49,373,143Sunstone Hotel Investors, Inc. REIT . . . . . . . . . . . . . . . . . . . . . . . . 795,021 11,066,692
SPDR DOW JONES REIT ETFSCHEDULE OF INVESTMENTS (continued)December 31, 2019 (Unaudited)
See accompanying notes to financial statements.5
Security Description Shares Value
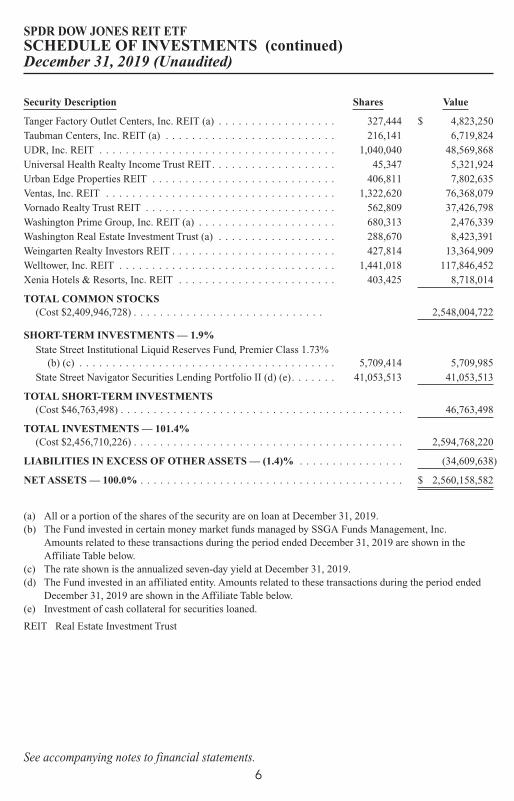
Tanger Factory Outlet Centers, Inc. REIT (a) . . . . . . . . . . . . . . . . . . 327,444 $ 4,823,250Taubman Centers, Inc. REIT (a) . . . . . . . . . . . . . . . . . . . . . . . . . . 216,141 6,719,824UDR, Inc. REIT . . . . . . . . . . . . . . . . . . . . . . . . . . . . . . . . . . . . 1,040,040 48,569,868Universal Health Realty Income Trust REIT. . . . . . . . . . . . . . . . . . . 45,347 5,321,924Urban Edge Properties REIT . . . . . . . . . . . . . . . . . . . . . . . . . . . . 406,811 7,802,635Ventas, Inc. REIT . . . . . . . . . . . . . . . . . . . . . . . . . . . . . . . . . . . 1,322,620 76,368,079Vornado Realty Trust REIT . . . . . . . . . . . . . . . . . . . . . . . . . . . . . 562,809 37,426,798Washington Prime Group, Inc. REIT (a) . . . . . . . . . . . . . . . . . . . . . 680,313 2,476,339Washington Real Estate Investment Trust (a) . . . . . . . . . . . . . . . . . . 288,670 8,423,391Weingarten Realty Investors REIT . . . . . . . . . . . . . . . . . . . . . . . . . 427,814 13,364,909Welltower, Inc. REIT . . . . . . . . . . . . . . . . . . . . . . . . . . . . . . . . . 1,441,018 117,846,452Xenia Hotels & Resorts, Inc. REIT . . . . . . . . . . . . . . . . . . . . . . . . 403,425 8,718,014
TOTAL COMMON STOCKS(Cost $2,409,946,728) . . . . . . . . . . . . . . . . . . . . . . . . . . . . . 2,548,004,722
SHORT-TERM INVESTMENTS — 1.9%State Street Institutional Liquid Reserves Fund, Premier Class 1.73%
(b) (c) . . . . . . . . . . . . . . . . . . . . . . . . . . . . . . . . . . . . . . . 5,709,414 5,709,985State Street Navigator Securities Lending Portfolio II (d) (e). . . . . . . 41,053,513 41,053,513
TOTAL SHORT-TERM INVESTMENTS(Cost $46,763,498) . . . . . . . . . . . . . . . . . . . . . . . . . . . . . . . . . . . . . . . . . . . 46,763,498
TOTAL INVESTMENTS — 101.4%(Cost $2,456,710,226) . . . . . . . . . . . . . . . . . . . . . . . . . . . . . . . . . . . . . . . . . 2,594,768,220
LIABILITIES IN EXCESS OF OTHER ASSETS — (1.4)% . . . . . . . . . . . . . . . . (34,609,638)
NET ASSETS — 100.0% . . . . . . . . . . . . . . . . . . . . . . . . . . . . . . . . . . . . . . . . $ 2,560,158,582
(a) All or a portion of the shares of the security are on loan at December 31, 2019.(b) The Fund invested in certain money market funds managed by SSGA Funds Management, Inc.
Amounts related to these transactions during the period ended December 31, 2019 are shown in theAffiliate Table below.
(c) The rate shown is the annualized seven-day yield at December 31, 2019.(d) The Fund invested in an affiliated entity. Amounts related to these transactions during the period ended
December 31, 2019 are shown in the Affiliate Table below.(e) Investment of cash collateral for securities loaned.
REIT Real Estate Investment Trust
SPDR DOW JONES REIT ETFSCHEDULE OF INVESTMENTS (continued)December 31, 2019 (Unaudited)
See accompanying notes to financial statements.6

The following table summarizes the value of the Fund’s investments according to thefair value hierarchy as of December 31, 2019.
DescriptionLevel 1 –
Quoted Prices
Level 2 –Other SignificantObservable Inputs
Level 3 –Significant
Unobservable Inputs Total
ASSETS:INVESTMENTS:Common Stocks . . . . . . . . . . . . . . . . . . . . $2,548,004,722 $— $— $2,548,004,722
Short-Term Investments . . . . . . . . . . . . . . . . 46,763,498 — — 46,763,498
TOTAL INVESTMENTS . . . . . . . . . . . . . . $2,594,768,220 $— $— $2,594,768,220
Affiliate Table
Number ofShares Held
at 6/30/19Value at6/30/19
Cost ofPurchases
Proceedsfrom
Shares SoldRealized
Gain (Loss)
Change inUnrealized
Appreciation/Depreciation
Number ofShares Heldat 12/31/19
Value at12/31/19
DividendIncome
State Street Institutional Liquid Reserves Fund,Premier Class . . . . . . . . . . . . — $ — $ 89,902,044 $ 84,191,131 $(928) $— 5,709,414 $ 5,709,985 $24,809
State Street Institutional U.S. GovernmentMoney Market Fund, Class G Shares . . . 6,552,771 6,552,771 9,640,475 16,193,246 — — — — 6,343
State Street Navigator Securities LendingPortfolio II . . . . . . . . . . . . . — — 106,607,193 65,553,680 — — 41,053,513 41,053,513 36,414
State Street Navigator Securities LendingPortfolio III . . . . . . . . . . . . . 10,224,141 10,224,141 74,155,406 84,379,547 — — — — 29,297
Total . . . . . . . . . . . . . . . . . $16,776,912 $280,305,118 $250,317,604 $(928) $— $46,763,498 $96,863
SPDR DOW JONES REIT ETFSCHEDULE OF INVESTMENTS (continued)December 31, 2019 (Unaudited)
See accompanying notes to financial statements.7
Security Description Shares Value
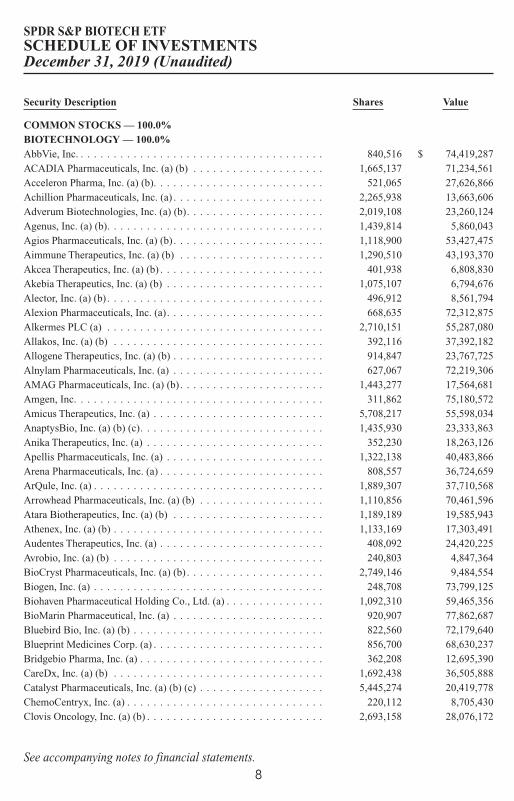
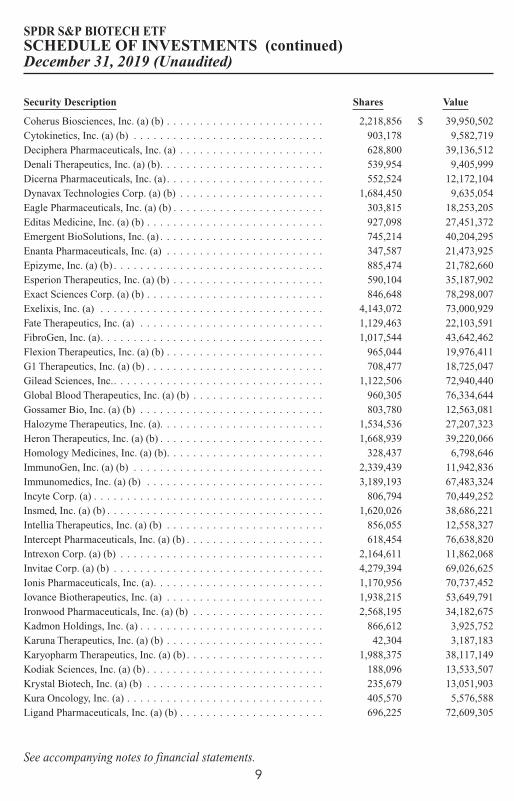
COMMON STOCKS — 100.0%BIOTECHNOLOGY — 100.0%AbbVie, Inc. . . . . . . . . . . . . . . . . . . . . . . . . . . . . . . . . . . . . . 840,516 $ 74,419,287ACADIA Pharmaceuticals, Inc. (a) (b) . . . . . . . . . . . . . . . . . . . . 1,665,137 71,234,561Acceleron Pharma, Inc. (a) (b). . . . . . . . . . . . . . . . . . . . . . . . . . 521,065 27,626,866Achillion Pharmaceuticals, Inc. (a) . . . . . . . . . . . . . . . . . . . . . . . 2,265,938 13,663,606Adverum Biotechnologies, Inc. (a) (b). . . . . . . . . . . . . . . . . . . . . 2,019,108 23,260,124Agenus, Inc. (a) (b). . . . . . . . . . . . . . . . . . . . . . . . . . . . . . . . . 1,439,814 5,860,043Agios Pharmaceuticals, Inc. (a) (b) . . . . . . . . . . . . . . . . . . . . . . . 1,118,900 53,427,475Aimmune Therapeutics, Inc. (a) (b) . . . . . . . . . . . . . . . . . . . . . . 1,290,510 43,193,370Akcea Therapeutics, Inc. (a) (b) . . . . . . . . . . . . . . . . . . . . . . . . . 401,938 6,808,830Akebia Therapeutics, Inc. (a) (b) . . . . . . . . . . . . . . . . . . . . . . . . 1,075,107 6,794,676Alector, Inc. (a) (b) . . . . . . . . . . . . . . . . . . . . . . . . . . . . . . . . . 496,912 8,561,794Alexion Pharmaceuticals, Inc. (a). . . . . . . . . . . . . . . . . . . . . . . . 668,635 72,312,875Alkermes PLC (a) . . . . . . . . . . . . . . . . . . . . . . . . . . . . . . . . . 2,710,151 55,287,080Allakos, Inc. (a) (b) . . . . . . . . . . . . . . . . . . . . . . . . . . . . . . . . 392,116 37,392,182Allogene Therapeutics, Inc. (a) (b) . . . . . . . . . . . . . . . . . . . . . . . 914,847 23,767,725Alnylam Pharmaceuticals, Inc. (a) . . . . . . . . . . . . . . . . . . . . . . . 627,067 72,219,306AMAG Pharmaceuticals, Inc. (a) (b) . . . . . . . . . . . . . . . . . . . . . . 1,443,277 17,564,681Amgen, Inc. . . . . . . . . . . . . . . . . . . . . . . . . . . . . . . . . . . . . . 311,862 75,180,572Amicus Therapeutics, Inc. (a) . . . . . . . . . . . . . . . . . . . . . . . . . . 5,708,217 55,598,034AnaptysBio, Inc. (a) (b) (c). . . . . . . . . . . . . . . . . . . . . . . . . . . . 1,435,930 23,333,863Anika Therapeutics, Inc. (a) . . . . . . . . . . . . . . . . . . . . . . . . . . . 352,230 18,263,126Apellis Pharmaceuticals, Inc. (a) . . . . . . . . . . . . . . . . . . . . . . . . 1,322,138 40,483,866Arena Pharmaceuticals, Inc. (a) . . . . . . . . . . . . . . . . . . . . . . . . . 808,557 36,724,659ArQule, Inc. (a) . . . . . . . . . . . . . . . . . . . . . . . . . . . . . . . . . . . 1,889,307 37,710,568Arrowhead Pharmaceuticals, Inc. (a) (b) . . . . . . . . . . . . . . . . . . . 1,110,856 70,461,596Atara Biotherapeutics, Inc. (a) (b) . . . . . . . . . . . . . . . . . . . . . . . 1,189,189 19,585,943Athenex, Inc. (a) (b) . . . . . . . . . . . . . . . . . . . . . . . . . . . . . . . . 1,133,169 17,303,491Audentes Therapeutics, Inc. (a) . . . . . . . . . . . . . . . . . . . . . . . . . 408,092 24,420,225Avrobio, Inc. (a) (b) . . . . . . . . . . . . . . . . . . . . . . . . . . . . . . . . 240,803 4,847,364BioCryst Pharmaceuticals, Inc. (a) (b) . . . . . . . . . . . . . . . . . . . . . 2,749,146 9,484,554Biogen, Inc. (a) . . . . . . . . . . . . . . . . . . . . . . . . . . . . . . . . . . . 248,708 73,799,125Biohaven Pharmaceutical Holding Co., Ltd. (a) . . . . . . . . . . . . . . . 1,092,310 59,465,356BioMarin Pharmaceutical, Inc. (a) . . . . . . . . . . . . . . . . . . . . . . . 920,907 77,862,687Bluebird Bio, Inc. (a) (b) . . . . . . . . . . . . . . . . . . . . . . . . . . . . . 822,560 72,179,640Blueprint Medicines Corp. (a) . . . . . . . . . . . . . . . . . . . . . . . . . . 856,700 68,630,237Bridgebio Pharma, Inc. (a) . . . . . . . . . . . . . . . . . . . . . . . . . . . . 362,208 12,695,390CareDx, Inc. (a) (b) . . . . . . . . . . . . . . . . . . . . . . . . . . . . . . . . 1,692,438 36,505,888Catalyst Pharmaceuticals, Inc. (a) (b) (c) . . . . . . . . . . . . . . . . . . . 5,445,274 20,419,778ChemoCentryx, Inc. (a) . . . . . . . . . . . . . . . . . . . . . . . . . . . . . . 220,112 8,705,430Clovis Oncology, Inc. (a) (b) . . . . . . . . . . . . . . . . . . . . . . . . . . . 2,693,158 28,076,172
SPDR S&P BIOTECH ETFSCHEDULE OF INVESTMENTSDecember 31, 2019 (Unaudited)
See accompanying notes to financial statements.8
Security Description Shares Value
Coherus Biosciences, Inc. (a) (b) . . . . . . . . . . . . . . . . . . . . . . . . 2,218,856 $ 39,950,502Cytokinetics, Inc. (a) (b) . . . . . . . . . . . . . . . . . . . . . . . . . . . . . 903,178 9,582,719Deciphera Pharmaceuticals, Inc. (a) . . . . . . . . . . . . . . . . . . . . . . 628,800 39,136,512Denali Therapeutics, Inc. (a) (b). . . . . . . . . . . . . . . . . . . . . . . . . 539,954 9,405,999Dicerna Pharmaceuticals, Inc. (a) . . . . . . . . . . . . . . . . . . . . . . . . 552,524 12,172,104Dynavax Technologies Corp. (a) (b) . . . . . . . . . . . . . . . . . . . . . . 1,684,450 9,635,054Eagle Pharmaceuticals, Inc. (a) (b) . . . . . . . . . . . . . . . . . . . . . . . 303,815 18,253,205Editas Medicine, Inc. (a) (b) . . . . . . . . . . . . . . . . . . . . . . . . . . . 927,098 27,451,372Emergent BioSolutions, Inc. (a) . . . . . . . . . . . . . . . . . . . . . . . . . 745,214 40,204,295Enanta Pharmaceuticals, Inc. (a) . . . . . . . . . . . . . . . . . . . . . . . . 347,587 21,473,925Epizyme, Inc. (a) (b) . . . . . . . . . . . . . . . . . . . . . . . . . . . . . . . . 885,474 21,782,660Esperion Therapeutics, Inc. (a) (b) . . . . . . . . . . . . . . . . . . . . . . . 590,104 35,187,902Exact Sciences Corp. (a) (b) . . . . . . . . . . . . . . . . . . . . . . . . . . . 846,648 78,298,007Exelixis, Inc. (a) . . . . . . . . . . . . . . . . . . . . . . . . . . . . . . . . . . 4,143,072 73,000,929Fate Therapeutics, Inc. (a) . . . . . . . . . . . . . . . . . . . . . . . . . . . . 1,129,463 22,103,591FibroGen, Inc. (a). . . . . . . . . . . . . . . . . . . . . . . . . . . . . . . . . . 1,017,544 43,642,462Flexion Therapeutics, Inc. (a) (b) . . . . . . . . . . . . . . . . . . . . . . . . 965,044 19,976,411G1 Therapeutics, Inc. (a) (b) . . . . . . . . . . . . . . . . . . . . . . . . . . . 708,477 18,725,047Gilead Sciences, Inc.. . . . . . . . . . . . . . . . . . . . . . . . . . . . . . . . 1,122,506 72,940,440Global Blood Therapeutics, Inc. (a) (b) . . . . . . . . . . . . . . . . . . . . 960,305 76,334,644Gossamer Bio, Inc. (a) (b) . . . . . . . . . . . . . . . . . . . . . . . . . . . . 803,780 12,563,081Halozyme Therapeutics, Inc. (a). . . . . . . . . . . . . . . . . . . . . . . . . 1,534,536 27,207,323Heron Therapeutics, Inc. (a) (b) . . . . . . . . . . . . . . . . . . . . . . . . . 1,668,939 39,220,066Homology Medicines, Inc. (a) (b). . . . . . . . . . . . . . . . . . . . . . . . 328,437 6,798,646ImmunoGen, Inc. (a) (b) . . . . . . . . . . . . . . . . . . . . . . . . . . . . . 2,339,439 11,942,836Immunomedics, Inc. (a) (b) . . . . . . . . . . . . . . . . . . . . . . . . . . . 3,189,193 67,483,324Incyte Corp. (a) . . . . . . . . . . . . . . . . . . . . . . . . . . . . . . . . . . . 806,794 70,449,252Insmed, Inc. (a) (b) . . . . . . . . . . . . . . . . . . . . . . . . . . . . . . . . . 1,620,026 38,686,221Intellia Therapeutics, Inc. (a) (b) . . . . . . . . . . . . . . . . . . . . . . . . 856,055 12,558,327Intercept Pharmaceuticals, Inc. (a) (b) . . . . . . . . . . . . . . . . . . . . . 618,454 76,638,820Intrexon Corp. (a) (b) . . . . . . . . . . . . . . . . . . . . . . . . . . . . . . . 2,164,611 11,862,068Invitae Corp. (a) (b) . . . . . . . . . . . . . . . . . . . . . . . . . . . . . . . . 4,279,394 69,026,625Ionis Pharmaceuticals, Inc. (a). . . . . . . . . . . . . . . . . . . . . . . . . . 1,170,956 70,737,452Iovance Biotherapeutics, Inc. (a) . . . . . . . . . . . . . . . . . . . . . . . . 1,938,215 53,649,791Ironwood Pharmaceuticals, Inc. (a) (b) . . . . . . . . . . . . . . . . . . . . 2,568,195 34,182,675Kadmon Holdings, Inc. (a) . . . . . . . . . . . . . . . . . . . . . . . . . . . . 866,612 3,925,752Karuna Therapeutics, Inc. (a) (b) . . . . . . . . . . . . . . . . . . . . . . . . 42,304 3,187,183Karyopharm Therapeutics, Inc. (a) (b) . . . . . . . . . . . . . . . . . . . . . 1,988,375 38,117,149Kodiak Sciences, Inc. (a) (b) . . . . . . . . . . . . . . . . . . . . . . . . . . . 188,096 13,533,507Krystal Biotech, Inc. (a) (b) . . . . . . . . . . . . . . . . . . . . . . . . . . . 235,679 13,051,903Kura Oncology, Inc. (a) . . . . . . . . . . . . . . . . . . . . . . . . . . . . . . 405,570 5,576,588Ligand Pharmaceuticals, Inc. (a) (b) . . . . . . . . . . . . . . . . . . . . . . 696,225 72,609,305
SPDR S&P BIOTECH ETFSCHEDULE OF INVESTMENTS (continued)December 31, 2019 (Unaudited)
See accompanying notes to financial statements.9
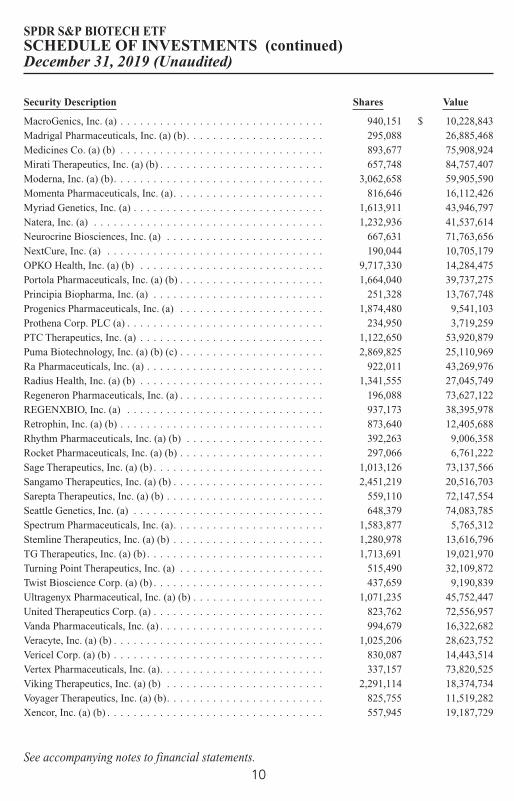
Security Description Shares Value
MacroGenics, Inc. (a) . . . . . . . . . . . . . . . . . . . . . . . . . . . . . . . 940,151 $ 10,228,843Madrigal Pharmaceuticals, Inc. (a) (b). . . . . . . . . . . . . . . . . . . . . 295,088 26,885,468Medicines Co. (a) (b) . . . . . . . . . . . . . . . . . . . . . . . . . . . . . . . 893,677 75,908,924Mirati Therapeutics, Inc. (a) (b) . . . . . . . . . . . . . . . . . . . . . . . . . 657,748 84,757,407Moderna, Inc. (a) (b). . . . . . . . . . . . . . . . . . . . . . . . . . . . . . . . 3,062,658 59,905,590Momenta Pharmaceuticals, Inc. (a). . . . . . . . . . . . . . . . . . . . . . . 816,646 16,112,426Myriad Genetics, Inc. (a) . . . . . . . . . . . . . . . . . . . . . . . . . . . . . 1,613,911 43,946,797Natera, Inc. (a) . . . . . . . . . . . . . . . . . . . . . . . . . . . . . . . . . . . 1,232,936 41,537,614Neurocrine Biosciences, Inc. (a) . . . . . . . . . . . . . . . . . . . . . . . . 667,631 71,763,656NextCure, Inc. (a) . . . . . . . . . . . . . . . . . . . . . . . . . . . . . . . . . 190,044 10,705,179OPKO Health, Inc. (a) (b) . . . . . . . . . . . . . . . . . . . . . . . . . . . . 9,717,330 14,284,475Portola Pharmaceuticals, Inc. (a) (b) . . . . . . . . . . . . . . . . . . . . . . 1,664,040 39,737,275Principia Biopharma, Inc. (a) . . . . . . . . . . . . . . . . . . . . . . . . . . 251,328 13,767,748Progenics Pharmaceuticals, Inc. (a) . . . . . . . . . . . . . . . . . . . . . . 1,874,480 9,541,103Prothena Corp. PLC (a) . . . . . . . . . . . . . . . . . . . . . . . . . . . . . . 234,950 3,719,259PTC Therapeutics, Inc. (a) . . . . . . . . . . . . . . . . . . . . . . . . . . . . 1,122,650 53,920,879Puma Biotechnology, Inc. (a) (b) (c) . . . . . . . . . . . . . . . . . . . . . . 2,869,825 25,110,969Ra Pharmaceuticals, Inc. (a) . . . . . . . . . . . . . . . . . . . . . . . . . . . 922,011 43,269,976Radius Health, Inc. (a) (b) . . . . . . . . . . . . . . . . . . . . . . . . . . . . 1,341,555 27,045,749Regeneron Pharmaceuticals, Inc. (a) . . . . . . . . . . . . . . . . . . . . . . 196,088 73,627,122REGENXBIO, Inc. (a) . . . . . . . . . . . . . . . . . . . . . . . . . . . . . . 937,173 38,395,978Retrophin, Inc. (a) (b) . . . . . . . . . . . . . . . . . . . . . . . . . . . . . . . 873,640 12,405,688Rhythm Pharmaceuticals, Inc. (a) (b) . . . . . . . . . . . . . . . . . . . . . 392,263 9,006,358Rocket Pharmaceuticals, Inc. (a) (b) . . . . . . . . . . . . . . . . . . . . . . 297,066 6,761,222Sage Therapeutics, Inc. (a) (b) . . . . . . . . . . . . . . . . . . . . . . . . . . 1,013,126 73,137,566Sangamo Therapeutics, Inc. (a) (b) . . . . . . . . . . . . . . . . . . . . . . . 2,451,219 20,516,703Sarepta Therapeutics, Inc. (a) (b) . . . . . . . . . . . . . . . . . . . . . . . . 559,110 72,147,554Seattle Genetics, Inc. (a) . . . . . . . . . . . . . . . . . . . . . . . . . . . . . 648,379 74,083,785Spectrum Pharmaceuticals, Inc. (a). . . . . . . . . . . . . . . . . . . . . . . 1,583,877 5,765,312Stemline Therapeutics, Inc. (a) (b) . . . . . . . . . . . . . . . . . . . . . . . 1,280,978 13,616,796TG Therapeutics, Inc. (a) (b) . . . . . . . . . . . . . . . . . . . . . . . . . . . 1,713,691 19,021,970Turning Point Therapeutics, Inc. (a) . . . . . . . . . . . . . . . . . . . . . . 515,490 32,109,872Twist Bioscience Corp. (a) (b) . . . . . . . . . . . . . . . . . . . . . . . . . . 437,659 9,190,839Ultragenyx Pharmaceutical, Inc. (a) (b) . . . . . . . . . . . . . . . . . . . . 1,071,235 45,752,447United Therapeutics Corp. (a) . . . . . . . . . . . . . . . . . . . . . . . . . . 823,762 72,556,957Vanda Pharmaceuticals, Inc. (a) . . . . . . . . . . . . . . . . . . . . . . . . . 994,679 16,322,682Veracyte, Inc. (a) (b) . . . . . . . . . . . . . . . . . . . . . . . . . . . . . . . . 1,025,206 28,623,752Vericel Corp. (a) (b) . . . . . . . . . . . . . . . . . . . . . . . . . . . . . . . . 830,087 14,443,514Vertex Pharmaceuticals, Inc. (a). . . . . . . . . . . . . . . . . . . . . . . . . 337,157 73,820,525Viking Therapeutics, Inc. (a) (b) . . . . . . . . . . . . . . . . . . . . . . . . 2,291,114 18,374,734Voyager Therapeutics, Inc. (a) (b). . . . . . . . . . . . . . . . . . . . . . . . 825,755 11,519,282Xencor, Inc. (a) (b) . . . . . . . . . . . . . . . . . . . . . . . . . . . . . . . . . 557,945 19,187,729
SPDR S&P BIOTECH ETFSCHEDULE OF INVESTMENTS (continued)December 31, 2019 (Unaudited)
See accompanying notes to financial statements.10
Security Description Shares Value
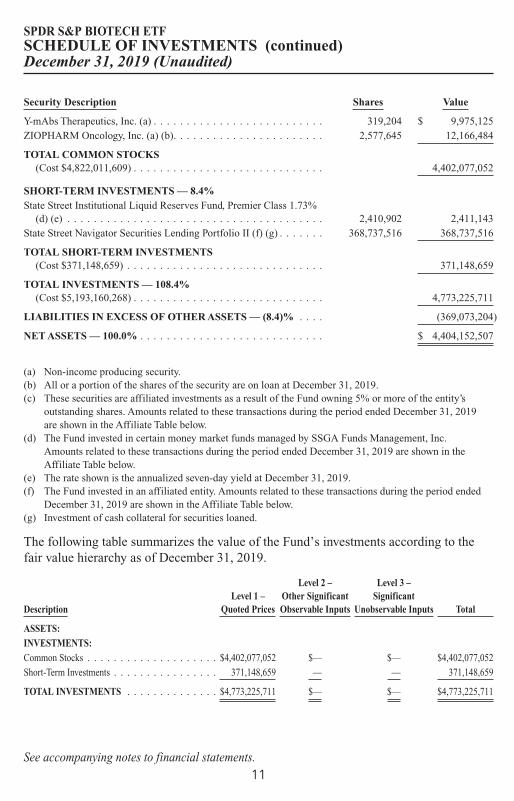
Y-mAbs Therapeutics, Inc. (a) . . . . . . . . . . . . . . . . . . . . . . . . . . 319,204 $ 9,975,125ZIOPHARM Oncology, Inc. (a) (b). . . . . . . . . . . . . . . . . . . . . . . 2,577,645 12,166,484
TOTAL COMMON STOCKS(Cost $4,822,011,609) . . . . . . . . . . . . . . . . . . . . . . . . . . . . . 4,402,077,052
SHORT-TERM INVESTMENTS — 8.4%State Street Institutional Liquid Reserves Fund, Premier Class 1.73%
(d) (e) . . . . . . . . . . . . . . . . . . . . . . . . . . . . . . . . . . . . . . . 2,410,902 2,411,143State Street Navigator Securities Lending Portfolio II (f) (g) . . . . . . . 368,737,516 368,737,516
TOTAL SHORT-TERM INVESTMENTS(Cost $371,148,659) . . . . . . . . . . . . . . . . . . . . . . . . . . . . . . 371,148,659
TOTAL INVESTMENTS — 108.4%(Cost $5,193,160,268) . . . . . . . . . . . . . . . . . . . . . . . . . . . . . 4,773,225,711
LIABILITIES IN EXCESS OF OTHER ASSETS — (8.4)% . . . . (369,073,204)
NET ASSETS — 100.0% . . . . . . . . . . . . . . . . . . . . . . . . . . . . $ 4,404,152,507
(a) Non-income producing security.(b) All or a portion of the shares of the security are on loan at December 31, 2019.(c) These securities are affiliated investments as a result of the Fund owning 5% or more of the entity’s
outstanding shares. Amounts related to these transactions during the period ended December 31, 2019are shown in the Affiliate Table below.
(d) The Fund invested in certain money market funds managed by SSGA Funds Management, Inc.Amounts related to these transactions during the period ended December 31, 2019 are shown in theAffiliate Table below.
(e) The rate shown is the annualized seven-day yield at December 31, 2019.(f) The Fund invested in an affiliated entity. Amounts related to these transactions during the period ended
December 31, 2019 are shown in the Affiliate Table below.(g) Investment of cash collateral for securities loaned.
The following table summarizes the value of the Fund’s investments according to thefair value hierarchy as of December 31, 2019.
DescriptionLevel 1 –
Quoted Prices
Level 2 –Other SignificantObservable Inputs
Level 3 –Significant
Unobservable Inputs Total
ASSETS:INVESTMENTS:Common Stocks . . . . . . . . . . . . . . . . . . . . $4,402,077,052 $— $— $4,402,077,052
Short-Term Investments . . . . . . . . . . . . . . . . 371,148,659 — — 371,148,659
TOTAL INVESTMENTS . . . . . . . . . . . . . . $4,773,225,711 $— $— $4,773,225,711
SPDR S&P BIOTECH ETFSCHEDULE OF INVESTMENTS (continued)December 31, 2019 (Unaudited)
See accompanying notes to financial statements.11
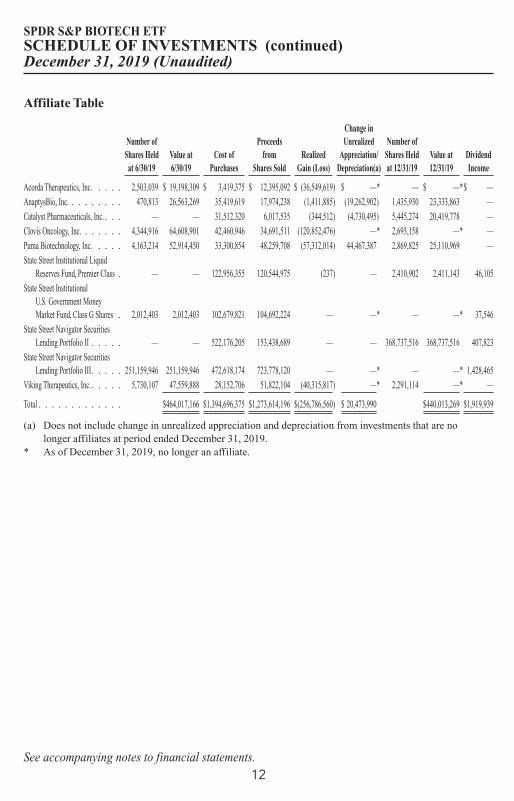
Affiliate Table
Number ofShares Held
at 6/30/19Value at6/30/19
Cost ofPurchases
Proceedsfrom
Shares SoldRealized
Gain (Loss)
Change inUnrealized
Appreciation/Depreciation(a)
Number ofShares Heldat 12/31/19
Value at12/31/19
DividendIncome
Acorda Therapeutics, Inc. . . . . 2,503,039 $ 19,198,309 $ 3,419,375 $ 12,395,092 $ (36,549,619) $ —* — $ —*$ —
AnaptysBio, Inc. . . . . . . . . 470,813 26,563,269 35,419,619 17,974,238 (1,411,885) (19,262,902) 1,435,930 23,333,863 —
Catalyst Pharmaceuticals, Inc.. . . — — 31,512,320 6,017,535 (344,512) (4,730,495) 5,445,274 20,419,778 —
Clovis Oncology, Inc. . . . . . . 4,344,916 64,608,901 42,460,946 34,691,511 (120,852,476) —* 2,693,158 —* —
Puma Biotechnology, Inc. . . . . 4,163,214 52,914,450 33,300,854 48,259,708 (57,312,014) 44,467,387 2,869,825 25,110,969 —
State Street Institutional LiquidReserves Fund, Premier Class . — — 122,956,355 120,544,975 (237) — 2,410,902 2,411,143 46,105
State Street InstitutionalU.S. Government MoneyMarket Fund, Class G Shares . 2,012,403 2,012,403 102,679,821 104,692,224 — —* — —* 37,546
State Street Navigator SecuritiesLending Portfolio II . . . . . — — 522,176,205 153,438,689 — — 368,737,516 368,737,516 407,823
State Street Navigator SecuritiesLending Portfolio III. . . . . 251,159,946 251,159,946 472,618,174 723,778,120 — —* — —* 1,428,465
Viking Therapeutics, Inc.. . . . . 5,730,107 47,559,888 28,152,706 51,822,104 (40,315,817) —* 2,291,114 —* —
Total . . . . . . . . . . . . . $464,017,166 $1,394,696,375 $1,273,614,196 $(256,786,560) $ 20,473,990 $440,013,269 $1,919,939
(a) Does not include change in unrealized appreciation and depreciation from investments that are nolonger affiliates at period ended December 31, 2019.
* As of December 31, 2019, no longer an affiliate.
SPDR S&P BIOTECH ETFSCHEDULE OF INVESTMENTS (continued)December 31, 2019 (Unaudited)
See accompanying notes to financial statements.12
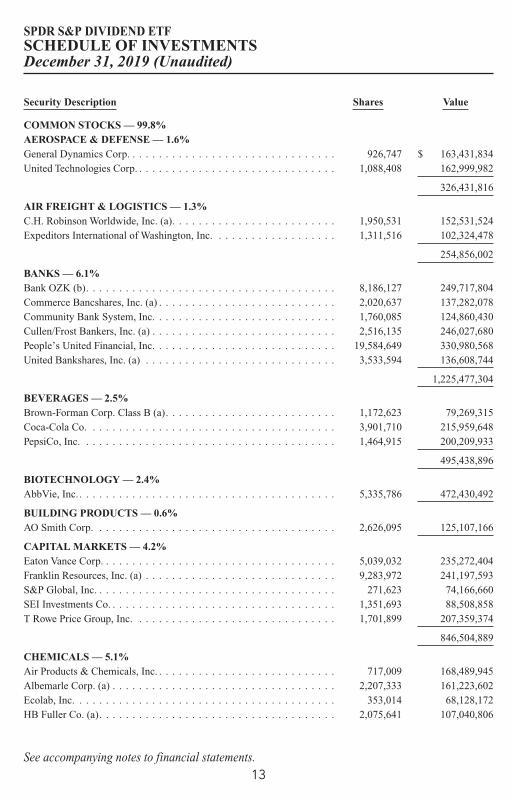
Security Description Shares Value
COMMON STOCKS — 99.8%AEROSPACE & DEFENSE — 1.6%General Dynamics Corp. . . . . . . . . . . . . . . . . . . . . . . . . . . . . . . . 926,747 $ 163,431,834United Technologies Corp. . . . . . . . . . . . . . . . . . . . . . . . . . . . . . . 1,088,408 162,999,982
326,431,816
AIR FREIGHT & LOGISTICS — 1.3%C.H. Robinson Worldwide, Inc. (a). . . . . . . . . . . . . . . . . . . . . . . . . 1,950,531 152,531,524Expeditors International of Washington, Inc. . . . . . . . . . . . . . . . . . . 1,311,516 102,324,478
254,856,002
BANKS — 6.1%Bank OZK (b). . . . . . . . . . . . . . . . . . . . . . . . . . . . . . . . . . . . . . 8,186,127 249,717,804Commerce Bancshares, Inc. (a) . . . . . . . . . . . . . . . . . . . . . . . . . . . 2,020,637 137,282,078Community Bank System, Inc. . . . . . . . . . . . . . . . . . . . . . . . . . . . 1,760,085 124,860,430Cullen/Frost Bankers, Inc. (a) . . . . . . . . . . . . . . . . . . . . . . . . . . . . 2,516,135 246,027,680People’s United Financial, Inc. . . . . . . . . . . . . . . . . . . . . . . . . . . . 19,584,649 330,980,568United Bankshares, Inc. (a) . . . . . . . . . . . . . . . . . . . . . . . . . . . . . 3,533,594 136,608,744
1,225,477,304
BEVERAGES — 2.5%Brown-Forman Corp. Class B (a). . . . . . . . . . . . . . . . . . . . . . . . . . 1,172,623 79,269,315Coca-Cola Co. . . . . . . . . . . . . . . . . . . . . . . . . . . . . . . . . . . . . . 3,901,710 215,959,648PepsiCo, Inc. . . . . . . . . . . . . . . . . . . . . . . . . . . . . . . . . . . . . . . 1,464,915 200,209,933
495,438,896
BIOTECHNOLOGY — 2.4%AbbVie, Inc. . . . . . . . . . . . . . . . . . . . . . . . . . . . . . . . . . . . . . . . 5,335,786 472,430,492
BUILDING PRODUCTS — 0.6%AO Smith Corp. . . . . . . . . . . . . . . . . . . . . . . . . . . . . . . . . . . . . 2,626,095 125,107,166
CAPITAL MARKETS — 4.2%Eaton Vance Corp. . . . . . . . . . . . . . . . . . . . . . . . . . . . . . . . . . . . 5,039,032 235,272,404Franklin Resources, Inc. (a) . . . . . . . . . . . . . . . . . . . . . . . . . . . . . 9,283,972 241,197,593S&P Global, Inc. . . . . . . . . . . . . . . . . . . . . . . . . . . . . . . . . . . . . 271,623 74,166,660SEI Investments Co. . . . . . . . . . . . . . . . . . . . . . . . . . . . . . . . . . . 1,351,693 88,508,858T Rowe Price Group, Inc. . . . . . . . . . . . . . . . . . . . . . . . . . . . . . . 1,701,899 207,359,374
846,504,889
CHEMICALS — 5.1%Air Products & Chemicals, Inc. . . . . . . . . . . . . . . . . . . . . . . . . . . . 717,009 168,489,945Albemarle Corp. (a) . . . . . . . . . . . . . . . . . . . . . . . . . . . . . . . . . . 2,207,333 161,223,602Ecolab, Inc. . . . . . . . . . . . . . . . . . . . . . . . . . . . . . . . . . . . . . . . 353,014 68,128,172HB Fuller Co. (a). . . . . . . . . . . . . . . . . . . . . . . . . . . . . . . . . . . . 2,075,641 107,040,806
SPDR S&P DIVIDEND ETFSCHEDULE OF INVESTMENTSDecember 31, 2019 (Unaudited)
See accompanying notes to financial statements.13
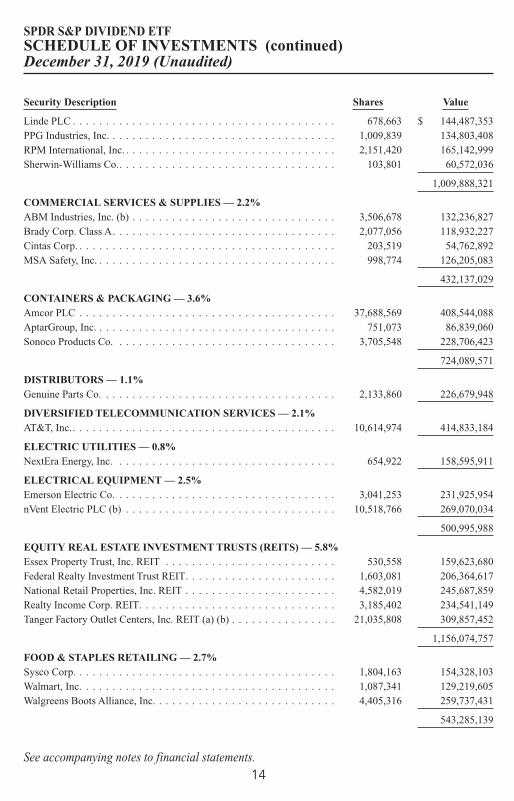
Security Description Shares Value
Linde PLC . . . . . . . . . . . . . . . . . . . . . . . . . . . . . . . . . . . . . . . . 678,663 $ 144,487,353PPG Industries, Inc. . . . . . . . . . . . . . . . . . . . . . . . . . . . . . . . . . . 1,009,839 134,803,408RPM International, Inc. . . . . . . . . . . . . . . . . . . . . . . . . . . . . . . . . 2,151,420 165,142,999Sherwin-Williams Co.. . . . . . . . . . . . . . . . . . . . . . . . . . . . . . . . . 103,801 60,572,036
1,009,888,321
COMMERCIAL SERVICES & SUPPLIES — 2.2%ABM Industries, Inc. (b) . . . . . . . . . . . . . . . . . . . . . . . . . . . . . . . 3,506,678 132,236,827Brady Corp. Class A. . . . . . . . . . . . . . . . . . . . . . . . . . . . . . . . . . 2,077,056 118,932,227Cintas Corp. . . . . . . . . . . . . . . . . . . . . . . . . . . . . . . . . . . . . . . . 203,519 54,762,892MSA Safety, Inc. . . . . . . . . . . . . . . . . . . . . . . . . . . . . . . . . . . . . 998,774 126,205,083
432,137,029
CONTAINERS & PACKAGING — 3.6%Amcor PLC . . . . . . . . . . . . . . . . . . . . . . . . . . . . . . . . . . . . . . . 37,688,569 408,544,088AptarGroup, Inc. . . . . . . . . . . . . . . . . . . . . . . . . . . . . . . . . . . . . 751,073 86,839,060Sonoco Products Co. . . . . . . . . . . . . . . . . . . . . . . . . . . . . . . . . . 3,705,548 228,706,423
724,089,571
DISTRIBUTORS — 1.1%Genuine Parts Co. . . . . . . . . . . . . . . . . . . . . . . . . . . . . . . . . . . . 2,133,860 226,679,948
DIVERSIFIED TELECOMMUNICATION SERVICES — 2.1%AT&T, Inc.. . . . . . . . . . . . . . . . . . . . . . . . . . . . . . . . . . . . . . . . 10,614,974 414,833,184
ELECTRIC UTILITIES — 0.8%NextEra Energy, Inc. . . . . . . . . . . . . . . . . . . . . . . . . . . . . . . . . . 654,922 158,595,911
ELECTRICAL EQUIPMENT — 2.5%Emerson Electric Co. . . . . . . . . . . . . . . . . . . . . . . . . . . . . . . . . . 3,041,253 231,925,954nVent Electric PLC (b) . . . . . . . . . . . . . . . . . . . . . . . . . . . . . . . . 10,518,766 269,070,034
500,995,988
EQUITY REAL ESTATE INVESTMENT TRUSTS (REITS) — 5.8%Essex Property Trust, Inc. REIT . . . . . . . . . . . . . . . . . . . . . . . . . . 530,558 159,623,680Federal Realty Investment Trust REIT. . . . . . . . . . . . . . . . . . . . . . . 1,603,081 206,364,617National Retail Properties, Inc. REIT . . . . . . . . . . . . . . . . . . . . . . . 4,582,019 245,687,859Realty Income Corp. REIT. . . . . . . . . . . . . . . . . . . . . . . . . . . . . . 3,185,402 234,541,149Tanger Factory Outlet Centers, Inc. REIT (a) (b) . . . . . . . . . . . . . . . . 21,035,808 309,857,452
1,156,074,757
FOOD & STAPLES RETAILING — 2.7%Sysco Corp. . . . . . . . . . . . . . . . . . . . . . . . . . . . . . . . . . . . . . . . 1,804,163 154,328,103Walmart, Inc. . . . . . . . . . . . . . . . . . . . . . . . . . . . . . . . . . . . . . . 1,087,341 129,219,605Walgreens Boots Alliance, Inc. . . . . . . . . . . . . . . . . . . . . . . . . . . . 4,405,316 259,737,431
543,285,139
SPDR S&P DIVIDEND ETFSCHEDULE OF INVESTMENTS (continued)December 31, 2019 (Unaudited)
See accompanying notes to financial statements.14
Security Description Shares Value
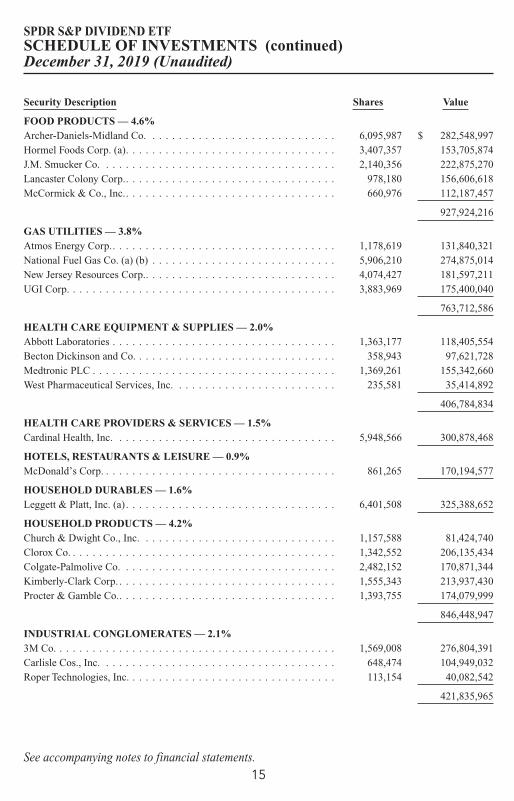
FOOD PRODUCTS — 4.6%Archer-Daniels-Midland Co. . . . . . . . . . . . . . . . . . . . . . . . . . . . . 6,095,987 $ 282,548,997Hormel Foods Corp. (a). . . . . . . . . . . . . . . . . . . . . . . . . . . . . . . . 3,407,357 153,705,874J.M. Smucker Co. . . . . . . . . . . . . . . . . . . . . . . . . . . . . . . . . . . . 2,140,356 222,875,270Lancaster Colony Corp.. . . . . . . . . . . . . . . . . . . . . . . . . . . . . . . . 978,180 156,606,618McCormick & Co., Inc.. . . . . . . . . . . . . . . . . . . . . . . . . . . . . . . . 660,976 112,187,457
927,924,216
GAS UTILITIES — 3.8%Atmos Energy Corp.. . . . . . . . . . . . . . . . . . . . . . . . . . . . . . . . . . 1,178,619 131,840,321National Fuel Gas Co. (a) (b) . . . . . . . . . . . . . . . . . . . . . . . . . . . . 5,906,210 274,875,014New Jersey Resources Corp.. . . . . . . . . . . . . . . . . . . . . . . . . . . . . 4,074,427 181,597,211UGI Corp. . . . . . . . . . . . . . . . . . . . . . . . . . . . . . . . . . . . . . . . . 3,883,969 175,400,040
763,712,586
HEALTH CARE EQUIPMENT & SUPPLIES — 2.0%Abbott Laboratories . . . . . . . . . . . . . . . . . . . . . . . . . . . . . . . . . . 1,363,177 118,405,554Becton Dickinson and Co. . . . . . . . . . . . . . . . . . . . . . . . . . . . . . . 358,943 97,621,728Medtronic PLC . . . . . . . . . . . . . . . . . . . . . . . . . . . . . . . . . . . . . 1,369,261 155,342,660West Pharmaceutical Services, Inc. . . . . . . . . . . . . . . . . . . . . . . . . 235,581 35,414,892
406,784,834
HEALTH CARE PROVIDERS & SERVICES — 1.5%Cardinal Health, Inc. . . . . . . . . . . . . . . . . . . . . . . . . . . . . . . . . . 5,948,566 300,878,468
HOTELS, RESTAURANTS & LEISURE — 0.9%McDonald’s Corp. . . . . . . . . . . . . . . . . . . . . . . . . . . . . . . . . . . . 861,265 170,194,577
HOUSEHOLD DURABLES — 1.6%Leggett & Platt, Inc. (a). . . . . . . . . . . . . . . . . . . . . . . . . . . . . . . . 6,401,508 325,388,652
HOUSEHOLD PRODUCTS — 4.2%Church & Dwight Co., Inc. . . . . . . . . . . . . . . . . . . . . . . . . . . . . . 1,157,588 81,424,740Clorox Co. . . . . . . . . . . . . . . . . . . . . . . . . . . . . . . . . . . . . . . . . 1,342,552 206,135,434Colgate-Palmolive Co. . . . . . . . . . . . . . . . . . . . . . . . . . . . . . . . . 2,482,152 170,871,344Kimberly-Clark Corp. . . . . . . . . . . . . . . . . . . . . . . . . . . . . . . . . . 1,555,343 213,937,430Procter & Gamble Co.. . . . . . . . . . . . . . . . . . . . . . . . . . . . . . . . . 1,393,755 174,079,999
846,448,947
INDUSTRIAL CONGLOMERATES — 2.1%3M Co. . . . . . . . . . . . . . . . . . . . . . . . . . . . . . . . . . . . . . . . . . . 1,569,008 276,804,391Carlisle Cos., Inc. . . . . . . . . . . . . . . . . . . . . . . . . . . . . . . . . . . . 648,474 104,949,032Roper Technologies, Inc. . . . . . . . . . . . . . . . . . . . . . . . . . . . . . . . 113,154 40,082,542
421,835,965
SPDR S&P DIVIDEND ETFSCHEDULE OF INVESTMENTS (continued)December 31, 2019 (Unaudited)
See accompanying notes to financial statements.15
Security Description Shares Value
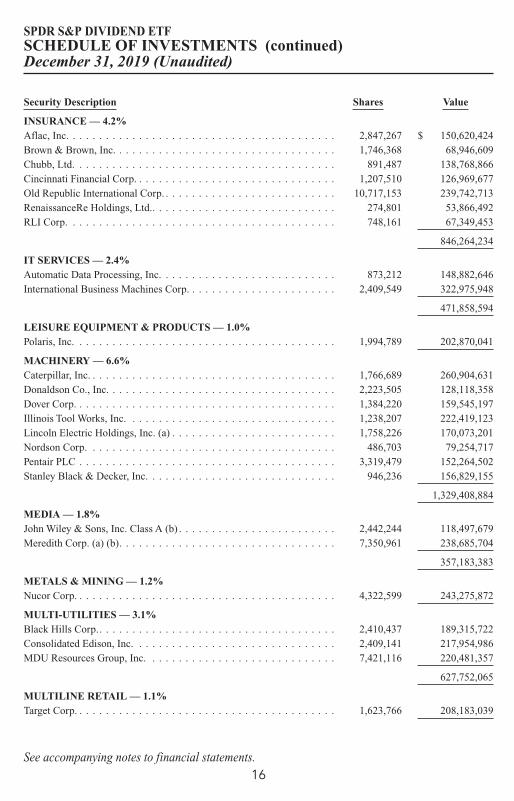
INSURANCE — 4.2%Aflac, Inc. . . . . . . . . . . . . . . . . . . . . . . . . . . . . . . . . . . . . . . . . 2,847,267 $ 150,620,424Brown & Brown, Inc. . . . . . . . . . . . . . . . . . . . . . . . . . . . . . . . . . 1,746,368 68,946,609Chubb, Ltd. . . . . . . . . . . . . . . . . . . . . . . . . . . . . . . . . . . . . . . . 891,487 138,768,866Cincinnati Financial Corp. . . . . . . . . . . . . . . . . . . . . . . . . . . . . . . 1,207,510 126,969,677Old Republic International Corp. . . . . . . . . . . . . . . . . . . . . . . . . . . 10,717,153 239,742,713RenaissanceRe Holdings, Ltd.. . . . . . . . . . . . . . . . . . . . . . . . . . . . 274,801 53,866,492RLI Corp. . . . . . . . . . . . . . . . . . . . . . . . . . . . . . . . . . . . . . . . . 748,161 67,349,453
846,264,234
IT SERVICES — 2.4%Automatic Data Processing, Inc. . . . . . . . . . . . . . . . . . . . . . . . . . . 873,212 148,882,646International Business Machines Corp. . . . . . . . . . . . . . . . . . . . . . . 2,409,549 322,975,948
471,858,594
LEISURE EQUIPMENT & PRODUCTS — 1.0%Polaris, Inc. . . . . . . . . . . . . . . . . . . . . . . . . . . . . . . . . . . . . . . . 1,994,789 202,870,041
MACHINERY — 6.6%Caterpillar, Inc. . . . . . . . . . . . . . . . . . . . . . . . . . . . . . . . . . . . . . 1,766,689 260,904,631Donaldson Co., Inc. . . . . . . . . . . . . . . . . . . . . . . . . . . . . . . . . . . 2,223,505 128,118,358Dover Corp. . . . . . . . . . . . . . . . . . . . . . . . . . . . . . . . . . . . . . . . 1,384,220 159,545,197Illinois Tool Works, Inc. . . . . . . . . . . . . . . . . . . . . . . . . . . . . . . . 1,238,207 222,419,123Lincoln Electric Holdings, Inc. (a) . . . . . . . . . . . . . . . . . . . . . . . . . 1,758,226 170,073,201Nordson Corp. . . . . . . . . . . . . . . . . . . . . . . . . . . . . . . . . . . . . . 486,703 79,254,717Pentair PLC . . . . . . . . . . . . . . . . . . . . . . . . . . . . . . . . . . . . . . . 3,319,479 152,264,502Stanley Black & Decker, Inc. . . . . . . . . . . . . . . . . . . . . . . . . . . . . 946,236 156,829,155
1,329,408,884
MEDIA — 1.8%John Wiley & Sons, Inc. Class A (b) . . . . . . . . . . . . . . . . . . . . . . . . 2,442,244 118,497,679Meredith Corp. (a) (b). . . . . . . . . . . . . . . . . . . . . . . . . . . . . . . . . 7,350,961 238,685,704
357,183,383
METALS & MINING — 1.2%Nucor Corp. . . . . . . . . . . . . . . . . . . . . . . . . . . . . . . . . . . . . . . . 4,322,599 243,275,872
MULTI-UTILITIES — 3.1%Black Hills Corp.. . . . . . . . . . . . . . . . . . . . . . . . . . . . . . . . . . . . 2,410,437 189,315,722Consolidated Edison, Inc. . . . . . . . . . . . . . . . . . . . . . . . . . . . . . . 2,409,141 217,954,986MDU Resources Group, Inc. . . . . . . . . . . . . . . . . . . . . . . . . . . . . 7,421,116 220,481,357
627,752,065
MULTILINE RETAIL — 1.1%Target Corp. . . . . . . . . . . . . . . . . . . . . . . . . . . . . . . . . . . . . . . . 1,623,766 208,183,039
SPDR S&P DIVIDEND ETFSCHEDULE OF INVESTMENTS (continued)December 31, 2019 (Unaudited)
See accompanying notes to financial statements.16
Security Description Shares Value
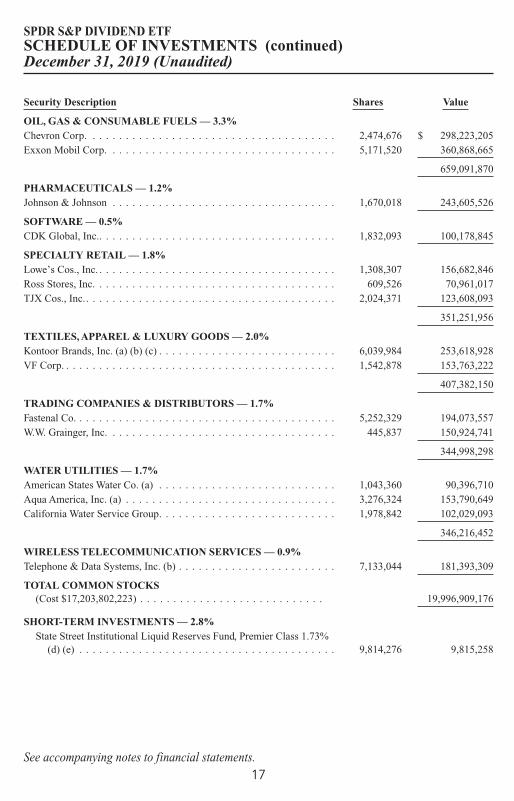
OIL, GAS & CONSUMABLE FUELS — 3.3%Chevron Corp. . . . . . . . . . . . . . . . . . . . . . . . . . . . . . . . . . . . . . 2,474,676 $ 298,223,205Exxon Mobil Corp. . . . . . . . . . . . . . . . . . . . . . . . . . . . . . . . . . . 5,171,520 360,868,665
659,091,870
PHARMACEUTICALS — 1.2%Johnson & Johnson . . . . . . . . . . . . . . . . . . . . . . . . . . . . . . . . . . 1,670,018 243,605,526
SOFTWARE — 0.5%CDK Global, Inc.. . . . . . . . . . . . . . . . . . . . . . . . . . . . . . . . . . . . 1,832,093 100,178,845
SPECIALTY RETAIL — 1.8%Lowe’s Cos., Inc. . . . . . . . . . . . . . . . . . . . . . . . . . . . . . . . . . . . . 1,308,307 156,682,846Ross Stores, Inc. . . . . . . . . . . . . . . . . . . . . . . . . . . . . . . . . . . . . 609,526 70,961,017TJX Cos., Inc.. . . . . . . . . . . . . . . . . . . . . . . . . . . . . . . . . . . . . . 2,024,371 123,608,093
351,251,956
TEXTILES, APPAREL & LUXURY GOODS — 2.0%Kontoor Brands, Inc. (a) (b) (c) . . . . . . . . . . . . . . . . . . . . . . . . . . . 6,039,984 253,618,928VF Corp. . . . . . . . . . . . . . . . . . . . . . . . . . . . . . . . . . . . . . . . . . 1,542,878 153,763,222
407,382,150
TRADING COMPANIES & DISTRIBUTORS — 1.7%Fastenal Co. . . . . . . . . . . . . . . . . . . . . . . . . . . . . . . . . . . . . . . . 5,252,329 194,073,557W.W. Grainger, Inc. . . . . . . . . . . . . . . . . . . . . . . . . . . . . . . . . . . 445,837 150,924,741
344,998,298
WATER UTILITIES — 1.7%American States Water Co. (a) . . . . . . . . . . . . . . . . . . . . . . . . . . . 1,043,360 90,396,710Aqua America, Inc. (a) . . . . . . . . . . . . . . . . . . . . . . . . . . . . . . . . 3,276,324 153,790,649California Water Service Group. . . . . . . . . . . . . . . . . . . . . . . . . . . 1,978,842 102,029,093
346,216,452
WIRELESS TELECOMMUNICATION SERVICES — 0.9%Telephone & Data Systems, Inc. (b) . . . . . . . . . . . . . . . . . . . . . . . . 7,133,044 181,393,309
TOTAL COMMON STOCKS(Cost $17,203,802,223) . . . . . . . . . . . . . . . . . . . . . . . . . . . . 19,996,909,176
SHORT-TERM INVESTMENTS — 2.8%State Street Institutional Liquid Reserves Fund, Premier Class 1.73%
(d) (e) . . . . . . . . . . . . . . . . . . . . . . . . . . . . . . . . . . . . . . . 9,814,276 9,815,258
SPDR S&P DIVIDEND ETFSCHEDULE OF INVESTMENTS (continued)December 31, 2019 (Unaudited)
See accompanying notes to financial statements.17
Security Description Shares Value
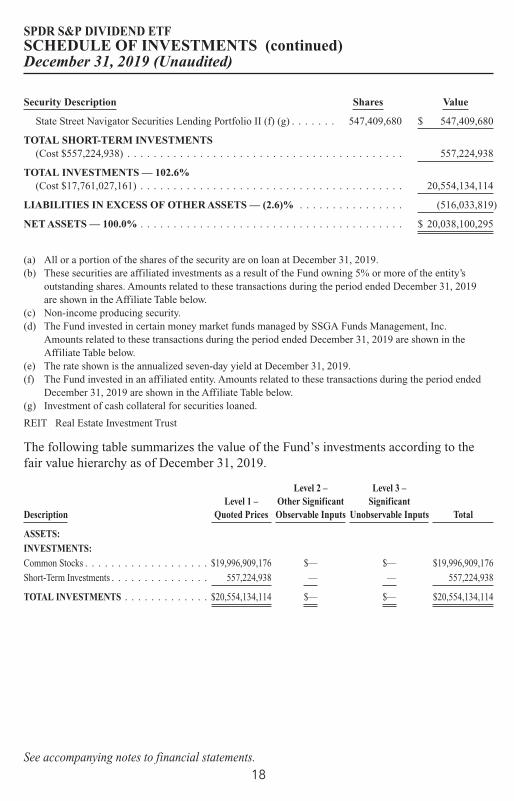
State Street Navigator Securities Lending Portfolio II (f) (g) . . . . . . . 547,409,680 $ 547,409,680
TOTAL SHORT-TERM INVESTMENTS(Cost $557,224,938) . . . . . . . . . . . . . . . . . . . . . . . . . . . . . . . . . . . . . . . . . . 557,224,938
TOTAL INVESTMENTS — 102.6%(Cost $17,761,027,161) . . . . . . . . . . . . . . . . . . . . . . . . . . . . . . . . . . . . . . . . 20,554,134,114
LIABILITIES IN EXCESS OF OTHER ASSETS — (2.6)% . . . . . . . . . . . . . . . . (516,033,819)
NET ASSETS — 100.0% . . . . . . . . . . . . . . . . . . . . . . . . . . . . . . . . . . . . . . . . $ 20,038,100,295
(a) All or a portion of the shares of the security are on loan at December 31, 2019.(b) These securities are affiliated investments as a result of the Fund owning 5% or more of the entity’s
outstanding shares. Amounts related to these transactions during the period ended December 31, 2019are shown in the Affiliate Table below.
(c) Non-income producing security.(d) The Fund invested in certain money market funds managed by SSGA Funds Management, Inc.
Amounts related to these transactions during the period ended December 31, 2019 are shown in theAffiliate Table below.
(e) The rate shown is the annualized seven-day yield at December 31, 2019.(f) The Fund invested in an affiliated entity. Amounts related to these transactions during the period ended
December 31, 2019 are shown in the Affiliate Table below.(g) Investment of cash collateral for securities loaned.
REIT Real Estate Investment Trust
The following table summarizes the value of the Fund’s investments according to thefair value hierarchy as of December 31, 2019.
DescriptionLevel 1 –
Quoted Prices
Level 2 –Other SignificantObservable Inputs
Level 3 –Significant
Unobservable Inputs Total
ASSETS:INVESTMENTS:Common Stocks . . . . . . . . . . . . . . . . . . . $19,996,909,176 $— $— $19,996,909,176
Short-Term Investments . . . . . . . . . . . . . . . 557,224,938 — — 557,224,938
TOTAL INVESTMENTS . . . . . . . . . . . . . $20,554,134,114 $— $— $20,554,134,114
SPDR S&P DIVIDEND ETFSCHEDULE OF INVESTMENTS (continued)December 31, 2019 (Unaudited)
See accompanying notes to financial statements.18
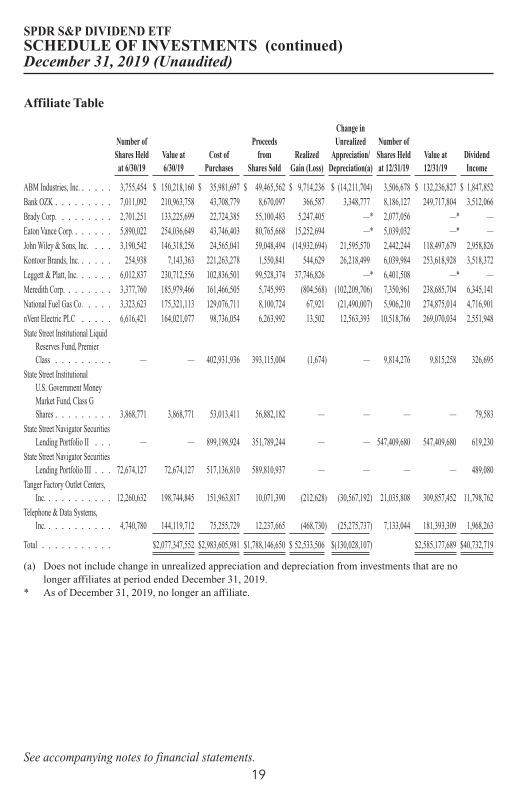
Affiliate Table
Number ofShares Held
at 6/30/19Value at6/30/19
Cost ofPurchases
Proceedsfrom
Shares SoldRealized
Gain (Loss)
Change inUnrealized
Appreciation/Depreciation(a)
Number ofShares Heldat 12/31/19
Value at12/31/19
DividendIncome
ABM Industries, Inc. . . . . . 3,755,454 $ 150,218,160 $ 35,981,697 $ 49,465,562 $ 9,714,236 $ (14,211,704) 3,506,678 $ 132,236,827 $ 1,847,852
Bank OZK . . . . . . . . . 7,011,092 210,963,758 43,708,779 8,670,097 366,587 3,348,777 8,186,127 249,717,804 3,512,066
Brady Corp. . . . . . . . . 2,701,251 133,225,699 22,724,385 55,100,483 5,247,405 —* 2,077,056 —* —
Eaton Vance Corp. . . . . . . 5,890,022 254,036,649 43,746,403 80,765,668 15,252,694 —* 5,039,032 —* —
John Wiley & Sons, Inc. . . . 3,190,542 146,318,256 24,565,041 59,048,494 (14,932,694) 21,595,570 2,442,244 118,497,679 2,958,826
Kontoor Brands, Inc. . . . . . 254,938 7,143,363 221,263,278 1,550,841 544,629 26,218,499 6,039,984 253,618,928 3,518,372
Leggett & Platt, Inc. . . . . . 6,012,837 230,712,556 102,836,501 99,528,374 37,746,826 —* 6,401,508 —* —
Meredith Corp. . . . . . . . 3,377,760 185,979,466 161,466,505 5,745,993 (804,568) (102,209,706) 7,350,961 238,685,704 6,345,141
National Fuel Gas Co. . . . . 3,323,623 175,321,113 129,076,711 8,100,724 67,921 (21,490,007) 5,906,210 274,875,014 4,716,901
nVent Electric PLC . . . . . 6,616,421 164,021,077 98,736,054 6,263,992 13,502 12,563,393 10,518,766 269,070,034 2,551,948
State Street Institutional LiquidReserves Fund, PremierClass . . . . . . . . . — — 402,931,936 393,115,004 (1,674) — 9,814,276 9,815,258 326,695
State Street InstitutionalU.S. Government MoneyMarket Fund, Class GShares . . . . . . . . . 3,868,771 3,868,771 53,013,411 56,882,182 — — — — 79,583
State Street Navigator SecuritiesLending Portfolio II . . . — — 899,198,924 351,789,244 — — 547,409,680 547,409,680 619,230
State Street Navigator SecuritiesLending Portfolio III . . . 72,674,127 72,674,127 517,136,810 589,810,937 — — — — 489,080
Tanger Factory Outlet Centers,Inc. . . . . . . . . . . 12,260,632 198,744,845 151,963,817 10,071,390 (212,628) (30,567,192) 21,035,808 309,857,452 11,798,762
Telephone & Data Systems,Inc. . . . . . . . . . . 4,740,780 144,119,712 75,255,729 12,237,665 (468,730) (25,275,737) 7,133,044 181,393,309 1,968,263
Total . . . . . . . . . . . $2,077,347,552 $2,983,605,981 $1,788,146,650 $ 52,533,506 $(130,028,107) $2,585,177,689 $40,732,719
(a) Does not include change in unrealized appreciation and depreciation from investments that are nolonger affiliates at period ended December 31, 2019.
* As of December 31, 2019, no longer an affiliate.
SPDR S&P DIVIDEND ETFSCHEDULE OF INVESTMENTS (continued)December 31, 2019 (Unaudited)
See accompanying notes to financial statements.19

SPDR Dow JonesREIT ETF
SPDR S&PBiotech ETF
SPDR S&PDividend ETF
ASSETSInvestments in unaffiliated issuers, at
value* . . . . . . . . . . . . . . . . . . . . . . $2,548,004,722 $ 4,333,212,442 $17,968,956,425Investments in affiliated issuers, at
value . . . . . . . . . . . . . . . . . . . . . . . 46,763,498 440,013,269 2,585,177,689
Total Investments . . . . . . . . . . . . . . 2,594,768,220 4,773,225,711 20,554,134,114Cash . . . . . . . . . . . . . . . . . . . . . . . . . — 46,249,215 134Receivable for fund shares sold . . . . . . — 642,264 3,406Dividends receivable — unaffiliated
issuers . . . . . . . . . . . . . . . . . . . . . . 11,874,617 — 35,192,395Dividends receivable — affiliated
issuers . . . . . . . . . . . . . . . . . . . . . . 6,776 23,394 1,593,149Securities lending income receivable
— unaffiliated issuers . . . . . . . . . . . 8,357 98,095 151,088Securities lending income receivable
— affiliated issuers . . . . . . . . . . . . . 23,542 217,901 354,631Other Receivable . . . . . . . . . . . . . . . . — 386 —
TOTAL ASSETS . . . . . . . . . . . . 2,606,681,512 4,820,456,966 20,591,428,917
LIABILITIESPayable upon return of securities
loaned . . . . . . . . . . . . . . . . . . . . . . 41,053,513 368,737,516 547,409,680Payable for investments purchased. . . . 4,912,015 46,237,326 —Advisory fee payable . . . . . . . . . . . . . 550,388 1,318,214 5,884,319Trustees’ fees and expenses payable. . . 7,014 11,403 34,623
TOTAL LIABILITIES . . . . . . . 46,522,930 416,304,459 553,328,622
NET ASSETS . . . . . . . . . . . . . . $2,560,158,582 $ 4,404,152,507 $20,038,100,295
NET ASSETS CONSIST OF:Paid-in Capital. . . . . . . . . . . . . . . . . . $2,470,878,182 $ 7,535,797,145 $17,435,665,995Total distributable earnings (loss) . . . . 89,280,400 (3,131,644,638) 2,602,434,300
NET ASSETS . . . . . . . . . . . . . . $2,560,158,582 $ 4,404,152,507 $20,038,100,295
NET ASSET VALUE PER SHARENet asset value per share. . . . . . . . . . . $ 102.07 $ 95.22 $ 107.59
Shares outstanding (unlimited amountauthorized, $0.01 par value) . . . . . . . 25,081,617 46,250,000 186,253,658
COST OF INVESTMENTS:Investments in unaffiliated issuers . . . . $2,409,946,728 $ 4,704,115,051 $14,886,422,631Investments in affiliated issuers. . . . . . 46,763,498 489,045,217 2,874,604,530
Total cost of investments. . . . . . . . . . . $2,456,710,226 $ 5,193,160,268 $17,761,027,161
* Includes investments in securities onloan, at value . . . . . . . . . . . . . . . . . $ 119,379,581 $ 1,277,941,830 $ 1,200,933,789
SPDR SERIES TRUSTSTATEMENTS OF ASSETS AND LIABILITIESDecember 31, 2019 (Unaudited)
See accompanying notes to financial statements.20
SPDR Dow JonesREIT ETF
SPDR S&PBiotech ETF
SPDR S&PDividend ETF
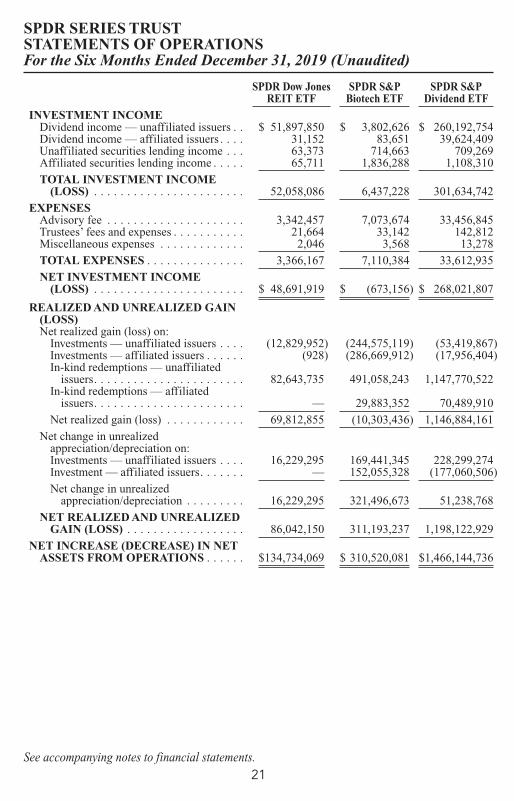
INVESTMENT INCOMEDividend income — unaffiliated issuers . . $ 51,897,850 $ 3,802,626 $ 260,192,754Dividend income — affiliated issuers . . . . 31,152 83,651 39,624,409Unaffiliated securities lending income . . . 63,373 714,663 709,269Affiliated securities lending income . . . . . 65,711 1,836,288 1,108,310
TOTAL INVESTMENT INCOME(LOSS) . . . . . . . . . . . . . . . . . . . . . . . 52,058,086 6,437,228 301,634,742
EXPENSESAdvisory fee . . . . . . . . . . . . . . . . . . . . . 3,342,457 7,073,674 33,456,845Trustees’ fees and expenses . . . . . . . . . . . 21,664 33,142 142,812Miscellaneous expenses . . . . . . . . . . . . . 2,046 3,568 13,278
TOTAL EXPENSES . . . . . . . . . . . . . . . 3,366,167 7,110,384 33,612,935
NET INVESTMENT INCOME(LOSS) . . . . . . . . . . . . . . . . . . . . . . . $ 48,691,919 $ (673,156) $ 268,021,807
REALIZED AND UNREALIZED GAIN(LOSS)Net realized gain (loss) on:
Investments — unaffiliated issuers . . . . (12,829,952) (244,575,119) (53,419,867)Investments — affiliated issuers . . . . . . (928) (286,669,912) (17,956,404)In-kind redemptions — unaffiliated
issuers. . . . . . . . . . . . . . . . . . . . . . . 82,643,735 491,058,243 1,147,770,522In-kind redemptions — affiliated
issuers. . . . . . . . . . . . . . . . . . . . . . . — 29,883,352 70,489,910
Net realized gain (loss) . . . . . . . . . . . . 69,812,855 (10,303,436) 1,146,884,161
Net change in unrealizedappreciation/depreciation on:Investments — unaffiliated issuers . . . . 16,229,295 169,441,345 228,299,274Investment — affiliated issuers. . . . . . . — 152,055,328 (177,060,506)
Net change in unrealizedappreciation/depreciation . . . . . . . . . 16,229,295 321,496,673 51,238,768
NET REALIZED AND UNREALIZEDGAIN (LOSS) . . . . . . . . . . . . . . . . . . 86,042,150 311,193,237 1,198,122,929
NET INCREASE (DECREASE) IN NETASSETS FROM OPERATIONS . . . . . . $134,734,069 $ 310,520,081 $1,466,144,736
SPDR SERIES TRUSTSTATEMENTS OF OPERATIONSFor the Six Months Ended December 31, 2019 (Unaudited)
See accompanying notes to financial statements.21
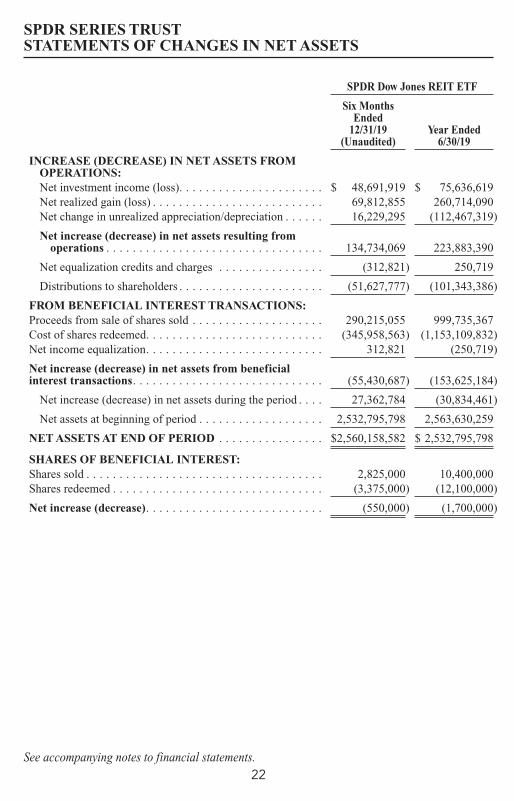
SPDR Dow Jones REIT ETF
Six MonthsEnded
12/31/19(Unaudited)
Year Ended6/30/19
INCREASE (DECREASE) IN NET ASSETS FROMOPERATIONS:Net investment income (loss). . . . . . . . . . . . . . . . . . . . . . $ 48,691,919 $ 75,636,619Net realized gain (loss) . . . . . . . . . . . . . . . . . . . . . . . . . . 69,812,855 260,714,090Net change in unrealized appreciation/depreciation . . . . . . 16,229,295 (112,467,319)
Net increase (decrease) in net assets resulting fromoperations . . . . . . . . . . . . . . . . . . . . . . . . . . . . . . . . . 134,734,069 223,883,390
Net equalization credits and charges . . . . . . . . . . . . . . . . (312,821) 250,719
Distributions to shareholders . . . . . . . . . . . . . . . . . . . . . . (51,627,777) (101,343,386)
FROM BENEFICIAL INTEREST TRANSACTIONS:Proceeds from sale of shares sold . . . . . . . . . . . . . . . . . . . . 290,215,055 999,735,367Cost of shares redeemed. . . . . . . . . . . . . . . . . . . . . . . . . . . (345,958,563) (1,153,109,832)Net income equalization. . . . . . . . . . . . . . . . . . . . . . . . . . . 312,821 (250,719)
Net increase (decrease) in net assets from beneficialinterest transactions. . . . . . . . . . . . . . . . . . . . . . . . . . . . . (55,430,687) (153,625,184)
Net increase (decrease) in net assets during the period . . . . 27,362,784 (30,834,461)
Net assets at beginning of period . . . . . . . . . . . . . . . . . . . 2,532,795,798 2,563,630,259
NET ASSETS AT END OF PERIOD . . . . . . . . . . . . . . . . $2,560,158,582 $ 2,532,795,798
SHARES OF BENEFICIAL INTEREST:Shares sold . . . . . . . . . . . . . . . . . . . . . . . . . . . . . . . . . . . . 2,825,000 10,400,000Shares redeemed . . . . . . . . . . . . . . . . . . . . . . . . . . . . . . . . (3,375,000) (12,100,000)
Net increase (decrease). . . . . . . . . . . . . . . . . . . . . . . . . . . (550,000) (1,700,000)
SPDR SERIES TRUSTSTATEMENTS OF CHANGES IN NET ASSETS
See accompanying notes to financial statements.22
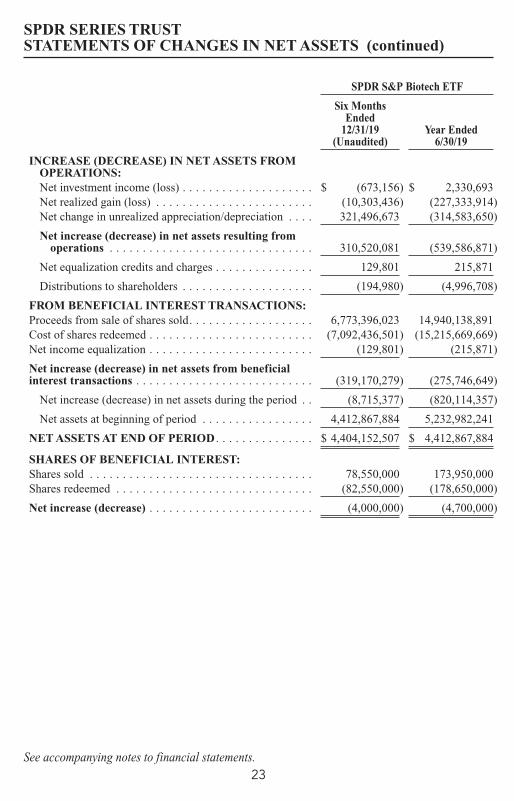
SPDR S&P Biotech ETF
Six MonthsEnded
12/31/19(Unaudited)
Year Ended6/30/19
INCREASE (DECREASE) IN NET ASSETS FROMOPERATIONS:Net investment income (loss) . . . . . . . . . . . . . . . . . . . . $ (673,156) $ 2,330,693Net realized gain (loss) . . . . . . . . . . . . . . . . . . . . . . . . (10,303,436) (227,333,914)Net change in unrealized appreciation/depreciation . . . . 321,496,673 (314,583,650)
Net increase (decrease) in net assets resulting fromoperations . . . . . . . . . . . . . . . . . . . . . . . . . . . . . . . 310,520,081 (539,586,871)
Net equalization credits and charges . . . . . . . . . . . . . . . 129,801 215,871
Distributions to shareholders . . . . . . . . . . . . . . . . . . . . (194,980) (4,996,708)
FROM BENEFICIAL INTEREST TRANSACTIONS:Proceeds from sale of shares sold. . . . . . . . . . . . . . . . . . . 6,773,396,023 14,940,138,891Cost of shares redeemed . . . . . . . . . . . . . . . . . . . . . . . . . (7,092,436,501) (15,215,669,669)Net income equalization . . . . . . . . . . . . . . . . . . . . . . . . . (129,801) (215,871)
Net increase (decrease) in net assets from beneficialinterest transactions . . . . . . . . . . . . . . . . . . . . . . . . . . . (319,170,279) (275,746,649)
Net increase (decrease) in net assets during the period . . (8,715,377) (820,114,357)
Net assets at beginning of period . . . . . . . . . . . . . . . . . 4,412,867,884 5,232,982,241
NET ASSETS AT END OF PERIOD . . . . . . . . . . . . . . . $ 4,404,152,507 $ 4,412,867,884
SHARES OF BENEFICIAL INTEREST:Shares sold . . . . . . . . . . . . . . . . . . . . . . . . . . . . . . . . . . 78,550,000 173,950,000Shares redeemed . . . . . . . . . . . . . . . . . . . . . . . . . . . . . . (82,550,000) (178,650,000)
Net increase (decrease) . . . . . . . . . . . . . . . . . . . . . . . . . (4,000,000) (4,700,000)
SPDR SERIES TRUSTSTATEMENTS OF CHANGES IN NET ASSETS (continued)
See accompanying notes to financial statements.23

SPDR S&P Dividend ETF
Six MonthsEnded
12/31/19(Unaudited)
Year Ended6/30/19
INCREASE (DECREASE) IN NET ASSETS FROMOPERATIONS:Net investment income (loss) . . . . . . . . . . . . . . . . . . . . $ 268,021,807 $ 424,527,653Net realized gain (loss). . . . . . . . . . . . . . . . . . . . . . . . . 1,146,884,161 1,656,443,637Net change in unrealized appreciation/depreciation. . . . . 51,238,768 (65,735,810)
Net increase (decrease) in net assets resulting fromoperations . . . . . . . . . . . . . . . . . . . . . . . . . . . . . . . . 1,466,144,736 2,015,235,480
Net equalization credits and charges . . . . . . . . . . . . . . . (447,381) 3,640,194
Distributions to shareholders. . . . . . . . . . . . . . . . . . . . . (275,189,856) (431,641,309)
FROM BENEFICIAL INTEREST TRANSACTIONS:Proceeds from sale of shares sold . . . . . . . . . . . . . . . . . . . 3,536,476,196 6,965,569,606Cost of shares redeemed . . . . . . . . . . . . . . . . . . . . . . . . . (3,387,359,539) (5,203,085,444)Net income equalization . . . . . . . . . . . . . . . . . . . . . . . . . 447,381 (3,640,194)
Net increase (decrease) in net assets from beneficialinterest transactions . . . . . . . . . . . . . . . . . . . . . . . . . . . 149,564,038 1,758,843,968
Net increase (decrease) in net assets during the period. . . 1,340,071,537 3,346,078,333
Net assets at beginning of period . . . . . . . . . . . . . . . . . . 18,698,028,758 15,351,950,425
NET ASSETS AT END OF PERIOD . . . . . . . . . . . . . . . $20,038,100,295 $18,698,028,758
SHARES OF BENEFICIAL INTEREST:Shares sold . . . . . . . . . . . . . . . . . . . . . . . . . . . . . . . . . . . 34,000,000 73,400,000Shares redeemed . . . . . . . . . . . . . . . . . . . . . . . . . . . . . . . (32,950,000) (53,900,000)
Net increase (decrease) . . . . . . . . . . . . . . . . . . . . . . . . . 1,050,000 19,500,000
SPDR SERIES TRUSTSTATEMENTS OF CHANGES IN NET ASSETS (continued)
See accompanying notes to financial statements.24
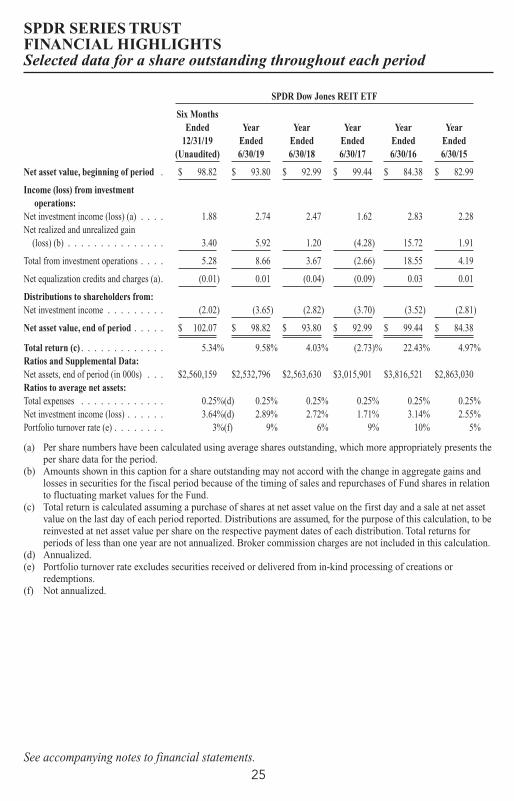
SPDR Dow Jones REIT ETF
Six MonthsEnded
12/31/19(Unaudited)
YearEnded6/30/19
YearEnded6/30/18
YearEnded6/30/17
YearEnded6/30/16
YearEnded6/30/15
Net asset value, beginning of period . $ 98.82 $ 93.80 $ 92.99 $ 99.44 $ 84.38 $ 82.99
Income (loss) from investmentoperations:
Net investment income (loss) (a) . . . . 1.88 2.74 2.47 1.62 2.83 2.28Net realized and unrealized gain
(loss) (b) . . . . . . . . . . . . . . . 3.40 5.92 1.20 (4.28) 15.72 1.91
Total from investment operations . . . . 5.28 8.66 3.67 (2.66) 18.55 4.19
Net equalization credits and charges (a). (0.01) 0.01 (0.04) (0.09) 0.03 0.01
Distributions to shareholders from:Net investment income . . . . . . . . . (2.02) (3.65) (2.82) (3.70) (3.52) (2.81)
Net asset value, end of period . . . . . $ 102.07 $ 98.82 $ 93.80 $ 92.99 $ 99.44 $ 84.38
Total return (c) . . . . . . . . . . . . . 5.34% 9.58% 4.03% (2.73)% 22.43% 4.97%Ratios and Supplemental Data:Net assets, end of period (in 000s) . . . $2,560,159 $2,532,796 $2,563,630 $3,015,901 $3,816,521 $2,863,030Ratios to average net assets:Total expenses . . . . . . . . . . . . . 0.25%(d) 0.25% 0.25% 0.25% 0.25% 0.25%Net investment income (loss) . . . . . . 3.64%(d) 2.89% 2.72% 1.71% 3.14% 2.55%Portfolio turnover rate (e) . . . . . . . . 3%(f) 9% 6% 9% 10% 5%
(a) Per share numbers have been calculated using average shares outstanding, which more appropriately presents theper share data for the period.
(b) Amounts shown in this caption for a share outstanding may not accord with the change in aggregate gains andlosses in securities for the fiscal period because of the timing of sales and repurchases of Fund shares in relationto fluctuating market values for the Fund.
(c) Total return is calculated assuming a purchase of shares at net asset value on the first day and a sale at net assetvalue on the last day of each period reported. Distributions are assumed, for the purpose of this calculation, to bereinvested at net asset value per share on the respective payment dates of each distribution. Total returns forperiods of less than one year are not annualized. Broker commission charges are not included in this calculation.
(d) Annualized.(e) Portfolio turnover rate excludes securities received or delivered from in-kind processing of creations or
redemptions.(f) Not annualized.
SPDR SERIES TRUSTFINANCIAL HIGHLIGHTSSelected data for a share outstanding throughout each period
See accompanying notes to financial statements.25

SPDR S&P Biotech ETF
Six MonthsEnded
12/31/19(Unaudited)
YearEnded6/30/19
YearEnded6/30/18
YearEnded6/30/17
YearEnded
6/30/16(a)
YearEnded
6/30/15(a)
Net asset value, beginning of period . $ 87.82 $ 95.23 $ 77.15 $ 54.16 $ 84.11 $ 51.33
Income (loss) from investmentoperations:
Net investment income (loss) (b) . . . . (0.01) 0.04 0.20 0.20 0.29 0.52Net realized and unrealized gain
(loss) (c) . . . . . . . . . . . . . . . 7.41 (7.37) 18.06 22.97 (29.93) 32.83
Total from investment operations . . . . 7.40 (7.33) 18.26 23.17 (29.64) 33.35
Net equalization credits andcharges (b) . . . . . . . . . . . . . . 0.00(d) 0.00(d) 0.01 (0.00)(d) (0.01) 0.01
Distributions to shareholders from:Net investment income . . . . . . . . . (0.00)(d) (0.08) (0.19) (0.18) (0.30) (0.58)
Net asset value, end of period . . . . . $ 95.22 $ 87.82 $ 95.23 $ 77.15 $ 54.16 $ 84.11
Total return (e) . . . . . . . . . . . . . 8.44% (7.70)% 23.69% 42.80% (35.30)% 65.37%Ratios and Supplemental Data:Net assets, end of period (in 000s) . . . $4,404,153 $4,412,868 $5,232,982 $3,548,969 $1,873,833 $2,750,480Ratios to average net assets:Total expenses . . . . . . . . . . . . . 0.35%(f) 0.35% 0.35% 0.35% 0.35% 0.35%Net investment income (loss) . . . . . . (0.03)%(f) 0.05% 0.23% 0.30% 0.45% 0.81%Portfolio turnover rate (g) . . . . . . . . 32%(h) 45% 62% 59% 75% 78%
(a) On September 8, 2015, the SPDR S&P Biotech ETF underwent a 3-for-1 share split. The per share datapresented here have been retroactively adjusted to reflect this split.
(b) Per share numbers have been calculated using average shares outstanding, which more appropriately presents theper share data for the period.
(c) Amounts shown in this caption for a share outstanding may not accord with the change in aggregate gains andlosses in securities for the fiscal period because of the timing of sales and repurchases of Fund shares in relationto fluctuating market values for the Fund.
(d) Amount is less than $0.005 per share.(e) Total return is calculated assuming a purchase of shares at net asset value on the first day and a sale at net asset
value on the last day of each period reported. Distributions are assumed, for the purpose of this calculation, to bereinvested at net asset value per share on the respective payment dates of each distribution. Total returns forperiods of less than one year are not annualized. Broker commission charges are not included in this calculation.
(f) Annualized.(g) Portfolio turnover rate excludes securities received or delivered from in-kind processing of creations or
redemptions.(h) Not annualized.
SPDR SERIES TRUSTFINANCIAL HIGHLIGHTS (continued)Selected data for a share outstanding throughout each period
See accompanying notes to financial statements.26
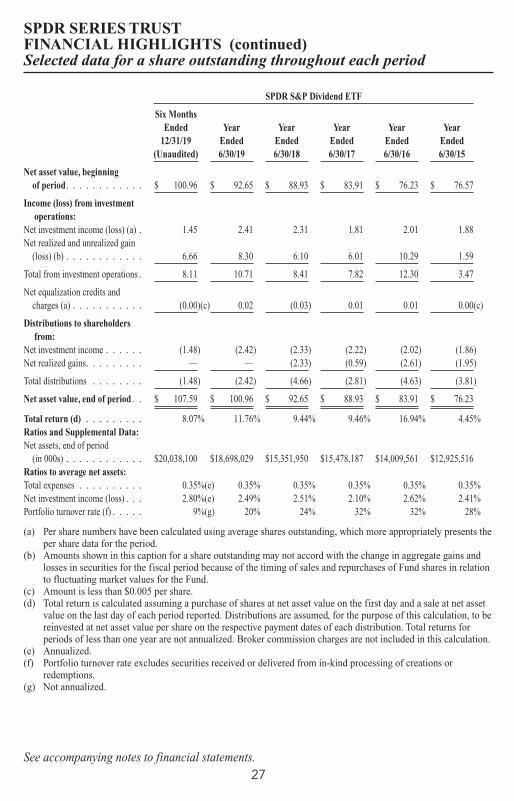
SPDR S&P Dividend ETF
Six MonthsEnded
12/31/19(Unaudited)
YearEnded6/30/19
YearEnded6/30/18
YearEnded6/30/17
YearEnded6/30/16
YearEnded6/30/15
Net asset value, beginningof period. . . . . . . . . . . . $ 100.96 $ 92.65 $ 88.93 $ 83.91 $ 76.23 $ 76.57
Income (loss) from investmentoperations:
Net investment income (loss) (a) . 1.45 2.41 2.31 1.81 2.01 1.88Net realized and unrealized gain
(loss) (b) . . . . . . . . . . . . 6.66 8.30 6.10 6.01 10.29 1.59
Total from investment operations . 8.11 10.71 8.41 7.82 12.30 3.47
Net equalization credits andcharges (a) . . . . . . . . . . . (0.00)(c) 0.02 (0.03) 0.01 0.01 0.00(c)
Distributions to shareholdersfrom:
Net investment income . . . . . . (1.48) (2.42) (2.33) (2.22) (2.02) (1.86)Net realized gains. . . . . . . . . — — (2.33) (0.59) (2.61) (1.95)
Total distributions . . . . . . . . (1.48) (2.42) (4.66) (2.81) (4.63) (3.81)
Net asset value, end of period . . $ 107.59 $ 100.96 $ 92.65 $ 88.93 $ 83.91 $ 76.23
Total return (d) . . . . . . . . . 8.07% 11.76% 9.44% 9.46% 16.94% 4.45%Ratios and Supplemental Data:Net assets, end of period
(in 000s) . . . . . . . . . . . . $20,038,100 $18,698,029 $15,351,950 $15,478,187 $14,009,561 $12,925,516Ratios to average net assets:Total expenses . . . . . . . . . . 0.35%(e) 0.35% 0.35% 0.35% 0.35% 0.35%Net investment income (loss) . . . 2.80%(e) 2.49% 2.51% 2.10% 2.62% 2.41%Portfolio turnover rate (f) . . . . . 9%(g) 20% 24% 32% 32% 28%
(a) Per share numbers have been calculated using average shares outstanding, which more appropriately presents theper share data for the period.
(b) Amounts shown in this caption for a share outstanding may not accord with the change in aggregate gains andlosses in securities for the fiscal period because of the timing of sales and repurchases of Fund shares in relationto fluctuating market values for the Fund.
(c) Amount is less than $0.005 per share.(d) Total return is calculated assuming a purchase of shares at net asset value on the first day and a sale at net asset
value on the last day of each period reported. Distributions are assumed, for the purpose of this calculation, to bereinvested at net asset value per share on the respective payment dates of each distribution. Total returns forperiods of less than one year are not annualized. Broker commission charges are not included in this calculation.
(e) Annualized.(f) Portfolio turnover rate excludes securities received or delivered from in-kind processing of creations or
redemptions.(g) Not annualized.
SPDR SERIES TRUSTFINANCIAL HIGHLIGHTS (continued)Selected data for a share outstanding throughout each period
See accompanying notes to financial statements.27
1. Organization
SPDR Series Trust (the “Trust”), a Massachusetts business trust, registered under theInvestment Company Act of 1940, as amended (“1940 Act”), is an open-endmanagement investment company.
As of December 31, 2019, the Trust consists of eighty-one (81) series, each of whichrepresents a separate series of beneficial interest in the Trust. The Declaration of Trustpermits the Board of Trustees of the Trust (the “Board”) to authorize the issuance of anunlimited number of shares of beneficial interest at $0.01 par value. The financialstatements herein relate to the following series (each a “Fund”, and collectively, the“Funds”):
SPDR Dow Jones REIT ETFSPDR S&P Biotech ETFSPDR S&P Dividend ETF
Each Fund is classified as a non-diversified investment company under the 1940 Act.
Under the Trust’s organizational documents, its officers and trustees are indemnifiedagainst certain liabilities arising out of the performance of their duties to the Trust.Additionally, in the normal course of business, the Trust enters into contracts withservice providers that contain general indemnification clauses. The Trust’s maximumexposure under these arrangements is unknown as this would involve future claims thatmay be made against the Trust that have not yet occurred.
2. Summary of Significant Accounting Policies
The following is a summary of significant accounting policies followed by the Trust inthe preparation of its financial statements:
The preparation of financial statements in accordance with U.S. generally acceptedaccounting principles (“U.S. GAAP”) requires management to make estimates andassumptions that affect the reported amounts and disclosures in the financial statements.Actual results could differ from those estimates. Each Fund is an investment companyunder U.S. GAAP and follows the accounting and reporting guidance applicable toinvestment companies.
Security Valuation
Each Fund’s investments are valued at fair value each day that the New York StockExchange (“NYSE”) is open and, for financial reporting purposes, as of the report dateshould the reporting period end on a day that the NYSE is not open. Fair value isgenerally defined as the price a fund would receive to sell an asset or pay to transfer a
SPDR SERIES TRUSTNOTES TO FINANCIAL STATEMENTSDecember 31, 2019 (Unaudited)
28
liability in an orderly transaction between market participants at the measurement date.By its nature, a fair value price is a good faith estimate of the valuation in a current saleand may not reflect an actual market price. The investments of each Fund are valuedpursuant to the policy and procedures developed by the Oversight Committee (the“Committee”) and approved by the Board. The Committee provides oversight of thevaluation of investments for the Funds. The Board has responsibility for overseeing thedetermination of the fair value of investments.
Valuation techniques used to value each Fund’s investments by major category are asfollows:
• Equity investments (including preferred stocks and registered investment companiesthat are exchange-traded funds) traded on a recognized securities exchange for whichmarket quotations are readily available are valued at the last sale price or officialclosing price, as applicable, on the primary market or exchange on which they trade.Equity investments traded on a recognized exchange for which there were no sales onthat day are valued at the last published sale price or at fair value.
• Investments in registered investment companies (including money market funds) orother unitized pooled investment vehicles that are not traded on an exchange arevalued at that day’s published net asset value (“NAV”) per share or unit.
In the event prices or quotations are not readily available or that the application of thesevaluation methods results in a price for an investment that is deemed to be notrepresentative of the fair value of such investment, fair value will be determined in goodfaith by the Committee, in accordance with the valuation policy and proceduresapproved by the Board.
Fair value pricing could result in a difference between the prices used to calculate aFund’s NAV and the prices used by the Funds’ underlying benchmarks. Various inputsare used in determining the value of the Funds’ investments.
The Funds value their assets and liabilities at fair value using a fair value hierarchyconsisting of three broad levels that prioritize the inputs to valuation techniques givingthe highest priority to readily available unadjusted quoted prices in active markets foridentical assets or liabilities (Level 1 measurements) and the lowest priority tounobservable inputs (Level 3 measurements) when market prices are not readilyavailable or reliable. The categorization of a value determined for an investment withinthe hierarchy is based upon the pricing transparency of the investment and is notnecessarily an indication of the risk associated with investing in it.
The three levels of the fair value hierarchy are as follows:
SPDR SERIES TRUSTNOTES TO FINANCIAL STATEMENTS (continued)December 31, 2019 (Unaudited)
29

• Level 1 – Unadjusted quoted prices in active markets for an identical asset or liability;
• Level 2 – Inputs other than quoted prices included within Level 1 that are observablefor the asset or liability either directly or indirectly, including quoted prices for similarassets or liabilities in active markets, quoted prices for identical or similar assets orliabilities in markets that are not considered to be active, inputs other than quotedprices that are observable for the asset or liability (such as exchange rates, financingterms, interest rates, yield curves, volatilities, prepayment speeds, loss severities,credit risks and default rates) or other market-corroborated inputs; and
• Level 3 – Unobservable inputs for the asset or liability, including the Committee’sassumptions used in determining the fair value of investments.
The value of each Fund’s investments, according to the fair value hierarchy as ofDecember 31, 2019, is disclosed in each Fund’s respective Schedule of Investments.
Investment Transactions and Income Recognition
Investment transactions are accounted for on trade date for financial reporting purposes.Realized gains and losses from the sale or disposition of investments and foreignexchange transactions, if any, are determined using the identified cost method.
Dividend income and capital gain distributions, if any, are recognized on theex-dividend date, or when the information becomes available, net of any foreign taxeswithheld at source, if any. Non-cash dividends received in the form of stock, if any, arerecorded as dividend income at fair value. Distributions received by the Fund’s mayinclude a return of capital that is estimated by management. Such amounts are recordedas a reduction of the cost of investments or reclassified to capital gains.
Certain Funds invest in real estate investment trusts (“REITs”). REITs determine the taxcharacter of their distributions annually and may characterize a portion of theirdistributions as a return of capital or capital gain. The Funds’ policy is to record allREIT distributions initially as dividend income and re-designate a portion to return ofcapital or capital gain distributions at year end based on information provided by theREIT and/or SSGA Funds Management, Inc.’s (the “Adviser” or “SSGA FM”) estimatesof such re-designations for which actual information has not yet been reported.
Expenses
Certain expenses, which are directly identifiable to a specific Fund, are applied to thatFund within the Trust. Other expenses which cannot be attributed to a specific Fund areallocated in such a manner as deemed equitable, taking into consideration the nature andtype of expense and the relative net assets of the Fund within the Trust.
SPDR SERIES TRUSTNOTES TO FINANCIAL STATEMENTS (continued)December 31, 2019 (Unaudited)
30

Foreign Taxes
The Funds may be subject to foreign taxes (a portion of which may be reclaimable) onincome, stock dividends, realized and unrealized capital gains on investments or certainforeign currency transactions. Foreign taxes are recorded in accordance with SSGAFM’s understanding of the applicable foreign tax regulations and rates that exist in theforeign jurisdictions in which the Funds invest. These foreign taxes, if any, are paid bythe Fund and are reflected in the Statements of Operations, if applicable. Foreign taxespayable or deferred as of December 31, 2019, if any, are disclosed in the Funds’Statements of Assets and Liabilities.
Equalization
Certain Funds in the Trust follow the accounting practice known as “Equalization” bywhich a portion of the proceeds from sales and costs of reacquiring Fund shares,equivalent on a per share basis to the amount of distributable net investment income onthe date of the transaction, is credited or charged to undistributed net investmentincome. As a result, undistributed net investment income per share is unaffected by salesor reacquisition of Fund shares. Amounts related to Equalization can be found on theStatements of Changes in Net Assets.
The following Funds utilized equalization during the period ended December 31, 2019:
SPDR Dow Jones REIT ETFSPDR S&P Biotech ETFSPDR S&P Dividend ETF
Distributions
Distributions from net investment income, if any, are declared and paid quarterly. Netrealized capital gains, if any, are distributed annually. Dividends may be declared andpaid more frequently or at any other times to improve Index tracking or to comply withthe distribution requirements of the Internal Revenue Code of 1986, as amended (the“Internal Revenue Code”). The amount and character of income and capital gains to bedistributed are determined in accordance with applicable tax regulations which maydiffer from net investment income and realized gains recognized for U.S. GAAPpurposes.
SPDR SERIES TRUSTNOTES TO FINANCIAL STATEMENTS (continued)December 31, 2019 (Unaudited)
31
3. Fees and Transactions with Affiliates
Advisory Fee
The Trust, on behalf of each Fund, has entered into an Investment Advisory Agreementwith SSGA FM. For its advisory services to the Funds, facilities furnished, andexpenses borne by the Adviser, each Fund pays the Adviser a fee(“Management/Advisory fee”) accrued daily and paid monthly, based on a percentage ofeach Fund’s average daily net assets as shown in the following table:
Annual Rate
SPDR Dow Jones REIT ETF . . . . . . . . . . . . . . . . . . . . . . . . . . . . . . . . . . . . . . 0.25%
SPDR S&P Biotech ETF. . . . . . . . . . . . . . . . . . . . . . . . . . . . . . . . . . . . . . . . . 0.35
SPDR S&P Dividend ETF. . . . . . . . . . . . . . . . . . . . . . . . . . . . . . . . . . . . . . . . 0.35
The Adviser pays all the expenses of each Fund other than the management fee,brokerage expenses, taxes, interest, fees and expenses of the Trust’s IndependentTrustees (including any Trustees’ counsel fees), acquired fund fees and expenses,litigation expenses, and other extraordinary expenses.
The Adviser has contractually agreed to waive a portion of its management fee and/orreimburse expenses in an amount equal to any acquired fund fees and expenses(excluding holdings in acquired funds for cash management purposes, if any) for eachFund until October 31, 2020.
Administrator, Custodian, Sub-Administrator and Transfer Agent Fees
SSGA FM serves as administrator and State Street Bank and Trust Company (“StateStreet”), an affiliate of the Adviser, serves as custodian, sub-administrator and transferagent. State Street receives fees for its services as custodian, sub-administrator andtransfer agent from the Adviser.
Distributor
State Street Global Advisors Funds Distributors, LLC (“SSGA FD” or the“Distributor”), an affiliate of the Adviser, serves as the distributor of the Trust.
Other Transactions with Affiliates - Securities Lending
State Street, an affiliate of the Funds, acts as the securities lending agent for the Funds,pursuant to an amended and restated securities lending authorization agreement datedJanuary 6, 2017.
SPDR SERIES TRUSTNOTES TO FINANCIAL STATEMENTS (continued)December 31, 2019 (Unaudited)
32
Proceeds collected by State Street on investment of cash collateral or any fee income areallocated as follows (after deduction of such other amounts payable to State Street underthe terms of the securities lending agreement): 85% payable to the Fund, and 15%payable to State Street.
In addition, cash collateral from lending activities is invested in the State StreetNavigator Securities Lending Portfolio II, an affiliated fund, for which SSGA FM servesas investment adviser. See Note 8 for additional information regarding securitieslending.
Other Transactions with Affiliates
The Funds may invest in affiliated entities, including securities issued by State StreetCorporation, affiliated funds, or entities deemed to be affiliates as a result of the Fundsowning more than five percent of the entity’s voting securities or outstanding shares.Amounts relating to these transactions during the period ended December 31, 2019 aredisclosed in the Schedules of Investments.
Due to Custodian
In certain circumstances, the Fund may have cash overdrafts with the custodian due toexpense payments, capital transactions, trading of securities, investment operations orderivative transactions. The Due to custodian amount, if any, reflects cash overdrawnwith State Street, as custodian, who is an affiliate of the Fund.
4. Trustees’ Fees
The fees and expenses of the Trust’s trustees, who are not “interested persons” of theTrust, as defined in the 1940 Act (“Independent Trustees”), are paid directly by theFunds. The Independent Trustees are reimbursed for travel and other out-of-pocketexpenses in connection with meeting attendance and industry seminars.
5. Investment Transactions
Purchases and sales of investments (excluding in-kind transactions and short terminvestments) for the period ended December 31, 2019, were as follows:
Purchases Sales
SPDR Dow Jones REIT ETF . . . . . . . . . . . . . . . . . . . . . . . . . . . $ 85,760,874 $ 89,452,488
SPDR S&P Biotech ETF . . . . . . . . . . . . . . . . . . . . . . . . . . . . . . 1,310,348,264 1,310,930,526
SPDR S&P Dividend ETF . . . . . . . . . . . . . . . . . . . . . . . . . . . . . 1,842,486,124 1,730,612,249
SPDR SERIES TRUSTNOTES TO FINANCIAL STATEMENTS (continued)December 31, 2019 (Unaudited)
33
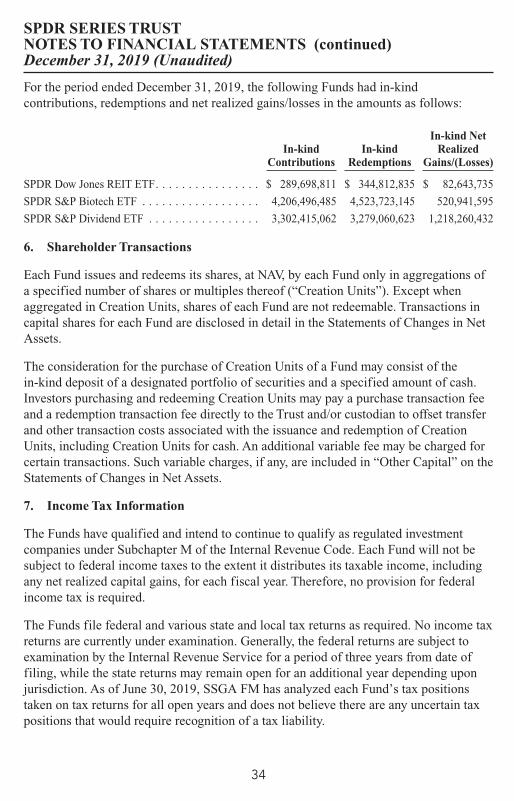
For the period ended December 31, 2019, the following Funds had in-kindcontributions, redemptions and net realized gains/losses in the amounts as follows:
In-kindContributions
In-kindRedemptions
In-kind NetRealized
Gains/(Losses)
SPDR Dow Jones REIT ETF. . . . . . . . . . . . . . . . $ 289,698,811 $ 344,812,835 $ 82,643,735
SPDR S&P Biotech ETF . . . . . . . . . . . . . . . . . . 4,206,496,485 4,523,723,145 520,941,595
SPDR S&P Dividend ETF . . . . . . . . . . . . . . . . . 3,302,415,062 3,279,060,623 1,218,260,432
6. Shareholder Transactions
Each Fund issues and redeems its shares, at NAV, by each Fund only in aggregations ofa specified number of shares or multiples thereof (“Creation Units”). Except whenaggregated in Creation Units, shares of each Fund are not redeemable. Transactions incapital shares for each Fund are disclosed in detail in the Statements of Changes in NetAssets.
The consideration for the purchase of Creation Units of a Fund may consist of thein-kind deposit of a designated portfolio of securities and a specified amount of cash.Investors purchasing and redeeming Creation Units may pay a purchase transaction feeand a redemption transaction fee directly to the Trust and/or custodian to offset transferand other transaction costs associated with the issuance and redemption of CreationUnits, including Creation Units for cash. An additional variable fee may be charged forcertain transactions. Such variable charges, if any, are included in “Other Capital” on theStatements of Changes in Net Assets.
7. Income Tax Information
The Funds have qualified and intend to continue to qualify as regulated investmentcompanies under Subchapter M of the Internal Revenue Code. Each Fund will not besubject to federal income taxes to the extent it distributes its taxable income, includingany net realized capital gains, for each fiscal year. Therefore, no provision for federalincome tax is required.
The Funds file federal and various state and local tax returns as required. No income taxreturns are currently under examination. Generally, the federal returns are subject toexamination by the Internal Revenue Service for a period of three years from date offiling, while the state returns may remain open for an additional year depending uponjurisdiction. As of June 30, 2019, SSGA FM has analyzed each Fund’s tax positionstaken on tax returns for all open years and does not believe there are any uncertain taxpositions that would require recognition of a tax liability.
SPDR SERIES TRUSTNOTES TO FINANCIAL STATEMENTS (continued)December 31, 2019 (Unaudited)
34
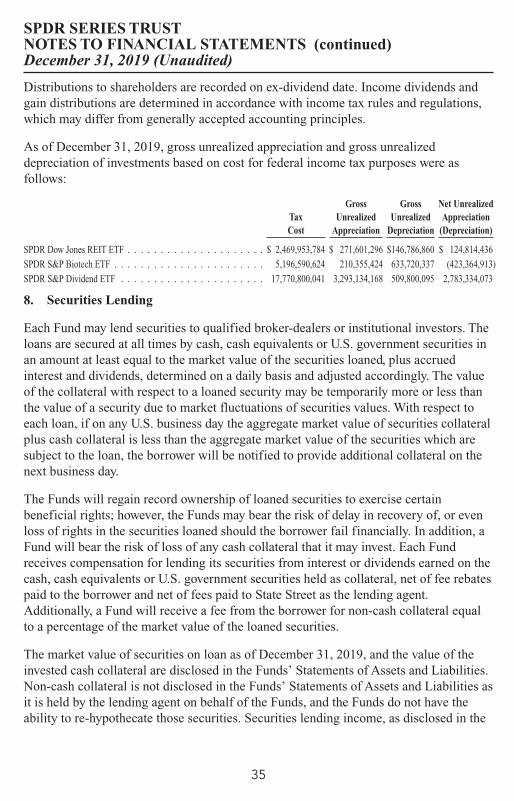
Distributions to shareholders are recorded on ex-dividend date. Income dividends andgain distributions are determined in accordance with income tax rules and regulations,which may differ from generally accepted accounting principles.
As of December 31, 2019, gross unrealized appreciation and gross unrealizeddepreciation of investments based on cost for federal income tax purposes were asfollows:
TaxCost
GrossUnrealized
Appreciation
GrossUnrealized
Depreciation
Net UnrealizedAppreciation
(Depreciation)
SPDR Dow Jones REIT ETF . . . . . . . . . . . . . . . . . . . . . $ 2,469,953,784 $ 271,601,296 $146,786,860 $ 124,814,436
SPDR S&P Biotech ETF . . . . . . . . . . . . . . . . . . . . . . . 5,196,590,624 210,355,424 633,720,337 (423,364,913)
SPDR S&P Dividend ETF . . . . . . . . . . . . . . . . . . . . . . 17,770,800,041 3,293,134,168 509,800,095 2,783,334,073
8. Securities Lending
Each Fund may lend securities to qualified broker-dealers or institutional investors. Theloans are secured at all times by cash, cash equivalents or U.S. government securities inan amount at least equal to the market value of the securities loaned, plus accruedinterest and dividends, determined on a daily basis and adjusted accordingly. The valueof the collateral with respect to a loaned security may be temporarily more or less thanthe value of a security due to market fluctuations of securities values. With respect toeach loan, if on any U.S. business day the aggregate market value of securities collateralplus cash collateral is less than the aggregate market value of the securities which aresubject to the loan, the borrower will be notified to provide additional collateral on thenext business day.
The Funds will regain record ownership of loaned securities to exercise certainbeneficial rights; however, the Funds may bear the risk of delay in recovery of, or evenloss of rights in the securities loaned should the borrower fail financially. In addition, aFund will bear the risk of loss of any cash collateral that it may invest. Each Fundreceives compensation for lending its securities from interest or dividends earned on thecash, cash equivalents or U.S. government securities held as collateral, net of fee rebatespaid to the borrower and net of fees paid to State Street as the lending agent.Additionally, a Fund will receive a fee from the borrower for non-cash collateral equalto a percentage of the market value of the loaned securities.
The market value of securities on loan as of December 31, 2019, and the value of theinvested cash collateral are disclosed in the Funds’ Statements of Assets and Liabilities.Non-cash collateral is not disclosed in the Funds’ Statements of Assets and Liabilities asit is held by the lending agent on behalf of the Funds, and the Funds do not have theability to re-hypothecate those securities. Securities lending income, as disclosed in the
SPDR SERIES TRUSTNOTES TO FINANCIAL STATEMENTS (continued)December 31, 2019 (Unaudited)
35
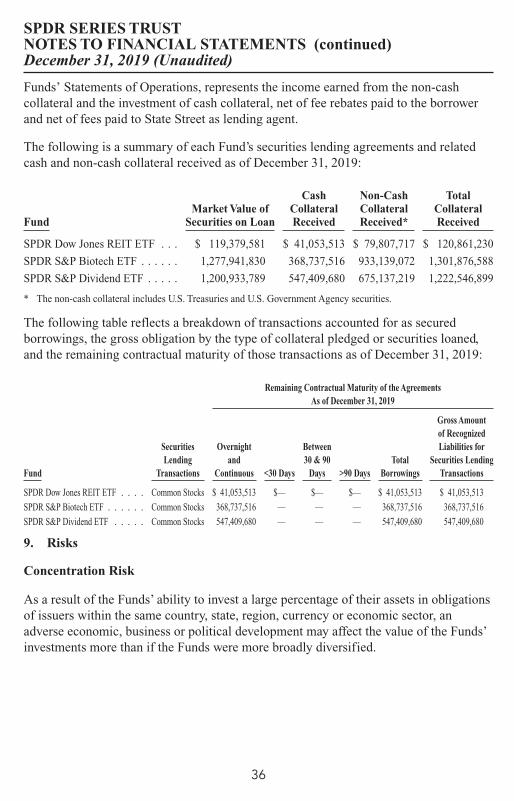
Funds’ Statements of Operations, represents the income earned from the non-cashcollateral and the investment of cash collateral, net of fee rebates paid to the borrowerand net of fees paid to State Street as lending agent.
The following is a summary of each Fund’s securities lending agreements and relatedcash and non-cash collateral received as of December 31, 2019:
FundMarket Value of
Securities on Loan
CashCollateralReceived
Non-CashCollateralReceived*
TotalCollateralReceived
SPDR Dow Jones REIT ETF . . . $ 119,379,581 $ 41,053,513 $ 79,807,717 $ 120,861,230
SPDR S&P Biotech ETF . . . . . . 1,277,941,830 368,737,516 933,139,072 1,301,876,588
SPDR S&P Dividend ETF . . . . . 1,200,933,789 547,409,680 675,137,219 1,222,546,899
* The non-cash collateral includes U.S. Treasuries and U.S. Government Agency securities.
The following table reflects a breakdown of transactions accounted for as securedborrowings, the gross obligation by the type of collateral pledged or securities loaned,and the remaining contractual maturity of those transactions as of December 31, 2019:
Remaining Contractual Maturity of the AgreementsAs of December 31, 2019
Fund
SecuritiesLending
Transactions
Overnightand
Continuous <30 Days
Between30 & 90
Days >90 DaysTotal
Borrowings
Gross Amountof RecognizedLiabilities for
Securities LendingTransactions
SPDR Dow Jones REIT ETF . . . . Common Stocks $ 41,053,513 $— $— $— $ 41,053,513 $ 41,053,513
SPDR S&P Biotech ETF . . . . . . Common Stocks 368,737,516 — — — 368,737,516 368,737,516
SPDR S&P Dividend ETF . . . . . Common Stocks 547,409,680 — — — 547,409,680 547,409,680
9. Risks
Concentration Risk
As a result of the Funds’ ability to invest a large percentage of their assets in obligationsof issuers within the same country, state, region, currency or economic sector, anadverse economic, business or political development may affect the value of the Funds’investments more than if the Funds were more broadly diversified.
SPDR SERIES TRUSTNOTES TO FINANCIAL STATEMENTS (continued)December 31, 2019 (Unaudited)
36

Market and Credit Risk
In the normal course of business, the Funds trade financial instruments and enter intofinancial transactions where risk of potential loss exists due to changes in the generaleconomic conditions and fluctuations of the market (market risk). Additionally, a Fundmay also be exposed to credit risk in the event that an issuer or guarantor fails toperform or that an institution or entity with which the Fund has unsettled or opentransactions defaults.
10. Subsequent Events
Management has evaluated the impact of all subsequent events on the Funds through thedate the financial statements were issued and has determined that there were nosubsequent events requiring adjustment or disclosure in the financial statements.
SPDR SERIES TRUSTNOTES TO FINANCIAL STATEMENTS (continued)December 31, 2019 (Unaudited)
37
Expense Example
As a shareholder of a Fund, you incur two types of costs: (1) transaction costs, includingsales charges (loads), if applicable, on purchase payments, reinvested dividends, or otherdistributions and (2) ongoing costs, including advisory fees and other Fund expenses.This example is intended to help you understand your ongoing costs (in dollars) ofinvesting in the Fund and to compare these costs with the ongoing costs of investing inother mutual funds. It is based on an investment of $1,000 made at the beginning of theperiod shown and held for the entire period from July 1, 2019 to December 31, 2019.
The table below illustrates your Fund’s cost in two ways:
Based on actual fund return ——This section helps you to estimate the actualexpenses that you paid over the period. The “Ending Account Value” shown is derivedfrom each Fund’s actual return, and the third column shows the dollar amount thatwould have been paid by an investor who started with $1,000 in the Fund. You may usethe information here, together with the amount you invested, to estimate the expensesthat you paid over the period. To do so, simply divide your account value by $1,000 (forexample, an $8,600 account value divided by $1,000 = 8.6), then multiply the result bythe number given for the Fund under the heading “Expenses Paid During Period”.
Based on hypothetical 5% return ——This section is intended to help you compareyour Fund’s costs with those of other mutual funds. It assumes that the Fund had ayearly return of 5% before expenses, but that the expense ratio is unchanged. In thiscase, because the return used is not the Fund’s actual return, the results do not apply toyour investment. The example is useful in making comparisons because theU.S. Securities and Exchange Commission (the “SEC”) requires all mutual funds tocalculate expenses based on a 5% return. You can assess your Fund’s costs bycomparing this hypothetical example with the hypothetical examples that appear inshareholder reports of other funds.
Please note that the expenses shown in the table are meant to highlight your ongoingcosts only and do not reflect any transaction costs, such as sales load charges (loads).Therefore, the hypothetical 5% return section of the table is useful in comparingongoing costs only, and will not help you determine the relative total costs of owningdifferent funds. In addition, if these transaction costs were included, your costs wouldhave been higher.
SPDR SERIES TRUSTOTHER INFORMATIONDecember 31, 2019 (Unaudited)
38
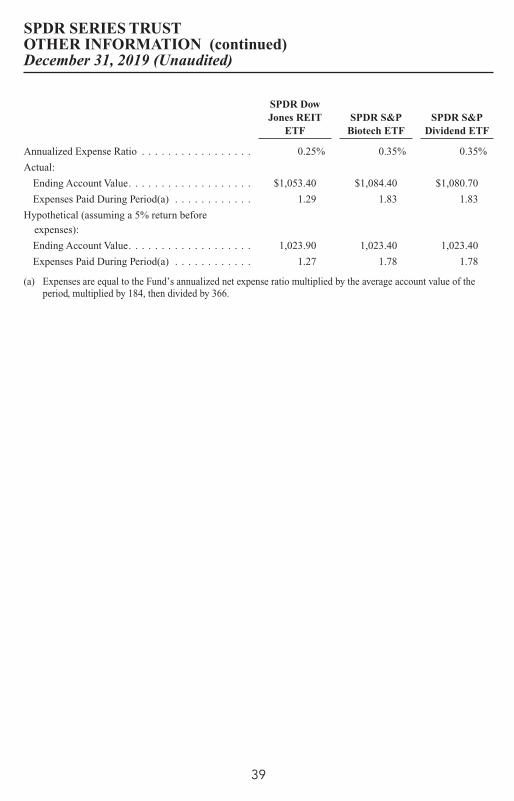
SPDR DowJones REIT
ETFSPDR S&P
Biotech ETFSPDR S&P
Dividend ETF
Annualized Expense Ratio . . . . . . . . . . . . . . . . . 0.25% 0.35% 0.35%
Actual:
Ending Account Value. . . . . . . . . . . . . . . . . . . $1,053.40 $1,084.40 $1,080.70
Expenses Paid During Period(a) . . . . . . . . . . . . 1.29 1.83 1.83
Hypothetical (assuming a 5% return before
expenses):
Ending Account Value. . . . . . . . . . . . . . . . . . . 1,023.90 1,023.40 1,023.40
Expenses Paid During Period(a) . . . . . . . . . . . . 1.27 1.78 1.78
(a) Expenses are equal to the Fund’s annualized net expense ratio multiplied by the average account value of theperiod, multiplied by 184, then divided by 366.
SPDR SERIES TRUSTOTHER INFORMATION (continued)December 31, 2019 (Unaudited)
39
Liquidity Risk Management Program
Pursuant to Rule 22e-4 under the 1940 Act, the Funds have adopted a liquidity riskmanagement program. The program’s principal objectives include assessing, managingand periodically reviewing each Fund’s liquidity risk, based on factors specific to thecircumstances of the Fund. Liquidity risk is defined as the risk that a Fund could notmeet redemption requests without significant dilution of remaining investors’ interestsin the Fund.
SSGA FM has been designated by the Board to administer the Funds’ liquidity riskmanagement program. At a board meeting during the fiscal period, SSGA FM providedthe Board with a report addressing the operations of the program and assessing itsadequacy and effectiveness of implementation, including:
• the program supported each Fund’s ability to honor redemption requests timely;
• the program supported SSGA FM’s management of each Fund’s liquidity profile,including during periods of market volatility and net redemptions;
• no material liquidity issues were identified during the period;
• there were no material changes to the program during the period;
• the implementation of the program was effective to manage each Fund’s liquidity risk;and
• the program operated adequately during the period.
There can be no assurance that the program will achieve its objectives in the future.Please refer to your Fund’s prospectus for more information regarding the Fund’sexposure to liquidity risk and other principal risks to which an investment in the Fundmay be subject.
Premium/Discount Information
Information regarding how often the Shares of each Fund traded on the exchange at aprice above (i.e., at a premium) or below (i.e., at a discount) the NAV of the Fund duringthe past calendar year can be found at www.spdrs.com.
SPDR SERIES TRUSTOTHER INFORMATION (continued)December 31, 2019 (Unaudited)
40

Proxy Voting Policies and Procedures and Records
A description of the Trust’s proxy voting policies and procedures that are used by theFunds’ investment adviser to vote proxies relating to the Funds’ portfolio of securitiesare available (i) without charge, upon request by calling 1-866-787-2257 (toll free) or(ii) on the SEC’s website at www.sec.gov.
Information regarding how the investment adviser voted for the 12-month period endedJune 30, is available by August 31 of each year by calling the same number, on theSEC’s website at www.sec.gov, and on the Funds’ website at www.spdrs.com.
Quarterly Portfolio Schedule
Following the Funds’ first and third fiscal quarter-ends, a complete schedule ofinvestments is filed with the SEC as an exhibit on Form N-PORT, which can be foundon the SEC’s website at www.sec.gov. The Funds’ schedules of investments are availableupon request, without charge, by calling 1-866-787-2257 (toll free).
SPDR SERIES TRUSTOTHER INFORMATION (continued)December 31, 2019 (Unaudited)
41

[This Page Intentionally Left Blank]

SPDR Series Trust
TrusteesBonny E. BoatmanDwight D. ChurchillFrank Nesvet, ChairmanClare S. RicherJames E. RossSandra G. SponemCarl G. Verboncoeur
Investment Manager andAdministratorSSGA Funds Management, Inc.One Iron StreetBoston, MA 02210
DistributorState Street Global Advisors FundsDistributors, LLCOne Iron StreetBoston, MA 02210
Custodian, Sub-Administratorand Transfer AgentState Street Bank and Trust CompanyOne Lincoln StreetBoston, MA 02111
Legal CounselMorgan, Lewis & Bockius LLP1111 Pennsylvania Avenue, NWWashington, DC 20004
Independent Registered PublicAccounting FirmErnst & Young LLP200 Clarendon StreetBoston, MA 02116
The information contained in this report is intended for the general informationof shareholders of the Trust. This report is not authorized for distribution toprospective investors unless preceded or accompanied by a current Trustprospectus which contains important information concerning the Trust. Youmay obtain a current prospectus and SAI from the Distributor by calling1-866-787-2257 or visiting www.spdrs.com. Please read the prospectus carefullybefore you invest.
SPDR® Series Trust - Equity FundsFor more complete information, please call1.866.787.2257 or visit www.spdrs.com today.
State Street Global AdvisorsOne Iron StreetBoston, MA 02210
ETFs trade like stocks, are subject to investment risk,fluctuate in market value and may trade at pricesabove or below the ETF's net asset value. Brokeragecommissions and ETF expenses will reduce returns.
Standard & Poor’s, S&P and SPDR are registeredtrademarks of Standard & Poor’s FinancialServices LLC (S&P); Dow Jones is a registeredtrademark of Dow Jones Trademark Holdings LLC(Dow Jones); and these trademarks have beenlicensed for use by S&P Dow Jones Indices LLC(SPDJI) and sublicensed for certain purposes byState Street Corporation. State Street Corporation’sfinancial products are not sponsored, endorsed, soldor promoted by SPDJI, Dow Jones, S&P, theirrespective affiliates and third party licensors and
none of such parties make any representationregarding the advisability of investing in suchproduct(s) nor do they have any liability in relationthereto, including for any errors, omissions, orinterruptions of any index.
Distributor: State Street Global Advisors FundsDistributors, LLC, member FINRA, SIPC, an indirectwholly owned subsidiary of State StreetCorporation. References to State Street may includeState Street Corporation and its affiliates. CertainState Street affiliates provide services and receivefees from the SPDR ETFs.
Before investing, consider a Fund’s investmentobjectives, risks, charges and expenses. To obtain aprospectus or summary prospectus which containsthis and other information, call 1.866.787.2257 orvisit www.spdrs.com. Read it carefully.
Not FDIC Insured. No Bank Guarantee. May LoseValue.
The information contained in this report is intended for the general information of shareholders of theTrust. This report is not authorized for distribution to prospective investors unless preceded oraccompanied by a current Trust prospectus which contains important information concerning the Trust.You may obtain a current prospectus and SAI from the Distributor by calling 1-866-787-2257 or visitingwww.spdrs.com. Please read the prospectus carefully before you invest.
© 2020 State Street Corporation - All Rights ReservedSPDRTOPEQSAR


![Breakout by Race / Ethnicity [Weighted] - CCSSE · Total 7,861 100.0 25,667 100.0 1,138 100.0 50,617 100.0 234,634 100.0 74,299 100.0 18,695 100.0 4g. Worked with classmates outside](https://static.fdocuments.net/doc/165x107/5ac86cc17f8b9a6b578c1ca7/breakout-by-race-ethnicity-weighted-7861-1000-25667-1000-1138-1000-50617.jpg)