
SEMBCORP INDUSTRIES ANNUAL REPORT 2015 BUILDING THE …
185
SEMBCORP INDUSTRIES ANNUAL REPORT 2015 BUILDING THE FUTURE A GLOBAL COMPANY
Transcript of SEMBCORP INDUSTRIES ANNUAL REPORT 2015 BUILDING THE …

S E M B C O R P I N D U S T R I E S A N N U A L R E P O R T 2 0 1 5
BUILDING THE FUTUREA G L O B A L C O M P A N Y

At Sembcorp, we aim to build
sustainable businesses that create
and deliver long-term value.
Our commitment to shareholders
is unwavering. We act always in their
interest, developing robust business
models and distinctive capabilities,
and responsibly operating and
excelling in each of our businesses.
At the same time, we continue to
invest for growth in a disciplined
manner, nimbly seizing opportunities
to position Sembcorp for the future
and maximise long-term returns.
Chairman and CEO’s Statement 8
Key Figures & Highlights 16
Celebrating 20 Years of Sembcorp Utilities 18
Sembcorp at a Glance 22
• Who We Are 22
• How We Create Value 24
− Our Value Creation Process 24
− Our Vision and Mission 26
− Our Strategic Focus 26
− Our Strategy at a Glance 27
• What Guides Us 28
CEO Interview 30
Board of Directors 34
Technology Advisory Panel 40
Senior Executives 44
Significant Events 46
Operating and Financial Review
Group Structure 52
Group Financial Review 54
• Group Financial Highlights 54
• Group Quarterly Performance 55
• Five-year Financial Performance Profile 56
• Turnover 60
• Net Profit 60
• Cash Flow and Liquidity 62
• Financial Position 62
• Shareholder Returns 62
• Economic Value Added 62
• Value Added and Productivity Data 63
• Critical Accounting Policies 63
• Financial Risk Management 63
• Treasury Management 67
• Facilities 67
• Borrowings and Issuance of Perpetual Securities 67
Utilities Review 70
Marine Review 80
Urban Development Review 88
Governance and Sustainability
Corporate Governance Statement 97
Risk Management and Internal Controls 118
Sustainability Report 126
• Managing Sustainability 126
– Materiality 128
• Material Issues 131
– Stakeholder Engagement 132
– Economic 133
– Governance, Risk and Compliance 139
– People 142
– Health, Safety and the Environment 146
– Community 153
Investor Relations 156
Financial Statements
Directors’ Statement 162
Independent Auditors’ Report 177
Balance Sheets 178
Consolidated Income Statement 180
Consolidated Statement of Comprehensive Income 181
Consolidated Statement of Changes in Equity 182
Consolidated Statement of Cash Flows 190
Notes to the Financial Statements 193
Supplementary Information 334
EVA Statement 337
Shareholders’ Information 338
Governance Disclosure Guide 340
Corporate Information 352
Notice of Annual General Meeting 353
Proxy Form 363
Financial Calendar Inside Back Cover
CONTENTS

E SS E NTIAL SOLUT IONS
Sembcorp is a provider of products and services which are essential in nature, such as energy, water and urban solutions. Globally, long-term demand for these essential solutions continues to grow.
From meeting the critical energy and water needs of industries and households, to supporting development and improving the quality of life, the continued relevance of our solutions is a key strength and the bedrock on which our resilience is built.
Sembcorp’s combined power and
desalination facility in Fujairah, UAE

FOCUSED DEL IVERY
As we strengthen our global capabilities and serve our customers, we maintain a keen focus on delivery.
We strive for safe, excellent operations and aim to execute and deliver our projects well, while consistently reflecting the high standards for which our brand is known. A strong track record sets us apart, along with a reputation for efficiency, quality and reliability.
The state-of-the-art Sembcorp Marine
Tuas Boulevard Yard in Singapore

At Sembcorp, we take a long-term strategic approach that focuses on shareholder value. Global megatrends, including infrastructure development in emerging markets, greater emphasis on renewables and escalating water stress, present opportunities for our long-term growth.
Strategically positioned in rapidly developing economies, with a strong project pipeline, increasing land bank and full spectrum of marine and offshore solutions, Sembcorp is poised to seize opportunities for growth. Furthermore, we are actively strengthening our capabilities and investing in deeper expertise to build platforms for the future.
OPPORTUNIT IES FOR GROWTH
Sembcorp’s supercritical coal-fired
power plants in Andhra Pradesh, India

8 BUILDING THE FUTURE
CHAIRMAN AND CEO’S STATEMENT
our solid waste management joint venture in Australia, as well as municipal water operations in Bournemouth, UK and Zhumadian, China. These deals allowed us to realise a net gain of over S$400 million and deploy resources to businesses and markets with high growth potential.
Furthermore, we continue to focus on prudent financial management and on maintaining an efficient and optimal mix of funding facilities and borrowings. To improve our financial flexibility, in 2015, we issued S$600 million subordinated perpetual securities under our S$2 billion multi-currency debt issuance programme.
Through efforts such as these, we aim to deliver on an important commitment to our shareholders: to provide sustainable dividends, while continuing to invest for future growth. We are pleased to inform you that despite the challenging market conditions, the Board of Directors is proposing a final dividend of 6 cents per ordinary share for 2015. Together with the interim dividend of 5 cents per ordinary share paid in September, this brings our total dividend for the year to 11 cents per ordinary share, an amount consistent with our past payout ratio. Based on the closing share price on February 17, 2016, our dividend yield was 4.3%.
Dear Shareholders,
2015 was a challenging year for business. Global markets saw weaker industrial production and trade volumes, a collapse in oil prices and increasing financial volatility.
In 2015, Group net profit was S$548.9 million and Group turnover S$9.5 billion, compared to S$801.1 million and S$10.9 billion respectively in 2014. Our Utilities business recorded S$701.5 million in net profit. Despite intense competition in Singapore’s power market, the business delivered strong profit growth of 72%, driven by overseas contributions and gains from divestments that unlocked value for our shareholders. Meanwhile, our Marine business faces a challenging period and uncertainties in Brazil. 2015 saw Sembcorp Marine making prudent impairment and provisions totalling S$609 million for its rig contracts, of which S$329 million relate to Sete Brasil, as well as recording S$192 million of associate / joint venture losses. As a result, at the Sembcorp Industries level, the Marine business posted a net loss of S$176.4 million. In 2015, our Urban Development business contributed S$33.5 million to the Group’s net profit.
The Group’s return on equity was 9.4% and our earnings per share amounted to 29.2 cents.
Commitment to Creating and Delivering ValueAt Sembcorp, we are committed to building a Group that creates and delivers long-term value. Two decades ago, we started our Utilities business to increase our recurring income streams. Today, the Utilities business is the largest profit contributor to the Sembcorp Group. We believe that Sembcorp’s diversified portfolio, balanced between different businesses and geographies, gives us strength and resilience as a Group.
We continue to manage Sembcorp’s portfolio of assets for value creation. In 2015, we divested
With sound strategies and strong
capabilities, we are confident that
we will be able to manage astutely
and operate effectively through
the present challenges, while
nimbly capturing opportunities
for future growth.
Ang Kong Hua, Chairman (right)
Tang Kin Fei, Group President & CEO (left)

CHAIRMAN AND CEO’S STATEMENT
SEMBCORP INDUSTRIES ANNUAL REPORT 2015 1110 BUILDING THE FUTURE
Building the FutureIn today’s global environment, the expected terrain for companies is one of change, volatility and keen competition. The imperative on our part is to ensure the resilience of our businesses. At Sembcorp, we have maintained a focus on building a global company with sustainable businesses. We believe that although the road ahead holds challenges, it is also rich in opportunities. With sound strategies and strong capabilities, we are confident that we will be able to manage astutely and operate effectively through the present challenges, while nimbly capturing opportunities for future growth.
In 2015, we focused not only on managing costs and operational excellence, but also on building the future. We achieved significant milestones in the execution and development of a strong pipeline of projects to underpin our future growth and also enhanced our competitiveness through organisational transformation.
In 2015, we marked the 20th anniversary of the founding of our Utilities business. Over the years, we have built up a strong income base in our Utilities business and it has become a major pillar of the Sembcorp Group. It is now a leading developer, owner and operator of energy and water assets in 15 countries worldwide. The business’ overseas growth strategy remains on track, with overseas operations contributing 60% of its net profit excluding corporate costs and significant items. With our strong capabilities in development as well as engineering, procurement and construction management, we continue to build platforms for growth particularly in emerging markets, where industrialisation and urbanisation drive demand for our essential solutions.
As we take Sembcorp’s energy business forward, we aim to build a balanced portfolio of thermal and renewable assets. While the emphasis on renewables has increased, we believe that thermal energy continues to be relevant. In addition to gas,
we believe that coal, an affordable and abundant fuel, will continue to play an important role in the fuel mix in rapidly developing economies where we operate. However, cleaner, higher-efficiency coal technologies will become increasingly important in meeting pressing needs for both electrification and lower emissions. In light of this, we have invested in plants using high-efficiency, low-emissions supercritical technology.
At the same time, we continue to expand our renewable energy business, which presents a new engine for our growth. In 2015, we acquired a majority stake in one of India’s leading renewable energy firms, with wind and solar power assets across six renewable resource-rich states in India. The acquisition of this business, renamed Sembcorp Green Infra, has catapulted Sembcorp to become a leading renewable energy player in India. It has also added solar capacities to our global renewable energy portfolio, which now encompasses wind, solar and biomass energy, as well as energy-from-waste. In addition, we maintained our growth momentum in China, the world’s largest wind power market, with two expansion projects in Hebei province. We completed the installation of a 48-megawatt wind farm in Jiedijianhe, and began construction of another in Laoshibeihe with 150 megawatts of capacity.
In 2015, we continued to strengthen our presence in key emerging markets. In India, we achieved a significant milestone with the successful completion and commencement of operation of our first thermal power plant in the country, a 1,320-megawatt supercritical coal-fired power plant in Andhra Pradesh. We also made good progress on the construction of our second 1,320-megawatt plant on the adjacent site, targeted for completion in 2016. Together with our newly acquired renewable power capacity, we have a total of over 3,500 megawatts of power capacity in operation and under development in
India today. With investments in both thermal and renewable energy, we are now well-positioned to continue to grow in the energy sector with a balanced portfolio of assets.
In China, we continued to focus on expanding our energy and water business, particularly in the areas of niche power and advanced water solutions for industries. In 2015, we formed a joint venture for a 1,620-megawatt mine-mouth coal-fired power project in Chongqing. The project comprises an existing 300-megawatt plant, and an upcoming 1,320-megawatt supercritical plant that is expected to be completed in 2017. As the only mine-mouth coal-fired power plants in Chongqing, these plants’ strategic location will enable them to produce power competitively. In Nanjing, we completed a 120,000 cubic metres per day expansion to our industrial water facilities in the Nanjing Chemical Industrial Park. In recognition of Sembcorp’s capabilities in providing specialised total water and wastewater solutions for industries, we received a special award at the China Water Industry Annual Awards for being the Leader in Water Treatment for Industrial Parks.
During the year, we marked our entry into Myanmar and Bangladesh, securing our first projects in their fast-growing power sectors. In Myanmar, we signed a memorandum of agreement to develop and operate a 225-megawatt gas-fired independent power plant in Myingyan, Mandalay. Targeted for completion in 2018, the project is set
to be the largest plant of its kind in the country. Sembcorp was awarded the project following an international tender, called by state-owned entity Myanmar Electric Power Enterprise and advised on by the International Finance Corporation, a member of the World Bank Group. Meanwhile in Bangladesh, we secured a 426-megawatt build-own-operate gas-fired power project. Expected to be completed in 2018, this combined cycle gas-fired plant will supply power to the grid under a 22.5-year power purchase agreement with the Bangladesh Power Development Board.
In the UAE, we continued to grow our business organically, commencing operation of a 30 million imperial gallons per day expansion to our Fujairah 1 Independent Water and Power Plant’s desalination facilities. With this, the plant has become one of the largest reverse osmosis desalination facilities in the Middle East.
Over the last two decades, Sembcorp’s Utilities business has come a long way. Today, we have an energy portfolio of over 10,600 megawatts, including over 9,000 megawatts of thermal power and more than 1,500 megawatts of renewable power in operation and under development. We are a global leader in advanced water and wastewater management for industries, and our water and wastewater treatment facilities have a combined capacity of over 9 million cubic metres per day. A strong pipeline of new facilities coming onstream between now and 2018 will continue to expand our income base and provide visibility on future growth. Backed by our strong positions in key emerging markets, robust track record and advanced technical capabilities, we are confident that Sembcorp’s Utilities business will continue to deliver sustainable value for decades to come.
Meanwhile, our Marine business faces a challenging period of low oil prices. The outlook for Brazil’s oil and gas industry is also uncertain. Although the immediate operating environment
A strong pipeline of new facilities
coming onstream between now and
2018 will continue to expand our
income base and provide visibility
on future growth.

CHAIRMAN AND CEO’S STATEMENT
SEMBCORP INDUSTRIES ANNUAL REPORT 2015 1312 BUILDING THE FUTURE
remains difficult, we remain confident in the long-term fundamentals for the offshore and marine industry. Our Marine business has maintained its focus on timely and effective project execution as well as efficient working capital and cost management. At the same time, the business also continues to deepen its capabilities, enhance its competitiveness and position itself for the future.
To this end, the business reached a key milestone in its transformation efforts in 2015. From a multi-brand, multi-business unit entity, the business has now been reorganised into a global integrated company operating under a single brand. Sembcorp Marine is now focused on four key capabilities across its global operations: rigs & floaters, repairs & upgrades, offshore platforms, and specialised shipbuilding. As an integrated company, the business will be able to optimise its capabilities and capacities and increase its efficiency and productivity to better serve its partners and customers. Ultimately, this will help our Marine business stay ahead of the curve, and adapt and excel in a dynamic and increasingly complex business environment.
The business also continued to enhance its capabilities and facilities during the year. A major milestone was achieved with the opening of a state-of-the-art steel structure fabrication workshop at the Sembcorp Marine Tuas Boulevard Yard in Singapore. The largest facility of its kind in Southeast Asia, the fully-covered 120,000-square-metre workshop offers substantial improvements in efficiency, halving man-hours and production time per tonne of steel fabricated. This new workshop strengthens the Marine business’ steel fabrication capabilities and forms a key part of the Tuas Boulevard yard’s development into a high-tech production hub, which will underpin the business’ ability to compete globally on value and scale.
Sembcorp Marine’s strategy to widen its portfolio of solutions, move into serving different segments of the oil and gas value chain and build
distinctive capabilities continues to bear fruit. In 2015, our Marine business secured S$3.2 billion in contract orders, excluding repair and upgrade contracts, despite the challenging macro environment. These include two sizeable contracts to serve players in the oil and gas production segment, worth approximately US$1 billion each. The first of these contracts was for the construction of the world’s largest semi-submersible crane vessel for Heerema Offshore Services. This order will be fulfilled out of the company’s Tuas Boulevard yard, with its deeper quayside draft, wider dock space and strong steel structure fabrication capabilities. The second is for three topsides for the Culzean field development for Maersk Oil North Sea UK, encompassing engineering, procurement and construction as well as onshore pre-commissioning services. With these contracts, the business’ orderbook stands at S$10.4 billion as at December 31, 2015.
In 2015, our Urban Development business achieved healthy land sales. The business sold a total of 211 hectares of land in Vietnam, China and Indonesia. Commitments were also secured from customers for a further 233 hectares of land, bringing the business’ net orderbook to 220 hectares to date.
In 2015, we continued to grow the reach of our urban developments across key markets. In Vietnam, we established two new Vietnam
Singapore Industrial Park (VSIP) projects in the northern and north central regions of the country. The first, VSIP Hai Duong, is a 150-hectare industrial park close to VSIP’s earlier projects in Bac Ninh and Hai Phong. Connected by highway to both Hanoi and Hai Phong port, the project has 110 hectares of industrial land for immediate sale and has already secured three customers. The second new project, VSIP Nghe An, broke ground for its first phase, comprising 198 hectares of industrial land and 81 hectares of commercial and residential land. The project is within the newly established Dong Nam Economic Zone, which offers generous investment incentives to manufacturers for up to 15 years. These and other VSIP projects stand to benefit from an expected boost to Vietnam’s manufacturing sector from the recently-signed Trans-Pacific Partnership.
Meanwhile in China, marketing efforts for the Singapore-Sichuan Hi-tech Innovation Park project in Chengdu, Sichuan province, proved highly successful, with 10 customers bringing RMB11.4 billion in investment capital to the site in 2015. These companies are mostly in biomedical sciences, a targeted industry sector for the development. During the year, we also announced the development of Riverside Quay, a 5.7-hectare mixed-use development on Sino-Singapore Nanjing Eco Hi-tech Island in Nanjing, Jiangsu province. The development will offer both high-end residential apartments for sale and industrial office space for lease. It will also house the Nanjing International Water Hub, a cluster of industrial offices targeted at technology, research and development, engineering as well as commercial players in the water industry.
Sembcorp’s Urban Development business has a portfolio of 13 industrial parks and integrated townships, spanning more than 10,000 hectares in key emerging markets. With over two decades’ track record, the business has attracted over US$18 billion in direct investments, as well as more than 800 multinational and leading local
corporations as customers. Going forward, we will continue to expand our orderbook and land bank and focus on execution, while positioning ourselves to extract further value through commercial and residential projects within our developments.
A Global CompanyAt Sembcorp, our vision is to be a global company and a leader in our industry sectors, by responsibly operating and excelling in sustainable businesses that support development, improve the quality of life and deliver long-term value.
Key to our resilience, ability to deliver and capacity for growth, is our focus on what we view as the building blocks of a global company: People & Capabilities, Solutions & Innovation, and Governance & Discipline.
It is our firm belief that the success of our company is driven by the excellence of our people and our distinctive capabilities. To create and deliver long-term value, we recognise the need for a deep pool of talent, strong capabilities as well as world-class procedures and systems. In addition, to compete on a global scale, we need to have strong business models with industry-leading solutions that leverage technology and innovation. Above all, our strategies and actions need to be undergirded by a firm commitment to best practice governance and corporate responsibility.
In 2015, we continued to invest in strategic capability development. A good example of this
Our vision is to be a global company
and a leader in our industry sectors,
by responsibly operating and
excelling in sustainable businesses
that support development, improve
the quality of life and deliver long-
term value.
Key to our resilience, ability to
deliver and capacity for growth,
is our focus on what we view as
the building blocks of a global
company: People & Capabilities,
Solutions & Innovation, and
Governance & Discipline.

CHAIRMAN AND CEO’S STATEMENT
SEMBCORP INDUSTRIES ANNUAL REPORT 2015 1514 BUILDING THE FUTURE
was the enhancement of our renewable energy capabilities. In 2015, we not only increased our renewable energy capacity by 1,166 megawatts, but also increased the spread of our portfolio and capabilities, which now encompass wind, solar and biomass energy as well as energy- from-waste. Furthermore, we strengthened our specialist renewable energy teams at our corporate office as well as in China and India, to drive the business from both strategic and operational levels.
In addition, during the year we continued our drive to exploit technological developments for future growth, led by our board-level Technology Advisory Panel. We invested in platforms and partnerships that enable us to strengthen our technological edge, including a collaboration with Singapore’s Economic Development Board (EDB) to be the nation’s first industrial ‘living laboratory’. As a living laboratory, we will grant technology providers access to our facilities on Jurong Island for late-stage test-bedding and co-innovation of water and environmental technologies. We will also jointly invest up to S$8 million with EDB to support the commercialisation of research and development projects from pilot testing to market-ready stage.
In line with our strategy to accelerate growth in key emerging markets like China and India, we
continued to strengthen our in-country resources to enhance our competitive positioning in these fast-growing markets. In India, we established a new India headquarters in New Delhi to drive growth and manage our investments, governance and stakeholder relationships within the country. In China, we further strengthened our organisation with business development, project development and asset management capabilities. In recognition of our contribution to China’s sustainable growth, we were named a Top 10 ASEAN Company in China by the China-ASEAN Business Council during the year.
While we continue on our journey to become a global company, we recognise that enduring value cannot be created without an uncompromising commitment to good governance. Robust governance is a source of competitive advantage and the foundation of value protection and creation. That is why our focus continues to be on having a dynamic governance framework that enables policies and codes to be put into action. Governance and integrity need to be embraced as part and parcel of Sembcorp’s culture and DNA by our global team. We do not underestimate the importance nor the challenges of this endeavour, especially as we expand into new regions and operate in demanding geographies with complex risks.
Anchored by our group-wide code of business conduct, our commitment is to uphold the highest standards of governance and ethical practice in all our dealings, across all countries where we operate. In 2015, Sembcorp Industries launched an e-learning course for staff on our code of business conduct, which was rolled out in multiple languages both in Singapore and overseas. This is part of our continuing efforts to ensure that good governance is firmly entrenched in our company culture.
Likewise, we continued to roll out our plan to strengthen our management and governance of health and safety, enhancing engagement with all on-site personnel including that of our contractors. In spite of our efforts, it is with great regret that we
report four fatalities across our global operations in 2015. We had one fatality at our water operations in South Africa and another at the site of our power facility in India. In Singapore, our design and construction business and our Marine business, Sembcorp Marine, reported one fatality each. We are deeply saddened by these incidents. Every incident was investigated thoroughly to identify root causes and the necessary corrective actions have been taken. All efforts continue to be made to build a strong and pervasive safety culture and to ensure responsible and safe operations not just at these sites, but for all our operations. These incidents underscore that excellence in safety is an ongoing journey. We have made significant gains over the course of our safety journey but we have more to do.
A Note of Welcome and of ThanksOn behalf of the board, we would like to extend a warm welcome to Nicky Tan, who joined us as an independent director on November 1, 2015, and was appointed to the board’s Executive Committee on January 1, 2016. A valuable addition to the board, Mr Tan has served as a director of some of Singapore’s largest listed companies and brings with him a wealth of experience in corporate finance, audit as well as mergers and acquisitions.
We would also like to thank our staff for their dedication and commitment, and our shareholders, customers and other stakeholders for their continued support and trust. In 2015, we paid special tribute to the communities in which we operate. To mark Singapore’s golden jubilee and express our commitment to our local heritage and the environment, we pledged S$10 million to enhance the Cool House, a temperature-controlled glasshouse at the National Orchid Garden within the Singapore Botanic Gardens, a UNESCO World Heritage Site. We also celebrated the 20th anniversary of our Utilities business with a global Sembcorp Gives Back Day initiative,
which saw employees in more than 10 countries volunteering in aid of worthy causes in their local communities. These initiatives demonstrate our recognition that our success is made possible only by the trust our communities place in us. The vision of Sembcorp continues to be rooted in our passion to support development, improve the quality of life and deliver value to all our stakeholders.
As we take Sembcorp ahead, the road will not be without its challenges. We face the continued effects of a global slowdown as well as what could be a sustained period of low oil prices. Competition also continues to be intense.
However, we remain confident of the future. The world’s demand for energy, water and other urban solutions continues to grow. As a provider of these essential solutions with a focus on rapidly developing economies, we believe that Sembcorp is in the right businesses. With a strong track record and a focus on delivery, we are well-placed to capture these growth opportunities and benefit from these global megatrends.
Moving forward, we will continue to invest in our People & Capabilities, sharpen our Solutions & Innovation, and strengthen our Governance & Discipline. Led by a committed board and with the support of our staff and stakeholders, we are confident that Sembcorp will successfully navigate the challenges ahead, stay the course, and build a lasting future as a global company that delivers long-term value and growth.
Ang Kong HuaChairmanFebruary 17, 2016
Tang Kin FeiGroup President & CEOFebruary 17, 2016
We remain confident of the future.
The world’s demand for energy,
water and other urban solutions
continues to grow. As a provider
of these essential solutions with
a focus on rapidly developing
economies, we believe that
Sembcorp is in the right businesses.

SEMBCORP INDUSTRIES ANNUAL REPORT 2015 1716 BUILDING THE FUTURE
EMPLOYEESSHAREHOLDERS
COMMUNITY
>7,000
in charitable contributions and community investments by the Group across our global operations
across our Group worldwide
GOVERNMENT & REGULATORS
Ranked 6th on the
Governance & Transparency Index 2015 out of 639 listed companies in Singapore
6th
S$7.1 million
CUSTOMERS & INDUSTRY PARTNERS
Vital partners to customers in
16 countries across
5 continents
Selected as an index component of the
Dow Jones Sustainability Asia / Pacific Index 2015
KEY FIGURES & HIGHLIGHTS
FOCUSED ON SHAREHOLDER VALUE
• Return on equity of 9.4%
• FY2015 total dividend of 11 cents per ordinary share
• Maintaining dividend payout ratio at 38%
Turnover S$9.5 billion
Net Profit S$549 million

1995 1997 1999 2001 2001 2003 2006 2009 2010 2011 2015
SINGAPORE
First utilities investment on Jurong Island, Singapore
Commenced utilities operations in Singapore
– pioneering the centralised utilities
model for industrial sites
Started operation of Singapore’s first
privately-developed cogeneration plant at Sakra, Jurong Island,
with a power capacity of 815 megawatts
Signed the landmark Gas Sales Agreement, becoming the first commercial importer and retailer of natural gas in Singapore
Pioneered water reclamation in Singapore, applied in the production of high-grade industrial water on Jurong Island
VIETNAM
First overseas utilities investment: the Phu My 3 independent power plant in Vietnam
UK
First major overseas acquisition: a centralised utilities business at Wilton International, Teesside, UK
UAE
Established first project in the Middle East with
Fujairah 1 combined power and water plant in the UAE, one of the world’s largest hybrid
desalination plants
INDONESIA THE PHILIPPINES
SOUTH AFRICA CHILE
PANAMA THE CARIBBEAN
Extended water operations to Southeast
Asia, South Africa and the Americas
OMAN
Entered Oman with the Salalah Independent Water and Power Plant
INDIA
Entered India’s fast-growing power sector with a supercritical coal-fired power plant in Andhra Pradesh
MYANMAR
Entry into Myanmar with the country’s
largest gas-fired power plant
BANGLADESH
Entered Bangladesh with a combined cycle
power plant, the country’s first public-
private partnership with a foreign investor
in the power sector
THE BIRTH OF SEMBCORP’S UTILITIES BUSINESS INTERNATIONAL GROWTH
CELEBRATING 20 YEARS OF SEMBCORP UTILITIES
2015 marks 20 years of partnership with industries, governments and communities and supporting development with essential energy and water solutions for Sembcorp Utilities
CHINA
Invested in Shanghai’s first combined cycle gas turbine cogeneration plant
Replicated the centralised utilities model in China with an industrial wastewater treatment plant in Nanjing

A LEADING DEVELOPER, OWNER AND OPERATOR OF ENERGY AND WATER ASSETS
Growing Sembcorp’s energy and water capacities worldwide
From a single location on Singapore’s Jurong Island, Sembcorp’s utilities business has grown to over 70 locations in 15 countries
PRODUCTS AND SERVICES
Energy
Water
On-site Logistics
Solid Waste Management
UK
UAE
Oman
India
Myanmar
Vietnam
Bangladesh
China
The Caribbean
South Africa
Indonesia
PhilippinesPanama
Chile
Singapore
TOTAL WATER CAPACITY WORLDWIDE (million m3/day)
0
2
4
6
10
8
1.4 million m3/day
>9 million m3/day
1995 2015
TOTAL POWER CAPACITY WORLDWIDE (MW)
0
2,000
4,000
6,000
8,000
10,000
12,000
815 MW
>10,600 MW
1995 2015
m3/day: cubic metres per dayMW: megawatts
CELEBRATING 20 YEARS OF SEMBCORP UTILITIES

SEMBCORP INDUSTRIES ANNUAL REPORT 2015 2322 BUILDING THE FUTURE
Sembcorp Industries is a leading energy, water and marine group
operating across five continents worldwide. With facilities of over
10,600 megawatts of gross power capacity and over nine million cubic
metres of water per day in operation and under development, Sembcorp is
a trusted provider of essential energy and water solutions to both industrial
and municipal customers. It is also a world leader in marine and offshore
engineering, as well as an established brand name in urban development.
WHO WE ARE
• A leading developer, owner and operator of energy and water assets with strong operational, management and technical capabilities
• A global leader in integrated marine and offshore engineering solutions with more than 50 years’ proven track record
• Over 20 years’ track record in undertaking master planning, land preparation and infrastructure development to transform raw land into urban developments
SEMBCORP UTILITIES 100%
MARINE FY2015 Key Figures**SEMBCORP MARINE 61%*
SEMBCORP DEVELOPMENT 100%
• Global leader in the provision of energy, water and on-site logistics to multiple industrial site customers
* As at December 31, 2015. Shareholding figures are calculated based on the number of issued ordinary shares excluding treasury shares** Figures taken at Sembcorp Marine level*** After S$609 million in impairment and provisions, and S$192 million share of losses from associates / joint ventures
• Operations in 15 countries with an established presence in Asia and a strong growing presence in emerging markets
• Focused on four key capabilities: rigs & floaters; repairs & upgrades; offshore platforms and specialised shipbuilding
• Significant land bank of integrated urban developments comprising industrial parks as well as business, commercial and residential space in Vietnam, China and Indonesia
• Strong track record in generating and supplying power, steam and natural gas, and providing total water and wastewater treatment solutions for industries and water-stressed regions
• Global network of strategic locations in Singapore, India, Indonesia, the UK and Brazil
• A valued partner to governments, with the ability to deliver the economic engine to support industrialisation and urbanisation by attracting local and international investments
SEMBCORP AT A GLANCE
TURNOVER
S$4.2bn US$3.0bn
PFO
S$948m US$675m
NET PROFIT
S$701m US$500m
TURNOVER
S$5.0bn US$3.5bn
PFO***
(S$342m) (US$243m)
NET PROFIT***
(S$290m) (US$206m)
UTILITIES FY2015 Key Figures
GROUP FY2015 Financial Snapshot
URBAN DEVELOPMENT FY2015 Key Figures
TURNOVER
S$8.0m US$5.7m
PFO
S$38m US$27m
NET PROFIT
S$34m US$24m
SEMBCORP UTILITIES 100%
TURNOVER
S$ 9.5 billionUS$6.8 billion
EBITDA
S$ 1.7 billionUS$1.2 billion
PROFIT FROM OPERATIONS (PFO)
S$ 631 millionUS$449 million
NET PROFIT
S$ 549 millionUS$391 million
TOTAL ASSETS
S$ 19.9 billionUS$14.2 billion

Governance, Risk and Compliance
Economic
Health, Safety and the Environment
Community
People
SEMBCORP AT A GLANCE
SEMBCORP INDUSTRIES ANNUAL REPORT 2015 2524 BUILDING THE FUTURE
OUTPUT
Financial Capital
Human Capital
Social and Relationship Capital
Manufactured Capital
Intellectual Capital
Natural Capital
e.g. cash flow from operations, internal funds and external short-term and long-term financing
e.g. people with deep knowledge and strong capabilities, and employees who embody the Sembcorp culture
e.g. relationships with stakeholders and Sembcorp’s brand and values
e.g. energy, water and other utilities facilities, and shipyards
e.g. intellectual property, technologies and proprietary solutions, group-wide policies and frameworks, and standardised systems and processes
e.g. thermal energy resources (such as coal and natural gas), renewable resources (such as wind, solar and biomass) and land
S$
HOW WE CREATE VALUE
Products and Services:
Utilities: • Energy in the form of power and steam, and natural gas
• Total water and wastewater treatment solutions• On-site logistics and solid waste management
Marine: Rigs & floaters; repairs & upgrades; offshore platforms
and specialised shipbuilding
Urban Development: Urban developments comprising industrial parks as
well as business, commercial and residential space
INPUT
Economic: Long-term value and growth
Governance, Risk and Compliance: High standards of behaviour and integrity
and best-in-class governance practices
People: A fair, diverse and inclusive workplace, and a deep pool of talent
Health, Safety and the Environment: A workplace culture that encompasses
sound and practical health and safety management, as well as good
environmental practices
Community: A positive contribution to our communities
through supporting development and improving the quality of life
MATERIAL ISSUES
People & Capabilities
Solutions & Innovation
Governance & Discipline
STRATEGIC FOCUS
KEY BUSINESSES
Utilities
Marine
Urban Development
VALUES Insight Integrity Integral
VISION
MISSION
Vital Partners.
Essential Solutions.
Our Value Creation Process

SEMBCORP AT A GLANCE
SEMBCORP INDUSTRIES ANNUAL REPORT 2015 2726 BUILDING THE FUTURE
UTILITIES
• Expand our global presence in key markets and rapidly developing economies, and build new capabilities to enhance competitiveness
• Grow our energy business with a balanced portfolio of high-efficiency thermal as well as renewable energy assets, including wind power, solar power and energy-from-waste assets
• Deliver specialised total water management solutions, including the upgrading of existing wastewater treatment plants and the provision of pre-treatment and other services
• Leverage our leadership in utilities supply for multiple customers on industrial sites
MARINE
• Offer diversified solutions for the marine and offshore industry, and expand into new businesses to capture existing and growth markets
• Enhance competitiveness through technology and innovation, including strategic investments in new solutions and the development and ownership of proprietary designs
• Leverage strong track record and integrated yard facilities for quality and on-time delivery to strengthen our position as a leading player in the global market
URBAN DEVELOPMENT
• Leverage our core competency in transforming raw land into self-sufficient urban developments and delivering the economic engine to support industrialisation and urbanisation
• Build on strong brand name to attract high-quality local and international investments
• Enhance value of our land bank, such as through the development of commercial and residential real estate at choice sites
Vital Partners. Essential Solutions.
• A firm commitment to best practice governance and corporate responsibility
• Disciplined execution and an accountable approach
GOVERNANCE &
DISCIPLINE
• Deep pool of talent and global employees
• A global mindset and shared values• Deep and strong capabilities, as well as
world-class procedures and systems
PEOPLE &
CAPABILITIES
• A leader in our industry sectors• Strong business models providing
distinctive solutions to customers• A clear competitive edge through
technology and innovation
SOLUTIONS &
INNOVATION
To be a global company, a leader in our industry sectors by responsibly operating and excelling in sustainable businesses that support development, improve the quality of life and deliver long-term value and growth.
As a vital partner to our customers, we leverage our group strength and sector expertise to deliver essential solutions that enable them to do their business better or improve the quality of life. In partnership with our stakeholders, we build sustainable businesses that deliver long-term growth and create value for all – our customers, employees, shareholders, partners and communities in which we operate.
Vision
Our Strategic Focus
Mission Our Strategy at a Glance

SEMBCORP AT A GLANCE
SEMBCORP INDUSTRIES ANNUAL REPORT 2015 2928 BUILDING THE FUTURE
WHAT GUIDES US
Our Values
Code of Business Conduct and Policies
Sembcorp Core Competency Framework
Our Governance Structure
ENTERPRISE RISK MANAGEMENT FRAMEWORK
BOARD OF DIRECTORS AND SENIOR MANAGEMENTProvide direction and oversight including risk appetite
INSIGHT
We excel as solution providers, pioneering and innovating in all
our businesses.
We solve problems with real understanding,
applying our expertise for best results.
INTEGRITY
We maintain the highest levels of integrity at
personal and corporate levels. This underpins
everything we do.
We can be trusted to deliver quality
and reliability.
INTEGRAL
We are an integrated business, a unified brand that always
delivers on what we promise.
We seamlessly provide essential solutions that
enhance the quality of life and help our customers to carry out their businesses better.
This makes us integral to the success of our customers.
At the core of how Sembcorp operates are our three values: Insight, Integrity, and Integral. Our values are translated into day-to-day action and practical behaviour through our group-wide policies and frameworks, creating within Sembcorp a common culture founded on these values.
We are guided by well-defined policies, frameworks and a code of business conduct, which express the high standards of behaviour and integrity that the company requires from our employees worldwide. These cover all facets of business and personal conduct across the Group, from governance, risk and compliance matters to ethics and employee conduct.
Sembcorp’s core competency framework is based on our values of Insight, Integrity and Integral and spells out the competencies and behaviours expected of a Sembcorp employee. The framework is deployed through recruitment, assessment, development and career progression, promoting transparency in what is expected of every Sembcorp employee.
STANDARDISED RISK MANAGEMENT AND INTERNAL CONTROL METHODOLOGY
Risk Identification Risk Analysis Risk Control Risk Monitoring
Fraud Risk Management and Ethics
• Fraud Risk Management Policy and Fraud Control Plan
• Whistle-blowing Policy
• Conflict of Interest Policy
• Code of Business Conduct
Business Development and Project Development
• Investment Approval Process
• Country Risk Framework
• Group Project Development Policy and Procedures
Asset Management and Health, Safety & Environment (HSE)
• Group HSE Framework and Guidelines
• Group Insurance Framework
• Group Asset Management Framework
• Business Continuity Plan
Business Support and Governance
• Group Treasury Policy
• Group Financial Authority Limits
• Group Internal Control Policy
Crisis and Reputation Management
• Group Crisis Management and Emergency Response Framework
• Group Crisis Communications Manual
GROUP-WIDE GOVERNANCE POLICIES, PROCEDURES AND FRAMEWORKS
GOVERNANCE ASSURANCE FRAMEWORKA robust assurance and reporting process
Management Assurance
Quarterly System of Financial Discipline
Senior Management
Risk Champions
Control Owners
Risk and Governance
Independent Assurance
Independent Audit

SEMBCORP INDUSTRIES ANNUAL REPORT 2015 3130 BUILDING THE FUTURE
2015 marked two decades for Sembcorp in the Utilities business and its continued
growth overseas. At the same time, the year witnessed a protracted oil and
gas downturn and uncertainties in Brazil. Sembcorp Group President & CEO
Tang Kin Fei reflects on Sembcorp’s performance for 2015 and shares his view
on the Group’s challenges and opportunities as well as his vision for its future.
Sembcorp’s Utilities business celebrated its 20th anniversary in 2015. Share with us your reflections as you look back on how this business has grown and your vision for its future.
It has been a very successful two decades for Sembcorp’s Utilities business. The business has performed well, and built up a strong income base. It is now a major pillar of the Sembcorp Group and a sizeable energy and water company, with over 10,600 megawatts of power and over 9 million
cubic metres of water per day in operation and under development.
From being primarily Singapore-based, the business has grown rapidly overseas. Today, our Utilities business operates in 15 countries. It has a proven track record of securing and completing projects and operating assets in emerging markets, including China, India, Oman and the UAE.
Over the years, the business has strengthened its capabilities and established new engines for growth. From our beginnings in gas-fired power plants, we now have a balanced portfolio of efficient thermal
and renewable energy assets running on gas, coal, wind, solar and energy-from-waste. We have also become the leader in industrial water and wastewater solutions, which are becoming increasingly relevant globally, especially in rapidly developing economies.
Sembcorp’s Utilities business is in a good position to grow. It is in the right businesses, with its focus on essential solutions, for which global demand continues to rise. It is also in the right markets, with its focus on rapidly developing economies.
For the last 20 years, the business has played the role of a valued partner to governments, communities and industries, helping to meet growing needs, enable development and improve the quality of life. We hope that it will continue to fulfil this role for many years to come, while delivering sustainable value and growth to the Group.
Sembcorp’s overseas business has been growing steadily. Tell us more about where you see future growth coming from.
Sembcorp’s growth focus is mainly on rapidly developing economies. The macroeconomics in these markets drive demand for our solutions with population growth, industrialisation and urbanisation. Trends such as increased infrastructure development, as well as greater emphasis on renewable energy and water stress and scarcity also create opportunities for us in these regions.
Our overseas growth strategy is on track. In 2015, our overseas business performed well, contributing close to 80% of our Utilities net profit, or 60% of Utilities’ net profit excluding corporate costs and significant items. Going forward, we expect it to grow even further.
In terms of key markets, we see potential for our India and China operations to grow into major profit contributors in the future. India has a positive medium to long-term economic outlook, with continued urbanisation, industrialisation and an expanding middle class. With over 3,500 megawatts of power capacity in operation and under development in India, we are in a good position to grow in both the thermal and renewable power sectors. In China, the government’s renewed commitment to environmental protection and support to increase renewable power capacity creates opportunities for us. Sembcorp provides total water solutions which help industries meet stringent regulations and support China’s sustainable development. In addition, we are also growing our niche power business in the country.
Other markets we view as having good potential include markets in ASEAN, such as Myanmar, Vietnam and Indonesia, as well as Bangladesh.
2015 was a tough year for your Marine business. What are your thoughts on this?
It has been a very challenging time for the Marine business. The downturn in the oil and gas market has affected yards around the world with a lack of new projects and requests to defer or cancel existing deliveries. In addition, our Marine business has been affected by uncertainties in Brazil, as well as by the financial difficulties of its customer Sete Brasil.
Tang Kin Fei Group President & CEO
CEO INTERVIEW
Our strategy is sound and as
a Group, we are in this for the
long haul.

CEO INTERVIEW
SEMBCORP INDUSTRIES ANNUAL REPORT 2015 3332 BUILDING THE FUTURE
In response, the business has adopted a prudent, conservative approach. It has made S$609 million in impairment and provisions for rigs, including S$329 million for the Sete Brasil projects and S$280 million for possible extended deferments or cancellations. Excluding the impairment and provisions for rigs and share of losses of associates and joint ventures, our Marine business made a net profit of S$384 million. Operationally, it will continue to maintain a focus on delivering projects on its orderbook in a timely and efficient manner, while keeping a tight rein on working capital and costs.
Despite the challenges in the immediate operating environment, we remain confident in the long-term fundamentals for the offshore and marine industry. As a diversified offshore and marine player, Sembcorp Marine is in a strong position to ride out the current down-cycle and capitalise on the market’s future recovery.
The business has built up a full spectrum of solutions and proprietary technologies as well as modern infrastructure to serve not only oil and gas exploration players, but also downstream players in the production, offshore support and export and import facilities segments. This diversified product offering makes for greater resilience, as seen from Sembcorp Marine’s securing S$3.2 billion of new contracts despite depressed market conditions, including two sizeable contracts worth around US$1 billion each from customers in the oil and gas production segment. The business has also invested wisely in new technologies and solutions and has best-in-class integrated facilities that enhance its productivity, efficiency and long-term competitiveness.
In short, I believe that Sembcorp Marine has taken measures that are appropriate and prudent
in response to the current challenges. In addition, it has the right strategy in place to ride out a protracted downturn and lay stronger foundations for its future.
At the end of the day, we must remember that down-cycles are not new to the industry. Having been in the business for more than 50 years, Sembcorp Marine has gone through many such cycles, and has always emerged stronger. I have no doubt that, as an integrated company, it will be able to weather this storm and any other challenges that it may face in the future.
Despite the challenges, you sound positive about the Sembcorp Group’s long-term future. Why is this?
I have confidence in Sembcorp’s future for several reasons.
First of all, our strategy is sound and as a Group, we are in this for the long haul. Sembcorp’s aim is to deliver long-term value and growth. Our focus has always been on developing robust business models and distinctive capabilities that will ensure that our businesses remain competitive and sustainable.
Our products and services are essential to communities and industries. These solutions will remain relevant as the world’s demand for energy, water and other urban solutions continues to grow.
Through our Utilities business, Sembcorp has built up a strong income base. In addition, our diversified portfolio, balanced across different businesses and geographies, also gives us strength and resilience as a Group.
Furthermore, Sembcorp is led by a committed board and management team, who are focused on shareholder value and on steering the company to maximise long-term returns. At present, we have a number of key priorities. Given the near-term challenges of the global downturn in the oil and gas sector and a competitive power market in Singapore, we recognise the need to manage costs tightly and to optimise our operations and resources, while maintaining flexibility through prudent financial management. At the same time, we will continue to ensure safe and excellent project development and execution.
Equally important though, is that we continue to build Sembcorp’s future as a global company. This means taking advantage of value-enhancing, strategically-attractive opportunities that may arise, and also building platforms for growth. In 2015 alone, we secured over 3,000 megawatts of new thermal and renewable energy projects that will broaden our income base. We also expanded our urban development land bank by over 300 hectares and clinched S$3.2 billion worth of contracts to add to our marine and offshore engineering orderbook.
In building the future for Sembcorp as a global company, what do you think are the key elements of success?
In building Sembcorp’s future as a global company, we have focused on strengthening ourselves in three key areas.
Firstly, we have invested in having the right people and capabilities to support our growth. We aim to nurture a strong multinational team with a global mindset, united by a common culture built on our company’s ethics and core values.
Secondly, we aim to build capabilities and develop world-class solutions and innovation. This not only entails strengthening our portfolio of assets and building new areas of expertise to ensure our market relevance, but also building competitive advantage through technology and innovation.
Thirdly, for Sembcorp to fulfil its fullest economic potential, we must continue to uphold robust governance and discipline. We firmly believe in acting with integrity in everything we do and wherever we operate. As a company, we are committed to best practice governance through well-defined governance, risk management and compliance policies and systems. We have also put in place a group-wide code of business conduct, which ensures that our various operations walk the talk. Furthermore, we aim to be a sustainable organisation that not only conducts our business responsibly, but also does so in a manner that creates value for all stakeholders and makes a positive contribution to our communities.
These elements will underpin our success in building Sembcorp as a global company, and will equip us to create and deliver value to our shareholders for years to come.
Through our Utilities business,
Sembcorp has built up a strong
income base. In addition, our
diversified portfolio, balanced
across different businesses and
geographies, also gives us strength
and resilience as a Group.

34 BUILDING THE FUTURE SEMBCORP INDUSTRIES ANNUAL REPORT 2015 35
BOARD OF DIRECTORS
MARGARET LUINon-executive & Non-independent Director
TANG KIN FEIGroup President & CEO
DR TEH KOK PENGNon-executive & Independent Director
BOBBY CHIN YOKE CHOONGNon-executive & Independent Director
AJAIB HARIDASSNon-executive & Independent Director
THAM KUI SENGNon-executive & Independent Director
NEIL MCGREGORNon-executive & Non-independent Director
NICKY TANNon-executive & Independent Director
TAN SRI MOHD HASSAN MARICAN Non-executive & Independent Director
ANG KONG HUAChairmanNon-executive & Independent Director

BOARD OF DIRECTORS
SEMBCORP INDUSTRIES ANNUAL REPORT 2015 3736 BUILDING THE FUTURE
ANG KONG HUAChairman Non-executive & Independent DirectorAppointed February 26, 2010
As Chairman, Mr Ang is responsible for leading the board, setting its agenda and ensuring its effectiveness in all aspects of its role. Mr Ang heads the board’s Executive Committee, Executive Resource & Compensation Committee, Nominating Committee and the Technology Advisory Panel.
A well-known corporate figure in Singapore, Mr Ang brings to Sembcorp many years of rich experience in the manufacturing and services sectors, including the chemicals, electronics, engineering and construction sectors. Currently, he serves on the board of GIC, which manages Singapore’s external reserves, as well as the board of Southern Steel.
Mr Ang holds a BSc (Honours) in Economics from the University of Hull, UK.
Past directorships in listed companies and major appointments 2013–2015:
• Global Logistic Properties
TANG KIN FEI Group President & CEOAppointed May 1, 2005
Mr Tang is Group President & CEO of Sembcorp Industries. He also sits on the board of Sembcorp Marine, a listed subsidiary of Sembcorp Industries, as a non-executive director.
With close to 30 years at Sembcorp, Mr Tang is credited with spearheading its growth into a focused energy, water and marine group with operations across five continents.
Mr Tang is an executive committee member and Vice Chairman of the Singapore Business Federation’s council, as well as a council member
of the Singapore Chinese Chamber of Commerce & Industry. He serves on several China-Singapore and Middle East-Singapore business councils and is a director and member of the governing board of the Cambridge Centre for Advanced Research in Energy Efficiency in Singapore, a research centre set up by the University of Cambridge in collaboration with Singapore universities and the National Research Foundation to study carbon assessment and abatement for the petrochemical industry. Mr Tang sits on the board of the Defence Science and Technology Agency of Singapore, chairs the college advisory board of Nanyang Technological University’s College of Engineering and is also Council Chairman of Ngee Ann Polytechnic. In addition, he is Vice Chairman and a trustee of the Kwong Wai Shiu Hospital, a charitable hospital which provides care for needy patients.
Mr Tang holds a First Class Honours degree in Mechanical Engineering from the University of Singapore and completed the Advanced Management Programme at INSEAD.
BOBBY CHIN YOKE CHOONGNon-executive & Independent DirectorAppointed December 1, 2008
Mr Chin chairs the Audit Committee and is a member of the board’s Risk Committee and Nominating Committee.
Mr Chin was the managing partner of KPMG Singapore for 13 years until his retirement in 2005. He is a member of Singapore’s Council of Presidential Advisers and sits on the boards of various listed companies, including AVJennings, Singapore Telecommunications, Ho Bee Land and Yeo Hiap Seng.
Mr Chin is also Chairman of NTUC Fairprice Co-operative, Deputy Chairman of NTUC Enterprise Co-operative and the Housing and Development
Board, as well as a board member of the Singapore Labour Foundation and Temasek Holdings.
Mr Chin holds a BAcc from the University of Singapore and is an associate member of the Institute of Chartered Accountants in England and Wales.
Past directorships in listed companies and major appointments 2013–2015:
• Oversea-Chinese Banking Corporation
MARGARET LUI Non-executive & Non-independent DirectorAppointed June 1, 2010
Mrs Lui is a member of the board’s Executive Committee, Executive Resource & Compensation Committee, as well as its Nominating Committee.
She is Chief Executive Officer and a board member of Azalea Asset Management. In addition, Mrs Lui is a member of the Singapore Exchange’s listings advisory committee. She serves on the board of trustees and finance committee of the Singapore Institute of Technology (SIT), and heads its investment committee. She also chairs the marine services supervisory committee of PSA International.
Mrs Lui holds a BAcc from the National University of Singapore (NUS). She attended the Advanced Management Programme at the Wharton School of the University of Pennsylvania.
Past directorships in listed companies and major appointments 2013–2015:
• Singbridge Holdings• Singbridge International Singapore• Singapore Cruise Centre
TAN SRI MOHD HASSAN MARICANNon-executive & Independent DirectorAppointed June 16, 2010
Tan Sri Mohd Hassan Marican serves on the board’s Executive Resource & Compensation Committee and Nominating Committee. He is Chairman of Sembcorp Marine, a listed subsidiary of Sembcorp Industries.
Formerly President & CEO of Malaysia’s Petroliam Nasional (PETRONAS) from 1995 until his retirement in February 2010, Tan Sri Mohd Hassan Marican brings to the board over 30 years’ experience in the energy sector, as well as in finance and management. He is Chairman of Singapore Power, Pavilion Energy, Pavilion Gas and Lan Ting Holdings and a director of the Regional Economic Development Authority of Sarawak, Sarawak Energy, Lambert Energy Advisory and MH Marican Advisory. He is also a senior international advisor at Temasek International Advisors.
Tan Sri Mohd Hassan Marican holds an honorary doctorate from the University of Malaya and is a fellow of the Institute of Chartered Accountants in England and Wales.
Past directorships in listed companies and major appointments 2013–2015:
• ConocoPhillips

BOARD OF DIRECTORS
SEMBCORP INDUSTRIES ANNUAL REPORT 2015 3938 BUILDING THE FUTURE
THAM KUI SENGNon-executive & Independent DirectorAppointed June 1, 2011
Mr Tham is a member of the board’s Audit Committee and Risk Committee.
Formerly Chief Corporate Officer at CapitaLand, Mr Tham brings to the board a strong background in management in various industries, including a decade’s experience in the real estate sector.
Currently, Mr Tham is a director on the boards of Banyan Tree Holdings, Global Logistic Properties, The Straits Trading Company, Straits Real Estate, Avanda Investment Management and Sembcorp Properties. He is a member of the board of Singapore Land Authority, as well as a corporate advisor at Temasek International Advisors.
Mr Tham holds a First Class Honours degree in Engineering Science from the University of Oxford.
Past directorships in listed companies and major appointments 2013–2015:
• CapitaLand China Holdings• SPI (Australia) Assets• Housing & Development Board• Maxwell Chambers
DR TEH KOK PENGNon-executive & Independent DirectorAppointed October 15, 2012
Dr Teh is a member of the board’s Audit Committee, Executive Resource & Compensation Committee and Technology Advisory Panel.
Dr Teh is a senior advisor to China International Capital Corporation. He serves on the boards of companies including Oversea-Chinese Banking Corporation, and as a director of organisations such as the S Rajaratnam Endowment, NUS and NUS’s East Asian Institute. Previously, Dr Teh served
as Advisor to GIC’s Group Executive Committee, Chairman of GIC’s China Business Group, and Chairman of Ascendas. He was also formerly President of GIC Special Investments, Deputy Managing Director of GIC, Deputy Managing Director of the Monetary Authority of Singapore and an economist at the World Bank.
Dr Teh holds a First Class Honours degree in Economics from La Trobe University, Australia and a PhD in Economics from the University of Oxford. He also completed the Advanced Management Programme at Harvard Business School.
Past directorships in listed companies and major appointments 2013–2015:
• China International Capital Corporation• Ascendas • Lee Kuan Yew School of Public Policy
AJAIB HARIDASSNon-executive & Independent DirectorAppointed May 1, 2014
Mr Haridass chairs our board’s Risk Committee and is a member of the Audit Committee. In addition, Mr Haridass is an independent director of Sembcorp Marine, chairman of the Sembcorp Marine nominating committee and a member of a number of its board committees.
With close to 40 years of legal experience, Mr Haridass specialises in maritime law and deals with commercial and banking litigation. Currently a consultant with Haridass Ho & Partners, a legal firm he founded in 1985, Mr Haridass is a panel member of the Singapore International Arbitration Centre and the Singapore Chamber of Maritime Arbitration, an accredited mediator of the Singapore Mediation Centre, as well as a referee of the Small Claims Tribunal of the State Courts of Singapore (formerly known as the Subordinate Courts). He is
a Commissioner for Oaths, a Notary Public and a Justice of the Peace. He is also the lead independent director of Nam Cheong.
Mr Haridass holds a Bachelor of Laws (Honours) degree from the University of London and qualified as a Barrister-at-Law at the Honourable Society of the Middle Temple in London.
NEIL MCGREGORNon-executive & Non-independent DirectorAppointed May 1, 2014
Mr McGregor is a member of the board’s Risk Committee.
He brings to the board 40 years of expertise in capital markets and the energy and infrastructure sectors, as well as experience in markets across Europe, Asia and Oceania.
Mr McGregor is a director of Singapore LNG Corporation, Clifford Capital, Certis CISCO Security and NUS’s Energy Studies Institute. He is Senior Managing Director of Temasek Holdings’ Enterprise Development Group and also a fellow of the Singapore Institute of Directors.
Mr McGregor holds a BEng (Honours) from the University of Auckland, an MBA in International Finance from the University of Otago, New Zealand, and has completed the Advanced Management Programme at INSEAD.
NICKY TANNon-executive & Independent DirectorAppointed November 1, 2015
Mr Tan is a member of the board’s Executive Committee.
He brings to Sembcorp rich experience in corporate finance, audit and mergers
and acquisitions. Currently, Mr Tan runs nTan Corporate Advisory, a boutique corporate finance and corporate restructuring firm. Over the course of his career, he has been Partner and Head of Global Corporate Finance at Arthur Andersen Singapore and ASEAN, Partner and Head of Financial Advisory Services at PricewaterhouseCoopers Singapore, as well as Chairman of Financial Advisory Services at PricewaterhouseCoopers Asia Pacific.
Mr Tan is an independent director of National University Health System (NUHS) and sits on its executive board committee and audit and risk committee. He is also a trustee and investment committee chairman of the National Cancer Centre Research Fund, as well as a director of SingTel Innov8. In addition, Mr Tan is a member of the Nee Soon Town Council, chairman of its investment and finance committee, as well as a member of the school management committee of Pei Chun Public School.
Mr Tan qualified as a chartered accountant in the UK and is a member of the Institute of Chartered Accountants in England and Wales, as well as the Institute of Singapore Chartered Accountants.
Past directorships in listed companies and major appointments 2013–2015:
• Fraser and Neave

SEMBCORP INDUSTRIES ANNUAL REPORT 2015 4140 BUILDING THE FUTURE
TECHNOLOGY ADVISORY PANEL
Sembcorp’s Technology Advisory Panel advises the company on
technological developments in line with its growth strategies.
The panel oversees the development and application of significant
emerging and potentially disruptive technologies to enhance
Sembcorp’s position as a leading energy and water company, and
ensures the appropriate management of specialised research and
development projects and systems for intellectual property creation
and protection. In addition, the panel reviews and approves the vision
and strategy for technology developments at Sembcorp, including
projects or technologies identified for research and development,
and advises Sembcorp’s leadership on technological trends and
opportunities. Members of the panel also introduce new and
emerging technologies and companies to the Group and regularly
advise on topical issues and technologies in their respective fields
of interest and expertise.
ANG KONG HUAChairman
DR JOSEPHINE KWA LAY KENG
TANG KIN FEI
DR NG HOW YONG PROF LUI PAO CHUEN
DR TEH KOK PENG

TECHNOLOGY ADVISORY PANEL
SEMBCORP INDUSTRIES ANNUAL REPORT 2015 4342 BUILDING THE FUTURE
ANG KONG HUAChairman BSc (Honours) in Economics, University of Hull, UK
Mr Ang chairs the Technology Advisory Panel and is also Chairman of our board. A well-known corporate figure in Singapore, he brings with him many years of rich experience in the manufacturing and services sectors, including the chemicals, electronics, engineering and construction sectors. He also serves on the boards of GIC and Southern Steel.
TANG KIN FEI BEng (First Class Honours) in Mechanical Engineering,
University of Singapore
Advanced Management Programme, INSEAD
Mr Tang is Group President & CEO of Sembcorp Industries. With close to 30 years at Sembcorp, he is credited with spearheading its growth into a focused energy, water and marine group with operations across five continents, and brings to the panel in-depth knowledge of the Group’s businesses. Mr Tang is a director and member of the governing board of the Cambridge Centre for Advanced Research in Energy Efficiency in Singapore, a research centre set up by the University of Cambridge in collaboration with Singapore universities and the National Research Foundation to study carbon assessment and abatement for the petrochemical industry. He is also Chairman of the college advisory board of Nanyang Technological University’s College of Engineering, Council Chairman of Ngee Ann Polytechnic and previously served as President of the Singapore Water Association.
DR TEH KOK PENGPhD in Economics, University of Oxford
BA (First Class Honours) in Economics, La Trobe University, Australia
Advanced Management Programme, Harvard Business School
Dr Teh sits on our board as a non-executive and independent director. He is also a senior advisor to China International Capital Corporation. He serves on the boards of companies including Oversea-Chinese Banking Corporation, as well as organisations such as the S Rajaratnam Endowment, the National University of Singapore (NUS) and NUS’s East Asian Institute. Previously, Dr Teh served as Advisor to GIC’s Group Executive Committee, as well as Chairman of GIC’s China Business Group, and Chairman of Ascendas. He was also formerly President of GIC Special Investments, where he oversaw investments in infrastructure and international venture funds, among other areas.
DR JOSEPHINE KWA LAY KENG PhD in Mechanical Engineering, University of Leeds, UK
BSc (Honours) in Mechanical Engineering, University of Leeds, UK
Dr Kwa is Chairman of Raffles Marina Holdings, a director of Southern Steel and a member of the Management Board of NUS’s Energy Studies Institute. She was formerly Chief Executive Officer of NSL, and had served in various functions during her 23 years as Chief Operating Officer and Head of Technology within the NSL Group. As Head of Technology, Dr Kwa was responsible for the information technology, environment and research and development functions in the company.
DR NG HOW YONGPhD in Environmental Engineering,
University of California Berkeley, USA
BEng (First Class Honours) in Civil Engineering,
National University of Singapore
Dr Ng is an associate professor, Dean’s Chair and Director of the Centre for Water Research under NUS’s Department of Civil and Environmental Engineering. He has over 20 years of experience in biological wastewater treatment and membrane processes for water reuse and seawater desalination, and has served as a consultant on municipal wastewater treatment & reuse, industrial effluent treatment and seawater desalination in Singapore, China, Japan and the USA. Dr Ng is also a fellow of the International Water Association (IWA) and a member of the Management Committee of the IWA Specialist Group on Membrane Technology.
PROF LUI PAO CHUENMSc in Operations Research and Systems Analysis,
Naval Postgraduate School, USA
BSc in Physics, University of Singapore
Formerly Singapore’s Chief Defence Scientist, Prof Lui has several decades’ experience in engineering, science and research. He is an advisor to Singapore’s National Research Foundation and various government organisations, chairs the Environment & Water Industry Development Council’s project evaluation panel and sits on the boards of research institutes, corporations and technical organisations, including the Executive Committee for Environmental and Water Technologies.
Prof Lui is a professor at NUS, a fellow of the Singapore Academy of Engineering and the Singapore National Academy of Sciences and an honorary fellow of the ASEAN Federation of Engineering Organisations. His major science and technology awards include the National Science & Technology Medal, the Institute of Physics Singapore’s President’s Medal, as well as the International Council on Systems Engineering’s Pioneer Award. In addition, Prof Lui is the recipient of the Lifetime Engineering Achievement Award from the Institution of Engineers Singapore, the Defence Technology Medal (Outstanding Service) from the Ministry of Defence, as well as the Aviation Pioneer Award from the Singapore Institute of Aviation Engineers.

SEMBCORP INDUSTRIES ANNUAL REPORT 2015 4544 BUILDING THE FUTURE
TANG KIN FEIGroup President & CEO
KOH CHIAP KHIONGGroup Chief Financial Officer
WONG WENG SUNPresident & CEOSembcorp Marine
TAN CHENG GUANExecutive Vice President & HeadGroup Business Development & Commercial, Utilities
NG MENG POHExecutive Vice President & HeadGroup Asset Management, Utilities
KELVIN TEOCEOSembcorp Development
CORPORATE KEY BUSINESS MANAGEMENT
ChinaMichael Lim TianHeadBusiness Development & Commercial Asset Management (Renewables)Sembcorp Utilities
Jason ChanHead Asset Management (Water)Sembcorp Utilities
IndiaVipul TuliCEO & Country HeadSembcorp India
Atul NargundCEOThermal Powertech Corporation IndiaSembcorp Gayatri Power
Sunil GuptaActing CEOSembcorp Green Infra
BangladeshTan Poh TeckManaging DirectorSembcorp North-West Power Co
ASEANYong Yoon ChoTechnical DirectorPhu My 3 BOT Power Co, Vietnam
Dennis FooGeneral ManagerSembcorp Myingyan Power Co, Myanmar
Middle East & South AfricaLim Yeow KeongGeneral ManagerSembcorp Salalah O&M Services Co, Oman
Bernard HonGeneral ManagerSembcorp Gulf O&M Co, UAE
Marius Van AardtManaging DirectorSembcorp Silulumanzi, South Africa
Shyam P MisraManaging DirectorSembcorp Siza Water, South Africa
UKStephen HandsActing Site DirectorSembcorp Utilities (UK)
Latin AmericaFrederic GautheronGeneral ManagerChile, Panama and the Caribbean
URBAN DEVELOPMENTKelvin TeoCEOSembcorp Development
Tang Tat KwongDeputy CEOSembcorp Development
Dr Hong DechengCEOSembcorp Properties, China & Vietnam
DESIGN & CONSTRUCTIONYam Ah MeeManaging Director
MINTYip Pak LingSenior Vice President & Mint Director
UTILITIESGroup Business Development & CommercialTan Cheng GuanExecutive Vice President & Head
Richard QuekExecutive Vice President & HeadCommercial
Low Kian MinSenior Vice President
Nomi AhmadSenior Vice President
Renewable EnergySunil GuptaSenior Vice President & Head
Group Project DevelopmentJai ChongSenior Vice President
Jules ZhongSenior Vice President
Liew Yien PhinSenior Vice President
Group Asset ManagementNg Meng PohExecutive Vice President & Head
SingaporeDennis ChinSenior Vice President & HeadSembcorp Utilities
Jasmine TeoSenior Vice PresidentGroup Information Technology
Goh Han LengSenior Vice PresidentGroup Tax
Chong Choon LinSenior Vice PresidentGroup Technical Services (Energy) and Group Health, Safety and Environment (HSE)
Fang Hai JunHeadGroup Technical Services (Water)
Siah Keng BoonChief Technology Officer Group Technology
Lee Swee CheeChief Risk Officer
Group Internal AuditDavid WongVice President
SENIOR EXECUTIVES
Corporate HeadquartersKoh Chiap KhiongGroup Chief Financial Officer
Vipul TuliExecutive Vice President & HeadGroup StrategyCEO & Country HeadSembcorp India
Lim Suet BoeyExecutive Vice President & General CounselGroup Legal
Kwong Sook MayCompany Secretary
Frank KohSenior Vice PresidentGroup Corporate Finance
Ng Lay SanSenior Vice PresidentGroup Corporate Relations
Lillian LeeSenior Vice PresidentGroup Human Resources
MARINEWong Weng SunPresident & CEOSembcorp Marine
Ong Poh KweeChief Operating OfficerSembcorp Marine
Wang ZijianHeadSingapore Yard Operations
Wong Lee LinHeadRepairs & Upgrades
William GuHeadRigs & Floaters
Ho Nee SinHeadOffshore Platforms
Freddie WooHeadSpecialised Shipbuilding
Altaf HossainPresidentEstaleíro Jurong Aracruz, Brazil
Ng Thiam PohPresident DirectorKarimun Sembawang Shipyard, Indonesia
Ron ChiaPresident DirectorSMOE Indonesia
Paul ThomsonManaging DirectorSembmarine SLP, UK
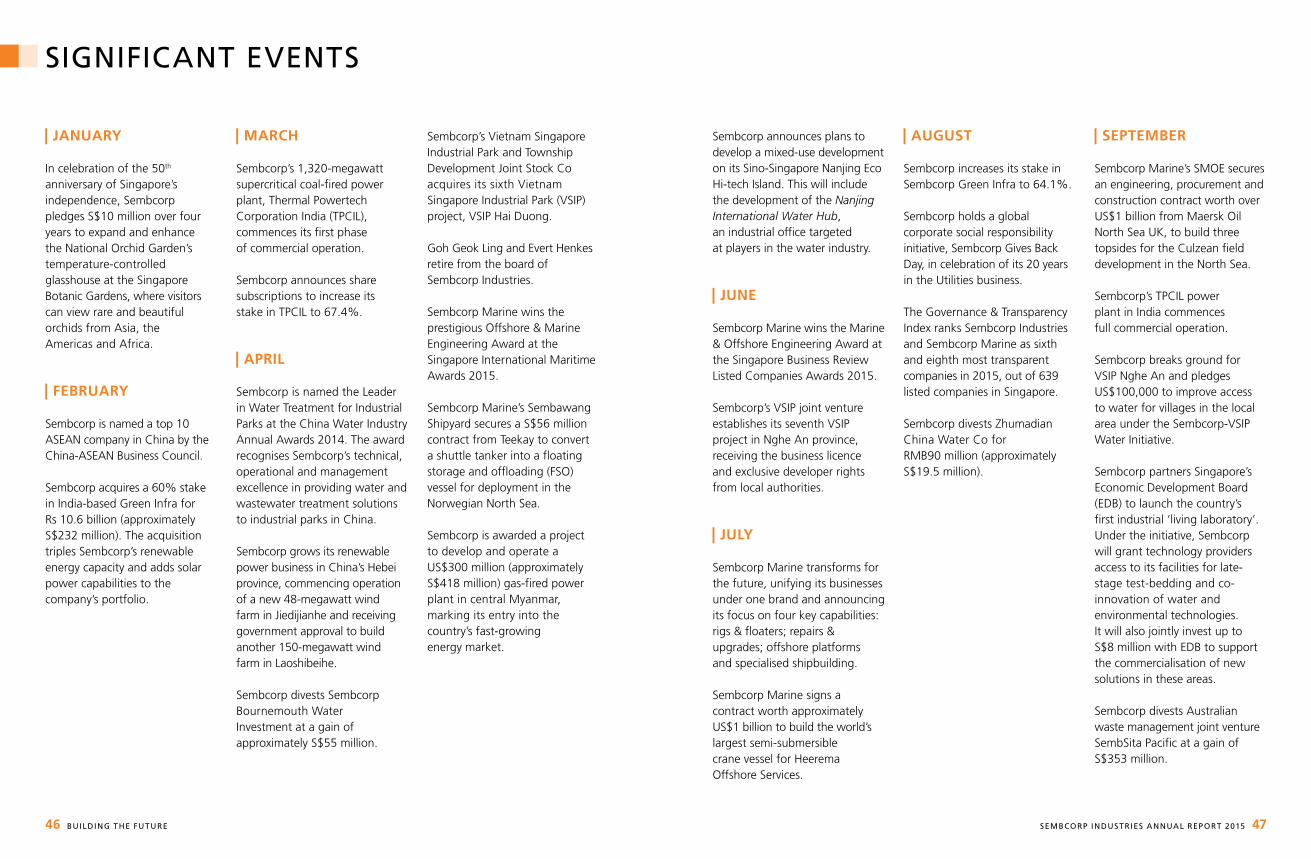
SEMBCORP INDUSTRIES ANNUAL REPORT 2015 4746 BUILDING THE FUTURE
SIGNIFICANT EVENTS
JANUARY In celebration of the 50th anniversary of Singapore’s independence, Sembcorp pledges S$10 million over four years to expand and enhance the National Orchid Garden’s temperature-controlled glasshouse at the Singapore Botanic Gardens, where visitors can view rare and beautiful orchids from Asia, the Americas and Africa.
FEBRUARY Sembcorp is named a top 10 ASEAN company in China by the China-ASEAN Business Council.
Sembcorp acquires a 60% stake in India-based Green Infra for Rs 10.6 billion (approximately S$232 million). The acquisition triples Sembcorp’s renewable energy capacity and adds solar power capabilities to the company’s portfolio.
MARCH Sembcorp’s 1,320-megawatt supercritical coal-fired power plant, Thermal Powertech Corporation India (TPCIL), commences its first phase of commercial operation.
Sembcorp announces share subscriptions to increase its stake in TPCIL to 67.4%.
APRIL Sembcorp is named the Leader in Water Treatment for Industrial Parks at the China Water Industry Annual Awards 2014. The award recognises Sembcorp’s technical, operational and management excellence in providing water and wastewater treatment solutions to industrial parks in China.
Sembcorp grows its renewable power business in China’s Hebei province, commencing operation of a new 48-megawatt wind farm in Jiedijianhe and receiving government approval to build another 150-megawatt wind farm in Laoshibeihe.
Sembcorp divests Sembcorp Bournemouth Water Investment at a gain of approximately S$55 million.
Sembcorp’s Vietnam Singapore Industrial Park and Township Development Joint Stock Co acquires its sixth Vietnam Singapore Industrial Park (VSIP) project, VSIP Hai Duong.
Goh Geok Ling and Evert Henkes retire from the board of Sembcorp Industries.
Sembcorp Marine wins the prestigious Offshore & Marine Engineering Award at the Singapore International Maritime Awards 2015.
Sembcorp Marine’s Sembawang Shipyard secures a S$56 million contract from Teekay to convert a shuttle tanker into a floating storage and offloading (FSO) vessel for deployment in the Norwegian North Sea.
Sembcorp is awarded a project to develop and operate a US$300 million (approximately S$418 million) gas-fired power plant in central Myanmar, marking its entry into the country’s fast-growing energy market.
Sembcorp announces plans to develop a mixed-use development on its Sino-Singapore Nanjing Eco Hi-tech Island. This will include the development of the Nanjing International Water Hub, an industrial office targeted at players in the water industry.
JUNE
Sembcorp Marine wins the Marine & Offshore Engineering Award at the Singapore Business Review Listed Companies Awards 2015.
Sembcorp’s VSIP joint venture establishes its seventh VSIP project in Nghe An province, receiving the business licence and exclusive developer rights from local authorities.
JULY Sembcorp Marine transforms for the future, unifying its businesses under one brand and announcing its focus on four key capabilities: rigs & floaters; repairs & upgrades; offshore platforms and specialised shipbuilding.
Sembcorp Marine signs a contract worth approximately US$1 billion to build the world’s largest semi-submersible crane vessel for Heerema Offshore Services.
AUGUST
Sembcorp increases its stake in Sembcorp Green Infra to 64.1%.
Sembcorp holds a global corporate social responsibility initiative, Sembcorp Gives Back Day, in celebration of its 20 years in the Utilities business.
The Governance & Transparency Index ranks Sembcorp Industries and Sembcorp Marine as sixth and eighth most transparent companies in 2015, out of 639 listed companies in Singapore.
Sembcorp divests Zhumadian China Water Co for RMB90 million (approximately S$19.5 million).
SEPTEMBER
Sembcorp Marine’s SMOE secures an engineering, procurement and construction contract worth over US$1 billion from Maersk Oil North Sea UK, to build three topsides for the Culzean field development in the North Sea.
Sembcorp’s TPCIL power plant in India commences full commercial operation.
Sembcorp breaks ground for VSIP Nghe An and pledges US$100,000 to improve access to water for villages in the local area under the Sembcorp-VSIP Water Initiative.
Sembcorp partners Singapore’s Economic Development Board (EDB) to launch the country’s first industrial ‘living laboratory’. Under the initiative, Sembcorp will grant technology providers access to its facilities for late-stage test-bedding and co-innovation of water and environmental technologies. It will also jointly invest up to S$8 million with EDB to support the commercialisation of new solutions in these areas.
Sembcorp divests Australian waste management joint venture SembSita Pacific at a gain of S$353 million.

SIGNIFICANT EVENTS
48 BUILDING THE FUTURE SEMBCORP INDUSTRIES ANNUAL REPORT 2015 49
Sembcorp enters Bangladesh with a project to build, own and operate an approximately US$390 million (approximately S$547 million) gas-fired combined cycle power plant.
OCTOBER
Nicky Tan joins the Sembcorp Industries board.
NOVEMBER
Sembcorp Marine opens a state-of-the-art steel structure fabrication workshop, the largest of its kind in Southeast Asia.
Sembcorp Marine Rigs & Floaters secures a contract to build an FSO vessel for MODEC Offshore Production Systems (Singapore).
DECEMBER
Sembcorp signs an agreement with Myanmar’s Department of Electric Power Planning for the Myingyan independent power project.
Sembcorp successfully completes a 30 million imperial gallons per day expansion to the desalination facility of its Fujairah 1 Independent Water and Power Plant in the UAE.
Sembcorp forms a joint venture to invest in the 1,620-megawatt Anwen mine-mouth coal-fired power project in Chongqing, China.
Sembcorp employees with a mural they repainted at the Cerebral Palsy Alliance Singapore School
as part of Sembcorp Gives Back Day, a global initiative in aid of our communities.

l Economic Value Added 62
l Value Added and Productivity Data 63
l Critical Accounting Policies 63
l Financial Risk Management 63
l Treasury Management 67
l Facilities 67
l Borrowings and Issuance of Perpetual Securities 67
Utilities Review 70
Marine Review 80
Urban Development Review 88
Group Structure 52
Group Financial Review 54
l Group Financial Highlights 54
l Group Quarterly Performance 55
l Five-year Financial Performance Profile 56
l Turnover 60
l Net Profit 60
l Cash Flow and Liquidity 62
l Financial Position 62
l Shareholder Returns 62
Sembcorp’s utilities facilities on Jurong Island in Singapore
OPERATING AND FINANCIAL REVIEW

SEMBCORP INDUSTRIES ANNUAL REPORT 2015 5352 BUILDING THE FUTURE
UTILITIESSembcorp Utilities 100%
SINGAPORESembcorp Cogen 100%Sembcorp Power 100%Sembcorp Gas 70%Sembcorp NEWater 100%Sembcorp Renewables 100%
CHINASembcorp (China) Holding Co 100% Shanghai Cao Jing Co-generation Co 30%Sembcorp Nanjing SUIWU Co 95%Sembcorp NCIP Water Co 95%Zhangjiagang Free Trade Zone Sembcorp Water Co 80%Zhangjiagang Free Trade Zone Sembcorp Reclaimed Water Co 80%Sembcorp Lianyungang Water Co 80%Sembcorp Qidong Water Co 95%Yancheng China Water Co 49%Guohua Sembcorp (Chenba’erhu) Wind Power Co 49%Guohua Sembcorp (Hulunbeier) Wind Power Co 49%Guohua Sembcorp (Xinba’erhu) Wind Power Co 49%Sembcorp Shenyang Water Co 80%Sembcorp Xinmin Water Co 90.9%Qitaihe Sembcorp Water Co 90.9%Yangcheng International Power Generating Co 25%Sembcorp Changzhi Water Co 100%Sembcorp Tianjin Lingang Industrial Area Wastewater Treatment Co 90%Guohua AES (Huanghua) Wind Power Co 49%Sembcorp Sanhe Yanjiao Water Co 94.3%ChongQing SongZao Sembcorp Electric Power Co 49%Sembcorp Qinzhou Water Co 80%Fuzhou Sembcorp Water Co 72%Sembcorp Jingmen Water Co 95%
INDIASembcorp India 100%Thermal Powertech Corporation India 67.4%Sembcorp Gayatri Power 49%Sembcorp Gayatri O&M Co 70%Sembcorp Green Infra 64.1%
INDONESIAAdhya Tirta Batam 50%Adhya Tirta Sriwijaya 40%
MARINESembcorp Marine 61%
SINGAPORESembcorp Marine Integrated Yard 100%Sembcorp Marine Rigs & Floaters 100%Sembcorp Marine Repairs & Upgrades 100%Sembcorp Marine Specialised Shipbuilding 100%Jurong Shipyard 100%SMOE 100%PPL Shipyard 85%Sembcorp Marine Technology 100%
BRAZILEstaleiro Jurong Aracruz 100%Jurong do Brasil Prestação de Serviços 100%
INDONESIASMOE Indonesia 90%Karimun Sembawang Shipyard 100%
INDIASembmarine Kakinada 40%
NORWAYGraviFloat 12%
UKSembmarine SLP 70%
USASembmarine SSP 100%
CHINACOSCO Shipyard Group 30%Shenzhen Chiwan Offshore Petroleum Engineering Co 35%
MYANMARSembcorp Myingyan Power Co 100%
PHILIPPINESSubic Water and Sewerage Co 30%
VIETNAMPhu My 3 BOT Power Co 66.7%
BANGLADESHSembcorp North-West Power Co 100%
OMANSembcorp Salalah Power and Water Co 40% Sembcorp Salalah O&M Services Co 70%Centralised Utilities Company 35%
UAE Emirates Sembcorp Water & Power Co 40%Sembcorp Gulf O&M Co 100%
SOUTH AFRICASembcorp Utilities (South Africa) 100% Sembcorp Silulumanzi 100% Sembcorp Siza Water 73.5%
NORWAYBiowater Technology 29.6%
UKSembcorp Utilities (UK) 100%Merseyside Energy Recovery 40%
ANTIGUASembcorp (Antigua) Water 100%
CHILESembcorp Utilities (Chile) 100%Sembcorp Aguas Chacabuco 100%Sembcorp Aguas Del Norte 100%Sembcorp Aguas Lampa 100%Sembcorp Aguas Santiago 100%
PANAMAAguas de Panama 100%
Sembcorp Environment 100%
SINGAPORESembWaste 100%Sembcorp Tay Paper Recycling 60%
* Figure reflects the effective equity held by the Group
*
GROUP STRUCTURE
URBAN DEVELOPMENTSembcorp Development 100%
VIETNAMVietnam Singapore Industrial Park JV Co 47.4%Vietnam Singapore Industrial Park & Township Development Joint Stock Co 45.2%VSIP Bac Ninh Co 45.2%VSIP Hai Phong Co 45.2%VSIP Quang Ngai Co 47.4%VSIP Hai Duong Co 45.2%VSIP Nghe An Co 47.4%VSIP-Sembcorp Gateway Development Co 50.4%
CHINAWuxi-Singapore Industrial Park Development Co 45.4%Sino-Singapore (Chengdu) Innovation Park Development Co 25%Sino-Singapore Nanjing Eco Hi-tech Island Development Co 21.5%Nanjing Riverside Quay Co 100%
INDONESIAKawasan Industri Kendal 49%
SINGAPORESembcorp Properties 100% Sembcorp Properties (China) 100%Sembcorp Infra Services 100%Sembcorp Development Indonesia 100% Gallant Venture 12%
Sembcorp Parks Management 75%
OTHER BUSINESSESSembcorp Design and Construction 100%Sembcorp EOSM 60%
Shenzhen Chiwan Sembawang Engineering Co 32%
Singapore Precision Industries / Singapore Mint 100%
This list of companies is not exhaustive.
The Utilities business also includes the SUT division of Sembcorp Industries.
Figures reflect shareholding as at February 29, 2016. Shareholding figures for entities listed under Sembcorp Utilities, Sembcorp Environment,
Sembcorp Marine and Sembcorp Development reflect stakes held by the above companies in these entities.

SEMBCORP INDUSTRIES ANNUAL REPORT 2015 5554 BUILDING THE FUTURE
GROUP FINANCIAL HIGHLIGHTS 2015 2014 Change (%)
For the Year (S$ million) Turnover 9,545 10,895 (12) Earnings before interest, tax, depreciation and amortisation 1,720 1,457 18Profit from operations 631 1,297 (51)– Earnings before interest and tax 625 1,139 (45)– Share of results: Associates & JVs, net of tax 6 158 (96) Profit before tax 426 1,246 (66) Net profit 549 801 (32)Economic value added (395) 525 NMReturn on total assets (%) 3.7 7.5 (50)Return on equity (%) 9.4 15.2 (38)
Capital Position (S$ million) Owners’ funds 5,630 5,414 4 Total assets 19,915 17,176 16 Net debt 5,227 3,082 70Operating cash flow (704) (19) NM Free cash flow (12) (29) 59Capital expenditure and equity investment 2,108 1,625 30 Total debt-to-capitalisation ratio 0.46 0.40 15 Total debt-to-capitalisation ratio (less cash and cash equivalents) 0.35 0.26 35 Interest cover (times) 7.2 20.8 (65)
Shareholder Returns Net assets per share (S$) 3.60 3.15 14 Earnings per share (cents) 29.17 44.31 (34)Dividends per share (cents) – Ordinary 11 16 (31) Payout ratio (%) 37.7 36.1 4Last traded share price (S$) 3.05 4.45 (31)Total shareholder returns (%) (28.8) (15.6) (85)
GROUP QUARTERLY PERFORMANCE (S$ MILLION) 2015 2014 1Q 2Q 3Q 4Q Total 1Q 2Q 3Q 4Q Total
Turnover 2,338 2,388 2,400 2,419 9,545 2,627 2,534 3,070 2,664 10,895 Earnings before interest, tax, depreciation and amortisation1 305 410 324 681 1,720 324 331 375 427 1,457 Profit from operations 254 364 207 (194) 631 301 298 322 376 1,297 – Earnings before interest and tax 214 305 186 (80) 625 247 254 297 341 1,139 – Share of results: Associates & JVs, net of tax 40 59 21 (114) 6 54 44 25 35 158 Profit / (Loss) before tax 228 314 150 (266) 426 287 286 315 358 1,246 Net profit 142 224 122 61 549 185 179 196 241 801 Earnings per share (cents) 7.83 12.19 6.29 2.86 29.17 10.25 9.87 10.86 13.33 44.31
1 Earnings before interest, tax, depreciation and amortisation exclude major non-cash items such as the effects of fair value adjustments, re-measurements, impairments and write-offs.
Turnover (S$ million)
0
3,000
6,000
9,000
12,000
2014
10,895
2015
9,545
PFO (S$ million)
0
300
(300)
600
900
1,200
1,500
2014
1,297
2015
825
631
(194)
Net Profit (S$ million)
0
300
600
900
2014
801
2015
549
n First quarter n Second quarter n Third quarter n Fourth quarter
GROUP FINANCIAL REVIEW

SEMBCORP INDUSTRIES ANNUAL REPORT 2015 57
GROUP FINANCIAL REVIEW
56 BUILDING THE FUTURE
2015Sembcorp posted a net profit of S$548.9 million and a turnover of S$9.5 billion for 2015 compared to S$801.1 million and S$10.9 billion in 2014 respectively.
In 2015, the Utilities business delivered a 72% growth in net profit to S$701.5 million compared to S$408.0 million in 2014. This increase was underpinned by growth from its overseas operations as well as gains from the sale of its Australian waste management joint venture and municipal water operations in the UK and Zhumadian, China.
Meanwhile, at the Sembcorp Industries level, the Marine business incurred a net loss of S$176.4 million in 2015 compared to a net profit of S$340.0 million in 2014. The Urban Development business posted a net profit of S$33.5 million compared to S$44.3 million in 2014.
Return on equity for the Group was 9.4% and earnings per share amounted to 29.2 cents.
2014Sembcorp delivered a healthy performance in 2014 amid challenging market conditions. Net profit for the year was S$801.1 million, while turnover stood at S$10.9 billion.
In 2014, the Utilities business reported a net profit of S$408.0 million, compared to S$449.9 million in 2013. The business achieved a 7% net profit growth in 2014 from 2013
excluding significant items recorded in 2013. These significant items comprised gains from the initial public offering of Sembcorp Salalah Power and Water Company (Sembcorp Salalah), offset by an impairment made for operations in the UK.
The Marine business contributed S$340.0 million to the Group’s net profit in 2014, compared to S$336.9 million in 2013. Meanwhile, the Urban Development business reported a net profit of S$44.3 million, compared to S$50.2 million in the previous year.
2013 Sembcorp delivered a robust performance for 2013. Net profit grew 9% to S$820.4 million from S$753.3 million in 2012, while turnover increased 6% to S$10.8 billion from S$10.2 billion the previous year.
In 2013, the Utilities business delivered strong profit growth of 20%, with net profit increasing to S$449.9 million from S$374.6 million in 2012, underpinned by solid growth from operations in China and gains from the initial public offering of Sembcorp Salalah, partially offset by an impairment made for operations in the UK.
The Marine business reported a net profit of S$336.9 million in 2013, up 3% from S$326.7 million in 2012. Meanwhile, the Urban Development business reported a 22% increase in net profit to S$50.2 million from S$41.1 million the previous year.
FIVE-YEAR FINANCIAL PERFORMANCE PROFILE
2015 2014 2013 2012 2011
For the Year (S$ million) Turnover 9,545 10,895 10,798 10,189 9,047 Earnings before interest, tax, depreciation and amortisation1 1,720 1,457 1,477 1,403 1,370 Profit from operations 631 1,297 1,315 1,266 1,272 – Earnings before interest and tax 625 1,139 1,160 1,103 1,101 – Share of results: Associates & JVs, net of tax 6 158 155 163 171 Profit before tax 426 1,246 1,214 1,155 1,271 Net profit 549 801 820 753 809
At Year End (S$ million) Property, plant and equipment and investment properties 8,706 7,749 5,148 5,180 4,273 Other non-current assets 3,602 3,297 2,916 2,510 2,263 Net current assets 1,661 773 788 1,028 1,520 Non-current liabilities (5,926) (4,587) (2,322) (3,074) (2,815)Net assets 8,043 7,232 6,530 5,644 5,241
Share capital and reserves (including perpetual securities) 6,433 5,616 5,230 4,503 4,115 Non-controlling interests 1,610 1,616 1,300 1,141 1,126 Total equity 8,043 7,232 6,530 5,644 5,241
Per Share Earnings (cents) 29.17 44.31 45.70 42.17 45.32Net assets (S$) 3.60 3.15 2.93 2.52 2.31Net ordinary dividends (including bonus dividends) (cents) 11 16 17 15 17
Financial Ratios Return on equity (%) 9.4 15.2 17.1 17.5 20.4 Return on total assets (%) 3.7 7.5 9.1 9.5 10.7 Interest cover (times) 7.2 20.8 12.5 10.0 20.9 Total debt-to-capitalisation ratio 0.46 0.40 0.23 0.30 0.29 Total debt-to-capitalisation ratio (less cash and cash equivalents) 0.35 0.26 Net cash 0.05 Net cash
1 Earnings before interest, tax, depreciation and amortisation exclude major non-cash items such as the effects of fair value adjustments, re-measurements, impairments and write-offs.
2012Sembcorp reported a net profit of S$753.3 million for the full year 2012, compared to S$809.3 million in 2011. Turnover grew 13% to S$10.2 billion from S$9.0 billion in the previous year.
In 2012, our Utilities business achieved a net profit of S$374.6 million, growing 23% from S$304.4 million in 2011. This was due to better performance from our Singapore operations, attributable to additional gas sales during the year.
Our Marine business contributed S$326.7 million in net profit for the year.
2011Sembcorp delivered a strong performance in 2011 compared to 2010. Net profit for the full year grew 2% to S$809.3 million from S$792.9 million in 2010, while turnover was up 3% to S$9.0 billion from S$8.8 billion in the previous year.
Our Utilities business delivered robust profit growth in 2011, with net profit growing 32% to S$304.4 million. The Marine business’ contribution to net profit was 13% lower at S$456.2 million, mainly due to fewer jack-up and semi-submersible rig projects. This was offset by the higher interest income received in 2011 for deferred payment granted to customers and write-back of prior years’ tax over-provisions.

GROUP FINANCIAL REVIEW
SEMBCORP INDUSTRIES ANNUAL REPORT 2015 5958 BUILDING THE FUTURE
Review by Business (S$ million) 2015 % 2014 % 2013 % 2012 % 2011 %
Turnover Utilities 4,227 44 4,850 44 5,095 47 5,615 55 4,893 54 Marine 4,968 52 5,831 54 5,523 51 4,428 44 3,957 44 Urban Development 8 – 7 – 9 – 12 – 9 – Others / Corporate 342 4 207 2 171 2 134 1 188 2 9,545 100 10,895 100 10,798 100 10,189 100 9,047 100 Profit from Operations Utilities 948 150 522 40 613 47 607 48 421 33 Marine (342) (54) 718 55 660 50 599 47 793 62 Urban Development 38 6 47 4 45 3 44 4 46 4 Others / Corporate (13) (2) 10 1 (3) – 16 1 12 1 631 100 1,297 100 1,315 100 1,266 100 1,272 100
Net Profit Utilities 701 128 408 51 450 55 375 50 304 38 Marine (176) (32) 340 42 337 41 327 43 456 56 Urban Development 34 6 44 6 50 6 41 6 39 5 Others / Corporate (10) (2) 9 1 (17) (2) 10 1 10 1 549 100 801 100 820 100 753 100 809 100
Turnover (S$ million)
0
3,000
6,000
9,000
12,000
201520142012 20132011
9,047 10,189
10,798 10,895
9,545
Net Profit (S$ million)
0
200
400
600
1,000
800 809 753 820 801
201420132011 2012
549
2015
n Bonus dividend of 2 cents per share
EBITDA (S$ million)
400
800
1,200
2,000
1,600
1,370 1,403 1,477 1,457
1,720
0
201420132011 2012 2015
Net Ordinary Dividend Per Share (cents)
5
10
15
20
1715
17
0
201420132011 2012
16
2015
11
PFO (S$ million)
300
600
900
1,500
1,2001,272 1,266
1,315 1,297
631
0
201420132011 2012 2015
ROE (%)
10
20
30
20.4 17.5 17.1
0
15.2
201420132011 2012
9.4
2015

GROUP FINANCIAL REVIEW
SEMBCORP INDUSTRIES ANNUAL REPORT 2015 6160 BUILDING THE FUTURE
OVERVIEWSembcorp posted a net profit of S$548.9 million and a turnover of S$9.5 billion for 2015 compared to S$801.1 million and S$10.9 billion in 2014 respectively.
TURNOVERThe Group achieved a turnover of S$9.5 billion, with the Utilities and Marine businesses contributing 96% of total turnover.
The Utilities business’ turnover was lower in 2015 compared to 2014, mainly due to lower gas offtake and lower high sulphur fuel oil prices recorded during the year, partially mitigated by higher contribution from India operations from the commencement of Thermal Powertech Corporation India Limited’s (TPCIL) operations and the acquisition of Green Infra Limited, later renamed Sembcorp Green Infra.
The Marine business’ turnover decreased over the previous year, mainly due to lower revenue recognition for rig building projects and lower average revenue per repair vessel despite the increase in the number of ships repaired. The
business’ reversal of revenue due to termination of a contract with a customer, customer deferment requests and a customer’s restructuring has resulted in lower revenue recognition for its rigs & floaters segment. For the offshore platforms segment, turnover was higher in 2015.
NET PROFIT The Group recorded a net profit of S$548.9 million in 2015 compared to S$801.1 million in 2014, while profit from operations was S$631.5 million, compared to S$1.3 billion in 2014.
In 2015, the Utilities business delivered a 72% growth in net profit to S$701.5 million compared to S$408.0 million in 2014, underpinned by growth from its overseas operations as well as gains from the sale of its Australian waste management joint venture and municipal water operations in the UK and Zhumadian, China.
The Marine business incurred a net loss of S$176.4 million in 2015 compared to a net profit of S$340.0 million in 2014. This net loss was mainly due to lower contribution from rig building projects resulting from write-downs of inventories and
work-in-progress, provision for foreseeable losses, customer deferment requests and restructuring, higher finance costs, impairment loss on available-for-sale financial assets and share of losses from associates. However, contribution from offshore platform projects was higher.
Meanwhile, the Urban Development business reported a net profit of S$33.5 million, compared to S$44.3 million in the previous year. In 2015, net profit from Corporate included a fair value loss of S$34.5 million due to the decline in the share price of Gallant Venture.
Performance Scorecard (S$ million) 2015 2014 Change (%)
Turnover 9,544.6 10.894.7 (12)EBITDA1 1,720.2 1,456.7 18PFO 631.5 1,297.1 (51)– EBIT 625.3 1,138.9 (45)– Share of results: Associates & JVs, net of tax 6.2 158.2 (96) PBT 426.4 1,246.4 (66) Net profit 548.9 801.1 (32) EPS (cents) 29.2 44.3 (34) ROE (%) 9.4 15.2 (38)
1 EBITDA excludes major non-cash items such as the effects of fair value adjustments, re-measurements, impairments and write-offs.
Turnover (S$ million)
2014 2015
n Utilities 4,850 4,227 n Marine 5,831 4,968 n Urban Development 7 8n Others / Corporate 207 342 10,895 9,545
0
3,000
6,000
9,000
12,000
2014
10,895
2015
9,545
PFO (S$ million)
2014 2015
n Utilities 522 948n Marine 718 (342)n Urban Development 47 38n Others / Corporate 10 (13) 1,297 631
250
500
750
1,500
1,250
1,000
1,297
986
(355)
2014 2015
(250)
(500)
0
631
Net Profit (S$ million)
2014 2015
n Utilities 408 701 n Marine 340 (176) n Urban Development 44 34 n Others / Corporate 9 (10) 801 549
150
300
450
900
600
750
801
735
(186)
2014 2015
(150)
(300)
0
549

GROUP FINANCIAL REVIEW
SEMBCORP INDUSTRIES ANNUAL REPORT 2015 6362 BUILDING THE FUTURE
CASH FLOW AND LIQUIDITYAs at December 31, 2015, the Group’s cash and cash equivalents stood at S$1.6 billion.
The cash outflow from changes in working capital was mainly due to Marine’s working capital for ongoing rig building projects.
Net cash outflow from investing activities for 2015 was close to S$1.3 billion, mainly for acquisition of renewable operations in India, purchase of Marine’s and Utilities’ property, plant and equipment, as well as Utilities’ acquisition of and additional investment in joint ventures, partially offset by the proceeds from the sale of its Australian waste management joint venture and municipal water operations in the UK and Zhumadian, China.
Net cash inflow from financing activities of S$1.9 billion for 2015 was mainly related to proceeds from issue of perpetual securities and net proceeds from borrowings, partially offset by dividends and interest paid.
FINANCIAL POSITION Group shareholders’ funds increased to S$5.6 billion as at December 31, 2015 from S$5.4 billion as at December 31, 2014.
The Group’s balance sheet included the consolidation of its renewable company, Sembcorp Green Infra, which was acquired in February 2015. During the year, the assets and liabilities of the municipal water operations in the UK and Zhumadian, China, were also de-consolidated following the divestment of these operations in April 2015 and August 2015 respectively. In December, Sembcorp Air Products was classified as a unit held for sale and accordingly, its assets and liabilities were classified as assets held for sale and liabilities held for sale respectively.
Non-current assets increased, primarily due to Utilities’ additional investment in India, partially
offset by the divestment of SembSita Pacific in November 2015.
Inventories and work-in-progress increased primarily due to payment terms of rig building projects. The recoverability of work-in-progress for jack-up rig projects is dependent on the customers taking delivery of the rigs in the future. The excess of progress billings over work-in-progress decreased, mainly due to the timing of billings for rig building projects.
Interest-bearing borrowings increased due to Marine’s borrowings for working capital and capital expenditure for its yards in Singapore and Brazil. Marine has secured adequate committed long-term banking facilities to refinance its short-term borrowings as they fall due. Meanwhile, TPCIL has facilities approved to refinance its short-term borrowings for its power plant with local currency financing.
SHAREHOLDER RETURNSReturn on equity for the Group was 9.4% and earnings per share amounted to 29.2 cents in 2015.
Subject to approval by shareholders at the next annual general meeting, a final ordinary one-tier tax-exempt dividend of 6.0 cents per share has been proposed for the financial year ending December 31, 2015. Together with an interim dividend of 5.0 cents per ordinary share paid in September 2015, this brings our total dividend for the year to 11.0 cents per ordinary share.
ECONOMIC VALUE ADDEDEconomic value added (EVA) was negative in 2015 mainly due to the loss for the period from the Marine business. Furthermore, EVA in 2015 also included the impact of new investments that are either not operating yet or in an early stage of operations.
VALUE ADDED AND PRODUCTIVITY DATA In 2015, the Group’s total value added was S$2.1 billion. This was absorbed by employees in wages, salaries and benefits of S$832 million, by governments in income and other taxes of S$137 million and by providers of capital in interest, dividends and distribution of S$551 million, leaving a balance of S$623 million reinvested in business.
CRITICAL ACCOUNTING POLICIESSembcorp’s financial statements are prepared in accordance with Singapore Financial Reporting Standards (FRSs).
With effect from January 1, 2015, the Group adopted the following new / amended FRSs, set out in the table below.
The adoption of the FRSs below (including consequential amendments) does not have any significant impact on the Group’s financial statements.
FINANCIAL RISK MANAGEMENTThe Group’s activities expose it to a variety of financial risks, including changes in interest rates, foreign exchange rates and commodity prices, as well as credit risk.
Please refer to the Risk Management and Internal Controls chapter of this report for details on the management of these risks.
Amendments to FRSs:
FRS 19 Employee Benefit Plans: Employee Contributions
Improvements to FRSs (January 2014):
FRS 16 Property, Plant and Equipment
FRS 38 Intangible Assets
FRS 24 Related Party Disclosures
FRS 102 Share-based Payment
FRS 103 Business Combinations
FRS 108 Operating Segments
Improvements to FRSs (February 2014):
FRS 103 Business Combinations
FRS 113 Fair Value Measurements
FRS 40 Investment Property

GROUP FINANCIAL REVIEW
SEMBCORP INDUSTRIES ANNUAL REPORT 2015 6564 BUILDING THE FUTURE
Value Added Statement (S$ million) 2015 2014 2013 2012 2011
Value Added from Turnover 9,545 10,895 10,798 10,189 9,047Less: Bought in materials and services (7,762) (8,557) (8,552) (8,008) (6,968)Gross value added 1,783 2,338 2,246 2,181 2,079 Investment, interest and other income 985 253 308 130 147Share of results of associates and joint ventures, net of tax 6 159 155 163 171Other non-operating expenses (631) (168) (95) (74) (53) 2,143 2,582 2,614 2,400 2,344 Distribution To employees in wages, salaries and benefits 832 871 916 781 739To governments in income and other taxes 137 211 182 136 144To providers of capital in: Interest on borrowings 238 70 118 140 66 Dividends to owners 285 393 268 304 304 Profit attributable to perpetual securities holders 28 9 4 – – 1,520 1,554 1,488 1,361 1,253 Retained in Business Depreciation and amortisation 405 315 303 282 235Deferred tax (credit) / expense (106) 26 (12) 23 9Retained profits 236 399 548 450 505Non-controlling interests (94) 283 277 280 337 441 1,023 1,116 1,035 1,086 Other non-operating expenses 182 5 10 4 5 623 1,028 1,126 1,039 1,091 Total Distribution 2,143 2,582 2,614 2,400 2,344
Economic Value Added (S$ million)
0
400
600
800
1,000
200
(200)
(400)
(600)
201420132011 2012
525
728621 619
2015
(395)
Gross Value Added (S$ million)
0
1,000
1,500
2,000
2,500
500
2,338
2,079 2,181 2,246
201420132011 2012
1,783
2015
Value Added Per Employee (S$ thousands)
0
100
150
200
50
131
201420132011 2012
146 142 129
95
2015
Profit After Tax Per Employee (S$ thousands)
0
60
80
100
40
20
201420132011 2012
61
81
67 63
2015
24

GROUP FINANCIAL REVIEW
SEMBCORP INDUSTRIES ANNUAL REPORT 2015 6766 BUILDING THE FUTURE
Productivity Data 2015 2014 2013 2012 2011
Average staff strength 18,676 17,806 17,401 15,343 14,194 Employment costs (S$ million) 832 871 916 781 739 Profit after tax per employee (S$’000) 24 61 63 67 81 Value added (S$ million) 1,783 2,338 2,246 2,181 2,079 Value added per employee (S$’000) 95 131 129 142 146 Value added per dollar employment costs (S$) 2.14 2.68 2.45 2.79 2.81 Value added per dollar investment in property, plant and equipment (S$) 0.15 0.22 0.30 0.30 0.33 Value added per dollar sales (S$) 0.19 0.21 0.21 0.21 0.23
The figures above reflect data for core businesses only.
TREASURY MANAGEMENTSembcorp Financial Services (SFS), the Group’s wholly-owned treasury vehicle, manages the Group’s financing activities, as well as its treasury activities in Singapore. SFS also oversees treasury activities outside of Singapore together with the respective businesses. In addition, SFS facilitates funding and on-lends funds borrowed by it to businesses within the Group, where appropriate.
SFS and our overseas treasury units actively manage cash within the Group by setting up cash pooling structures in various countries where appropriate, to take in surplus funds from businesses and lend it to those with funding requirements. We also actively manage the Group’s excess cash, deploying it to a number of financial institutions, and closely track developments in the global banking sector. Such proactive cash management continues to be an efficient and cost-effective way of managing the Group’s cash and financing its funding requirements.
FACILITIESAs at December 31, 2015, the Group’s total credit facilities, including the multi-currency debt issuance programme, amounted to S$18.8 billion (2014: S$14.5 billion). This comprised funded facilities of S$14.4 billion (2014: S$10.3 billion), including S$9.7 billion in committed facilities (2014: S$5.9 billion), and trade-related facilities of S$4.3 billion (2014: S$4.3 billion), including but not limited to bank guarantees, letters of credit, bid bonds and performance bonds. The increase over the previous year was mainly due to the Marine business’ new credit facilities to fund its Singapore and Brazil yards, new credit facilities for SFS to fund entities under the Group, additional credit facilities for our India thermal power business to fund the construction and operation of its power plants, as well as the consolidation of Sembcorp Green Infra’s credit facilities following our acquisition of the company in February 2015.
BORROWINGS AND ISSUANCE OF PERPETUAL SECURITIESIn May 2015, the Group issued S$600 million of perpetual securities under its S$2 billion multi-currency debt issuance programme, which was accounted for as equity. The Group aims to term out loans such that their maturity profile mirrors the operating life of our core assets, while continuing our focus on maintaining adequate liquidity for our businesses. We continue to build on our banking relationships to ensure that we are able to secure funding on competitive terms, as and when commercially viable and strategically attractive opportunities arise.
As at December 31, 2015, the Group’s gross borrowings amounted to S$6.8 billion (2014: S$4.7 billion). As compared to 2014, the increment of S$2.1 billion in gross borrowings was mainly due to new borrowings by Sembcorp Marine and our India thermal power business, as well as the inclusion of borrowings of newly acquired Sembcorp Green Infra.
The Group remains committed to balancing the availability of funding and the cost of funding, while maintaining prudent financial ratios. We also aim to maintain an efficient and optimal mix of committed and uncommitted facilities and fixed and floating rate borrowings. Of the overall debt portfolio in 2015, 66% (2014: 76%) constituted fixed rate debts that were not exposed to interest rate fluctuations. The lower ratio of fixed rate debt was mainly due to the addition of proportionately more floating rate debt that was used for working capital purposes.

GROUP FINANCIAL REVIEW
SEMBCORP INDUSTRIES ANNUAL REPORT 2015 6968 BUILDING THE FUTURE
Financing and Treasury Highlights (S$ million) 2015 2014 2013
Source of FundingCash and cash equivalents 1,606 1,661 2,256 Funded facilities (including multi-currency debt issuance programme) Committed funded facilities 9,687 5,868 3,277Less: Amount drawn down (6,864) (4,525) (1,991) Unutilised committed funded facilities 2,823 1,343 1,286Uncommitted funded facilities 4,748 4,383 4,625Less: Amount drawn down (768) (418) (116)Unutilised uncommitted funded facilities 3,980 3,965 4,509Total unutilised funded facilities 6,803 5,308 5,795 Trade-related facilities Facilities available 4,347 4,291 3,141Less: Amount used (2,337) (1,903) (1,589)Unutilised trade-related facilities 2,010 2,388 1,552 Funding ProfileMaturity profile Due within one year 1,801 1,086 414Due between one to five years 2,957 1,369 689Due after five years 2,075 2,288 804 6,833 4,743 1,907Debt mix Fixed rate debt 4,529 3,627 1,525Floating rate debt 2,304 1,116 382 6,833 4,743 1,907
Financing and Treasury Highlights (S$ million) 2015 2014 2013
Debt RatiosInterest cover ratio Earnings before interest, tax, depreciation and amortisation 1,720 1,457 1,477Interest on borrowings 238 70 118Interest cover (times) 7.2 20.8 12.5
D / C D / C D / C 2015 ratio 2014 ratio 2013 ratio
Debt / capitalisation (D/C) ratios Sembcorp Industries corporate debt 1,197 0.08 1,322 0.11 1,098 0.13Sembcorp Industries project finance debt 2,256 0.15 1,680 0.14 243 0.03Sembcorp Marine debt 3,380 0.23 1,741 0.15 566 0.07 Sembcorp Industries Group gross debt 6,833 0.46 4,743 0.40 1,907 0.23Less: Cash and cash equivalents (1,606) – (1,661) – (2,256) –Sembcorp Industries Group net debt / (cash) 5,227 0.35 3,082 0.26 (349) Net cash

70 BUILDING THE FUTURE SEMBCORP INDUSTRIES ANNUAL REPORT 2015 71
UTILITIES REVIEW• A leading developer, owner and operator of
energy and water assets with strong operational, management and technical capabilities
• Operations in 15 countries with an established presence in Asia and a strong growing presence in emerging markets
• Global leader in the provision of energy, water and on-site logistics to multiple industrial site customers
• A balanced global portfolio of high-efficiency thermal and renewable assets, with capabilities in gas, coal, wind, solar, biomass and energy-from-waste
• Solid track record in providing total water and wastewater treatment solutions for industries and water-stressed regions
Financial Indicators (S$ million) 2015 2014 Change (%)
Turnover 4,258.5 4,890.9 (13)Earnings before interest, tax, depreciation and amortisation 1,211.0 629.1 92Profit from operations 947.5 521.9 82– Earnings before interest and tax 825.8 432.9 91– Share of results: Associates & JVs, net of tax 121.7 89.0 37Net profit 701.5 408.0 72Return on equity (%) 21.4 14.4 49
Competitive Edge
Performance Scorecard
PFO* by Geographyn Singaporen Overseas
* Excluding Corporate and significant items
PFO* by Segmentn Energyn Watern On-site logistics & solid waste management
* Excluding Corporate and significant items
34% 66%
20%
18%
62%
Sembcorp’s wind power assets in Gujarat, India
Operational Indicators 2015 2014
Power capacity (megawatts) 10,616 7,879Steam capacity (tonnes per hour) 4,532 4,532Water & wastewater treatment capacity (cubic metres per day) 9,232,226 9,514,726
Note: Capacity refers to total gross capacity of facilities in operation and under development

UTILITIES REVIEW
72 BUILDING THE FUTURE SEMBCORP INDUSTRIES ANNUAL REPORT 2015 73
OPERATING AND FINANCIAL REVIEW
Good performance underpinned by overseas growth and divestment gains
Despite continued intense competition in the Singapore power market, the Utilities business continued to perform well in 2015, underpinned by overseas growth and divestment gains.
The business’ turnover was S$4.3 billion in 2015 compared to S$4.9 billion in 2014. Profit from operations (PFO) was S$947.5 million, an 82% increase from last year’s S$521.9 million, while net profit was S$701.5 million compared to S$408.0 million, representing a 72% increase year-on-year.
The increase in PFO and net profit was backed by divestment gains from the sale of our 40%
stake in Australian solid waste management joint venture SembSita Pacific, as well as municipal water operations in Bournemouth, UK and Zhumadian, China. These divestments created value for the business by unlocking a net gain of S$425.6 million and will allow us to recycle capital for investment in businesses and markets with high growth potential, in line with our focus on the energy and water sectors.
During the year, we exited the chemical feedstock business in Singapore and relooked the operating model on Jurong Island to optimise our operations following a reduction in demand. As a result, impairments were made for our steam assets, as well as some other assets relating to specific customers. This resulted in an impact of S$25.0 million on PFO and S$31.4 million on net profit. A S$24.3 million net allowance for doubtful debts was also made in China during the year.
Key Developments
First thermal power project in India, the 1,320-megawatt Thermal Powertech Corporation India facility, successfully commenced full commercial operations
Acquired a 64.1% stake in Green Infra, a leading renewable energy group with wind and solar power assets in six resource-rich states in India
Signed an agreement to develop and operate a 225-megawatt gas-fired power plant in Myanmar, marking Sembcorp’s first investment in the country
Established a foothold in Bangladesh with the development of a 426-megawatt power plant in the Sirajganj district, scheduled to be completed in 2018
Formed a joint venture for a 1,620-megawatt coal-fired power project in Chongqing, China. The project’s strategic mine-mouth location allows for power generation at a competitive cost
Successfully expanded desalination capacity at the Fujairah 1 independent water and power plant in the UAE to 130 million imperial gallons per day, making it one of the largest reverse osmosis desalination plants in the Middle East
PFO (S$ million) 2015 2014 Change (%)
Singapore 203.9 285.7 (29)Rest of ASEAN, Australia & India 179.0 62.5 186China 110.7 86.4 28Middle East & Africa 52.7 46.4 14UK 41.3 46.4 (11)The Americas 10.1 9.3 8Corporate (26.5) (14.8) (79)PFO before significant items 571.2 521.9 10Significant items* 376.3 – NMTotal PFO 947.5 521.9 82 Less: Interests, taxes and non-controlling interests (246.0) (113.9) (116)Net profit 701.5 408.0 72
* Significant items comprise divestment gains of S$425.6 million from the sale of SembSita Pacific and municipal water operations in Bournemouth and Zhumadian, less S$49.3 million comprising S$25.0 million from the exit of the chemical feedstock business and impairment of assets in Singapore (net of settlement amounts from customers) and S$24.3 million in net allowance for doubtful debts in China.

UTILITIES REVIEW
74 BUILDING THE FUTURE SEMBCORP INDUSTRIES ANNUAL REPORT 2015 75
Divestment gains, less the impact of the exit from the chemical feedstock business and impairment of assets in Singapore, net of settlement amounts from customers and the net allowance for doubtful debts in China, comprised the significant items recorded for the year.
Excluding these significant items, Utilities’ PFO and net profit was S$571.2 million and S$331.6 million respectively.
The business’ overseas growth strategy remained on track. Utilities operations outside of Singapore contributed 66% of the business’ PFO and 60% of the business’ net profit, excluding corporate costs and significant items.
In 2015, PFO from Singapore operations decreased 29% to S$203.9 million, mainly due to continued intense competition in the local power market. The Uniform Singapore Energy Price averaged S$96 per megawatt for the year compared to S$137 per megawatt in 2014. Vesting contract level for the industry stood at 30% for the first half of 2015, stepping down to 25% during the second half of the year.
The business’ PFO from the Rest of ASEAN, Australia & India grew 186% to S$179.0 million from S$62.5 million in 2014. The increase in PFO was mainly due to contributions from India from our thermal power business and our newly acquired renewable energy business, Sembcorp Green Infra. The first unit of the Thermal Powertech Corporation India (TPCIL)
power plant started operations in March, while the second unit was completed in September. However, unprecedented heavy rainfall during a cyclone contributed to a lower than expected plant load factor, coal losses and lower demand in the fourth quarter and at the net profit level, our Indian operations posted a loss. PFO contribution from the Rest of ASEAN and Australia was lower for the year with the divestment of our stake in Australian joint venture SembSita Pacific in November. In addition, in 2014, a S$10.3 million one-off net gain was recognised due to the increase in our effective stake in the Phu My 3 power plant in Vietnam.
In China, our PFO increased to S$110.7 million in 2015 compared to S$86.4 million in 2014, due to better performance from energy operations.
PFO from our Middle East and Africa operations also increased to S$52.7 million in 2015 from S$46.4 million in 2014. This increase was driven by better operating performance and efficiency gains at our operations in the UAE and Oman.
PFO in the UK decreased to S$41.3 million from S$46.4 million due to the divestment of municipal water assets in Bournemouth, mitigated by a better performance from Teesside operations.
Meanwhile, our businesses in the Americas spanning Chile, Panama and the Caribbean registered a combined PFO of S$10.1 million, compared to S$9.3 million in 2014.
Positioned for long-term growth with a strong project pipelineAdding more than 3,800 megawatts of power and over 1.3 million cubic metres per day of water and wastewater treatment capacities to our operating portfolio from 2016 to 2018
In 2015, we continued to invest for long-term growth, and secured over 3,000 megawatts of new energy projects. We made good headway in
building up our overseas project pipeline with maiden investments in the fast-growing emerging markets of Bangladesh and Myanmar. In addition, to position ourselves for growth with a balanced portfolio of energy assets, we deepened our capabilities in the renewable energy sector, which presents a new engine for our growth. By acquiring wind and solar power capabilities in India and expanding our wind power capabilities in China, we grew our renewable energy capacity four-fold
* Reflects gross capacities
EfW: energy-from-waste; m3/day: cubic metres per day; MW: megawatts; tph: tonnes per hour; TWMP: total water management plant; IWWTP: industrial wastewater treatment plant
Coal Gas Wind
Thermal Renewable Water
WaterEfW
Solid Pipeline of Projects
Over 3,800MW of power and over 1.3 million m³/day of water and wastewater treatment capacities* to be added between 2016 and 2018
Sembcorp Gayatri Power1,320MWAndhra Pradesh, India
EfW Facility140tph steamJurong Island, Singapore
Wilton 1149MW or 190tph steamTeesside, UK
Rojwas60MWMadhya Pradesh, India
Ananthalli & Harpanhalli84MWKarnataka, India
Chongqing Songzao1,320MWChongqing, China
Huanghua Laoshibeihe150MWHebei, China
Huanghua Phase 398MWHebei, China
Agar50MWMadhya Pradesh, India
Myingyan225MWMandalay, Myanmar
Sirajganj426MWSirajganj, Bangladesh
Agar50MWMadhya Pradesh, India
Changzhi TWMP1.3 million m3/dayShanxi, China
Lianyungang IWWTP20,000 m3/dayJiangsu, China
Qidong IWWTP10,000 m3/dayJiangsu, China
Jingmen IWWTP10,000 m3/dayHubei, China
2016 2017 2018

UTILITIES REVIEW
76 BUILDING THE FUTURE SEMBCORP INDUSTRIES ANNUAL REPORT 2015 77
to 1,546 megawatts. Renewables now represent 15% of our total power capacity, and present a new platform for the business to grow.
Moving forward, we will continue to leverage our strength in project development and focus on securing and executing energy and water projects, especially in rapidly developing economies. Over the next three years, we will add more than 3,800 megawatts of power and over 1.3 million cubic metres per day of water and wastewater treatment capacity to our operating portfolio. This brings our gross power and water capacity to over 10,600 megawatts and over nine million cubic metres per day, achieving our ‘10/10 vision’ set in 2011 of growing our gross power and water capacities to approximately 10,000 megawatts and 10 million cubic metres per day.
Strengthening our presence in IndiaIn 2015, we continued to strengthen our presence in the fast-growing India power market.
A significant milestone was achieved with the successful completion and commencement of operations for our first thermal power plant in the country. The supercritical coal-fired power plant, operational since March with the completion of the first 660-megawatt unit, commenced full commercial operations of its entire 1,320-megawatt capacity in September. To date, it has secured a 25-year long-term power purchase agreement for the supply of 500 megawatts of power to Andhra Pradesh and Telangana Power Distribution Companies. In addition, it secured an eight-year long-term power purchase agreement for the supply of 570 megawatts to the Southern and Northern Power Distribution Companies of Telangana in February 2016. With 86% of its net capacity contracted under long-term power purchase agreements, TPCIL is now eligible for mega power status. In addition to securing long-term power supply opportunities as and when they arise, the plant also sells the balance of its output
Renewable Energy
Our renewable energy portfolio includes wind power, solar power, energy-from-waste and biomass energy assets in Singapore, China, India and the UK. Our renewable energy capacity stands at over 1,500 megawatts of power in operation and under development, accounting for 15% of our total power capacity and 330 tonnes per hour of steam capacity.
WIND SOLAR ENERGY-FROM-WASTE
CAPACITYIndia: 883MWChina: 544MW
CAPACITYIndia: 35MW
CAPACITYSingapore: 200tph steamUK: 84MW and 130tph steam
on the Indian Energy Exchange under short-term contracts. Meanwhile, construction of our second coal-fired supercritical power plant on an adjacent site in Andhra Pradesh is progressing well, with the plant on track to be completed in 2016. Upon completion, the 1,320-megawatt plant will double our thermal power capacity in India and help meet power demand in the country, particularly in the southern states.
In 2015, we also grew our renewable energy business and strengthened our capabilities by acquiring a majority stake in Green Infra, a leading renewable energy company in India. We now own
a 64.1% stake in the unit, which we have renamed Sembcorp Green Infra. Following this acquisition in February, we continued to grow our renewable footprint in the country, expanding our renewable power capacity in operation and under development to 918 megawatts.
Since our entry into India in 2011, we have built up over 3,500 megawatts of power capacity in operation and under development in the country. With investments in both thermal and renewable energy, we are now well-positioned to continue to grow in the energy sector with a balanced portfolio of assets.
Madhya Pradesh
Agar
Nipania
Rojwas
INDIA
Andhra Pradesh
Nellore
Telangana
Tamil Nadu
Theni I & II
Theni IV & V
Vagai
Theni
Tirunelveli
Karnataka
Telagi
Bharma
Ramdurga
Tadas
Ananthalli & Harpanhalli
Maharashtra
Dhule
Gude
Bhud
Parner
New Bhud
Gujarat
Bhatia
Rojmal
Mervadar
Rajasthan
Dalot I & II
Dangri I & II
Rajgarh
Baap I & Baap II
Solar power assets
Wind power assets
Thermal power assets
Fly ash recycling plant
Customers
Growing Presence in India’s Power Market
AT A GLANCE
OPERATIONS FOOTPRINT7 states in India
POWER PORTFOLIO A balanced portfolio of thermal and renewable assets with over 3,500MW of power capacity in operation and under development
Thermal Energy Capacity (Supercritical)
2,640MW
Renewable Energy Capacity
>900MW
As at February 17, 2016.

UTILITIES REVIEW
78 BUILDING THE FUTURE SEMBCORP INDUSTRIES ANNUAL REPORT 2015 79
Growing our energy and water business in China In 2015, we continued to focus on expanding our energy and water business in China, particularly in the areas of niche power and advanced water solutions for industries. At the end of 2015, we formed a joint venture for a 1,620-megawatt mine-mouth coal-fired power project in Chongqing. Through the joint venture, we hold a 49% stake in an existing 300-megawatt coal-fired power plant and will develop an adjacent 1,320-megawatt supercritical coal-fired power plant. These are the city’s only mine-mouth coal-fired power plants. The new greenfield plant is set to be one of the most efficient power plants in Chongqing and is scheduled for completion in 2017.
Maintaining our growth momentum in the world’s largest wind power market, 2015 saw two expansion projects to our wind power capacity in Huanghua, Hebei province, through our 49%-owned joint venture with Guohua Energy Investment. The first of these expansions, a 48-megawatt wind farm in Jiedijianhe, commenced operations in 2015 and supplies power to the Hebei South grid. We also started construction of a 150-megawatt wind farm in Laoshibeihe, which is expected to be completed in 2017. Our total wind power capacity in operation and under development in China is now 544 megawatts.
On the water front, we successfully completed the expansion of our Nanjing industrial water facilities, doubling our industrial water capacity in the Nanjing Chemical Industrial Park to 240,000 cubic metres per day. This increased capacity will allow us to better serve the fast-growing water needs of our existing and potential customers in the industrial park. In recognition of our capabilities in providing specialised total water and wastewater solutions for industries, we also received a special award for being the Leader in Water Treatment for Industrial Parks at the China Water Industry Annual Awards.
Expanding our footprint in fast-growing emerging marketsIn line with our commitment to building platforms for long-term growth, our Utilities business expanded its footprint into two new fast-growing emerging markets in 2015: Myanmar and Bangladesh.
In Myanmar, we were awarded a project to develop and operate a 225-megawatt gas-fired power plant in Mandalay’s Myingyan district. We were awarded the project following an international tender, called by state-owned entity Myanmar Electric Power Enterprise and advised on by the International Finance Corporation, a member of the World Bank Group. The project is expected to be completed in 2018 and will supply power to the Myanmar Electric Power Enterprise under a 22-year power purchase agreement. The US$300 million plant is set to be the largest gas-fired independent power plant in the country, and will help ease the country’s severe power deficit and support its economic growth.
In Bangladesh, we will be developing a 426-megawatt combined cycle gas-fired power plant in the Sirajganj district under the country’s first public-private partnership for the power sector involving a foreign investor. To be built, owned and operated through a partnership with North-West Power Generation Company, an enterprise of the Bangladesh Power Development Board, the US$390 million plant will supply power to the grid under a 22.5-year power contract with the Bangladesh Power Development Board upon its completion in 2018.
2015 also saw the successful completion of an expansion to reverse osmosis facilities at the Fujairah 1 Independent Water and Power Plant in the UAE that increased the plant’s seawater desalination capacity from 100 million imperial gallons per day to 130 million imperial gallons per day. This makes the plant the largest reverse osmosis desalination facility in the Middle East. The additional water output from
the expansion will be sold to the Abu Dhabi Water & Electricity Company under a 20-year water purchase agreement.
OUTLOOK
The World Bank expects growth in the global economy to pick up modestly to 2.9% in 2016, from 2.4% in 2015.
In Singapore, the Ministry of Trade and Industry has forecast the economy to expand by between 1% to 3% in 2016. Meanwhile, due to global economic uncertainty, the Economic Development Board forecasts that fixed asset investments will be between S$8 billion and S$10 billion in 2016, compared to S$11.5 billion in 2015. The operating environment for our Utilities business in Singapore is expected to be challenging in 2016, with continued intense competition in the power market. The business will continue to focus on enhancing operational excellence and efficiency as well as managing costs.
In China, the World Bank expects growth to slow slightly to 6.7% in 2016, from 6.9% in 2015. However, the country’s upcoming 13th five-year plan is expected to contain increased focus on the environment. In addition, China has announced plans to peak its carbon dioxide emissions by 2030 or before, and lower the carbon intensity of its gross domestic product between 60% to 65% below the 2005 level by 2030. This is expected to provide further opportunities for growth in sectors aligned with this objective. Our Utilities business continues to be well-placed to benefit from this emphasis on environmental protection with our sustainable water solutions and renewable energy capabilities.
The South Asia region, led by India, is projected to be a bright spot in 2016, with growth in the region forecast to increase to 7.3% from 7% in 2015. India, the dominant economy in the region,
is forecast to grow by 7.8% in 2016, up from 7.3% in 2015. 2016 will see the first full year of profit contributions from our 1,320-megawatt TPCIL power plant, as well as the phased completion of our second 1,320-megawatt power plant adjacent to it.
Following a landmark deal negotiated at the 2015 United Nations Climate Change Conference in Paris, countries around the world are expected to place increased focus on managing climate change moving forward. This is expected to lead to more opportunities in the renewable energy sector, amongst others.
Backed by strong operational, management and technical capabilities, the business remains focused on the execution of its pipeline of projects and the pursuit of new growth opportunities to deliver long-term growth.

80 BUILDING THE FUTURE SEMBCORP INDUSTRIES ANNUAL REPORT 2015 81
Phase II of the state-of-the-art Sembcorp Marine Tuas Boulevard Yard in Singapore, expected to be completed in 2017
MARINE REVIEW
• A global leader in integrated marine and offshore solutions with more than 50 years’ proven track record
• Focused on four key capabilities: rigs & floaters; repairs & upgrades; offshore platforms and specialised shipbuilding
• Global network of strategic locations in Singapore, India, Indonesia, the UK and Brazil
Financial Indicators (S$ million) 2015 2014 Change (%)
Turnover 4,968.1 5,832.6 (15)Earnings before interest, tax, depreciation and amortisation 501.1 823.6 (39)Profit from operations (342.0) 717.8 NM– Earnings before interest and tax (168.5) 708.0 NM– Share of results: Associates & JVs, net of tax (173.5) 9.8 NMNet profit (289.7) 560.1 NMReturn on equity (%) (10.6) 19.9 NM Note: Figures taken at Sembcorp Marine level
Competitive Edge
Performance Scorecard
Turnover by Segment n Rigs & floatersn Repairs & upgrades
n Offshore platformsn Other activities
Orderbook Composition n Drillshipsn Semi-submersiblesn Jack-up rigs
n Floatersn Offshore platforms
Net orderbook S$10.4 billion as at December 31, 2015 Excludes repairs & upgrades
67% 20%
2%
11%
6%
15%
18%
18%
43%
OFFSHOREPLATFORMS
RIGS & FLOATERS
Operational Indicators (S$ billion) 2015 2014
Net orderbook 10.4 11.4

MARINE REVIEW
82 BUILDING THE FUTURE SEMBCORP INDUSTRIES ANNUAL REPORT 2015 83
10%
41%
49% OFFSHOREPLATFORMS
RIGS & FLOATERS
Key Developments
Secured contract orders worth S$3.2 billion in 2015, including two sizeable contracts worth around US$1 billion each to serve customers in oil and gas production. As at the end of 2015, net orderbook stood at S$10.4 billion
Transformed from a multi-brand, multi-business-unit entity into an integrated company operating under a single brand and focused on four key capabilities
Opened a state-of-the-art steel structure fabrication workshop in Singapore, the largest of its kind in Southeast Asia
OPERATING AND FINANCIAL REVIEW
A difficult market environment
In 2015, the Marine business faced a very difficult market environment. Amid further collapse in oil prices, oil and gas exploration projects were curtailed globally. This led to a reduction in new projects for yards worldwide, as well as requests for deferment or cancellation of existing rig deliveries. In addition, the Marine business was affected by uncertainties in the Brazil market and by the financial difficulties of its customer, Sete Brasil.
Against this background, in 2015, Sembcorp Marine recorded a turnover of S$5.0 billion compared to S$5.8 billion in 2014, and a net loss of $289.7 million compared to a net profit of S$560.1 million in 2014. Profit from operations was negative S$342.0 million for 2015, in comparison to S$717.8 million in 2014.
2015 saw the business making prudent impairment and provisions totalling S$609 million
for its rig contracts, of which S$329 million was for Sete Brasil projects. It also recorded S$192 million of associate / joint venture losses.
In light of uncertainties in Brazil, a provision of S$329 million was made by the business for its Sete Brasil projects, taking into consideration what the business believes to be the full extent of its exposure to the contracts. In addition, the business also made provisions of approximately S$280 million in case of prolonged deferment or possible cancellation of rigs. Following the failure of one of its customers to take delivery of its rig, the business has terminated that contract and taken legal action to recover the amount due to it. All other completed rigs with deferment requests have been technically accepted by customers and the business has arrived at, or is finalising, mutually acceptable solutions with these customers. To date, the business has not had any cancellation of rig orders.
The business’ share of losses in associates and joint ventures of S$192 million comprised the net
impact of the Marine business’ equity-accounted share in provisions made by its 30%-owned associate Cosco Shipyard Group, which was also affected by the severe industry down-cycle, as well as its share of loss in other associates and non-operating items.
Excluding the impairment, provisions and share of losses of associates and joint ventures, the business posted a net profit of S$384 million for 2015.
Orderbook of S$10.4 billion S$3.2 billion of orders secured in 2015 despite depressed market conditions
In 2015, the business’ best-in-class facilities, new capabilities and success in broadening its customer base enabled it to secure S$3.2 billion in new orders, despite the depressed market conditions. These new orders brought the business’ net orderbook to S$10.4 billion as of December 31, 2015.
The new orders included a contract from Heerema Offshore Services to design and build the world’s largest semi-submersible crane vessel for approximately US$1 billion. Scheduled for delivery in the fourth quarter of 2018, this giant crane vessel will be built at the state-of-the-art Sembcorp Marine Tuas Boulevard Yard. Also, the business secured an engineering, procurement and construction contract worth more than US$1 billion from Maersk Oil North Sea UK, for the construction of a central processing facility, two connecting bridges, a wellhead platform as well as utilities and living quarters platform topsides, for deployment in the Culzean field development.
In addition, during the year the business entered into a floating storage and offloading (FSO) conversion contract worth S$56 million with Teekay, as well as a contract to design and build a new FSO for MODEC Offshore Production Systems (Singapore).
Over the last five decades, Sembcorp Marine has developed strong relationships with many customers, including national and international oil companies and key players in the drilling and production markets. With its diversified and enhanced capabilities, the Marine business aims to further cement such relationships and build strategic partnerships with them.
Contracts Secured in 2015
New orders worth S$3.2 billion
Rigs & floaters
n Semi-submersibles– Semi-submersible crane vessel for Heerema
Offshore Services worth approximately US$1 billion
n Floaters– FSO conversion for Teekay worth S$56 million– FSO newbuild for MODEC Offshore Production
Systems (Singapore)
n Offshore platforms– Three topside modules for Maersk Oil North
Sea UK worth over US$1 billion
Excludes repairs & upgrades

MARINE REVIEW
84 BUILDING THE FUTURE SEMBCORP INDUSTRIES ANNUAL REPORT 2015 85
Strategic response to competition Building long-term capabilities, diversifying to serve new segments
Sembcorp Marine recognises the need to deepen and broaden its yard capabilities to enable cost-effective execution and maintain its competitiveness globally. In 2015, the business completed a new state-of-the-art steel structure fabrication workshop at its flagship Sembcorp Marine Tuas Boulevard Yard in Singapore. The 120,000-square-metre workshop is the largest of its kind in Southeast Asia. It will boost the business’ steel fabrication capacity and productivity, and allow the business to undertake more complex projects in a more cost-effective manner and with shorter delivery times.
In addition, the Marine business sees further need to diversify to serve different segments within the exploration and production value chain, such as the development and production segments. To this end, it remains committed to enhancing its technology and engineering expertise, investing prudently in research and development
to improve operational efficiency and develop new capabilities. The business has broadened its product offering to include well intervention semi-submersibles, accommodation rigs and proprietary design drillships.
The business is also developing other product segments within the offshore oil and gas value chain to enhance its full spectrum of integrated solutions. Through its investment in GraviFloat, it has the technology to design, deliver and operate re-deployable, gravity-based, modularised terminals for nearshore gas and power generation installations. It also has proprietary expertise in the design, engineering and delivery of innovative floating production and drilling solutions for the oil and gas industry, through its Houston-based subsidiary Sembmarine SSP. This enables it to offer next-generation innovative and cost-effective solutions for deep-water oil and gas drilling, production and storage, as well as logistics hub applications in harsh environments and extreme arctic conditions.
PHASE I73.3 hectares Four VLCC drydocks: 1.55 million dwt
Longest and deepest repair dock in Asia412m x 66m x (-11m)
Capable of docking containerships of up
to 18,000 TEU
VLCC drydock350m x 66m x (-8.5m)
VLCC drydock350m x 66m x (-8.5m)
Widest drydock in Singapore360m x 89m x (-8.5m)Accommodates jack-up and semi-submersible rigs
PHASE II 34.5 hectares Expected completion in 2017
Two drydocks catering to mid-size Suezmax commercial ships255m x 52m x (-8m)
Dedicated drydock for mega-offshore facilities255m x 110m x (-12m)
Natural deep waters
Special reinforced load-out areas for offshore modules of up to 20,000 tonnes
Three finger piers and a basin ranging from 210m to 400m with maximum draft from 9m to 15m
Enables installation of semi-submersible thrusters without towing the rigs to sea
Enables direct lifting and deployment of topside modules onto hulls without requiring the hulls to be towed out to sea
Enables ultra-deepwater semi-submersibles and cruise ships to be berthed without restrictions
Steel structure fabrication workshopNew facility with a streamlined and extensively automated production process. Greatly improves efficiency by acting as the central steel structure fabrication workshop for all three phases of the yard.
In Operation
dwt: deadweight tonnes; m: metres; TEU: twenty foot equivalent units; VLCC: very large crude carrier
Capabilities That Enhance Long-term Competitiveness Sembcorp Marine Tuas Boulevard Yard, Singapore

MARINE REVIEW
86 BUILDING THE FUTURE SEMBCORP INDUSTRIES ANNUAL REPORT 2015 87
PRODUCTION
Integrated and process platforms; production, riser and drilling platforms, etc.
SPECIALISED SHIPBUILDING
Design and construction of high-performance,
specialised vessels
EXPLORATION / PRODUCTION
Drilling unitsJack-ups, semi-
submersibles, drillships
Floating facilitiesFPSOs, FDPSOs, FSOs,
FPUs, FLNGs, FSRUs, well intervention rigs, crane vessels,
accommodation modules
MAINTENANCE
NON-DRILLING SOLUTIONS
Underpinned by long-term strategic alliances and
regular customers
LNG Carriers
Cruise Ships
Technology Solutions
SSP Floater Technology
Proprietary next-generation circular hull formsApplications include deepwater drilling, production & storage, logistics hub applications
GraviFloat
Modularised LNG and LPG terminalsRe-deployable, gravity-based modularised terminals for installation in shallow waters
Becoming nimbler and more efficient Transformation to build a global integrated company
In 2015, the Marine business reached a key milestone in transforming its businesses for the future. From a multi-brand, multi-business-unit entity, the business became an integrated company, operating under one brand. The new integrated Sembcorp Marine is focused on four key capabilities: rigs & floaters, repairs & upgrades, offshore platforms as well as specialised shipbuilding.
As an integrated company, Sembcorp Marine will be able to harness the combined scale and expertise of its global operations to become more flexible, innovative and responsive. This puts the business in a good position to undertake larger and more complex projects, and take on challenges and opportunities in a fast-changing and increasingly complex business environment. Furthermore, integrating the combined shared expertise and accumulated experience of high-calibre teams across its global operations will allow our Marine business to serve its customers better.
OUTLOOK
Looking ahead, the current down-cycle for the business is expected to be more protracted than previous cycles. However, Sembcorp Marine believes that it is sufficiently prepared, not just to ride out the storm, but also to lay stronger foundations for its future when the market recovers. The business will continue to actively manage its balance sheet to maintain a healthy financial position.
The business remains optimistic on its longer-term prospects, as its facilities have been built to cater to the industry’s demand for the long term. As an integrated Sembcorp Marine, the business will optimise its capabilities and capacities, as well as increase its efficiency and productivity to better serve its partners and customers.
Offshore Platforms
Specialised Shipbuilding
Rigs & Floaters
Repairs & Upgrades
FPSO: Floating production storage offloading vessel; FDPSO: Floating drilling production storage offloading vessel; FSO: Floating storage offloading vessel; FPU: Floating production unit; FLNG: Floating liquefied natural gas vessel; FSRU: Floating storage regasification unit
Niche market segments such as:
Full Spectrum of Integrated Solutions

88 BUILDING THE FUTURE SEMBCORP INDUSTRIES ANNUAL REPORT 2015 89
• Over 20 years’ track record in undertaking master planning, land preparation and infrastructure development to transform raw land into urban developments
• Significant land bank of integrated urban developments comprising industrial parks as well as business, commercial and residential space in Vietnam, China and Indonesia
• A valued partner to governments, with the ability to deliver the economic engine to support industrialisation and urbanisation by attracting local and international investments
Financial Indicators (S$ million) 2015 2014 Change (%)
Turnover1 12.2 10.7 14Profit from operations 38.5 47.5 (19)– Earnings before interest and tax (7.0) (0.3) NM– Share of results: Associates & JVs, net of tax 45.5 47.8 (5)Net profit 33.5 44.3 (25)Return on equity (%) 4.2 6.4 (34) 1 Most of our Urban Development businesses are associates or joint ventures. Turnover reflected consists of payment for services provided to these associates or joint ventures.
Competitive Edge
Performance Scorecard
Remaining Saleable Land by Geographyn Vietnam n China n Indonesia
Remaining Saleable Land by Segmentn Industrial & business 1 n Commercial & residential 2
1 Industrial & business land includes space for general and high-tech manufacturing, research and development, as well as business and technology incubators.2 Commercial & residential land includes space for food and beverage businesses, malls, hotels, serviced apartments and modern services such as accounting
and legal firms, consultancies and corporate headquarters.
63%
20%
17%55% 45%
Artist’s impression of the Singapore-Sichuan Hi-tech Innovation Park, China
Operational Indicators (hectares) 2015 2014
Saleable land inventory 5,653 5,410Land sold (cumulative) 1,844 1,633Net orderbook 220 198Land available for sale 3,589 3,579
Note: Figures are based on current planned estimates and exclude projects under Gallant Venture
URBAN DEVELOPMENT REVIEW

URBAN DEVELOPMENT REVIEW
90 BUILDING THE FUTURE SEMBCORP INDUSTRIES ANNUAL REPORT 2015 91
Key Developments
Established two new Vietnam Singapore Industrial Park (VSIP) projects: VSIP Hai Duong and VSIP Nghe An (pictured)
Strong land sales achieved at Singapore-Sichuan Hi-tech Innovation Park, China. Major arterial roads were completed for land handover to customers
Secured a first mixed-use site in Nanjing, China, for development by our wholly-owned real estate arm, Sembcorp Properties. The project will include residential apartments as well as the Nanjing International Water Hub (pictured)
OPERATING AND FINANCIAL REVIEW
Strong land sales but higher costs
The Urban Development business recorded a net profit of S$33.5 million compared to S$44.3 million the previous year. Profit from operations (PFO) stood at S$38.5 million compared to S$47.5 million in 2014.
The business achieved strong land sales in 2015, with more land sold in Vietnam, China as well as Indonesia compared to 2014. During the year, the business sold 211 hectares of land and received commitments from customers for a further 233 hectares, bringing its net orderbook to 220 hectares as at the end of the year. Land for industrial and business purposes accounted for 91% of land sold during the year, while land for commercial and residential purposes accounted for 9%.
However, the business’ net profit was lower due to a greater proportion of industrial and business land sold, which has lower margins, as well as higher corporate costs and pre-operating costs from new projects.
Net Orderbook (hectares)
n Industrial & business land 1
n Commercial & residential land 2
1 Industrial & business land includes space for general and high-tech manufacturing, research and development, as well as business and technology incubators.
2 Commercial & residential land includes space for food and beverage businesses, malls, hotels, serviced apartments and modern services such as accounting and legal firms, consultancies and corporate headquarters.
0
50
100
150
300
250
200
20152014
175
45
220
86
112
198
Industrial and business land continued to form the bulk of land sold across Vietnam Singapore Industrial Park (VSIP) projects, accounting for 96% of land sold. The remaining 4% of land sold was for commercial and residential purposes.
During the year, we extended the reach of the VSIP with the establishment of two new developments. The first, VSIP Hai Duong, is located in northern Vietnam between two existing VSIP projects, VSIP Bac Ninh and VSIP Hai Phong, and connected by highway to Hanoi and Hai Phong port. VSIP Hai Duong is positioned to attract supporting industries for manufacturing companies located in Bac Ninh and Hai Phong. In April, we received the investment licence for the project, which had 110 hectares of industrial land for immediate sale. Since then, the project has already secured three customers.
In June, we then announced our second new VSIP project for the year, the 750-hectare VSIP Nghe An, on the north central coast of Vietnam. Following the receipt of the investment licence, we broke ground for the first phase of this integrated township and industrial park, comprising 198 hectares of industrial land and 81 hectares of commercial and residential land, in September. VSIP Nghe An is located along the East-West Economic Corridor
linking Laos, Myanmar and Thailand with the East Sea, close to the port of Cua Lo. It is also within the boundaries of the newly established Dong Nam Economic Zone, which offers generous investment incentives to manufacturers for up to 15 years.
During the year, we welcomed Japan’s MC Development Asia (MCDA) as a partner in our Vietnam real estate business. MCDA is a subsidiary of Japan’s Mitsubishi Corporation, which has delivered real estate projects in Japan, North America, Europe and China. It has taken up a 19.1% effective stake in The Habitat Binh Duong, our residential project currently under construction at our first VSIP. Sembcorp’s effective stake in The Habitat Binh Duong, formerly known as Gateway, is 50.4%. The project will offer condominiums catered to the needs of tenants of VSIP, as well as professionals working in the province. The sales permit for the project’s first phase of 267 units was received in November.
In total, VSIP now has seven VSIP projects across the southern, central and northern economic corridors of Vietnam, spanning 6,660 hectares in gross project size. The market leader in Vietnam, VSIP has attracted US$8.2 billion in total investment capital from over 590 companies, and created more than 157,000 jobs.
Development Progress at the Vietnam Singapore Industrial Park Projects
23 companies have commenced operations at VSIP Hai Phong and seven new factories are expected to be completed in 2016
64 companies have set up operations at VSIP Bac Ninh, including Microsoft
VietnamOur Vietnam business performed well in 2015. Investor interest was strong, with manufacturers keen to benefit from free trade pacts concluded in 2015, such as the Trans-Pacific Partnership.

URBAN DEVELOPMENT REVIEW
92 BUILDING THE FUTURE SEMBCORP INDUSTRIES ANNUAL REPORT 2015 93
Real Estate Activities Within Our Vietnam and China Projects
The Habitat Binh Duong residential development is currently under construction at our first VSIP project. It will cater to the needs of professionals working in the province
Commercial and residential development underway on the Sino-Singapore Nanjing Eco Hi-tech Island
ChinaIn China, direct investment in high-technology manufacturing rose 9.5% in 2015, reflecting the central government’s increasing emphasis on high value-added manufacturing and services as economic drivers. This boosted the take-up of land at our developments in Sichuan and Nanjing, which target the high-technology segment.
Our 1,000-hectare Singapore-Sichuan Hi-tech Innovation Park (SSCIP), located in the central business district of Chengdu’s Tianfu New City, delivered a strong performance for the year. We successfully attracted 10 high-technology companies to set up operations in the development, bringing with them RMB11.4 billion in investment capital. These companies are largely in the biomedical science sector, one of our key target industries for the development. An additional eight companies have committed to invest in the SSCIP and handover of land to them is expected to take place progressively in 2016. In 2015, we also made good progress in land preparation. Major road networks connecting SSCIP to Sichuan’s main cities were completed, and a state-of-the-art common utilities trench was installed underground for the site.
Land sales at our Sino-Singapore Nanjing Eco Hi-tech Island (SNEI) project increased over the previous year. Sales of industrial and business land increased. However, several residential land sales were deferred, impacting profits. During the year, our real estate arm, Sembcorp Properties, acquired a 5.7-hectare mixed-use site on the SNEI through a public auction. Spanning close to 76,000 square metres’ gross floor area, the site will house residential apartments, as well as the Nanjing International Water Hub (NIWH). Owned and marketed by Sembcorp Properties, the NIWH will offer office space targeted at water companies, including technology, research and development, engineering, as well as commercial players. Targeted for completion in 2018, it will offer conference facilities, as well as a water technology innovation centre for tenants’ use, equipped to support both analytical and field tests.
Meanwhile, our Wuxi-Singapore Industrial Park (WSIP) project recorded more than 90% occupancy in its ready-built and built-to-specifications factories. It also continued to receive healthy revenue from electricity and rental income. However the project’s performance was impacted by an impairment and
doubtful debt provisions for two built-to-specifications factories, as well as an impairment loss for the Hongshan Mansion development.
IndonesiaIn Indonesia, our new Kendal Industrial Park (KIP) project in Central Java continued to draw interest from both local and foreign manufacturers, primarily in the furniture and garment-related industries as well as the food processing sector. Lower operating costs in Kendal regency, where the KIP is located, formed a key factor in the KIP’s attractiveness to companies. Four customers have purchased industrial land at the KIP to date, with additional customers in the pipeline for 2016.
During the year, we continued to focus on land preparation at the 860-hectare KIP. Good progress was made on this front and we have begun land and infrastructure development for the project.
OUTLOOK
Vietnam’s economy and industrial production continued to show positive momentum in 2015. The country’s gross domestic product (GDP) grew by around 6.5%. In addition, the State Bank of Vietnam’s move to devalue the dong against the US dollar in January, May and August 2015 and widen the currency’s trading band should serve to increase export competitiveness and safeguard GDP growth going forward. Coupled with low inflation, these exchange rate measures should reduce operating costs for companies and enhance Vietnam’s attractiveness as an investment destination. The recent conclusion of the Trans-Pacific Partnership has also encouraged investment by manufacturers eager to benefit from market access the trade pact would offer upon its ratification.
China’s economy grew by 6.9% in 2015. Investment in high-technology manufacturing and services increased significantly. This trend affirms
the positioning of our newer developments, the SNEI and SSCIP, as high-technology and innovation-driven integrated developments. Where the residential real estate market may be affected by the slower release of land by the local government, we will focus on mixed-use developments and the sale of industrial and business land to drive performance instead.
Indonesia’s economy has slowed, with GDP growth falling below 5% and the manufacturing purchasing managers’ index (PMI) contracting below 50 in 2015. Nonetheless, our KIP project continues to draw enquiries from manufacturers in West and East Java, who are attracted by lower operating costs in Kendal regency and Central Java. Current upgrading of road networks and the expansion of the domestic airport also serve to improve the attractiveness of the project to investors.
The Urban Development business has a healthy orderbook of 220 hectares of land, which will be converted into sales in the next two years. This comprises 175 hectares of land for industrial and business use, and 45 hectares for commercial and residential use. In addition, we continue to receive enquiries for land within our projects in Vietnam, China and Indonesia.
Sembcorp’s Urban Development business remains well-positioned, with a good track record and 13 large-scale projects in emerging markets. We continue to pursue land sales, while maximising value from our land bank through selective property development. In recent years, the business has expanded in terms of geographical reach and number of projects. It has also grown its range of products, which now includes high-technology parks, integrated townships and traditional industrial parks. Over the last two years, good progress has also been made in land resettlement and infrastructure development, laying important groundwork to capture value from land sales in the coming years.
For 2016, the Urban Development business is expected to deliver a steady operating performance.

Sembcorp’s solar power operations in Gujarat, India
– Economic 133
– Governance, Risk and Compliance 139
– People 142
– Health, Safety and the Environment 146
– Community 153
Investor Relations 156
Corporate Governance Statement 97
Risk Management and Internal Controls 118
Sustainability Report 126
• Managing Sustainability 126
– Materiality 128
• Material Issues 131
– Stakeholder Engagement 132
GOVERNANCE AND SUSTAINABILITY

SEMBCORP INDUSTRIES ANNUAL REPORT 2015 97
CORPORATE GOVERNANCE STATEMENT
Sembcorp’s corporate governance principles are built on our core
value of integrity and reflect our commitment to protect and enhance
shareholder value.
Sembcorp maintains an unremitting commitment to strong
governance and discipline. We aim to be a best-in-class
organisation in terms of governance, risk management
and compliance, and commit to uphold the highest ethical
and professional standards in all our dealings, across all
countries where we operate.
This helps us preserve and maximise value, and enables us
to build businesses that are strong and lasting, and that will
deliver sustainable performance over the long term.
ANG KONG HUA Chairman
The board and management of Sembcorp recognise that well-defined corporate governance processes are essential in enhancing corporate accountability and long-term sustainability, and are committed to high standards of governance to preserve and maximise shareholder value. This report sets out the company’s corporate governance processes and activities for the financial year with reference to the principles set out in the Singapore Code of Corporate Governance 2012 (the Code). The board is pleased to report that the company has complied in all material aspects with the principles and guidelines set out in the Code, and any deviations are explained in this report.
The company continually reviews and refines its processes in light of best practice, consistent with the needs and circumstances of the Group. We are encouraged that our efforts towards excellent governance have been recognised. Sembcorp was ranked sixth in the 2015 edition of the Governance & Transparency Index, a well-respected index assessing the transparency of 639 Singapore-listed companies, jointly launched by The Business Times and the National University of Singapore Business School’s Centre for Governance, Institutions and Organisations. In addition, at the SIAS Investors Choice Awards 2015, Sembcorp was recognised as the Most Transparent Company under the Oil & Gas category. This award honours public listed companies that have demonstrated exemplary corporate governance and transparency practices throughout the year.
Sembcorp is led by an effective board comprising mainly independent non-executive directors. The board is headed by Ang Kong Hua. He is joined on the board by Tang Kin Fei, Bobby Chin Yoke Choong, Margaret Lui, Tan Sri Mohd Hassan Marican, Tham Kui Seng, Dr Teh Kok Peng, Ajaib Haridass, Neil McGregor and Nicky Tan Ng Kuang, who was appointed to the board on November 1, 2015. Goh Geok Ling and Evert Henkes were also directors of the company until their retirement from the board at the last annual general meeting (AGM) of the company on April 21, 2015.
Role of the boardThe board is collectively responsible for the long-term success of the company. Each director exercises his / her independent judgement to act in good faith and in the best interest of the company for the creation of long-term value for shareholders. The principal duties of the board are to:
• Provide leadership and guidance to management on the Group’s overall strategy, taking into consideration sustainability issues and the need to ensure necessary financial and human resources are in place
Board’s Conduct of Affairs (Principle 1)Effective board to lead and effect controls
BOARD MATTERS

CORPORATE GOVERNANCE STATEMENT
SEMBCORP INDUSTRIES ANNUAL REPORT 2015 9998 BUILDING THE FUTURE
• Ensure the adequacy of the Group’s risk management and internal controls framework and standards, including ethical standards, and that its obligations to shareholders and other key stakeholders are met
• Review management performance and oversee the Group’s overall performance objectives, key operational initiatives, financial plans and annual budget, major investments, divestments and funding proposals, quarterly and full-year financial performance reviews, risk management and corporate governance practices
• Provide guidance on sustainability issues, such as environmental and social factors, as part of the Group’s overall business strategy
To assist the board in the efficient discharge of its responsibilities and provide independent oversight of management, the board has established the following board committees with written terms of reference:
• Executive Committee• Audit Committee• Risk Committee• Executive Resource & Compensation Committee• Nominating Committee• Technology Advisory Panel
Special purpose committees are also established as dictated by business imperatives.
Composition of the board committees is structured to ensure an equitable distribution of responsibilities among board members, maximise the effectiveness of the board and foster active participation and contribution. Diversity of experience and appropriate skills are considered along with the need to maintain appropriate checks and balances between the different committees. Hence, membership of the Executive Committee, with its greater involvement in key businesses and
executive decisions, and membership of the Audit and Risk Committees, with their respective oversight roles, are mutually exclusive.
The directors and executive officers of the company have each given an undertaking that in the exercise of their powers and duties as a director or executive officer of the company, they shall apply their best endeavours to comply with the requirements of Singapore Exchange Securities Trading (SGX-ST), pursuant to or in connection with the SGX-ST Listing Manual from time to time in force, and use their best endeavours to procure that the company shall so comply.
The Group has adopted internal controls and guidelines that set out financial authorisation and approval limits for borrowings, including off-balance sheet commitments, investments, acquisitions, disposals, capital and operating expenditures, requisitions and expenses. Significant investments and transactions exceeding threshold limits are approved by the board while transactions below the threshold limits are approved by the Executive Committee and management to facilitate operational efficiency, in accordance with applicable financial authority limits.
Executive Committee The Executive Committee (ExCo) is chaired by Mr Ang and its members include Mr Tang, Mrs Lui as well as Mr Tan, who joined the ExCo on January 1, 2016. Mr Goh was a member until his retirement from the board on April 21, 2015.
Within the limits of authority delegated by the board, the ExCo reviews and approves business opportunities, strategic investments, divestments, and major capital and operating expenditure. The ExCo also evaluates and recommends larger investments, capital and operating expenditure and divestments to the board for approval.
Technology Advisory Panel The Technology Advisory Panel (TAP) comprises board members Mr Ang, Mr Tang and Dr Teh, as well as co-opted members Dr Josephine Kwa Lay Keng, Dr Ng How Yong and Prof Lui Pao Chuen. Their profiles may be found under the TAP chapter of this annual report.
The TAP provides guidance to the Group on its vision and strategy in leveraging technology to enhance Sembcorp’s leadership in the energy and water industries. The panel advises on technologies for research and development as well as investment, oversees the development and application of significant emerging and potentially disruptive technologies in the energy and water sectors, and ensures the appropriate management of specialised research and development projects and systems for intellectual property creation and protection. In addition, the panel advises Sembcorp’s board and management on technological trends and opportunities in line with the company’s growth strategies.
The other committees’ respective composition, roles and responsibilities are further explained in this report. Minutes of board committee meetings are circulated to the board to keep directors updated on each committee’s activities.
Meetings and attendanceThe board meets on a quarterly basis to review and approve the release of the company’s quarterly results, as well as to deliberate on key activities and business strategies, including significant acquisitions and disposals. At these board meetings, the Group President & CEO updates the board on the development and prospects of the Group’s businesses and each board committee provides a report on its activities. An additional board meeting is held at the end of each financial year to review the Group’s strategy and to consider and approve
the Group’s budget for the following year. Ad-hoc board meetings may also be convened as necessary to consider other specific matters. At quarterly board meetings, time is set aside for the board to discuss management’s performance. Members of management are not present at or privy to such discussions. In addition, in December 2015, a two-day off-site board retreat was organised for in-depth discussion on strategic issues.
Board and board committee meetings, as well as AGMs of the company are scheduled in consultation with the directors before the start of each year. Telephonic attendance and conference via audio-visual communication channels are allowed under the company’s Constitution to enable the participation of directors who are unable to be present. Decisions made by the board and board committees may be obtained at meetings or via circular resolution. Should a director be unable to attend a board or board committee meeting, he / she will still be sent the papers tabled for discussion and have the opportunity to separately convey any views to the chairman for consideration or further discussion with other directors. If necessary, a separate session may be organised for management to brief that director and obtain his / her comments and / or approval.
The directors’ attendance at board and committee meetings held during the financial year 2015 is set out on page 103.
Board orientation and trainingAll new directors receive formal letters of appointment explaining the Group’s governance policies and practices, as well as their duties and obligations as directors. New directors also receive an information pack that contains the Group’s organisation structure, the contact details of members of senior management, the company’s Constitution, respective committees’ terms of reference, the Group’s policy relating to disclosure of interests in

CORPORATE GOVERNANCE STATEMENT
SEMBCORP INDUSTRIES ANNUAL REPORT 2015 101100 BUILDING THE FUTURE
securities and prohibition on dealings in Sembcorp securities, as well as guidelines on directors’ fees.
The company conducts comprehensive orientation programmes for new directors. These include briefings on board policies and processes, presentations by senior management on Sembcorp’s organisation, overall strategic plans and direction, financial performance and business activities in various markets, as well as facility visits.
As part of training and professional development for the board, the company ensures that directors are briefed from time to time on changes to regulations, guidelines and accounting standards, as well as other relevant trends or issues. These are done either during board meetings, at board dinners or at specially convened sessions, including training sessions and seminars conducted by external professionals.
Briefings and updates provided for directors in 2015
• Briefings on developments in accounting and governance standards presented by our external auditors at Audit Committee meetings
• Quarterly updates on the Group’s business and strategic developments presented by the Group President & CEO to the board
• Quarterly overviews on the Group’s risk and controls environment and updates relating to other risk management and governance initiatives, such as the risk appetite and governance assurance frameworks, presented by the Group Risk and Governance departments to the Risk Committee
• Updates on changes to the Singapore Companies Act presented by external legal advisors to the board
• Demonstration on three-dimensional printing technology by an external vendor to the board
• Overview on global cyber security presented by an external technology service provider to the board
• Public conference and forum discussion on best practices for boards, talent management and technology
Besides such briefings, articles and reports relevant to the Group’s businesses are also circulated to the directors for information. Furthermore, facility visits to the Group’s operating sites and meetings with key customers and government officials are arranged to enhance our directors’ understanding of the Group’s businesses. In July 2015, directors visited our newly acquired subsidiary, Sembcorp Green Infra, in New Delhi, India. At this visit, meetings with government officials and presentations by Sembcorp Green Infra’s management were held to enhance the board’s understanding of Sembcorp Green Infra’s business and its regulatory and operating environment, as well as India’s renewable energy sector.
Board compositionThe current board comprises 10 directors, seven of whom are independent directors. Excluding the Group President & CEO, all the directors are non-executive. The board members include business leaders and professionals with strong experience relevant to the Group’s businesses, from engineering, petrochemicals, oil and gas and real
Board Composition and Guidance (Principle 2)Strong and independent board exercising objective judgement
estate industries to accountancy, finance and legal sectors. Best efforts have been made to ensure that in addition to contributing their valuable expertise and insight to board deliberations, directors also bring to the board independent and objective perspectives to allow balanced and well-considered decisions to be made. The board is of the view that given that the majority of directors are non-executive and independent of management in terms of character and judgement, objectivity on issues deliberated is assured. Profiles of the directors may be found on pages 34 to 39.
Review of directors’ independenceThe independence of each non-executive director is assessed annually. Each director is required to complete a Director’s Independence Checklist drawn up based on the guidelines provided in the Code. The checklist also requires each director to assess whether he / she considers himself / herself independent despite involvement in any of the relationships identified in the Code. Thereafter, the Nominating Committee reviews the completed checklists, assesses the independence of the directors and presents its recommendations to the board.
Taking into account the views of the Nominating Committee, the board determined in 2015 that with the exception of Mr Tang, Mrs Lui and Mr McGregor, all of Sembcorp Industries’ directors are independent. Mr Tang is Group President & CEO and an executive director. Mrs Lui is Chief Executive Officer of Azalea Asset Management, a related company of Temasek Holdings (Temasek) which holds more than 10% interest in the Group, while Mr McGregor is employed by Temasek as Senior Managing Director of its enterprise development group.
Tan Sri Mohd Hassan Marican and Mr Haridass both sit on the board of Sembcorp Marine, a listed
subsidiary from which the company has received payment in excess of S$200,000 in aggregate for consultancy services and provision of utilities services. The board has assessed this matter and is of the view that the payment received from Sembcorp Marine is not significant in the context of the Group’s earnings. The board believes that Tan Sri Mohd Hassan Marican and Mr Haridass’ directorships in Sembcorp Marine have not and will not interfere, or be reasonably perceived to interfere, with their ability to exercise independent judgement and act in the best interest of Sembcorp Industries.
A term limit of nine years is set for independent directors of the Group. Should the board decide to retain any director beyond this nine-year term, it will rigorously review the independence of that director and determine if he / she should continue to be regarded as an independent director. Since the retirement in April 2015 of Mr Goh and Mr Henkes, who were both long-time directors of the company, none of Sembcorp’s current directors have served longer than nine years from the date of their appointment.
The board has determined that Mr Chin, a director on the board of Temasek, and Tan Sri Mohd Hassan Marican and Mr Tham, who respectively hold the positions of Senior International Advisor and Corporate Advisor at Temasek International Advisors, a subsidiary of Temasek, are independent. All three directors have consistently exercised strong independent judgement in their deliberations. The board believes that they have acted and continue to act in the best interest of the company, as they are not accustomed or under an obligation, whether formal or informal, to act in accordance with the directions, instructions or wishes of Temasek.

CORPORATE GOVERNANCE STATEMENT
SEMBCORP INDUSTRIES ANNUAL REPORT 2015 103102 BUILDING THE FUTURE
The Chairman and the Group President & CEO are not related to each other. Their roles are kept separate to ensure a clear division of responsibilities, increased accountability and a greater capacity of the board for independent decision-making.
The Chairman, who is non-executive, chairs the board, ExCo, Executive Resource & Compensation Committee, Nominating Committee and the TAP. He leads and ensures effective and comprehensive board discussion on matters brought to the board, including strategic issues and business planning. The Chairman promotes an open environment for deliberation and ensures that board and board committee meetings are conducted in a manner
Board Members for 2015
Date of first Date of last re-election / Position held appointment re-appointment Board member on the board to the board as director Nature of appointment
Ang Kong Hua Chairman Feb 26, 2010 Apr 21, 2015* Non-executive / IndependentTang Kin Fei Director May 1, 2005 Apr 25, 2013* Executive / Non-independentBobby Chin Yoke Choong Director Dec 1, 2008 Apr 21, 2015 Non-executive / IndependentMargaret Lui Director Jun 1, 2010 Apr 25, 2013* Non-executive / Non-independentTan Sri Mohd Hassan Marican Director Jun 16, 2010 Apr 24, 2014* Non-executive / IndependentTham Kui Seng Director Jun 1, 2011 Apr 24, 2014 Non-executive / IndependentDr Teh Kok Peng Director Oct 15, 2012 Apr 21, 2015 Non-executive / IndependentAjaib Haridass Director May 1, 2014 Apr 21, 2015 Non-executive / IndependentNeil McGregor Director May 1, 2014 Apr 21, 2015 Non-executive / Non-independentNicky Tan Ng Kuang Director Nov 1, 2015 N.A.* Non-executive / IndependentGoh Geok Ling (Retired on Apr 21, 2015) Director May 3, 2000 Apr 24, 2014 Non-executive / IndependentEvert Henkes (Retired on Apr 21, 2015) Director Apr 30, 2004 Apr 24, 2014 Non-executive / Independent
* Up for retirement at AGM
Composition of Board Committees for 2015
Executive Resource & Executive Audit Risk Compensation Nominating TechnologyBoard member Committee Committee Committee Committee Committee Advisory Panel
Ang Kong Hua Chairman Chairman Chairman ChairmanTang Kin Fei Member MemberBobby Chin Yoke Choong1 Chairman Member Member Margaret Lui Member Member Member Tan Sri Mohd Hassan Marican Member Member Tham Kui Seng2 Member Member Dr Teh Kok Peng3 Member Member MemberAjaib Haridass4 Member Chairman Neil McGregor Member Nicky Tan Ng Kuang5 Goh Geok Ling6 Member Member Member Evert Henkes7 Member Chairman
Directors’ Attendance at Board and Board Committee Meetings in 2015
Executive Resource & Technology Executive Audit Risk Compensation Nominating Advisory Annual Board Committee Committee Committee Committee Committee Panel generalBoard member meeting meeting meeting meeting meeting meeting meeting meeting
Total Number of Meetings Held in 2015 6 4 7 4 3 2 3 1Ang Kong Hua 6/6 4/4 – – 3/3 2/2 3/3 1/1Tang Kin Fei 6/6 4/4 5/5 4/4 3/3 2/2 3/3 1/1Bobby Chin Yoke Choong1 6/6 – 7/7 4/4 – 1/1 – 1/1Margaret Lui 6/6 4/4 – – 3/3 2/2 – 1/1Tan Sri Mohd Hassan Marican 6/6 – – – 3/3 2/2 – 1/1Tham Kui Seng2 6/6 – 7/7 3/3 – – – 1/1Dr Teh Kok Peng3 6/6 – 7/7 – 1/1 – 3/3 1/1Ajaib Haridass4 6/6 – 3/3 4/4 – – – 1/1Neil McGregor 6/6 – – 4/4 – – – 1/1Nicky Tan Ng Kuang5 1/1 – – – – – – –Goh Geok Ling6 1/1 3/3 – – 2/2 1/1 – –Evert Henkes7 1/1 – 4/4 1/1 – – – –
1 Mr Chin was appointed a member of the Nominating Committee with effect from April 22, 2015. 2 Mr Tham was appointed a member of the Risk Committee with effect from April 22, 2015.3 Dr Teh was appointed a member of the Executive Resource & Compensation Committee with effect from April 22, 2015.4 Mr Haridass was appointed Chairman of the Risk Committee and a member of the Audit Committee with effect from April 22, 2015.5 Mr Tan was appointed a director with effect from November 1, 2015 and an Executive Committee member with effect from January 1, 2016.6 Mr Goh retired as an independent non-executive director and a member of the Executive Committee, Executive Resource & Compensation Committee and Nominating Committee on April 21, 2015.7 Mr Henkes retired as an independent non-executive director, Chairman of the Risk Committee and a member of the Audit Committee on April 21, 2015.
that allows non-executive directors to participate in meaningful and active discussions. He also provides advice to management and monitors all follow-up actions following the board’s decisions, ensuring that such decisions are translated into executive action. In addition, the Chairman provides leadership and guidance to management, particularly with regard to its global growth strategy and project investments. He also helps to oversee the Group’s talent management, and works with the Group President & CEO to ensure that robust succession plans are in place for key management positions.
The Group President & CEO makes strategic proposals to the board, develops the Group’s businesses in accordance with strategies, policies, budgets and business plans as approved by the board and provides close oversight, guidance and leadership to senior management.
Chairman and Chief Executive Officer (Principle 3)Clear division of responsibilities between the board and management

CORPORATE GOVERNANCE STATEMENT
SEMBCORP INDUSTRIES ANNUAL REPORT 2015 105104 BUILDING THE FUTURE
Nominating CommitteeThe Nominating Committee (NC) comprises non-executive directors, namely Mr Ang, Mrs Lui, Tan Sri Mohd Hassan Marican, as well as Mr Chin, who joined the NC on April 22, 2015. Three out of four of the members of the NC, including its chairman, are independent, namely Mr Ang, Tan Sri Mohd Hassan Marican and Mr Chin. Mr Goh, also an independent director, was a member of the NC until his retirement from the board on April 21, 2015.
The NC is responsible for reviewing Sembcorp’s board to ensure strong, independent and sound leadership to drive the continued success of the company and its businesses.
The key responsibilities of the NC are to:
• Ensure that the board has the right balance of skills, attributes, knowledge and experience in business, finance and related industries, as well as management skills critical to the company’s businesses
• Review the composition and size of the board and its committees and recommend new appointments, re-appointments and re-elections to the board and board committees as appropriate
• Review the directors’ independence and succession plans for the board
• Develop a process to evaluate board and board committee performance
• Review training and professional development programmes for the board
Board evaluation process and performance criteria The board believes that board performance is ultimately reflected in the long-term performance of the Group. Each year, in consultation with the NC, the board assesses its performance to identify key areas for improvement and requisite follow-up actions.
To provide feedback to aid in this assessment, each director is required to complete a questionnaire on the effectiveness of the board, board committees and directors’ contribution and performance. The evaluation considers factors such as the size and composition of the board and board committees, board processes and accountability, board and board committees’ development and effectiveness, information management, decision-making processes, risk and crisis management, succession planning, communication with senior management and stakeholder management. The evaluation and feedback are then consolidated and presented to the board for discussion on areas of strengths and weaknesses. In 2015, the NC reviewed and improved the directors’ questionnaire to further enhance assessment of board and board committee effectiveness. The assessment helps the directors to maintain focus on their key responsibilities, while improving board performance.
Board Membership (Principle 4)Formal and transparent process for the appointment and re-appointment of directors
Board Performance (Principle 5)Active participation and valuable contributions are key to overall effectiveness of the board
Succession planning, appointment and re-appointment of directorsThe NC seeks to refresh board membership progressively and in an orderly manner. All appointments to the board are made on merit and measured against objective criteria. Candidates must be able to discharge their responsibilities as directors while upholding the highest standards of governance practised by the Group. The board also recognises the contributions of directors who have, over time, developed deep insight into the Group’s businesses and exercises its discretion to retain the services of such directors where appropriate, to avoid an abrupt loss of experienced directors with a valuable understanding of the Group.
With reference to the Group’s strategies and business plans, the NC reviews the skills mix of board members to ensure that the board has the required diversity, including gender diversity, as well as the competencies to support our growth. When the need for a new director arises, the NC consults with management and identifies a list of potential candidates. These candidates are sourced through an extensive network of contacts and external databases where appropriate, based on the skill sets, experience, knowledge and attributes required to position the board to lead the growth of the company. Thereafter, the NC will interview the candidates and make its recommendation to the board for approval. In accordance with the company’s Constitution, the new director will hold office until the next AGM and, if eligible, can stand for re-appointment.
The company subscribes to the principle that all directors, including the Group President & CEO, should retire and submit themselves for re-election at regular intervals, subject to their continued satisfactory performance. The company’s Constitution requires a third of its directors to retire and subject themselves for re-election by shareholders at every AGM (one-third rotation rule).
In addition, all newly-appointed directors submit themselves for retirement and re-election at the AGM immediately following their appointment. Thereafter, these directors are subject to the one-third rotation rule.
Pursuant to the one-third rotation rule, Mr Tang, Mrs Lui and Tan Sri Mohd Hassan Marican will retire and submit themselves for re-election at the forthcoming AGM. Mr Tan, who was newly appointed to the board on November 1, 2015, will also submit himself for retirement and re-election by shareholders at the forthcoming AGM.
In addition, at the forthcoming AGM, Mr Ang, who is above the age of 70, will retire in accordance with a resolution passed at the company’s last AGM of April 21, 2015, pursuant to Section 153 of the Companies Act, Chapter 50 (which was then in force), and will submit himself for re-election.
The board does not encourage the appointment of alternate directors. No alternate director has been or is currently being appointed to the board.
Review of directors’ time commitmentsWhile reviewing the re-appointment and re-election of directors, the NC also considers the directors’ other board directorship representations and principal commitments to ensure they have sufficient time to discharge their responsibilities adequately. Taking into consideration the total time commitment required of our directors for involvement in Sembcorp’s board and board committees and for their other appointments outside our company, the board has determined that the maximum number of listed company board representations held by any Sembcorp Industries director should not exceed six.
For 2015, the board is satisfied that all directors have given sufficient time and attention to the affairs of the company and have discharged their duties adequately.

CORPORATE GOVERNANCE STATEMENT
SEMBCORP INDUSTRIES ANNUAL REPORT 2015 107106 BUILDING THE FUTURE
Complete, adequate and timely informationThe company recognises that directors should be provided with complete, adequate and timely information on an ongoing basis that enables them to make informed decisions, discharge their duties and keep abreast of the Group’s operational and financial performance, key issues, challenges and opportunities. Sembcorp’s management furnishes management and operation reports as well as financial statements to the board on a regular basis. Financial highlights of the Group’s performance and key developments are presented on a quarterly basis at board meetings and the Group President & CEO, Group Chief Financial Officer and members of senior management attend board and board committee meetings to provide insight into matters under discussion and address any queries that the directors may have.
In line with Sembcorp’s strong commitment towards environmental responsibility, directors are provided with electronic tablets that give them access to board and board committee papers prior to and during meetings. As a general rule, the board and board committee papers are made available to directors a week prior to meetings. This is to give the directors sufficient time to review and consider matters at hand. It also ensures that discussions at the meetings can be focused on any questions arising from these matters. The board has ready and independent access to the Group President & CEO, senior management, the company secretary and internal and external auditors at all times, should it require additional information.
Access to Information (Principle 6)Directors have complete, adequate and timely information and resources
Company SecretaryThe company secretary assists the Chairman to ensure good information flow within the board and its committees and between the board and senior management. In addition, the company secretary attends to corporate secretarial matters, such as arranging orientations for new directors and assisting with their professional development as required. In consultation with the Chairman and the Group President & CEO, the company secretary assists the board with scheduling of board and board committee meetings, prepares meeting agendas and administers, attends and minutes board proceedings. The company secretary assists the board on the Group’s compliance with the company’s Constitution and applicable regulations, including requirements of the Companies Act, Securities & Futures Act and SGX-ST. Moreover, the company secretary liaises on behalf of the company with SGX-ST, the Accounting and Corporate Regulatory Authority and when necessary, shareholders.
Independent professional adviceIn the furtherance of its duties, the board exercises its discretion to seek independent professional advice at the company’s expense, if deemed necessary.
With the assistance of the Executive Resource & Compensation Committee, the board ensures that a formal policy and transparent procedure for determining remuneration of executives and directors are in place.
Executive Resource & Compensation CommitteeThe Executive Resource & Compensation Committee (ERCC) is chaired by Mr Ang, an independent non-executive director. He is joined on the committee by Mrs Lui, Tan Sri Mohd Hassan Marican as well as Dr Teh, who was appointed to the ERCC on April 22, 2015. Mr Goh was a member of the ERCC until his retirement from the board on April 21, 2015.
The ERCC is responsible for developing, reviewing and recommending to the board the framework of remuneration for the board and key management personnel as defined in the Code. To this end, it:
• Assists the board to ensure that competitive remuneration policies and practices are in place and aligned with the prevailing economic environment
• Reviews the remuneration package of each director and member of key management, and endorses or makes further recommendations on such matters to the board for their consideration
• Establishes guidelines on share-based incentives and other long-term incentive plans and approves the grant of such incentives to key
Procedures for Developing Remuneration Policies (Principle 7) Remuneration of directors adequate and not excessive
REMUNERATION MATTERS management personnel. These incentives serve to motivate executives to maximise operating and financial performance and shareholder value. They are aimed at aligning the interests of key management personnel with those of shareholders
• Reviews succession planning for key management personnel and the leadership pipeline for the organisation
In its deliberations, the ERCC takes into consideration industry practices and compensation norms. The Group President & CEO does not attend discussions relating to his own compensation, terms and conditions of service, or the review of his performance. In addition, no ERCC member or any director is involved in deliberations in respect of any remuneration, compensation, share-based incentives or any form of benefits to be granted to himself / herself.
The ERCC has access to expert professional advice on human resource matters whenever there is a need for such external consultation. In 2015, Mercer (Singapore) was engaged as external consultants to provide such advice. In engaging external consultants, the company ensures that the relationship, if any, between the company and these external consultants will not affect the independence and objectivity of the external consultants. In 2015, the ERCC undertook a review of the independence and objectivity of Mercer (Singapore) and has confirmed that it has no relationships with the company which would affect its independence.
In reviewing succession planning and the Group’s leadership pipeline, the ERCC reviews the development of senior staff and assesses their strengths and development needs based

CORPORATE GOVERNANCE STATEMENT
SEMBCORP INDUSTRIES ANNUAL REPORT 2015 109108 BUILDING THE FUTURE
on the Group’s leadership competencies framework, with the aim of building talent and maintaining strong and sound leadership for the Group. On an annual basis, the ERCC reviews succession planning for the position of Group President & CEO and that of officers reporting directly to him, as well as for other selected key positions in the company. Potential internal and external candidates for succession are reviewed for different time horizons according to immediate, medium-term and long-term needs. In addition, the ERCC also reviews the company’s obligation arising in the event of termination of the Group President & CEO and key management personnel’s contracts of service, to ensure that such contracts contain fair and reasonable termination clauses.
The directors’ fees payable to non-executive directors are paid in cash and in share awards under the Sembcorp Industries Restricted Share Plan 2010. The ERCC has determined that up to 30% of the aggregate directors’ fees approved by shareholders for a particular financial year may be paid out in the form of restricted share awards. Directors’ cash fees and share awards will only be paid and granted upon approval by shareholders at the AGM of the company. Directors and their associates also abstain from voting on any resolution(s) relating to their remuneration.
Share awards granted under the Sembcorp Industries Restricted Share Plan 2010 to directors as part of directors’ fees will consist of the grant of fully paid shares outright with no performance and vesting conditions attached, but with a selling moratorium. However, this does not apply to Mr Tang, as he does not receive directors’ fees given that he is Group President & CEO of the company. Non-executive directors are required to hold shares in the company (including shares obtained by other means) worth at least the value of their annual basic retainer fee (currently S$75,000); any excess may be disposed of as desired. A non-executive director may only dispose of all of his shares one year after leaving the board. Subject to shareholders’ approval at the forthcoming AGM, the cash component of the directors’ fees for FY2016 is intended to be paid half-yearly in arrears.
The actual number of shares to be awarded to each non-executive director will be determined by reference to the volume-weighted average price of a share on the SGX-ST over the 14 trading days from (and including) the day the shares are first quoted ex-dividend after the AGM (or, if the resolution to approve the final dividend is not approved, over the 14 trading days immediately following the date of the AGM). The number of shares to be awarded will be rounded down to
Sembcorp believes that its remuneration and reward system is aligned with the long-term interest and risk policies of the company. It also recognises that a competitive remuneration and reward system based on individual performance is important to attract, retain and incentivise the best talent.
The Group President & CEO, as an executive director, does not receive director’s fees from Sembcorp. As a lead member of management, his compensation consists of his salary, allowances, bonuses and share-based incentives conditional upon meeting certain performance targets. Details on the share-based incentives and performance targets are available in the Directors’ Statement and Note 32 in the Notes to the Financial Statements.
Level and Mix of Remuneration (Principle 8) Competitive reward system to ensure highest performance and retention of directors and key management personnel
Directors’ Fee Framework for FY2015 S$
Chairman’s fee (all-in)* 750,000 Director’s basic retainer fee 75,000Executive CommitteeChairman’s allowance 50,000Member’s allowance 30,000Audit CommitteeChairman’s allowance 50,000Member’s allowance 30,000Executive Resource & Compensation CommitteeChairman’s allowance 35,000Member’s allowance 20,000Risk CommitteeChairman’s allowance 35,000Member’s allowance 20,000Nominating Committee Chairman’s allowance 25,000Member’s allowance 15,000Technology Advisory Panel / OthersChairman’s allowance 25,000Member’s allowance 15,000Attendance feesBoard meeting 5,000Committee meeting 2,500Teleconference (board meeting) 2,000Teleconference (committee meeting) 1,000Travel allowance for overseas directors≤ 4 hours (to and fro air travel time) 2,500> 4 to 15 hours (to and fro air travel time) 5,000> 15 hours (to and fro air travel time) 10,000
Notes:* With effect from January 1, 2014, the Chairman of our board will only
receive one all-in chairman’s fee. He will not receive the directors’ basic fee, nor any further fees or allowances for serving as a chairman or member of any of our board committees.
1 As an executive director, Mr Tang does not receive directors’ fees.2 The attendance fee for committee meetings also applies to attendance at
general meetings.
Non-executive directors’ feesThe framework below adopted by the company is based on a scale of fees divided into basic retainer fees, attendance fees and allowances for travel and service on board committees:
the nearest hundred and any residual balance will be settled in cash. The share component of the directors’ fees for FY2016 is intended to be paid in 2017 after the AGM has been held.
The company does not have a retirement remuneration plan for non-executive directors.
Remuneration for key management personnelSembcorp’s remuneration and reward system for key management personnel is designed to ensure a competitive level of compensation to attract, retain and motivate employees to deliver high-level performance in accordance with the company’s established risk policies. The remuneration of our key management personnel comprises three primary components:
• Fixed remunerationFixed remuneration includes an annual basic salary, and where applicable, fixed allowances, an annual wage supplement and other emoluments. Base salaries of key management personnel are determined based on the scope, criticality and complexity of each role, equity against peers with similar responsibilities, experience and competencies, individual performance and market competitiveness.
• Annual variable bonusesThe annual variable bonus is intended to recognise the performance and contributions of the individual, while driving the achievement of key business results for the company. The annual variable bonus includes two components. The first is linked to the achievement of pre-agreed financial and non-financial performance targets, while the second is linked to the creation of economic value added (EVA).
The EVA-linked bonus component is held in a “bonus bank”. Typically, one-third of the balance in the bonus bank is paid out in cash

CORPORATE GOVERNANCE STATEMENT
SEMBCORP INDUSTRIES ANNUAL REPORT 2015 111110 BUILDING THE FUTURE
each year, while the balance two-thirds is carried forward to the following year. Such carried-forward balances of the bonus bank may either be reduced or increased in future, based on the yearly EVA performance of the Group and its subsidiaries. There are provisions in the EVA incentive plan to allow for forfeiture of the outstanding balances in the bonus bank in exceptional circumstances of misstatement of financial results or misconduct resulting in financial loss to the company.
• Share-based incentivesThe company’s performance share plan and restricted share plan were approved and adopted by the shareholders at an extraordinary general meeting of the company held on April 22, 2010. Through our share-based incentives, we motivate key management personnel to continue to strive for the Group’s long-term shareholder value. In addition, our share-based incentive plans aim to align the interests of participants with the interests of shareholders, so as to improve performance and achieve sustainable growth for the company.
Pay for performanceAs in prior years, a pay-for-performance study was conducted in 2015 by our external consultants, Mercer (Singapore), to review the alignment between the Group’s executive pay programme, shareholder returns and business results. The Group benchmarked itself with established global energy and utilities firms and comparably-sized local listed companies with which the Group competes for talent and capital.
The study benchmarked different elements of senior executive pay, namely fixed remuneration, total cash remuneration and total compensation including long-term incentives, against that of peer companies. It found senior executive pay to be positioned competitively vis-à-vis the Group’s relative
size and performance. Executive compensation for the year had a robust correlation to the Group’s profit from operations and EVA. In the longer term, there was also a strong relationship between executives’ total compensation (which includes share awards for the Group President & CEO and senior executives) and the Group’s three-year earnings per share growth, wealth added and total shareholder return. Overall, the study showed a strong correlation between the Group’s executive pay and its business results and shareholder returns, indicating strong pay-for-performance alignment.
The computation of non-executive directors’ fees totalled S$2,182,750 in 2015 (2014: S$2,165,833). More information on directors and key management personnel’s remuneration may be found under the related item in the Supplementary Information section of the Financial Statements.
In 2015, the company had no employees who were immediate family members of a director or the Group President & CEO.
Disclosure on Remuneration (Principle 9)
Sembcorp is committed to open and honest communication with shareholders at all times. The company presents a balanced and clear assessment of the Group’s performance, position and prospects to shareholders through the timely release of its quarterly and annual financial reports. The company believes that prompt compliance with statutory reporting requirements is imperative to maintaining shareholders’ confidence and trust in the company. In line with stock exchange requirements, negative assurance statements were issued by the board to accompany the company’s quarterly financial results announcements, confirming that to the best of its knowledge, nothing had come to its attention which would render the company’s quarterly results false or misleading.
The board has overall responsibility for the governance of the Group’s risk management and internal controls. The company’s board and management are fully committed to maintaining sound risk management and internal control systems to safeguard shareholders’ interests and the Group’s assets.
The board determines the company’s levels of risk tolerance and risk policies, and oversees management in the design, implementation and monitoring of risk management and internal control systems.
Accountability (Principle 10) The board is accountable to shareholders
Risk Management and Internal Controls (Principle 11)
ACCOUNTABILITY AND AUDIT Risk CommitteeThe Risk Committee (RC) assists the board in overseeing risk management for the Group. The RC is headed by Mr Haridass, who was appointed its chairman on April 22, 2015. He is joined on the committee by Mr Chin, Mr McGregor, as well as Mr Tham, who was appointed to the RC on April 22, 2015. Prior to this, the RC was chaired by Mr Henkes, until his retirement from the board on April 21, 2015. The RC’s principal functions are to:
• Review and endorse the risk management plans of the Group
• Review and approve group-wide risk policies, guidelines and limits
• Review the adequacy and effectiveness of the risk management systems, processes and procedures of the Group
• Review risk-related reports submitted to it by management. These include updates on the Group’s risk portfolio, reports on major risk exposure and any other risk-related issues as well as actions taken to monitor and manage such exposure / issues
• Review infrastructure and resources in place to support the management of risk, including for instance, human resources, information technology systems, reporting structure and procedures
Adequate and effective system of internal controlsThe Group has implemented a comprehensive enterprise risk management (ERM) framework where key risks identified are deliberated by management with the support of the risk management function, and reported regularly to the RC. Supporting the ERM framework is a system of internal controls, comprising a code of business conduct, group-wide governance and internal control policies, procedures and guidelines dictating

CORPORATE GOVERNANCE STATEMENT
SEMBCORP INDUSTRIES ANNUAL REPORT 2015 113112 BUILDING THE FUTURE
the segregation of duties, approval authorities and limits, and checks and balances embedded in business processes. The Group has also considered the various financial risks, details of which are found on page 122 of the annual report.
Our ERM framework is complemented by a governance assurance framework and a risk-based control self-assessment programme. During the year, the Group’s risk profile was reviewed and updated. The effectiveness of our internal controls was also assessed and enhanced through a combination of management control self-assessments, certifications and internal audits, as well as actions taken in follow up to these exercises. For more information on the company’s ERM framework, please refer to the Risk Management and Internal Controls chapter of this annual report.
For the financial year under review, the board has been assured by the Group President & CEO and Group Chief Financial Officer that financial records have been properly maintained, that the financial statements give a true and fair view of the company’s operations and finances and that the risk management and internal control systems of the Group are adequate and effective.
The board, with the concurrence of the Audit Committee, is of the opinion that the company’s internal controls are adequate and effective as at December 31, 2015 to address the financial, operational, compliance and information technology risks of the Group. This assessment is based on the internal controls established and maintained by the Group, work performed by external and internal auditors and reviews performed by senior management. Internal controls, because of their inherent limitations, can provide reasonable but not absolute assurance regarding the achievement of their intended control objectives. In this regard, the board will ensure that should any significant internal control failings or weaknesses arise, necessary remedial actions will be swiftly taken.
The Audit Committee (AC) comprises independent, non-executive directors. The AC is chaired by Mr Chin and its members are Mr Tham, Dr Teh, as well as Mr Haridass, who joined the AC on April 22, 2015. Mr Henkes was a member of the AC until his retirement from the board on April 21, 2015.
Authority and duties of the ACThe AC assists the board in fulfilling its fiduciary responsibilities relating to the internal controls, financial accounting and reporting practices of the Group. Its main responsibilities are to:
• Review the company’s policies and control procedures and accounting practices with external auditors, internal auditors and management
• Review and act in the interest of the shareholders in respect of interested person transactions, as well as any matters or issues that affect the financial performance of the Group
• Review the quarterly, half-year and full-year results announcements, accompanying press releases and presentation slides, as well as the financial statements of the Group and the adequacy and accuracy of information disclosed prior to submission to the board for approval
The AC has explicit authority to investigate any matter within its terms of reference. It has full access to and co-operation from management and full discretion to invite any director or executive officer to attend its meetings. It also has reasonable resources to enable it to discharge its function properly.
Where relevant, the AC is guided by the recommended best practice for audit committees, set out in the revised Guidebook for Audit Committees issued by Singapore’s Audit Committee Guidance Committee in August 2014.
Audit Committee (Principle 12) External auditorsEach year, the AC reviews the independence of the company’s external auditors and makes recommendations to the board on the re-appointment of the company’s external auditors. During the year, the AC has reviewed the performance of the external auditors using Audit Quality Indicators recommended by the Accounting and Corporate Regulatory Authority as reference.
The AC reviews and approves the external audit plan to ensure the adequacy of the audit scope. It also reviews the external auditors’ management letter and monitors the timely implementation of required corrective or improvement measures. The AC meets external and internal auditors at least once a year without the presence of management. It has reviewed the nature and extent of non-audit services provided by the external auditors to the Group for the year, excluding services provided to Sembcorp Marine, a listed subsidiary that has its own audit committee. The AC is satisfied that the independence of the external auditors has not been impaired by their provision of non-audit services. Accordingly, the AC has recommended the re-appointment of the external auditors at the forthcoming AGM. Details of non-audit fees payable to the external auditors are found in Note 28(a) in the Notes to the Financial Statements.
Whistle-blowing policyThe AC oversees the Group’s whistle-blowing policy implemented to strengthen corporate governance and ethical business practices across all business units. Employees are provided with accessible channels to report suspected fraud, corruption, dishonest practices or other misdemeanours to the Group’s internal auditors and are protected from reprisal to the extent possible. This aims to encourage the reporting of such matters in good faith. For more information on our whistle-blowing policy, please refer to the Risk Management and Internal Controls chapter of this annual report.
The Group Internal Audit department (GIA) is an independent function of the Group. The AC approves the hiring, termination, evaluation and compensation of the Head of GIA, who reports directly to the AC on audit matters and to the Group President & CEO on administrative matters.
Adequacy of the internal audit functionThe AC reviews the effectiveness of the internal audit function on an annual basis, including the adequacy of audit resources. GIA adopts a risk-based methodology in drawing up its annual internal audit plan, which is reviewed and approved by the AC.
GIA also assists the board and management in the discharge of their corporate governance responsibilities, as well as in improving and promoting effective and efficient business processes within the Group. Internal audits aim to ensure that the Group maintains a sound system of internal controls and that our operations comply with the internal control framework. Internal audit reports are reviewed by the AC.
Professional standards and competencyGIA employs qualified staff and provides them with training and development opportunities so that their technical knowledge remains current and relevant. GIA is guided by, and has met standards for, the professional practice of internal audit promulgated by the Institute of Internal Auditors (IIA). An external assessment of GIA affirmed that its internal audit activity conforms on the whole to the standards set by IIA.
Internal Audit (Principle 13) Independent internal audit function

CORPORATE GOVERNANCE STATEMENT
SEMBCORP INDUSTRIES ANNUAL REPORT 2015 115114 BUILDING THE FUTURE
Sembcorp treats all shareholders fairly and equitably. The company recognises, protects and facilitates the exercise of shareholders’ rights and continually reviews and updates such governance arrangements.
The company is committed to ensuring that all shareholders have easy access to clear, reliable and meaningful information in order to make informed investment decisions. The company regularly communicates major developments in its business operations via SGXNET, press releases, circulars to shareholders and other appropriate channels. The company also encourages shareholder participation and voting at general meetings of shareholders.
Sembcorp advocates high standards of corporate transparency and disclosure. This commitment is embodied in the company’s investor relations policy which adheres to fair disclosure principles and emphasises active dialogue and engagement with shareholders, investors and analysts.
Disclosure of information on a timely basisSembcorp makes every effort to ensure that shareholders and capital market players have easy access to clear, meaningful and timely information on the company in order to make informed investment decisions. To do this, various channels including announcements, press releases, shareholder circulars and annual reports are utilised. All price-sensitive and material information is disseminated via SGXNET on a non-selective basis
Shareholder Rights (Principle 14)
Communication with Shareholders (Principle 15) Regular, effective and fair communication with shareholders
Conduct of Shareholder Meetings (Principle 16) Greater shareholder participation at general meetings
SHAREHOLDER RIGHTS AND RESPONSIBILITIES
and in a timely and consistent manner. The company’s announcements are also uploaded on the company website, www.sembcorp.com, after dissemination on SGXNET.
The date of the release of quarterly results is disclosed at least two weeks prior to the date of announcement via SGXNET. On the date of announcement, the financial statements as well as the accompanying press release and presentation slides are released via SGXNET and on the company website. Thereafter, a briefing or teleconference by management is jointly held for the media and analysts. For first-half and full-year results announcements, results briefings are concurrently broadcast live via webcast. Investor relations officers are available by email or telephone to answer questions from shareholders, analysts and the media as long as the information requested does not conflict with SGX-ST’s rules of fair disclosure.
The company also maintains a dedicated investor relations section on its company website to cater to the specific information needs of shareholders, investors, analysts and the financial community. Designed to provide a convenient repository for investors’ information needs, the site includes filings on the company’s results announcements since the company’s listing in 1998, an archive of the company’s results briefing webcasts, downloadable five-year financial data, a calendar of upcoming events, as well as pertinent stock information such as dividend history, share price charts and analyst coverage. Investor relations contact information is also displayed on the website for direct shareholder enquiries.
Establishing and maintaining regular dialogue with shareholdersSembcorp employs multiple communication platforms to engage with its shareholders. In addition to its results briefings, the company also
maintains regular dialogue with its shareholders through investor-targeted events such as AGMs, roadshows, conferences, site visits, group briefings and one-to-one meetings. These platforms offer opportunities for senior management and directors to interact first-hand with shareholders, understand their views, gather feedback and address concerns.
To keep senior management and the board abreast of market perception and concerns, the investor relations team provides regular updates on analyst consensus estimates and views. On an annual basis, a more comprehensive update is presented, which includes updates and analysis of the shareholder register, highlights of key shareholder engagements for the year as well as market feedback.
For further details on Sembcorp’s communications with its shareholders, please see the Investor Relations chapter of this annual report.
Dividend policy Sembcorp is committed to achieving sustainable income and growth to enhance total shareholder return. The Group’s policy aims to balance cash return to shareholders and investment for sustaining growth, while maintaining an efficient capital structure. The company strives to provide consistent and sustainable ordinary dividend payments to its shareholders on an annual basis.
All shareholders are invited to participate in the company’s general meetings.
The company disseminates information on general meetings through notices in its annual reports or circulars. These notices are also released via SGXNET, published in local newspapers and posted on the company website ahead of the meetings to give ample time for shareholders to review the documents. In line with the company’s commitment towards environmental responsibility, the company’s annual reports and circulars are sent to shareholders in the form of a CD-ROM. The annual reports and circulars may also be viewed on the company website. However, we are mindful that some shareholders may prefer to receive a printed copy and this will be provided upon request.
The company’s Constitution allows all shareholders the right to appoint up to two proxies to attend, speak and vote at general meetings on their behalf. Under the new multiple proxy regime, “relevant intermediaries” such as banks, capital markets services licence holders which provide custodial services for securities and the Central Provident Fund Board (CPF), are allowed to appoint more than two proxies to attend, speak and vote at general meetings. This will enable indirect investors, including CPF investors, to be appointed as proxies to participate at general meetings. Voting in absentia by mail, facsimile or email is currently not permitted. Such voting methods would need to be cautiously evaluated for feasibility to ensure that there is no compromise to the integrity of the information and the authenticity of the shareholders’ identity.
The Group President & CEO delivers a short presentation at each AGM to shareholders to update them on the performance of Sembcorp’s

CORPORATE GOVERNANCE STATEMENT
SEMBCORP INDUSTRIES ANNUAL REPORT 2015 117116 BUILDING THE FUTURE
businesses. Every matter requiring approval at a general meeting is proposed as a separate resolution. Shareholders present are given an opportunity to clarify or direct questions on issues pertaining to the proposed resolutions before the resolutions are voted on. The board and management are in attendance to address these queries or concerns and obtain feedback from shareholders. External auditors and legal advisors are also present to assist the board as necessary.
The company conducts electronic poll voting at shareholder meetings for greater transparency in the voting process. The total number of votes cast for or against each resolution is tallied and displayed live on-screen to shareholders immediately after the vote has been cast. Results will also be announced after the meetings via SGXNET.
Minutes of shareholder meetings are available upon request by shareholders.
Dealings in securitiesThe company has adopted a Code of Compliance on Dealing in Securities, which prohibits dealings in the company’s securities by its directors and senior management within two weeks prior to the announcement of the company’s financial statements
for each of the first three quarters of its financial year and within one month prior to the announcement of the company’s full-year financial statements. Directors and employees are advised to be mindful to observe insider trading laws at all times, even when dealing in the company’s securities outside the prohibited trading period. They are also reminded not to deal in the company’s securities on short-term considerations.
Interested person transactionsShareholders have adopted an interested person transaction (IPT) mandate in respect of interested person transactions of the company. The IPT mandate defines the levels and procedures to obtain approval for such transactions. Information regarding the IPT mandate is available on the staff intranet. All business units are required to be familiar with the IPT mandate and report any interested person transactions to the company, to be reviewed by the AC. The Group maintains a register of the company’s interested person transactions in accordance with the reporting requirements stipulated by Chapter 9 of the SGX-ST Listing Manual. Information on interested person transactions for 2015 may be found in the related item under the Supplementary Information section of the Financial Statements in this annual report.
Governance Disclosure Guide
In line with Sembcorp’s commitment towards high standards of corporate governance and disclosure, the company has completed the Disclosure Guide developed by the Singapore Exchange in 2015. The company’s responses to the Disclosure Guide may be found on pages 340 to 351 of this annual report.
Sembcorp Woodchip Boiler Plant on Jurong Island in Singapore

SEMBCORP INDUSTRIES ANNUAL REPORT 2015 119118 BUILDING THE FUTURE
Managing risk is an integral part of our business activities and is performed to create value for the Group.
The Group manages risk under an overall strategy, determined by the board of directors and supported by the board’s Risk Committee and Audit Committee. The Risk Committee reviews and enhances the effectiveness of the Group’s risk management and health, safety and environment (HSE) plans, systems, processes and procedures. It also regularly reviews group-wide risk and HSE policies, guidelines and limits, as well as significant risk exposures relating to foreign exchange rates, commodity prices and major investment projects and corresponding risk mitigation plans. Oversight responsibility for risk management within the Group’s listed entities lies with their respective boards.
RISK APPETITE FRAMEWORK
The board has determined a risk appetite framework for Sembcorp that forms a common understanding for both our board and management in the execution of the Group’s strategy and objectives. Under this framework, the board has approved risk appetite statements with respect to the following five focus areas. These are aligned to the focus areas under which the Group categorises its material issues, in managing and reporting its overall sustainability performance:
a. EconomicSembcorp actively pursues global strategies to meet our growth objectives. We will continue to invest in
and develop our capabilities and expand our assets in both existing and new markets, with a particular emphasis on emerging markets. Investing in such markets inevitably carries with it inherent risks; however, the Group is a disciplined investor with a robust investment approval process that calls for the necessary due diligence and risk management to be done. The Group has a defined set of country limits and the limit for investment exposure in countries deemed to be of high and medium risk has been set at no more than 65% of our total investment exposure. In addition, we also maintain appropriate single-country limits.
The Group commits to maintaining a strong financial position and targets to achieve an investment grade equivalent credit rating to ensure access to funding and protect shareholder value. The Group will not take part in any form of transaction that is deemed speculative in nature, under any circumstances.
b. Governance, Risk & ComplianceAs a listed company on the Singapore stock exchange that has both responsibility and accountability to a wide range of stakeholders, Sembcorp takes a very serious view of governance, risk and compliance. The Group commits to comply with all applicable laws and regulatory requirements in the countries where it operates. The Group adopts a zero tolerance stance towards any form of fraud, bribery or corruption.
c. PeopleSembcorp recognises the need to have in place a strong and competent workforce that is aligned to our core values and ethical standards. The Group
Sembcorp’s risk management frameworks and internal controls safeguard
our people and assets and protect and enhance shareholder value.
RISK MANAGEMENT AND INTERNAL CONTROLS
will also continue to attract, develop and retain employees with the relevant skill sets and competencies to meet our business needs and growth plans and ensure leadership continuity.
d. Health, Safety and the EnvironmentIn its pursuit of operational excellence and business growth, Sembcorp will not compromise the health and safety of both its internal and external stakeholders. The health and safety of all our employees is of paramount importance to the Group. We take a serious view of any breaches in health, safety and environmental standards and regulations in all our operations and facilities.
e. CommunitySembcorp believes that as an integral part of our communities, we should conduct our business in a responsible manner and make a positive contribution to the communities in which we operate. The Group is therefore committed to high standards of business conduct, to engaging our stakeholders and to managing our environmental and social impact on local communities responsibly.
The above risk appetite statements are also supported by key risk indicators, which are continuously monitored and reported to the Risk Committee on an ongoing basis.
ENTERPRISE RISK MANAGEMENT
The Group is committed to ensuring that an effective and practical enterprise risk management (ERM) framework is in place to safeguard our people and assets, protect shareholders’ interests, facilitate informed decisions for intrinsic value creation and ultimately uphold and enhance our
brand and reputation. In designing our ERM framework, the Group has adapted and made reference to various industry risk management standards, such as ISO 31000 and the Enterprise Risk Management – Integrated Framework issued by the Committee of Sponsoring Organizations of the Treadway Commission (COSO). This ensures that we are in line with best practice. To sustain a successful ERM programme, we believe in having the right processes and tools as well as instilling the right risk awareness culture. Our ERM framework specifically sets out a systematic and structured approach towards risk management through the following activities:
• Awareness trainings and workshops• Risk identification and assessment• Formulation of key risk management strategies• Design and implementation of risk mitigation
controls (preventive, detective and responsive controls)
• Monitoring and timely reporting of risk management performance and risk exposure levels
• Continuous improvement of risk management mitigation measures and capabilities
Our ERM framework is supported by the following key pillars:
a. Fraud risk managementb. Operational risk managementc. Financial, market and credit risk managementd. Investment risk management
a. Fraud Risk ManagementThe possibility of fraud is an inherent risk in any organisation. To manage this, the Group has established a fraud risk management policy,

RISK MANAGEMENT AND INTERNAL CONTROLS
SEMBCORP INDUSTRIES ANNUAL REPORT 2015 121120 BUILDING THE FUTURE
which has been approved by our board’s Risk Committee. The policy provides a framework and comprehensive guidance on anti-fraud measures to pro-actively manage the risk of fraud, bribery and corruption. All subsidiaries are required to have a fraud control plan in place. We actively influence and encourage our joint ventures and associates to adopt our fraud risk management framework. The Group maintains a zero tolerance policy for fraud, which we take to include corruption and bribery. This stance is regularly communicated to employees through awareness training sessions, workshops and e-learning programmes.
The following key activities and complementary policies and procedures are part of our holistic approach towards fraud risk management and also address the risk of bribery and corruption:
Preventive anti-fraud measures• Code of business conduct • Employee code of conduct • Conflict of interest policy• Corporate gift policy• Fraud risk assessments• Employee and third party due diligence
Detective anti-fraud measures• Whistle-blowing policy• Forensic data analysis• Compliance and monitoring• Pre-employment screening
Responsive anti-fraud measures• Fraud reporting procedures• Fraud investigation procedures• Grievance handling procedures
Whistle-blowing policySince 2005, Sembcorp has maintained a whistle-blowing policy and procedure. We provide employees with well-defined and accessible
channels within the Group through which they may, in confidence, raise concerns regarding possible improprieties in the conduct of business activities, financial reporting or other matters to the Audit Committee. This facilitates independent investigation of such matters for appropriate resolution. The policy is communicated to all employees and is subject to review on a regular basis.
Employees are encouraged to report suspected wrongdoing, in confidence and without fear of reprisal, in relation to the following:
• Mail or wire fraud, bank fraud or fraudulent acts• Violations of laws, rules or regulations applicable
to the company and related to accounting, internal accounting controls or audit matters
• Intentional error or fraud in the preparation, review or audit of any financial statement of the company
• Significant deficiencies in or intentional non-compliance with the company’s internal accounting controls
• Any reportable conduct, defined to mean any one of the following:– Unlawful, unethical, corrupt or
improper conduct– Conduct that is in breach of any policy
of the company– Misuse of funds or assets of the company– Conduct that jeopardises the safety of the
company’s employees, the environment in which they are working, or the public
– Abuse of authority– Any other conduct that may cause financial
or non-financial loss to the company or damage to the company’s reputation
– Suppression or concealment of any information relating to any of the above conduct
– Acts to mislead, deceive, manipulate, coerce or fraudulently influence any internal or
external accountant or auditor in connection with the preparation, examination, audit or review of any financial statement or record of the company or the Group
– Criminal acts, including theft, the sale or use of drugs, money laundering, violence or threatened violence and criminal damage against property
– Detrimental actions taken in reprisal against a whistle-blower
A whistle-blower may submit his / her allegations or concerns either by telephone, email or through other written forms or existing communication channels. The company will protect the confidentiality and anonymity of the whistle-blower. The whistle-blowing case will be received by the head of Group Internal Audit and an investigation will be conducted in compliance with the requirements set out in the company’s whistle-blowing policy. If an employee who uses whistle-blowing channels is found to have wilfully done so in bad faith, disciplinary action will be taken against him / her. A copy of our whistle-blowing policy is available on our company website, www.sembcorp.com.
b. Operational Risk ManagementCrisis management and business continuityWith operations extending across the globe, the Group monitors for emerging threats that may disrupt its operations, and formulates and updates its strategies and mitigation measures accordingly. Focus is placed on establishing a robust and effective crisis management framework that is relevant to the current business environment and risk landscape. We aim to enhance and improve existing emergency response protocols and business continuity plans across our business entities, to strengthen operational readiness. Crisis communication procedures are also embedded as part of the Group’s crisis management framework.
The Group’s crisis management, emergency response and business continuity procedures and plans are regularly tested and fine-tuned to ensure that the Group can respond effectively to crises and emergencies. The Group also addresses crises and emergencies through the implementation of appropriate prevention, preparedness and response and recovery programmes, while ensuring that critical business functions can recover and continue in a timely manner. In addition, the Group adopts key standards and practices set out by ISO 22301:2012 under Societal Security – Business Continuity Management Systems – Requirements. This approach enables us to build resilience and enhance our ability to manage and respond to emergencies. It also helps to minimise the impact of incidents on people and the environment, prevent loss of assets and mitigate disruption to business operations, while safeguarding the company’s reputation.
Health, safety and the environmentThe Group HSE department is guided by our Group President & CEO and the board-level Risk Committee, reflecting the high priority accorded to HSE issues at Sembcorp. The department has formalised a group-wide HSE management system and promotes global HSE efforts to ensure effective and timely management of HSE issues across the Group. This management system is aligned with ISO 14001 and OHSAS 18001 standards and provides guidance to business units in actively managing HSE risks associated with our activities and services in a systematic manner. For more information on the company’s HSE management, please refer to the relevant section in the Sustainability Report contained in this annual report.
Insurance The Group actively reviews its insurable and uninsurable risks, and identifies comprehensive and

RISK MANAGEMENT AND INTERNAL CONTROLS
SEMBCORP INDUSTRIES ANNUAL REPORT 2015 123122 BUILDING THE FUTURE
cost-effective risk management tools to manage such risks. As a risk transfer mechanism, the Group has purchased a comprehensive set of insurance policies to protect its business operations against financial loss resulting from property damage, machinery breakdown, business interruption or general third party liability. The Group has also engaged a panel of top-tier insurance consultants, leveraging their technical expertise and resources to negotiate for competitive pricing and comprehensive coverage with commercial insurance companies. To balance the cost of risk transfer, the Group focuses on insuring catastrophic events while maintaining its emphasis on improving internal controls over operations and maintenance. Sembcorp Captive Insurance, a wholly-owned captive insurance subsidiary, provides first layer coverage against property damage and business interruption losses for the Group’s operations in Singapore and on the Wilton International site in the UK. Sembcorp Captive Insurance serves not only as an internal risk transfer mechanism, but also showcases the Group’s efforts to promote greater accountability and responsibility in the operations and maintenance of its business units. Over the years, Sembcorp Captive Insurance has successfully built up a strong capital surplus, allowing it to extend its insurance reach to other operations and broaden its scope of coverage.
c. Financial, Market and Credit Risk ManagementThe Group actively manages its financial, market and credit risk exposure with respect to foreign exchange rates, commodity prices and interest rates via established policies, including treasury policies, financial authority limits and a system of financial discipline. These policies set out the parameters for managing the Group’s exposure to counterparty, liquidity, foreign exchange and other material transaction risks.
Financial and market riskThe Group defines and utilises approved financial instruments to manage exposure to foreign exchange, commodity prices and interest rate fluctuations arising from operational, financing and investment activities. The commodities include fuel oil, coal and natural gas. Transactions such as foreign exchange forwards, interest rate swaps, commodities swaps, purchase of options and contracts for differences are used to manage these risks as appropriate. Under the Group’s overall treasury policy, transactions for speculative purposes are strictly not allowed. Transactions are allowed only for hedging purposes based on the underlying business and operating requirements. Exposure to foreign currency risk is also hedged naturally where possible. In addition, the Group has financial authority limits, which seek to limit and mitigate operational risk by setting out the threshold of approvals required for entering into contractual obligations and investments.
Default and counterparty credit risksCounterparty credit risk refers to the risk that a counterparty may fail to fulfil its payment or performance obligations under contracts to which it is a party. Sembcorp has a group-wide credit risk policy in place, under which we will, as far as possible, maintain a practice of dealing with counterparties who are creditworthy. To this end, we perform periodic credit evaluations to establish and verify the credit rating of current and potential counterparties, such as customers, contractors, joint venture partners and financial institutions. Appropriate credit limits are then set, according to the established credit rating and business volume, to avoid undue credit exposure. Credit exposure and overdue accounts are closely monitored and managed through vigorous collection efforts. For counterparties that do not meet the minimum credit rating requirement, credit protection such as
additional securities, guarantees, advanced payment and shortened payment terms may be requested on a case-by-case basis as risk mitigation measures. Another area of focus is managing concentration risk with respect to our credit exposure. Our concentration risk is diligently reviewed to ensure that no single counterparty or group of related counterparties has excessive credit exposure that may result in a material impact on the Group in the event of a default.
d. Investment Risk ManagementTo ensure that prudence is exercised in all investment decisions, the Group has in place an investment approval process, under which a disciplined approach is taken to review the key risks and opportunities presented by potential investments. As part of our investment approval process, all new investments and transactions are reviewed by a cross-functional project team that provides risk assessments, mitigation measures and recommendations to the respective authorised persons for approval in accordance with applicable financial authority limits.
In addition, to ensure that Sembcorp maintains appropriate diversification across different geographies, the Group has put in place a country risk framework to monitor and report its investment exposure globally. Countries are classified into high, medium and low risk categories based on their macroeconomic and sovereign risks, political and corruption risks, regulatory and transfer risks, as well as social and environmental risks. Furthermore, our investment exposure under each country is regularly reported to the board’s Risk Committee. This framework also defines limits that have been approved by the board and stipulates that any deviation from these country limits requires board approval according to a set procedure. In reviewing any request for deviations from the country limits, the board will consider the key risk drivers at hand, in terms of investment size,
duration and economic life of the project, as well as the level of residual risk after the implementation of mitigation plans.
As at December 31, 2015 the countries outside of Singapore in which the Group has the largest investment exposure are India (S$2.8 billion), China (S$2.3 billion) and Brazil (S$1.4 billion). Investment exposure comprises invested capital, including reserves, and committed contingent support for projects and assets.
INTERNAL CONTROLS
Supporting the ERM framework is a system of internal controls, comprising a code of business conduct, a comprehensive set of group-wide governance and functional policies, approval authorities and limits, which ensures that entity-level controls are implemented across the Group. The Group’s internal control policy and manual, which adopts COSO principles, provides a framework for an effective and adequate system of internal controls that business units should put in place. It also guides us on the appropriate segregation of duties and checklist of internal controls.
The ERM framework is complemented by a governance assurance framework and a risk- based control self-assessment programme. The effectiveness of key controls is rated, and the rationale for ratings documented, to enable management to better identify and manage key control gaps or weaknesses.
Collectively, the respective risk management and internal control frameworks and initiatives support the overall risk and governance ecosystem. This comprises the board, the Group’s risk and governance departments, our business units, as well as the internal audit team.

RISK MANAGEMENT AND INTERNAL CONTROLS
SEMBCORP INDUSTRIES ANNUAL REPORT 2015 125124 BUILDING THE FUTURE
Audit & Risk Committees
• Oversee risk management and internal controls of the Group, and advise the board on such matters
• Determine the Group’s overall risk appetite and tolerance
• Review and approve risk management and governance-related frameworks and policies
RISK & GOVERNANCE ECOSYSTEM
Group Risk & Governance
• Develop the Group’s overall risk management programme
• Design and own group-level risk management and governance frameworks and policies
• Monitor the status of implementation across entities within the Group
• Adopt industry best practice and communicate this to businesses and employees
Internal Audit
• Audits the adequacy and effectiveness of our risk management and internal controls, using a risk-based methodology
• Provides independent assurance of compliance to relevant Group policies
Business Units
• Hold accountability for respective risks and controls• Provide source information on and assessment of
risk and controls• Develop operating procedures and manuals aligned
with the Group’s governance policies, to ensure legal, regulatory and contractual compliance
• Provide management assurance of compliance and adequacy of internal controls, backed by comprehensive self-review and certification
Leadership & Oversight
Assurance
Capability Building & Continuous Monitoring
Adoption & Ownership
Sembcorp Cogen @ Banyan on Jurong Island in Singapore

SEMBCORP INDUSTRIES ANNUAL REPORT 2015 127126 BUILDING THE FUTURE
MANAGING SUSTAINABILITY
At Sembcorp, we believe in building sustainable businesses that deliver long-term shareholder value and growth. We believe that a truly sustainable business not only creates economic value, but does so in a way that benefits its stakeholders.
Environmental, social and governance (ESG) considerations are embedded in our business decisions and processes. We believe that taking ESG considerations into account helps us understand our risks and responsibilities in a holistic manner. We also believe that when our strategy and business decisions incorporate ESG concerns, we are better prepared to respond to the challenges we face.
The management of our sustainability issues is centred on five focus areas. Our key sustainability principles are set out in our Sustainability Policy. These principles are applied throughout our management systems and processes. We aim to continually improve our management systems, and evaluate our management approach by benchmarking it against industry best practice. We adopt a precautionary approach to avoid or minimise negative impacts. A list of our policies, certified facilities as well as memberships and participation in external initiatives can be found in the Sustainability section of our website.
Sustainability is addressed at the highest levels at Sembcorp. Our Board of Directors oversees the business affairs of the Group and is collectively responsible for our long-term success. The main duties of the board include providing leadership on Sembcorp’s overall strategy, which takes into consideration sustainability issues. The board also ensures the adequacy of the Group’s framework for risk management and internal controls.
Sustainability Performance SnapshotThe table below shows quantitative data that reflects our performance in areas that have been identified as material to our businesses and stakeholders.
Sembcorp’s Sustainability Steering Committee (SSC) provides strategic direction for managing sustainability-related risks and opportunities. It also guides the development and improvement of frameworks, policies, guidelines and processes to ensure that sustainability issues are effectively managed. The SSC is a high-level committee chaired by the Group Chief Financial Officer, and comprises senior executives across various functions, including asset management, human resources, health, safety and environment (HSE) and corporate relations.
At the business unit level, economic, operational, as well as health and safety issues and other risks are reviewed by the head of operations at bi-monthly business unit management meetings and risk management committee meetings. The Group’s performance in these areas is evaluated against internal targets. Business units also provide quarterly governance assurance certifications on the adequacy of their risk management and internal control systems in line with Sembcorp’s Governance Assurance Framework (GAF).
Sustainability contactSembcorp welcomes feedback on our sustainability issues and reporting at [email protected].
More performance data, including qualitative data, is available in the individual sections for each focus area in this report, as well as in the Sustainability section of our website.
Sustainability at Sembcorp is about striving for excellence and continuous
improvement in identifying, understanding and responding to evolving
environmental, social and governance challenges facing our businesses.
2015 2014 2013
Economic Capital and Portfolio Management 1 Turnover (S$ million) 9,545 10,895 10,798Net profit (S$ million) 549 801 820Return on equity (%) 9.4 15.2 17.1Return on total assets (%) 3.7 7.5 9.1Total debt-to-capitalisation ratio 0.46 0.40 0.23Total debt-to-capitalisation ratio (less cash and cash equivalents) 0.35 0.26 Net cashTotal shareholder returns 2 (%) (28.8) (15.6) 7.7 People People Development Employee turnover (voluntary and non-voluntary) (%) 11.0 18.4 12.4Average training hours per employee (hours) 20.6 22.3 13.7 Health, Safety and the Environment Occupational Health and Safety 3, 4 Number of fatalities 3 0 0Lost time injury rate per million man-hours 5 1.3 3.5r 2.6r
Accident severity rate per million man-hours 5 12.9 59.4r 41.4r
Climate Change Direct greenhouse gas emissions 6 (million tonnes of CO2 equivalent) 6.9 5.7 6.4r
Environmental Protection Water withdrawal (million m3) 1,823.1 1,593.7r 1,595.7r
Waste disposal 7 (thousand tonnes) 39.3 43.8r 31.7 Hazardous waste (thousand tonnes) 10.4 12.6 9.4 Non-hazardous waste (thousand tonnes) 28.9 31.2r 22.3r
Community Community contributions 8 (S$ million) 3.3 2.4 1.8
Notes:Please refer to the section on Reporting Framework and Scope on page 130 for details on our scope.1 Financial figures reported are for the Group, including Sembcorp Marine, as per audited financial statements.2 Source: Bloomberg3 Health and safety data reflects group-wide performance within the reporting scope stated for each respective year. For 2015, it covers both assets in operation and
under construction. A detailed breakdown of health and safety data is available on our website.4 Data covers employees and contractors engaged to work on our sites. Details of fatalities are reported on page 150.5 In 2015, we adopted standards set out by the US National Institute for Occupational Safety and Health (NIOSH) and the International Association of Oil and Gas
Producers (IOGP), and now report on a per million man-hour basis. Figures for 2014 and 2013, which were reported on a per 200,000 man-hour basis have been restated accordingly.
6 Data covers operations that produce direct greenhouse gas emissions from the combustion of fossil fuel.7 Data for waste disposal excludes waste that is collected and incinerated for our customers.8 Figure excludes contributions from Sembcorp Marine. Including contributions from Sembcorp Marine, the Sembcorp Group’s contributions amounted to S$7.1 million.r Indicates restated figure. Details can be found in the respective sections of this Sustainability Report and the Global Reporting Initiative content index in the
Sustainability section of our website.
SUSTAINABILITY REPORT
In 2015, Sembcorp became a signatory to the United Nations (UN) Global Compact, joining more than 8,000 companies globally who have taken a stand for a sustainable future.
Sembcorp was also selected as an index component of the Dow Jones Sustainability Asia / Pacific Index 2015.

SUSTAINABILITY REPORT
SEMBCORP INDUSTRIES ANNUAL REPORT 2015 129128 BUILDING THE FUTURE
Materiality Materiality analysis enables Sembcorp to define sustainability issues that are of greatest significance to our businesses and stakeholders over the long term. As we seek to make progress in our sustainability journey, drive performance and transparency, and embed sustainability into Sembcorp’s culture, this focus on materiality is vital.
Our reporting is currently focused on 11 material issues, grouped into five focus areas. Each focus area is owned by an appointed SSC member. The five focus areas and 11 material issues are recognised by both internal and external stakeholders. For each material issue, we report the sustainability context, its relevance to Sembcorp, and our management approach and performance.
Sustainability issues were identified in line with Global Reporting Initiative (GRI) guidelines. The materiality review took into account GRI’s Electric Utilities Sector Supplement, the Dow Jones Sustainability Index and other relevant frameworks and peer reviews. We prioritised issues using a materiality matrix, taking into account their significance to Sembcorp and our stakeholders according to clearly defined criteria based on the AA1000AS five-part materiality process.
The materiality assessment and review were conducted with input from an independent sustainability consultant. To increase the robustness of this assessment, we incorporated feedback from our stakeholders, including shareholders, financial institutions, the investment community, regulators,
customers, suppliers and non-governmental organisations. The survey, commissioned in 2012, was conducted by an independent firm to ensure anonymity for respondents. On the whole, respondents agreed on where our focus should lie. Their responses also helped us refine aspects of the material issues that our key stakeholders were interested in, and provided input on how we could better communicate these issues.
Sembcorp embarked on reviewing and updating our materiality issues in late 2015. As part of this materiality review process, we will be undertaking a stakeholder engagement survey, and gathering input from internal and external stakeholders across our different business units globally and at the corporate level. We will review and use the information we gather from our stakeholders to refresh our material issues and ensure that Sembcorp continues to align our sustainability efforts with business growth. The results of this materiality review and the corresponding updates to our material issues and indicators will be presented in our 2016 report.
In 2015, we strengthened the link between risk management and sustainability at Sembcorp, by developing risk appetite statements for each of our sustainability focus areas. The risk appetite statements and associated key risk indicators set the direction and boundaries for the execution of our strategy, and provide early warning of increasing risk exposure in each focus area.
Sembcorp’s Materiality Matrix
Urbanisation
Industrialisation
Globalisation
MEGATRENDS
Growing energy needs
Global water scarcity
Climate change
Sustainability strategy
Stakeholder engagement
PROCESSES
Governance framework
Risk management
Reporting on key performance
indicators
Included in print report
and / or company website
HIGH
LOW
Impo
rtan
ce t
o ex
tern
al s
take
hold
ers
Importance to internal stakeholders
Not reported

SUSTAINABILITY REPORT
SEMBCORP INDUSTRIES ANNUAL REPORT 2015 131130 BUILDING THE FUTURE
Reporting framework and scope Our annual Sustainability Report is prepared in accordance with GRI G4 Core requirements. It is guided by SGX Guidelines on Sustainability Reporting as well as the Ten Principles of the UN Global Compact. Our GRI content index can be found in the sustainability section of our website.
Our report provides information on Sembcorp’s subsidiaries and covers the calendar year. It excludes joint ventures, partnerships and associates for which Sembcorp does not have management and / or operational control. As our Marine business is separately listed in Singapore and reports its activities separately, it is therefore excluded from this report.
Data measurement and quality All data measurements are in line with GRI G4 recommendations for our chosen indicators. Greenhouse gas (GHG) emission factors are based on the 2006 Intergovernmental Panel for Climate Change (IPCC) guidelines, except for those relating to our operations on Teesside, UK, which use emission factors adapted from the US Environmental Protection Agency and the 2013 and 2014 Government Greenhouse Gas Conversion Factors for Company Reporting issued by the UK’s Department for Environment, Food & Rural Affairs and Department of Energy & Climate Change. Occupational health and safety indicators follow standards set out by the
New acquisitions and subsidiaries are given one year or more upon the completion of construction or agreement to integrate their reporting systems with that of the Group. Thereafter, their sustainability data will be reported externally once a full calendar year of data is collected. Data pertaining to entities divested during the year is excluded from our report. This year, we expanded the scope of our occupational health and safety reporting to also include assets and projects under construction, with data reported from the onset of construction activities. We aim to work towards external assurance of the report.
The table below shows our reporting scope by business line and focus area.
US National Institute for Occupational Safety and Health (NIOSH) and the International Association of Oil and Gas Producers (IOGP).
While there are inherent limitations to the accuracy of data, we seek to minimise any errors and irregularities by strengthening our internal controls.
Focus Areas and Material Issues Sembcorp manages sustainability through five areas of focus. These focus areas are aligned with how we drive success for the Group. Under each focus area, we discuss our management approach to the relevant material issues and our performance against each issue.
Focus Areas Material Issues
Economic
• To deliver long-term value and growth • Capital and portfolio management• Reliability• Innovation• New income streams
Governance, Risk and Compliance
• To maintain high standards of behaviour and integrity and be best in class for governance practices
• Governance and ethical business• Risk and regulatory compliance
People
• To provide a fair, diverse and inclusive workplace, and continually improve our human resource management and people development
• People development
Health, Safety and the Environment
• To instil sound and practical health and safety management as part of our workplace culture, and protect the environment in our business activities, products and services through good environmental practices
• Occupational health and safety• Climate change • Environmental protection
Community
• To be a responsible business, making a positive contribution to our communities
• Community integration
MATERIAL ISSUES
Information provided in the Sustainability Report relates to the subsidiaries of Sembcorp, excluding Sembcorp Marine. It excludes joint ventures, partnerships and associates for which Sembcorp does not have management and / or operational control.
FOCUS AREAS Economic Governance, Risk and Compliance
People Health, Safety and the Environment
Community
MATERIAL ISSUES
Cap
ital
an
d p
ort
folio
m
anag
emen
t
Rel
iab
ility
Inn
ova
tio
n
New
inco
me
stre
ams
Go
vern
ance
an
d et
hic
al b
usi
nes
s
Ris
k an
d r
egu
lato
ry
com
plia
nce
Peo
ple
dev
elo
pm
ent
Occ
up
atio
nal
hea
lth
and
saf
ety
Clim
ate
chan
ge
Envi
ron
men
tal
pro
tect
ion
Co
mm
un
ity
inte
gra
tio
n
UTILITIES
Existing assets
Energy • • • • • • • • • • •
Water • • • • • • • • • •Solid waste management • • • • • • • •
Assets under construction • • • • • • • •
MARINE •URBAN DEVELOPMENT • • • • • •
OTHER BUSINESSES • • • • • •
Our Marine business (Sembcorp Marine) is listed separately and reports its activities separately.

SUSTAINABILITY REPORT
SEMBCORP INDUSTRIES ANNUAL REPORT 2015 133132 BUILDING THE FUTURE
Stakeholder Engagement We recognise the importance of building relationships and communicating openly with our stakeholders.
We identified our stakeholder groups following a stakeholder mapping exercise, done in accordance with the AA1000 Stakeholder Engagement Standard by an independent consultant in 2012. Using a structured approach, stakeholders were mapped based on their level of influence and interest. The level of stakeholder interest against each material issue was also reviewed and a survey
Working together to respond to a drought crisis: Sembcorp Siza Water
As a result of El Niño, South Africa is facing one of its worst droughts in 30 years. The drought, which began in late 2014, has been declared a crisis by the government. Amongst the worst-hit areas in the country is the Dolphin Coast, where our municipal water business Sembcorp Siza Water operates.
As the local water provider, Sembcorp Siza Water has played a key role in managing the impact of the drought from an early stage. When the drought hit, it became apparent that it would be impossible for the conventional water system to be fully operational. Sembcorp Siza Water worked out a drought plan with local authorities and the bulk water supplier, and rolled this out to the community through an intensive communications campaign. Through daily slots on local radio, regular updates in newspapers and on the company website, flyers and text message alerts, we educated consumers on the crisis, called for support for the drought plan and communicated tips on how to save water. We
also met key stakeholders face-to-face, including local councillors and authorities, as well as the ratepayers’ association, chamber of commerce and local business leaders, and held media interviews and briefings. The response to these measures led to the community reducing its water usage by 5,000 cubic metres per day.
In the course of engaging consumers and local councillors, the need to find innovative solutions to the water crisis was raised. Arising from this, we commissioned boreholes to augment water supply. In addition, we conducted a month-long online survey, during which 96% of consumers voted in favour of introducing recycled water to their potable water. We then completed a facility that reclaims potable water from effluent, increasing the water supply by 4,000 cubic metres. This has been a great success, eliminating the need for water shedding in the community.
This experience demonstrates that technical expertise is only part of the solution. To change public behaviour and generate sustainable solutions, engagement and partnership with stakeholders is also key.
CASE STUDY
was conducted to invite feedback on our material issues from selected key stakeholder groups. This allowed us to understand the concerns and perspectives of our external stakeholders in relation to our material issues, in order to formulate our sustainability priorities. It also helped to guide our communication to stakeholders on our performance and progress on our material issues.
More information on the platforms we use to regularly engage our stakeholders can be found in the Sustainability section of our website.
EconomicTo deliver long-term value and growth
Why this is materialLong-term economic viability is at the core of Sembcorp’s approach to building sustainable businesses. As we build successful, sustainable businesses, societies and communities benefit. Our businesses deliver the economic engine to support industrialisation and urbanisation. Our operations
generate employment, contracts for local suppliers and tax revenues for governments and result in infrastructure development in our host communities. For more information on our contributions to communities, please refer to the Community section of this report. We drive our economic sustainability by monitoring and managing four key facets of our business: capital and portfolio management, reliability of our assets, products and services, innovation and business development for new income streams.
DIRECT VALUE RETAINED BY SEMBCORP S$263 million
DIRECT VALUE GENERATED & DISTRIBUTED BY SEMBCORP S$9.5 billionDIRECT VALUE DISTRIBUTED TO OTHERS
Materials and services costs
S$7.8bn*
These include materials and subcontract costs, which comprise purchases from suppliers, contractor costs and other operating expenses
Employees
S$832m*
This includes wages, salaries and benefits
Governments
S$137mThis includes income taxes paid, net of refunds received
Capital providers
S$551mThis includes dividends, distributions on perpetual securities and interest paid
Communities
S$7.1m**
This includes donations and sponsorships from our businesses’ engagement with charitable organisations or activities
* On an accrued basis** Figure is based on the reporting scope stated in the Sustainability Report, and includes Sembcorp Marine’s community contributions
TURNOVER

SUSTAINABILITY REPORT
SEMBCORP INDUSTRIES ANNUAL REPORT 2015 135134 BUILDING THE FUTURE
Capital and portfolio managementSembcorp’s businesses often involve large-scale, long-term projects that require significant initial capital outlay. Strong financial health and a disciplined approach to investment are therefore necessary for us to succeed. At the same time, as Sembcorp continues to grow, we believe it is important for us to maintain a balanced portfolio of businesses across geographical regions and business segments, with the appropriate level of risk. Capital allocation, including the geographical distribution of our investments, is managed from this perspective.
ReliabilityThe reliability of our supply, assets and products is vital not only for our reputation, but also for our long-term profitability. Our Group is heavily invested in the Utilities business, which involves the development and sustained operation of energy and water facilities. We are committed to long-term customer contracts and our products and services, such as power, steam, water and wastewater treatment, are essential to our customers. By investing in the proper care and maintenance of our assets, we ensure that their useful life, and therefore their ability to generate stable recurring income and a reliable supply of products and services, is sustained throughout our long investment horizon.
InnovationWe recognise that technology and innovation is important in maintaining and enhancing our relevance, profitability and competitive advantage. This includes applied research and development (R&D) and improvements that optimise our operations and enhance our efficiency, as well as new technologies and methodologies that offer wider sustainability benefits.
New income streamsTo deliver long-term growth, we continuously explore new business opportunities and maintain a pipeline of upcoming projects, which includes both greenfield and brownfield investments.
Positioned for Growth in the Right Businesses, in the Right Markets
As part of our strategy to ensure long-term growth, we continue to expand our operations overseas. In 2015, overseas contributions amounted to 60% of our Utilities business’ net profit excluding corporate costs and significant items.
We leveraged our strong development capabilities to grow through greenfield projects in rapidly developing economies, announcing our first energy projects in Myanmar and Bangladesh. In addition, we expanded our desalination capacity in the UAE and wind power assets in China. These projects, when completed, will provide us with new income streams.
Our approachCapital and portfolio managementWe have robust frameworks and processes in place to ensure our investment and business decisions take into account long-term considerations. In addition, potential acquisitions and growth opportunities are evaluated based on strict investment guidelines. Depending on criteria such as project value and country risk, approval for projects may involve the Senior Management Committee, the board and / or its Executive or Risk Committee.
We actively manage our risk portfolio, including monitoring balance sheet liquidity ratios and country risk profiles. For more information on risk management at Sembcorp, please refer to the Risk Management and Internal Controls chapter.
ReliabilityReliability of our assets, products and servicesThe reliability of our assets is of critical importance, and is rigorously managed from the design phase through to the operation and maintenance phase. In the design and construction phases, we focus on installing sufficient operational flexibility and selecting quality equipment. In the operation and maintenance phases, regulatory and manufacturers’ standards are strictly adhered to. The reliability of our plants is further monitored through monthly performance indicators which our management oversees. Technical audits and checks are also conducted on our plants.
Product safety and compliance Product safety is a priority in our business, as non-compliance can result in serious health, safety and operational issues for our customers, many of whom depend on us for basic utilities or require our products for their industrial processes. We implement a robust maintenance and monitoring regime, which
includes stringent inspections and the installation of meters and sensors at both our and our customers’ facilities. To ensure the safe delivery of our products, we have rigorous maintenance regimes in place and regularly inspect our delivery systems, including checking pipelines for leaks. We also conduct regular sampling and laboratory tests to meet regulatory requirements and to ensure that the water we produce is safe for our customers and end users.

SUSTAINABILITY REPORT
SEMBCORP INDUSTRIES ANNUAL REPORT 2015 137136 BUILDING THE FUTURE
Our Supply Chain
Sembcorp’s main suppliers consist of equipment manufacturers, raw material suppliers and engineering, procurement and construction (EPC) contractors.
Equipment manufacturers supply us with large-scale equipment such as gas turbines and desalination units as well as process equipment such as switchgears and control systems. Raw material suppliers supply fuel and chemicals needed to run our plants, while EPC contractors develop and construct our greenfield plants. Our plants are designed and built to have a long, productive lifespan, and it is with this perspective that we procure our equipment. We seek to ensure we procure high-quality and technologically advanced equipment that will last. We have stringent requirements for quality and therefore engage reputable suppliers who abide by global environmental, social and governance standards.
Our Group Procurement Policy provides guidelines and control principles for various stages of the procurement process.
We also recognise the importance of evaluating our suppliers to ensure supply chain risks and negative impacts are minimised. For example, our operations in Singapore carry out an annual vendor performance evaluation for our top suppliers by volume and dollar value. Through this process, we rate these suppliers on health, safety and the environment (HSE), as well as quality assurance and service level criteria. We also review their audited financial reports. In addition, for EPC contracts, contractors are
assessed based on their track record with respect to project type, size and location experience, among other criteria. We value the opportunity to positively influence our suppliers towards greater HSE awareness and social responsibility. We believe that securing a pool of suppliers that share our commitment to sustainability will mitigate risks to our operations and reputation.
Supplier diversificationOur efforts to ensure supply chain security include diversifying supply to mitigate concentration risk. In Singapore, for instance, Sembcorp’s operations maintain at least one primary and one secondary supplier for key spare parts and consumables, wherever possible.
Fuel procurementFuel is a significant cost component for Sembcorp’s power and steam generation operations. The security of our fuel supply is also vital to the sustained performance of our assets. In view of this, we have a Group Fuel Management department that looks into issues such as security of supply, monitoring of price fluctuations and optimisation of fuel mix. To further diversify our fuel mix and tap sustainable sources, Sembcorp has increased our use of alternative fuels and renewables. In Singapore, for instance, our solid waste management operations provide a reliable supply of waste wood for our woodchip boiler plant. In our biomass power plant in the UK, waste wood from sustainably-managed forests and sawmills, as well as arboricultural residues, is used as fuel.
InnovationSembcorp’s Technology Advisory Panel, which includes our Chairman, Group President & CEO and other invited experts, provides strategic direction for our technology and innovation programmes. The panel oversees the development and application of significant emerging technologies in the energy and water sectors and provides guidance to Sembcorp’s leadership on technological trends and opportunities. It is supported by an in-house Group Technology department.
Headed by our Chief Technology Officer, our Group Technology department oversees our R&D and innovation efforts. Besides tracking our investment in innovation and its corresponding returns, we also track indicators such as the number of projects screened. This ensures that we have a pipeline of innovation projects being developed and implemented in a timely manner.
To further encourage innovation from bottom up, Sembcorp’s !DEA Awards programme rewards innovative ideas and efforts across the Group. Past winning entries have included process innovations that have resulted in cost savings and improved HSE performance, as well as innovations that have led to the development of new products and services.
Our ongoing engagement with venture capitalists, technology companies and tertiary research institutes helps us keep abreast of the latest technological advancements. In looking at new technology, we prioritise innovations that address the needs of our operations, but also consider more general proposals.
Promoting Clean Technology
Sembcorp pioneered the commercial reclamation of water from treated industrial and municipal wastewater effluent in Singapore. We have established ourselves as a trusted wastewater treatment provider in Singapore as well as in industrial clusters in China. By integrating wastewater treatment, water reclamation and water supply in a closed loop, Sembcorp helps its customers reduce their water consumption and conserve this precious resource.
Sembcorp has also established a dedicated Renewables department to pursue clean technology opportunities. In 2015, Sembcorp acquired Green Infra, a leading renewable energy company in India, and expanded its wind power capacity in Huanghua, Hebei, China.

SUSTAINABILITY REPORT
SEMBCORP INDUSTRIES ANNUAL REPORT 2015 139138 BUILDING THE FUTURE
New income streamsSembcorp’s Group Business Development & Commercial department is structured and equipped to pursue new business opportunities with agility and focus. Dedicated teams look into growing our businesses in both existing and new markets.
To ensure our continued growth, we identify and develop a healthy pipeline of projects. We also seek to grow through strategic partnerships with our customers, by continuously developing innovative and competitive solutions that meet their evolving needs.
We actively invest in sustainable and green business lines, which will give us an edge in an increasingly resource-scarce world. We take a disciplined approach and employ a stringent evaluation process to all our projects and investments.
Our performanceSembcorp’s financial performance and key economic indicators can be found in our Group Financial Review chapter and Financial Statements.
As a global energy and water company with a rich history of being driven by technology and innovation, Sembcorp hopes to contribute towards raising Singapore’s profile as a hub for applied R&D, while supporting the long-term growth of the energy and water sectors. To this end, we have collaborated with several partners in various innovation projects. Ongoing partnerships include the Sembcorp Industrial Living Laboratory with the Singapore Economic Development Board and the Sembcorp-EMA Energy Technology Partnership with the Energy Market Authority (EMA) of Singapore. These projects leverage Sembcorp’s facilities for late-stage test-bedding and co-innovation of energy, water and environmental technologies, and explore the commercialisation of R&D solutions. The investments in these multi-year projects, which include matching
grants from the authorities and other partners, are worth up to S$18 million.
In 2015, we acquired Green Infra, a renewable energy company in India. This acquisition not only marked our entry into India’s renewable energy market, but also signified a major step in our strategy to grow our renewable business. In Myanmar, we were selected to develop the largest independent gas-fired power plant in the country. This project marked Sembcorp’s entry into Myanmar’s fast-growing power market. We also announced our entry into the Bangladesh power market and expanded our renewable energy business in Huanghua, China, with the development of two wind farms.
A strong push for innovation, coupled with a keen pursuit of growth opportunities, puts Sembcorp in an excellent position to build a strong future.
Going forwardThe Group will maintain a disciplined approach to managing its financial position and portfolio. We will continue to deepen our asset management as well as business development and commercial capabilities, optimise plant performance and grow our asset portfolio for a greater recurring income base.
We will continue to identify and develop new and innovative technologies and leverage investments made for technologies relevant to our business. In addition, we will build on our culture of innovation through the recognition and implementation of !DEA Awards projects and other innovation proposals. In the near future, we expect to implement further phases of the Virtual Brain predictive maintenance and optimisation project and develop it for application to other water treatment processes. We will also continue to engage our partners in our ongoing projects, while scanning the landscape for more innovation opportunities.
Why this is material Governance and ethical businessResponsible business conduct ensures the long- term viability of our businesses and builds trust and confidence with our stakeholders. We commit to high standards of behaviour and integrity in everything we do, and comply with all laws and regulations wherever we operate. We believe in conducting our business legally, fairly, honestly and with integrity, and expect the same of those with whom we do business. Sembcorp has zero tolerance for fraud, bribery and corruption.
Risk and regulatory complianceRisk management is an integral part of Sembcorp’s approach to operating sustainably. As we continue to grow and expand our global footprint, we are inadvertently exposed to diverse risks, such as political and regulatory, market, competition, supply chain, human resources, project and cost management risks, environmental and social risks, as well as the risk of possible fraud, corruption and bribery.
Besides helping to preserve our bottom line by reducing the likelihood and impact of potential losses, risk management provides a common basis on which to evaluate new business opportunities. It also assures our board and shareholders that key enterprise and business risks faced by the organisation have been identified, assessed and managed with appropriate risk mitigation and controls.
Sembcorp is committed to a high standard of regulatory compliance. Non-compliance with applicable laws and regulations may subject us to statutory and regulatory fines, resulting in material litigation. It may also affect our reputation, financials and licence to operate.
Governance, Risk and ComplianceTo maintain high standards of behaviour and integrity and be best in class for governance practices
Our approachGovernance and ethical businessSembcorp is led by an effective board mainly comprising of independent non-executive directors. The board is collectively responsible for the long-term success of the Group. Part of its role is to ensure that the Group’s internal control and risk management systems are adequate and effective, and that our obligations to key stakeholders are understood and met. Several board committees, including the board’s Risk Committee, have been established with clearly written terms of reference, both to assist the board in fulfilling its responsibilities, and to provide an independent oversight of management. The board’s Risk Committee has oversight of our Fraud Risk Management and Anti-Bribery and Corruption Policy.
Sembcorp complies with the Code of Corporate Governance 2012 issued by the Monetary Authority of Singapore, and reports our governance processes and activities with reference to the principles set out in it.
In addition, Sembcorp’s core values of Insight, Integral and Integrity define our approach to sustainable growth and form the foundation of Sembcorp’s Business Principles and Code of
Communicating Our Code of Business Conduct Through Electronic Learning
The Sembcorp Code of Business Conduct expresses the high standards of behaviour and integrity expected from our employees worldwide.
An e-learning course in multiple languages was launched globally to further communicate our Code of Business Conduct and help employees better understand its requirements, guiding principles and application in their daily course of work.

SUSTAINABILITY REPORT
SEMBCORP INDUSTRIES ANNUAL REPORT 2015 141140 BUILDING THE FUTURE
Business Conduct (CBC). Employees are required to comply with the requirements of the CBC, which addresses Sembcorp’s stance in the following areas:
• Providing a fair, equitable workplace environment that is free from harassment
• Corruption and bribery• Money laundering• Political contributions • Contributing to communities • Health, safety and the environment
Requirements of the CBC are communicated to employees globally through an e-learning course delivered in multiple languages. The CBC is also published on our website. Employees are required to acknowledge that they agree to abide by its principles and requirements and promptly report any violation through available reporting channels. Suppliers and contractors who work with Sembcorp are expected to respect and follow the CBC as well.
The standards of our CBC are also applied in our approach towards tax risk management. It is our policy to:
• Observe compliance with relevant taxation laws and regulations and other regulatory disclosure requirements
• Apply diligent professional care and judgement to arrive at well-reasoned recommendations, supplemented by advance rulings from tax authorities, written advice and confirmation from external tax advisors / experts, as appropriate
• Ensure that all decisions are taken at an appropriate level and supported by a business purpose / commercial rationale and the appropriate documentation
• Establish and maintain adequate documentation of the Group’s tax risk evaluation and tax risk management, and update the Group’s tax risk management policies including internal controls, as and when appropriate
• Develop and foster good and respectful professional relationships with all tax authorities, government bodies and other related third parties
Risk and regulatory complianceRisk management and system of internal controlsSembcorp actively equips our management with tools to manage and control any risks associated with our existing business activities and investment decisions.
We also closely monitor key risk indicators as part of the requirements of our Risk Appetite Framework.
Our enterprise risk management (ERM) framework and GAF are aligned with best practice standards such as ISO31000 and standards issued by the Committee of Sponsoring Organizations of the Treadway Commission (COSO).
The Group’s risks and monitoring of internal controls are managed through:
• Periodic review and reporting of corporate and operational risks and controls through detailed risk and controls registers
• Review of major occurrences, key risk areas and significant control lapses at business unit management meetings and risk management committee meetings
• Risk assessments at the investment appraisal and due diligence stages
• Monitoring of key risks and control lapses through a quarterly governance assurance certification submission
An internal controls policy and manual have also been established to provide a clear framework for what constitutes an effective and adequate system of internal controls. They also provide guidelines on the appropriate segregation of duties and a checklist of recommended internal controls for our business units to put in place.
Internal audits are regularly performed based on an approved audit work plan, and cover high-risk areas such as possible fraud, bribery and corruption.
Emergency response plans are in place and crisis simulation exercises are conducted to ensure that we are adequately prepared for foreseeable emergencies. This is to ensure that in the event of an emergency, we are better able to handle the crisis and can minimise any negative impacts.
For more information on Sembcorp’s governance and risk management systems, please refer to our Corporate Governance Statement and Risk Management and Internal Controls chapter.
Training and performance managementThe Group provides awareness training and workshops on ERM, GAF, as well as fraud risk management and business continuity management on a periodic basis. Desktop exercises and simulation for crisis management, emergency response drills and business continuity exercises are also conducted regularly to validate and fine-tune our procedures and plans and improve our preparedness.
In order to enhance corporate governance and risk management excellence at Sembcorp, key risk and governance performance indicators have been identified and incorporated as part of the remuneration requirements for senior management. For more details on senior management remuneration and reward, please refer to our Corporate Governance Statement.
Our performanceThrough the successful global roll-out of two e-learning courses on anti-bribery, corruption and the CBC, we continued to emphasise the importance of fraud risk management and measures to guard against the risk of bribery and corruption in our business. Employees are required to pass a test to affirm their knowledge and understanding of the subject. They are also required to acknowledge that they agree to abide by the principles and the requirements of the CBC. We continued to communicate our zero tolerance for fraud, bribery and corruption to our employees and
engage them on our whistle-blowing policy and guidelines through fraud awareness workshops with updated case studies and training sessions.
Sembcorp received the Most Transparent Company Award in the oil and gas category at the Securities Investors Association (Singapore) Investors’ Choice Awards 2015. We were also ranked sixth in the 2015 edition of the Governance & Transparency Index, a well-respected index assessing the transparency of 639 Singapore-listed companies.
Two significant incidents resulting in fines amounting to S$109,000 were incurred by our operations in Chile for non-compliance to water quality and discharge standards. Additional treatment plants as well as facility enhancements have been installed to ensure non-recurrence. Our operations in Singapore incurred a penalty of S$50,000 due to an unsuccessful gas turbine fuel changeover.
As part of our ongoing effort to build in-house capabilities, readiness and resilience to crisis and emergency response situations, we have conducted regular crisis simulation exercises and awareness trainings. Notably, we successfully conducted an exercise simulating a raw water contamination incident at our Fuzhou municipal water operations. This exercise was conducted in partnership with the local authorities, and received media coverage highlighting Sembcorp and the local government’s resolve in being prepared for such incidents. In Singapore, we also successfully conducted a crisis preparedness exercise simulating a pipeline leakage and used our incident management system to monitor the incident remotely from the crisis command centre. The exercise included involvement of the Singapore Civil Defence Force and a customer that would be affected by such an incident.
Going forwardWe understand that the pursuit of excellence in corporate governance and risk management is a continuous journey. Hence, we will continue to

SUSTAINABILITY REPORT
SEMBCORP INDUSTRIES ANNUAL REPORT 2015 143142 BUILDING THE FUTURE
strengthen our frameworks and policies to align them with industry best practice. To build a positive risk and governance culture, we will continue to communicate and engage our employees and stakeholders through continuous awareness workshops and training sessions. We will also provide the right systems and tools to enhance the risk management and governance process.
Why this is material Our employees play a vital role in ensuring we achieve our business strategy and goals. Of the issues relating to our people, such as fair employment, labour relations and human rights, we have identified people development to be the most material.
People developmentTo be a high-performance organisation, it is crucial to develop a competent, capable and motivated workforce that can meet the business challenges of today and tomorrow.
The nature of our business is such that we require specialist technical expertise. However, some of the markets in which we operate lack a qualified labour force with the necessary technical skill sets that our business demands. In other markets, these skill sets are highly sought after across several industries. In addition, the commercial and regulatory environment we operate in is also becoming increasingly complex. Therefore, there is a critical need to attract, retain and develop competent employees who possess a deep understanding of the company and its industry sectors.
People To provide a fair, diverse and inclusive workplace, and continually improve our human resource management and people development
Our approachHuman resource policies and management The Senior Management Committee, supported by the Group Human Resources department, is responsible for setting key policies relating to our employees.
Country-specific human resource policies, as well as all other company policies and guidelines, are available and accessible to employees on our intranet.
We stay abreast of the latest developments and best practice for human resource management through our membership and participation in external organisations such as the Singapore National Employers Federation, the Temasek Human Resource Council and The Conference Board, as well as numerous local roundtable groups.
Developing Capabilities for the Future
To meet the demands of our growing business, specialised training programmes were organised in different countries and operations to ensure a pipeline of qualified employees who demonstrate both core and functional competencies. For instance, in Andhra Pradesh, India, more than 160 graduates of local engineering colleges have been admitted to our training programme since 2013. This programme is equivalent to a postgraduate diploma course in thermal power plant engineering, and is offered free of charge. After the course, suitable participants are recruited for full-time positions at our power plant. In China, the general managers of our operations underwent training which covered our core competency framework, business conduct, internal audit procedures, as well as operational case studies. In Singapore, executives attended renewable energy teach-ins to increase depth of knowledge in that area.
Further details on our approach and initiatives on labour relations, remuneration and employee welfare and engagement can be found in the People portion of the Sustainability section of our website.
Human rights and labour relationsThe Group is committed to uphold and respect the spirit of the UN Universal Declaration of Human Rights and the International Labour Organisation’s Declaration on Fundamental Principles and Rights at Work. We fully support the UN Global Compact principles on human rights and labour, and abide by the Employers’ Pledge of Fair Employment Practices under Singapore’s Tripartite Alliance for Fair and Progressive Employment Practices. Our CBC sets out our stand on fairness, opportunity, non-discrimination, dignity, respect and harassment. We do not hire forced or child labour, and comply with local regulations restricting forced or child labour wherever we operate. While our operations span five continents where labour laws, regulations and practices differ widely, we remain committed to high standards of human resource management globally. We abide by local laws wherever we operate, including meeting or exceeding minimum wage requirements where such requirements exist. Examples of other regulations our global operations comply with include the Broad-based Black Economic Empowerment Amendment Act 2013 in South Africa, and localisation requirements at our operations in Oman and the UAE.
We recognise the value and benefit of mutual discussion. Our grievance handling policy seeks to manage employee grievances in a fair and reasonable manner, with an escalation path to the Group President & CEO where necessary. We seek to maintain good labour management relations, and hold constructive ongoing exchanges with employee unions in our various operations. All Sembcorp employees are entitled to practise freedom of association and to be covered by collective agreements in the workplace, within the regulatory boundaries of each of the jurisdictions in which we
operate. In countries where our operations are covered by collective agreements, procedures for grievance handling are specified in the agreements.
People developmentPeople development is driven at the board level by the Executive Resource & Compensation Committee.
Our “My Career Journey @ Sembcorp” programme guides the identification, development and deployment of employees across the organisation. The programme encompasses three aspects:
i. Strategic workforce planningii. Competency frameworkiii. Development journeys
The framework aligns the development of the
organisation and the individuals within it, addressing both organisational needs and employee aspirations.
Employee learning and developmentEmployees at Sembcorp are empowered to be responsible for their learning and development, supported by their supervisors.
Our engineers and technicians receive up-to-date technical training by experts. All employees are also encouraged to attend relevant professional courses.
We offer our employees the opportunity to develop their careers and gain international exposure through job rotations and attachments in different cultural and operational settings. We currently have more than 50 employees of different nationalities seconded from our Singapore offices to various overseas operations. We also provide internships and industrial attachments that offer students and Sembcorp scholars practical experience and exposure to our operations.
We support our employees in their pursuit of continuous improvement and sponsor selected employees who wish to pursue higher qualifications in fields relevant to their work. To develop our leaders, we sponsor senior executives’ enrolment in

SUSTAINABILITY REPORT
SEMBCORP INDUSTRIES ANNUAL REPORT 2015 145144 BUILDING THE FUTURE
programmes at leading institutes such as Harvard Business School, The University of Pennsylvania Wharton School, INSEAD and Temasek’s Business Leadership Centre. Sembcorp scholarships are also offered to promising students at various tertiary institutions. Once they graduate, a comprehensive development plan is mapped out to groom them for management positions.
As a leader in our industry sectors, Sembcorp encourages our employees to share and exchange best practices through seminars, roadshows and local and international conferences.
Developing local capabilityWe believe in recruiting, grooming and retaining local talent as a long-term investment in our future and an integral part of our strategy for our overseas operations. This leads to knowledge transfer and capability development in the local community.
Localisation is an important part of our strategy to grow our overseas projects sustainably. We aim to progressively localise the workforce at our overseas operations across all positions, including management positions, in line with each jurisdiction’s regulatory and operating environment. When we begin operating in a new market, employees who are seconded from our head office to start up the operations are given a clear responsibility to develop local talent. As the capabilities of local employees grow, the team is gradually localised, and the number of expatriates seconded from head office progressively reduced.
All employees across the Group are offered the same development opportunities. At our overseas operations, local employees are also encouraged to develop their professional and managerial skills through international exposure, such as on-the-job training in Singapore or at other Sembcorp operations around the world.
Performance appraisalsAll employees undergo half-yearly performance appraisals, where performance, expectations, training needs and targets for the coming year are discussed and agreed upon by the employee and supervisor. An assessment of core competencies and areas for improvement is embedded in the appraisal format. Going through the appraisal process helps us inculcate our core values in every employee, and clearly articulate the competencies and functional skills needed for their development.
Our performance The continued implementation of our competency framework and the enhancement of our learning and development framework were our main areas of focus in 2015. We revamped our approach towards learning and development, with a focus on engaging internal stakeholders to ascertain the learning and development needs across the business. Through this process, we developed our learning model and framework and documented methods of learning. These will form the basis for the implementation of our learning management system (LMS). This system was launched in late 2015 with initial e-learning courses on our CBC, as well as on anti-bribery and corruption awareness.
We embarked on a review of our global employee health benefit packages, and aim to work towards harmonising our employee health benefit entitlements globally. This ensures that our health benefits are transparent and consistent across the Group.
We remain committed to meeting localisation targets and to training local talent at our overseas operations. In 2015, our operations in Singapore hosted 30 student interns from Singapore as well as China, India, Oman, Chile, Indonesia and Australia.
Going forwardA study was commissioned in 2015 to harmonise our employee health benefit (EHB) programme globally. We aim to execute country specific EHB programmes in 2016. We will continue to roll out more e-learning courses while promoting greater availability and use of the LMS throughout the organisation. We will participate in the new Industry
Employee Turnover 1 (%)
Following a restructuring of our operations in the UK in 2014, our employee turnover rate returned to an expected range in 2015. The voluntary turnover rate was 8.5%.
1 The data covers both voluntary and involuntary turnover of permanent employees of Sembcorp and its subsidiaries, excluding Sembcorp Marine.
Average Training Hours Per Employee 1
We have changed the indicator used to report training within the Group from training cost per employee to average training hours per employee, to better capture participation in in-house training programmes. Training hours fell slightly from 2014, when they had increased significantly due to the roll-out of our competency framework programmes that year. Going forward, we aim to leverage our LMS to increase training.
1 Training data covers both permanent and contract employees of Sembcorp and its subsidiaries, excluding Sembcorp Marine. The other indicators in the People section relate to permanent employees of Sembcorp and its subsidiaries, excluding Sembcorp Marine.
0
4
8
12
16
20
201520142013
12.4 11.0
18.4
0
5
10
15
25
20
201520142013
13.7
22.320.6
Mentors’ Network Programme organised by the Ministry of Education. As part of this initiative, students from polytechnics in Singapore will be matched with mentors from Sembcorp, who will provide advice on career goals. The students will also have the opportunity to shadow their mentors at work or networking functions.

SUSTAINABILITY REPORT
SEMBCORP INDUSTRIES ANNUAL REPORT 2015 147146 BUILDING THE FUTURE
Health, safety and the environment (HSE) is a top priority at Sembcorp and an area in which we are committed to continuous improvement. We recognise the importance of incident investigation, and set aside resources to ensure that all incidents are thoroughly investigated, corrective actions are implemented and any areas of improvement are shared across the organisation.
Why this is material Occupational health and safetyIt is important to us that occupational health and safety is stringently managed. As a global developer, owner and operator of power and water plants, we recognise our responsibility in ensuring that all workers and contractors are competent and equipped to work in the safest way possible. Many of our plants are in developing economies and it is often a challenge to build a local workforce that is attuned to our global health and safety standards. By effectively and proactively managing work-related hazards, we minimise health and safety-related incidents wherever we operate and protect our workforce, including staff of our contractors.
Climate changeWe recognise the threat that climate change represents to the planet and the impact this would have on our businesses. The 2015 United Nations Climate Change Conference reflected the commitment of governments to reduce global warming. Hence, to mitigate potential regulatory, physical and supply risks, we adhere to and
Health, Safety and the EnvironmentTo instil sound and practical health and safety management as part of our workplace culture, and protect the environment in our business activities, products and services through good environmental practices
support common policy positions adopted by governments on climate change. We also keep abreast of the wider body of academic and institutional research on the subject.
By employing innovative technology and renewable resources, we provide competitive and reliable energy and water solutions to customers and communities, while mitigating the impact of our activities on climate change.
Environmental protectionSembcorp recognises its duty to protect the environment and conserve resources. Since our utilities businesses consume natural resources directly, it is here that our responsible stewardship can have the greatest impact.
Increasing Our Renewable Energy Portfolio
As part of our strategy to maintain a balanced portfolio, we grew our renewable energy assets in 2015 with the acquisition of a leading renewable energy company in India present across six states, and expanded our wind farms in China. Today, we have 918 megawatts of wind and solar power in operation and in development in India, and 544 megawatts of wind power in China.
HSE policy and guidelinesThe Group’s HSE department establishes key HSE operating philosophy and standards, including benchmarks and key performance indicators to drive improvements across Sembcorp’s global sites. It works closely with regional HSE coordinators to ensure that issues across the Group are managed in an effective and timely manner. Our Group HSE Policy articulates our commitment to our stakeholders with respect to health, safety and the environment.
Our Group HSE Guidelines are part of a broader HSE management system, which establishes tools and requirements to monitor and report HSE indicators based on Sembcorp’s “four zero” (4/0) targets. The 4/0 targets are: zero harm to people, zero damage to the environment, zero damage to assets and zero instances of non-compliance with legal and regulatory requirements. Our board’s Risk Committee reviews our HSE performance quarterly.
We are committed to meeting or exceeding our regulatory obligations as well as the HSE standards and certifications we subscribe to. For a list of the
certifications achieved by Sembcorp’s businesses, please refer to the Awards, Memberships and Certifications portion of the Sustainability section of our website.
In addition, we believe in actively engaging both internal and external stakeholders to help keep our workplace and environment safe.
Training and auditsProviding our employees with relevant training ensures that we have a competent team that works safely. Specific training needs are identified and customised based on job requirements.
Once a year, the Group HSE department organises a workshop for HSE officers from various global sites to keep them abreast of corporate initiatives. The workshop is also aimed at encouraging and facilitating the exchange of ideas and best practices across our global operations. This annual event provides a platform for the planning of group-level HSE goals and initiatives, and allows participants to learn from their colleagues.
HSE assurance audits are conducted regularly to review key internal controls and ensure compliance with regulatory and corporate requirements. Our assurance process is supported by a validation and on-site verification process which involves in-depth examination of the site’s HSE Management System and its implementation. To further enhance our performance in this area, we leverage expertise across business units, and weave training and peer assistance elements into an assurance programme to promote good practices across the Group.
Occupational health and safetyWe actively monitor and manage the risks associated with our activities and services, including those at assets that are still under construction, to prevent and reduce workplace injuries and occupational illnesses. Our approach towards managing health and safety risks is to strive to eliminate any risks that we identify.
Our approach
Continuous Improvement
Management review
Validation and Verification
Audits, gap analysis and monitoring
HSE Management
System & Guidelines
Training, awareness and cross-learning
HSE Policy
Standardised HSE policy
framework and management

SUSTAINABILITY REPORT
SEMBCORP INDUSTRIES ANNUAL REPORT 2015 149148 BUILDING THE FUTURE
Co
nti
nu
al A
sses
smen
t an
d Im
pro
vem
ent
Strong Ownership of HSE by Every Employee
Validation and Verification
Safety in Design
System of Risk Assessment & Controls
Document Control
Work Plan Management
Competent Resources
Operations Integrity
Effective Communication
Third Party Selection and Qualification
Project and asset life cycle risk assessment and injury preventionIntegrating HSE considerations into all phases of our operations demonstrates our commitment to proactive HSE management. The asset life cycle assessment approach is embedded in our project conceptualisation phase, development and construction phase, as well as operation phase. Project due diligence studies provide a good understanding of the potential impact of our operations and allow the most appropriate solutions to be applied in order to prevent or reduce the likelihood of incident occurrence. For example, hazard and operability studies during the design and construction stages identify potential risks, legal requirements and safety considerations. Final design and construction activities are organised to avoid or minimise the impact of the risks identified. We seek to ensure that operation and process controls are implemented to prevent harm to people and the environment.
Climate changeThe quest for greater energy efficiency presents both cost and opportunities for Sembcorp. We recognise that investing in energy-efficient, renewable and low-carbon technologies not only helps manage emissions, but also makes business sense. We are committed to setting achievable energy efficiency and renewable energy targets, and developing strategies to mitigate the impact of our operations on the environment.
We take a four-pronged approach to this issue:
i. Maintaining a diversified energy generation portfolio
ii. Growing our renewable energy business as part of a balanced portfolio
iii. Maintaining and building efficient energy and water facilities
iv. Actively engaging stakeholders
Our health and safety framework is anchored by Sembcorp’s 10 Elements for Good HSE. Each element is linked to a set of expectations and standards, with emphasis on effective risk management and good planning for safe operations and construction. For example, the setting up of a Safe Operation Committee is a mandatory requirement at all our operations and projects. This is to ensure that adequate review and assessment of risks and controls for critical activities is conducted prior to approval being granted to carry out the work.
Every year, the Group HSE department sets and drives the year’s objectives and targets based on a performance gap analysis to improve on areas of weakness.
Environmental protectionAt Sembcorp, we aim to ensure compliance to environmental regulations and adequate resource allocation for the maintenance of environmental quality wherever we operate.
We conduct environmental studies in accordance with national and / or international standards and methodologies for new projects and major expansions. These include environmental impact assessments, environmental baseline studies, and pollution control studies. Recommendations from the assessments form part of our management of HSE risks and these recommendations are incorporated into the planning, design, construction and commissioning of new plants.
Atmospheric emissionsOur approach to managing atmospheric emissions is through reducing fuel consumption and increasing energy efficiency. We adhere to local regulatory emission limits and aim to minimise our impact on the environment and the surrounding community.
WaterWe apply integrated water and wastewater management solutions for better efficiency and resource use. For example, by integrating wastewater treatment, water reclamation and water supply in a closed loop, we help our customers reduce their water consumption and conserve this precious resource. We bring the same expertise to our own operations so as to consume water responsibly and efficiently.
We treat wastewater in the most effective and energy-efficient manner. With our strong technical expertise, we tailor the treatment process and technical configuration based on the expected wastewater profile. Treatment processes applied include mechanical, chemical, biological or membrane technologies, or a combination of these.
Sembcorp is able to effectively treat multiple streams of industrial wastewater with wide-ranging
chemical oxygen demand and salinity to meet effluent discharge standards. Our comprehensive water sampling and testing regime ensures consistent compliance with such standards. Treated effluent from our wastewater treatment facilities may be further treated to produce demineralised water at our water reclamation facilities.
Our large-scale water reuse and seawater desalination facilities offer high-quality water to industries and households in water-scarce areas such as the UAE and Oman.
Waste and spillsWe apply stringent controls in the management of waste generated from our operations. We adhere to discharge and emission limits set by local authorities, and implement containment measures to minimise any direct impact to the environment, vegetation and the surrounding community.
All waste generated by our operations or collected by us on behalf of our customers is disposed of in accordance with local regulations. In the event that an emergency occurs from, for example, a major spillage or hazard at our industrial facilities, we will immediately activate emergency response plans that have been put in place.
Sembcorp also actively develops its capabilities to recover energy from waste. For example, at our Sembcorp Woodchip Boiler Plant in Singapore, woodchips processed from waste wood collected by our solid waste management operations are used to produce economical and renewable steam. This way, we are able to manage the entire energy-from-waste value chain and take advantage of the synergies between our energy and solid waste management businesses.
Our performanceThis year, we expanded the scope of our occupational health and safety reporting to include assets and projects under construction. These projects are generally undertaken by our
Sembcorp’s 10 Elements for Good HSE

SUSTAINABILITY REPORT
SEMBCORP INDUSTRIES ANNUAL REPORT 2015 151150 BUILDING THE FUTURE
contractors and sub-contractors. In recognising that we have a responsibility as developers of any project, we aim to promote health and safety amongst all companies and individuals within our sphere of influence. We believe that this commitment will become increasingly important as we strengthen our presence in emerging markets, where local health and safety regulations and enforcement may not be as mature as in developed countries.
Our health and safety performance charts reflect group-wide performance and cover both assets in operation and under construction. A detailed breakdown of health and safety data is available on our website. We also adopted NIOSH and IOGP standards in our health and safety reporting, as part of our efforts to adopt best practice.
As our operations expanded in 2015, we continued to strengthen health and safety management and made process improvements. Key initiatives included:
• Strengthening ownership of HSE by all employees across all levels of seniority
• Focusing on mitigating risk for critical activities with high potential for serious consequences
• Enforcing compliance to safety requirements and expectations
• Promoting active engagement of on-site staff, including those employed by our contractors
It is with great regret that we report three fatalities in 2015. One fatality was the result of a vehicular accident involving our employee in Mbombela, South Africa. The other two fatalities respectively resulted from a fall from height at the site of our Thermal Powertech Corporation India facility in India and a forklift accident at a construction site in Singapore where our design and construction business was carrying out work.
Lost Time Injury Rate Per Million Man-hours1, 2, 3, 4
The lost time injury rate4 and the accident severity rate5 improved in 2015 compared to 2014. In particular, we saw a decrease in the frequency and severity of incidents at our solid waste management operations, arising from focused efforts to improve safety standards and practices.
1 Group figures are based on the reporting scope stated for each year. We expanded our scope in 2015 to include assets under construction.
2 Occupational health and safety data covers both employees and contractors.
3 In 2015, we adopted standards set out by NIOSH and IOGP, and now report on a per million man-hour basis. Figures for 2014 and 2013, which were reported on a per 200,000 man-hour basis, have been restated accordingly.
4 The lost time injury rate includes fatalities.5 The accident severity rate (ASR) is charted excluding fatalities. ASR
including fatalities is reported in our detailed performance data online. Lost time due to one fatality is taken as 6,000 lost work days.
r Indicates restated figure.
0
1.00
2.00
3.00
5.00
4.00
201520142013
2.60r
3.45r
1.33
Accident Severity Rate Per Million Man-hours1, 2, 3, 5
0
10.00
20.00
30.00
70.00
60.00
40.00
50.00
201520142013
41.38r
59.44r
12.88
Every incident was investigated thoroughly to identify root causes and the necessary corrective actions have been taken.
We remain committed to ensuring the efficiency of our operations while optimising the use of resources. In 2015, we grew our renewable energy capacity with the acquisition of Green Infra, a leading renewable energy company in India, and new wind farm capacity in Huanghua, Hebei province, China.
Our nitrogen oxide (NOx) emissions amounted to 3,700 tonnes, sulphur oxide (SOx) emissions amounted to 800 tonnes and particulate matter (PM) emissions amounted to 200 tonnes in 2015.
Direct Greenhouse Gas Emissions1 (million tonnes of CO2 equivalent)
The increase in direct GHG emissions was largely due to our second cogeneration plant in Singapore and an increase in activity at our operations in Fujairah. The new cogeneration plant commenced operations in late 2014, and with the availability of a full year’s data, it is included in our reporting scope this year. Direct greenhouse gas emissions for 2013 have been restated as 6.4 million tonnes of CO2 equivalent following retrospective application of more accurate calculation methodology for data from operations in Fujairah, instead of 5.8 million tonnes of CO2 equivalent as reported previously.
We report emissions from the combustion of biomass separately, in accordance with GRI guidelines. These emissions amounted to 1.0 million tonnes of CO2 equivalent in 2015 compared to 1.1 million tonnes in 2014.
1 Emissions data covers entities that produce direct GHG emissions from the combustion of fossil fuel. It excludes emissions from anaerobic wastewater treatment plants, as well as emissions from the use of diesel in vehicles and maintenance and servicing equipment. CO2 , CH4 and N2O emissions are included in the calculation of direct GHG emissions. HFCs, PFCs, SF6 and NF3 emissions are excluded. Global warming potential factors used are from the IPCC Fourth Assessment Report for the 100-year time horizon.
r Indicates restated figure.
0
1.0
2.0
3.0
6.0
7.0
4.0
201520142013
6.4r
5.7
6.9
5.0

SUSTAINABILITY REPORT
SEMBCORP INDUSTRIES ANNUAL REPORT 2015 153152 BUILDING THE FUTURE
Water Withdrawal (million m3)
The increase in our water withdrawal was largely due to the commencement of operations of our second cogeneration plant in Singapore. The plant started operations in late 2014, and with the availability of a full year’s data, it is included in our reporting scope this year. Water withdrawal for 2013 and 2014 has been restated to 1,595.7 and 1,593.7 million cubic metres respectively after an internal verification exercise, instead of 1,502.2 and 1,593.0 million cubic metres as previously reported.
r Indicates restated figure.
0
500
1,000
1,500
2,000
2014 20152013
1,595.7r1,593.7r
1,823.1
Waste Disposal 1, 2 (thousand tonnes)
n Hazardous wasten Non-hazardous waste
We registered a decrease in waste that we disposed of. The decrease in hazardous waste for disposal was due to our ceasing to manage a process which had formerly contributed to hazardous waste generated. The reduction in non-hazardous waste that we disposed of was largely due to optimisation trials at our wastewater plants in China, which reduced the volume of sludge discharged and disposed of. The figures for non-hazardous waste disposed of in 2013 and 2014 have been restated as 22.3 and 31.2 thousand tonnes respectively after an internal verification exercise, instead of 22.4 and 30.5 thousand tonnes as previously reported.
1 The data excludes waste that is collected and incinerated for our customers.
2 Hazardous waste and non-hazardous waste are defined by relevant country regulations in each market.
r Indicates restated figure.
0
10
20
30
40
50
2014 20152013
9.4 12.6 10.4
31.2r
28.922.3r
Going forwardAs Sembcorp continues to grow its businesses and footprint globally, we expect more challenges ahead in the management of on-site HSE.
In 2016, we will concentrate on strengthening the foundations of our HSE management based on the key themes of:
• Visible HSE leadership• Project HSE management• Management of critical risks with Life-saving
Rules and Safe Operations Committees• Promoting active engagement within sites
and with all stakeholders
Specific programmes tailored around these key themes have been implemented progressively across our global sites. We will continue to build upon these foundations in response to the challenges ahead. We believe that the application of validation and verification will be the key to continuous improvement. Therefore, our internal validation and verification peer assist programme will be instrumental in the compliance and continuous improvement in HSE management.
CommunityTo be a responsible business, making a positive contribution to our communities
Why this is material Community integrationSembcorp provides solutions that are essential to everyday life. We view our integration with, support of and contribution to our host communities as part of our licence to operate. We are committed to assessing and responsibly managing our impact on our local communities, as well as investing in them.
Sembcorp Gives Back Day: Celebrating the 20th Anniversary of our Utilities Business
At Sembcorp, we recognise that our success is made possible by the trust that our communities place in us. This year, we marked the 20th anniversary of our Utilities business on August 12 in a meaningful way, with Sembcorp Gives Back Day.
As part of this global initiative in aid of our communities, employees in more than 10 countries, including Singapore, China, India, Vietnam, Oman, UAE, South Africa, UK, Chile, Panama and Antigua, volunteered their time and participated in activities in support of local worthy causes. These activities included helping out at hospices, orphanages and old folks’ homes, installing or repairing facilities to provide drinking water for the local community, improving shower and sanitation facilities at schools, and cleaning up local beaches.
Our approachThe needs of one community can be very different from those of the next. It is our belief that our local operations are best placed to not only
understand these different needs but also to forge the necessary partnerships with relevant local stakeholders to address them. Therefore, while the Group provides the strategic framework, tools and guidelines to ensure consistency and acceptable standards, community integration is managed at the local level.
Our business grows through the development or acquisition of utilities assets. In the development of greenfield plants, we recognise that there is often a social and environmental impact on the communities around us. Therefore, environmental and social impact studies are carried out in accordance with both international and national standards for major new projects and expansions. These studies typically include social management plans that are implemented by the operations teams through the various stages of the site’s development.
Sembcorp’s global corporate social responsibility (CSR) framework provides a strategic and consistent approach for our charitable contributions and community investments. We focus on fostering environmental stewardship and improving the quality of life of the communities we are in.
Environment
We are committed to fostering
environmental stewardship in our
community through contributions to sustainability and
environmental initiatives.
Community
We are committed to improving the living
standards and quality of life of the
community, such as through providing
access to energy and water, social welfare
and education.

SUSTAINABILITY REPORT
SEMBCORP INDUSTRIES ANNUAL REPORT 2015 155154 BUILDING THE FUTURE
Our CSR framework aligns the tracking and reporting of our community contributions with guidelines set by the London Benchmarking Group. This allows us to account for our total community giving – or the amount disbursed through sponsorships or donations – using standard definitions and valuations, and helps us ensure that the contributions recorded are meaningfully spent on community investment activities.
We encourage open communication with the communities we operate in. At our local sites, we use various communication platforms, including community liaison panels and meetings, as well as telephone and email exchanges, to connect with our communities.
Key programmesThe Sembcorp Water InitiativeIn many of the emerging markets which we have recently entered, communities surrounding our sites lack access to clean water. The Sembcorp Water Initiative was established in 2013 to address this problem. Under the initiative, we work with local authorities to implement solutions or facilities to improve access to water for communities in the immediate vicinity of our operations. To date, the Sembcorp Water Initiative has been launched for communities in Quang Ngai and Nghe An in Vietnam, where we are developing urban development and power projects, as well as in Andhra Pradesh in India, where we have two power projects. So far, this initiative has benefited more than 23,000 people.
The Sembcorp Garden City FundThe Sembcorp Garden City Fund was established in 2010 to support the conservation of Singapore’s natural heritage. Through the fund, we have sponsored the establishment of the Sembcorp Forest of Giants, a living gallery of rare giant tree species under threat. The fund has also supported
public green education programmes such as the Festival of Biodiversity. In celebration of Singapore’s golden jubilee in 2015, Sembcorp pledged S$10 million through the fund to expand and enhance the Cool House at the Singapore Botanic Gardens’ National Orchid Garden. This is a temperature-controlled glasshouse where visitors can view rare and beautiful orchids from Asia, the Americas and Africa.
The Sembcorp Water Technology Prize and the Sembcorp-EMA Energy ChallengeEstablished in 2010 and 2014 respectively, these competitions give young people exposure to the water and energy challenges faced by countries and governments, and aim to inspire bright young minds to consider a career in the water and energy industries. The Sembcorp Water Technology Prize is an annual competition co-organised with Singapore’s national water agency PUB for secondary school and junior college students, while the Sembcorp-EMA Energy Challenge is co-organised by Sembcorp and the EMA for students from institutes of technical education, polytechnics and universities.
Sembcorp Gives BackSembcorp’s operations all over the world actively contribute to a range of causes, whether in cash, in kind or through lending its employees’ time and expertise. Sembcorp encourages employee volunteerism by organising regular volunteering events and by giving volunteers time off from work to help out with local worthy causes.
Our performanceIn 2015, Sembcorp and Sembcorp Marine contributed a total of S$7.1 million to charities and community investments globally. Excluding Sembcorp Marine’s contribution, S$3.3 million in cash and in-kind donations was contributed by Sembcorp, of which S$19,700 comprised mandatory
contributions. These contributions supported causes such as youth development, environmental and water conservation education, as well as apprenticeships and job training programmes. Total volunteer man-hours amounted to more than 9,200 hours, of which 16% were spent outside of working hours due to event requirements.
We continued to work on improving internal guidelines and controls with regard to community and social impact. We established our Group stakeholder and community engagement policy as well as our community grievance management
Community Contributions1 (S$ million)
Despite a challenging business environment, we remained committed to investing in our communities in 2015. In celebration of the 50th anniversary of Singapore’s independence, we made a S$2 million contribution to enhance the Cool House at the National Orchid Garden, as part of a S$10 million commitment over four years. In addition, during the year, we organised Sembcorp Gives Back Day, a global initiative in aid of communities in which we operate. Employees in more than 10 countries took part in the initiative by volunteering their time and participating in activities in support of local worthy causes. Total employee volunteer hours in 2015 amounted to more than 9,200 hours.
1 Data excludes contributions by Sembcorp Marine.
0
0.5
1.0
1.5
2.5
3.0
3.5
2.0
201520142013
1.8
2.4
3.3
policy to ensure that our businesses, especially those at project development stage, adopt a structured process to engage stakeholders within their communities and ensure grievances are addressed.
In 2015, 89% of our operations had local community engagement and / or development programmes.
Going forwardIn line with our focus on managing community and social impact responsibly, we aim to enhance our internal processes with an environmental and social investment framework. This framework aims to embed environmental and social impact considerations at the onset of projects during the investment approval process. By highlighting potential environmental or social impacts, this will help mitigate impact and support integration with our communities, while ensuring that obligations to our communities, partners and capital providers are met.

SEMBCORP INDUSTRIES ANNUAL REPORT 2015 157156 BUILDING THE FUTURE
In the context of constantly evolving requirements of disclosure, transparency and corporate governance, we aim to provide investors with an accurate, coherent and balanced account of the Group’s performance and prospects. Sembcorp has a dedicated investor relations team and communicates with the investing public through multiple platforms and channels. These include group briefings to analysts, investors and the media; one-on-one meetings with shareholders and potential investors; investor roadshows as well as the investor relations section of our corporate website. In addition, we also organise company visits and facility tours to help investors gain insights into the Group’s operations.
PROACTIVE COMMUNICATION WITH THE FINANCIAL COMMUNITY
During the year, senior management and the investor relations team continued to actively engage with the financial community. We held approximately 130 one-on-one and group meetings with shareholders, analysts and potential investors. These included non-deal roadshows in Singapore, London, Edinburgh, Frankfurt and Amsterdam. We also participated in five investor conferences: the Credit Suisse 18th Annual Asian Investment Conference in Hong Kong, and in Singapore, the Maybank Invest ASEAN Conference, the 6th Annual
dbAccess Asia Conference, the UBS ASEAN Conference and the Morgan Stanley 14th Annual Asia Pacific Summit. We also continued to organise site visits to our facilities on Jurong Island, Singapore to provide analysts and investors a first-hand look at our operations and allow them to gain a better understanding of Sembcorp’s capabilities and operational track record.
Sembcorp constantly strives to strengthen its investor relations and we are pleased that our efforts in this regard have been recognised. During the year, we won the silver award for Best Investor Relations at the 2015 Singapore Corporate Awards, for companies with S$1 billion and above in market capitalisation. In addition, at the IR Magazine Awards South East Asia 2015, we were nominated for having the best investor relations amongst companies in the utilities sector.
COMMITMENT TO GOOD CORPORATE GOVERNANCE
Sembcorp continues to rank among the top companies in Singapore for good corporate governance and transparency. We were the sixth-highest ranked company in Singapore in the 2015 edition of the Governance & Transparency Index (GTI). A well-respected ranking exercise by The Business Times and National University of
At Sembcorp, we are committed to ensuring that all capital market
players have easy access to clear, reliable and meaningful information
on our company in order to make informed investment decisions.
INVESTOR RELATIONS
Singapore Business School’s Centre for Governance, Institutions and Organisations, the GTI assesses the transparency of 639 Singapore-listed companies based on their annual financial announcements.
In addition, we were recognised as the Most Transparent Company under the Oil & Gas category at the SIAS Investors Choice Awards 2015. This award honours and recognises public listed companies that have demonstrated exemplary corporate governance and transparency practices throughout the year.
TOTAL SHAREHOLDER RETURN
Sembcorp Industries’ last traded share price in 2015 was S$3.05, and the company ended the year with a market capitalisation of S$5.5 billion. The company’s share price averaged S$3.87 during the year, registering a high of S$4.86 in April and a low of S$2.98 in December. Daily turnover averaged 4.1 million shares.
The weak and uncertain global economic outlook continued to weigh on the equities markets in Singapore and the region in 2015. Low oil prices have also put pressure on the share prices of companies tied to the oil and gas industry, including our Marine subsidiary. Sembcorp Industries’ total shareholder return for the year stood at negative 29%. In 2015, the FTSE ST Oil & Gas Sector Index recorded a negative 31% return. Aside from the performance of oil and gas stocks, markets as a whole across Singapore and the region turned in a weak performance, reflecting the challenging conditions across the board. The Straits Times Index and the MSCI Asia Pacific
ex-Japan Industrials Index ended the year with a negative 11% return and a negative 15% return respectively.
Sembcorp remains committed to delivering shareholder value amidst these difficult operating conditions. For the financial year 2015, an interim dividend of 5 cents per ordinary share was declared and paid to shareholders in September 2015. In addition, a final dividend of 6 cents per ordinary share has been proposed, subject to approval by shareholders at the next annual general meeting. Together with the interim dividend, this brings our total dividend for FY2015 to 11 cents per ordinary share.
SHAREHOLDER INFORMATION
In 2015, institutional shareholders as a group continued to dominate Sembcorp’s shareholder base. Other than our major shareholder Temasek Holdings, which held 49.5% of our shares at the end of 2015, institutional shareholders accounted for 31.2% of our issued share capital or 62% of free float, while retail shareholders1 and unidentified shareholders2 held 19.3% of issued share capital or 38% of free float. In terms of geographical spread, excluding the stake held by Temasek Holdings, our largest geographical shareholding base was Europe with 13% of issued share capital, followed by shareholders from North America and Asia, which accounted for 10% and 9% of our company’s issued share capital respectively.
1 Retail shareholders include private investors, brokers, custodians and corporates2 Unidentified shareholders mainly include shareholders that fall below the threshold of 250,000 shares

INVESTOR RELATIONS
SEMBCORP INDUSTRIES ANNUAL REPORT 2015 159158 BUILDING THE FUTURE
Average Monthly Traded Volume of Sembcorp Industries Shares in 2015 (thousands)
Average Monthly Sembcorp Industries Share Price and Straits Times Index in 2015 (rebased)Share Ownership by Investor Categoryn Strategic n Institutionsn Retail*
* Includes private investors, brokers, custodians and corporates** Shareholders not identified mainly include those that fall below
the threshold of 250,000 shares
As at December 31, 2015
Share Ownership by Geographical Distributionn Singaporen Asia (ex-Singapore)n Europen North American Rest of the world
* Shareholders not identified mainly include those that fall below the threshold of 250,000 shares
As at December 31, 2015
0
8,000
6,000
4,000
2,000
JAN FEB MAR APR MAY JUN JUL AUG SEP OCT NOV DEC
Month Average Volume (‘000)
January 3,504February 3,810March 2,943April 3,912May 4,220June 3,874July 2,702August 7,335September 5,368October 4,925November 3,280December 3,648
n Sembcorp Industriesn Straits Times Index
Sembcorp Straits Industries TimesMonth (S$) Index
Jan uary 4.24 3,353.93February 4.25 3,424.26March 4.25 3,404.72April 4.56 3,491.63May 4.25 3,449.13June 3.95 3,325.48July 3.84 3,316.89August 3.46 3,039.84September 3.44 2,862.12October 3.72 2,984.07November 3.41 2,939.36December 3.07 2,863.42
17%*
13%
55%
4%
1%
10%
8.2%
31.2%
49.5%
11.1%**0
40
60
100
120
20
80
JAN FEB MAR APR MAY JUN JUL AUG SEP OCT NOV DEC

Shareholders’ Information 338
Governance Disclosure Guide 340
Corporate Information 352
Notice of Annual General Meeting 353
Proxy Form 363
Financial Calendar Inside Back Cover
Directors’ Statement 162
Independent Auditors’ Report 177
Balance Sheets 178
Consolidated Income Statement 180
Consolidated Statement of Comprehensive Income 181
Consolidated Statement of Changes in Equity 182
Consolidated Statement of Cash Flows 190
Notes to the Financial Statements 193
Supplementary Information 334
EVA Statement 337
FINANCIAL STATEMENTS
Sembcorp’s combined power and desalination facility in Salalah, Oman

DIRECTORS’ STATEMENTYear ended December 31, 2015
We are pleased to submit this annual report to the members of the Company together with the audited financial statements for the financial year ended December 31, 2015.
In our opinion:
a. the financial statements set out on pages 178 to 333 are drawn up so as to give a true and fair view of the financial position of the Group and of the Company as at December 31, 2015 and the financial performance, changes in equity and cash flows of the Group for the year ended on that date in accordance with the provisions of the Singapore Companies Act, Chapter 50 and Singapore Financial Reporting Standards; and
b. at the date of this statement, there are reasonable grounds to believe that the Company will be able to pay its debts as and when they fall due.
The Board of Directors has, on the date of this statement, authorised these financial statements for issue.
DirectorsThe directors in office at the date of this statement are as follows:
Ang Kong HuaTang Kin FeiBobby Chin Yoke ChoongMargaret LuiTan Sri Mohd Hassan MaricanTham Kui SengDr Teh Kok PengAjaib HaridassNeil McGregorNicky Tan Ng Kuang (appointed on November 1, 2015)
Directors’ InterestsAccording to the register kept by the Company for the purposes of Section 164 of the Singapore Companies Act, Chapter 50 (the “Act”), particulars of interests of directors who held office at the end of the financial year (including those held by their spouses and children) in shares, debentures, warrants and share options in the Company and in related corporations are as follows:
Shareholdings registered in the name Other shareholdings in which
of director, spouse, children or nominee the director is deemed to have an interest
Name of director At At
and corporation beginning At end At beginning At end At
in which interests held Description of interests of the year of the year 21/01/2016 of the year of the year 21/01/2016
Ang Kong Hua Sembcorp Industries Ltd Ordinary shares (Note 1) 70,500 121,600 121,600 – – –
Tang Kin Fei Sembcorp Industries Ltd Ordinary shares (Note 2) 5,499,486 5,688,006 5,688,006 – – – Conditional award of: – 400,000 performance shares to be delivered Up to after 2014 (Note 3a) 600,000 – – – – –
Directors’ Interests (cont’d)
Shareholdings registered in the name Other shareholdings in which
of director, spouse, children or nominee the director is deemed to have an interest
Name of director At At
and corporation beginning At end At beginning At end At
in which interests held Description of interests of the year of the year 21/01/2016 of the year of the year 21/01/2016
Tang Kin Fei (cont’d) Conditional award of: Sembcorp Industries Ltd – 300,000 performance (cont’d) shares to be delivered Up to Up to Up to after 2015 (Note 3b) 450,000 450,000 450,000 – – –
– 300,000 performance shares to be delivered Up to Up to Up to after 2016 (Note 3c) 450,000 450,000 450,000 – – –
– 350,000 performance shares to be delivered Up to Up to after 2017 (Note 3d) – 525,000 525,000 – – –
– 126,000 restricted shares to be delivered after 2012 (Note 4a) 57,120 – – – – –
– 126,000 restricted shares to be delivered after 2013 (Note 4b) 126,000 63,000 63,000 – – –
– 180,000 restricted shares to be delivered Up to after 2014 (Note 4c) 270,000 136,800 136,800 – – –
– 180,000 restricted shares to be delivered Up to Up to Up to after 2015 (Note 4d) 270,000 270,000 270,000 – – –
– 230,000 restricted shares to be delivered Up to Up to after 2016 (Note 4e) – 345,000 345,000 – – –
Subordinated Perpetual Securities issued on August 21, 2013 under the S$2 Billion Principal Principal Principal Multicurrency Debt amount: amount: amount: Issuance Programme S$1,000,000 S$1,000,000 S$1,000,000 – – –
Sembcorp Marine Ltd Ordinary shares 249,470 272,270 272,270 – – –
SEMBCORP INDUSTRIES ANNUAL REPORT 2015 163162 BUILDING THE FUTURE

DIRECTORS’ STATEMENTYear ended December 31, 2015
Directors’ Interests (cont’d)
Shareholdings registered in the name Other shareholdings in which
of director, spouse, children or nominee the director is deemed to have an interest
Name of director At At
and corporation beginning At end At beginning At end At
in which interests held Description of interests of the year of the year 21/01/2016 of the year of the year 21/01/2016
Tang Kin Fei (cont’d) Sembcorp Financial Fixed Rate Notes due Services Pte Ltd 2020 issued under the S$2 Billion Multicurrency Principal Principal Principal Debt Issuance Programme amount: amount: amount: (Note 5) S$500,000 S$500,000 S$500,000 – – –
Bobby Chin Yoke Choong Sembcorp Industries Ltd Ordinary shares 55,600 68,500 68,500 – – –
Margaret Lui Sembcorp Industries Ltd Ordinary shares 28,100 40,500 40,500 – – –
Tan Sri Mohd Hassan Marican Sembcorp Industries Ltd Ordinary shares (Note 6) 29,600 41,000 41,000 – – –
Sembcorp Marine Ltd Ordinary shares (Note 6) 30,200 80,300 80,300 – – –
Tham Kui Seng Sembcorp Industries Ltd Ordinary shares 15,500 24,900 24,900 – – –
Dr Teh Kok Peng Sembcorp Industries Ltd Ordinary shares 8,700 19,400 19,400 – – –
Sembcorp Marine Ltd Ordinary shares 40,000 40,000 40,000 – – –
Ajaib Haridass Sembcorp Industries Ltd Ordinary shares – 5,800 5,800 – – –
Sembcorp Marine Ltd Ordinary shares 713,910 739,810 739,810 – – –
Neil McGregor Sembcorp Industries Ltd Ordinary shares – 5,300 5,300 – – –
Note 1: Of the 121,600 Sembcorp Industries Ltd (SCI) shares, 70,500 shares are held in the name of DBS Nominees Pte Ltd.
Note 2: Of the 5,688,006 SCI shares, 1,000,000 shares are held in the name of DBS Nominees Pte Ltd and 1,000,000 shares are held in the name of Citibank Nominees Singapore Pte Ltd.
Note 3: The actual number to be delivered will depend on the achievement of set targets over a 3-year period as indicated below. Achievement of targets below threshold level will mean no performance shares will be delivered, while achievement up to 150% will mean up to 1.5 times the number of conditional performance shares awarded could be delivered.
a. Period from 2012 to 2014 1
b. Period from 2013 to 2015c. Period from 2014 to 2016d. Period from 2015 to 20171 For this period, no SCI shares were released to Tang Kin Fei under the Performance Share Plan (PSP) scheme as the targets were not met.
Directors’ Interests (cont’d)
Note 4: The actual number to be delivered will depend on the achievement of set targets at the end of the 2-year performance period as indicated below. Achievement of targets below threshold level will mean no restricted shares will be delivered, while achievement up to 150% will mean up to 1.5 times the number of conditional restricted shares awarded could be delivered.
a. Period from 2011 to 2012 1
b. Period from 2012 to 2013 2
c. Period from 2013 to 2014 3
d. Period from 2014 to 2015e. Period from 2015 to 20161 For this period, 57,120 SCI shares (the final release of the 1/3 of the 171,360 shares) were vested under the award to Tang Kin Fei on March 27, 2015.
The 1st and 2nd release of 57,120 shares each have been vested in 2013 and 2014 respectively.2 For this period, 63,000 SCI shares (2nd release of the 1/3 of the 189,000 shares) were vested under the award to Tang Kin Fei on March 27, 2015 and
the remaining 63,000 shares will be vested in 2016. The 1st release of 63,000 shares has been vested on March 27, 2014.3 For this period, 68,400 SCI shares (1st release of the 1/3 of the 205,200 shares) were vested under the award to Tang Kin Fei on March 27, 2015 and
the remaining 136,800 shares will be vested in 2016 and 2017.
Note 5: Fixed Rate Notes issued under the S$2 Billion Multicurrency Debt Issuance Programme of Sembcorp Industries Ltd and Sembcorp Financial Services Pte Ltd, a related company of Sembcorp Industries Group.
Note 6: The 41,000 SCI shares and 80,300 Sembcorp Marine Ltd shares are held in the name of Citibank Nominees Singapore Pte Ltd.
Except as disclosed in this statement, no director who held office at the end of the financial year had interests in shares, debentures, warrants or share options of the Company, or of related corporations, either at the beginning of the financial year, or date of appointment if later, or at the end of the financial year.
There were no changes in any of the above mentioned interests in the Company between the end of the financial year and January 21, 2016.
Except as disclosed under the “Share-based Incentive Plans” section of this statement, neither at the end of, nor at any time during the financial year, was the Company a party to any arrangement whose objects are, or one of whose objects is, to enable the directors of the Company to acquire benefits by means of the acquisition of shares in or debentures of the Company or any other body corporate.
Except as disclosed in Notes 28(a) and 35 to the financial statements, since the end of the last financial year, no director has received or become entitled to receive, a benefit by reason of a contract made by the Company or a related corporation with the director, or with a firm of which he is a member, or with a company in which he has a substantial financial interest.
Share-based Incentive PlansThe Company’s Performance Share Plan (SCI PSP 2010) and Restricted Share Plan (SCI RSP 2010) (collectively, the “2010 Share Plans”) were approved and adopted by the shareholders at an Extraordinary General Meeting of the Company held on April 22, 2010. The 2010 Share Plans replaced the Share Plans which were approved and adopted by the shareholders at an Extraordinary General Meeting of the Company held on June 5, 2000 and expired in 2010.
The Executive Resource & Compensation Committee (the “Committee”) of the Company has been designated as the Committee responsible for the administration of the Share Plans. The Committee comprises the following members, all of whom are directors:
Ang Kong Hua (Chairman)Margaret LuiTan Sri Mohd Hassan MaricanDr Teh Kok Peng (appointed on April 22, 2015)
The SCI RSP 2010 is the incentive scheme for directors and employees of the Group whereas the SCI PSP 2010 is aimed primarily at key executives of the Group.
SEMBCORP INDUSTRIES ANNUAL REPORT 2015 165164 BUILDING THE FUTURE

DIRECTORS’ STATEMENTYear ended December 31, 2015
Share-based Incentive Plans (cont’d)
The 2010 Share Plans are intended to increase the Company’s flexibility and effectiveness in its continuing efforts to attract, retain and incentivise participants to higher standards of performance and encourage greater dedication and loyalty by enabling the Company to give recognition to past contributions and services; as well as motivating participants to contribute to the long-term prosperity of the Group. The 2010 Share Plans will strengthen the Company’s competitiveness in attracting and retaining talented key senior management and senior executives.
The SCI RSP 2010 is intended to apply to a broad base of senior executives as well as to the non-executive directors, while the SCI PSP 2010 is intended to apply to a select group of key senior management. Generally, it is envisaged that the range of performance targets to be set under the SCI RSP 2010 and the SCI PSP 2010 will be different, with the latter emphasising stretched or strategic targets aimed at sustaining longer term growth.
The 2010 Share Plans will provide incentives to high performing key senior management and senior executives to excel in their performance and encourage greater dedication and loyalty to the Company. Through the 2010 Share Plans, the Company will be able to motivate key senior management and senior executives to continue to strive for the Group’s long-term shareholder value. In addition, the 2010 Share Plans aim to foster a greater ownership culture within the Group which align the interests of participants with the interests of shareholders, and to improve performance and achieve sustainable growth for the Company in the changing business environment.
The 2010 Share Plans use methods fairly common among major local and multinational companies to incentivise and motivate key senior management and senior executives to achieve pre-determined targets which create and enhance economic value for shareholders. The Company believes that the 2010 Share Plans will be effective tools in motivating key senior management and senior executives to strive to deliver long-term shareholder value.
While the 2010 Share Plans cater principally to Group executives, it is recognised that there are other persons who can make significant contributions to the Group through their close working relationship with the Group. Such persons include employees of associated companies over which the Company has operational control.
A participant’s awards under the 2010 Share Plans will be determined at the sole discretion of the Committee. In considering an award to be granted to a participant, the Committee may take into account, inter alia, the participant’s performance during the relevant period, and his capability, entrepreneurship, scope of responsibility and skill set.
Other information regarding the 2010 Share Plans and Share Option Plan is as follows:
a. Share Option PlanUnder the rules of the Share Option Plan, participants who ceased to be employed by the Group or the associated company by reason of ill health, injury or disability, redundancy, retirement at or after the legal retirement age, retirement before the legal retirement age, death, etc., or any other event approved by the Committee, may be allowed by the Committee to retain their unexercised options. The Committee may determine the number of shares comprised in that option which may be exercised and the period during which such option shall be exercisable, being a period not later than the expiry of the exercise period in respect of that option. Such option may be exercised at any time notwithstanding that the date of exercise of such option falls on a date prior to the first day of the exercise period in respect of such option.
Other information regarding the Share Option Plan is as follows:
i. The exercise price of the options can be set at market price or a discount to the market price not exceeding 20% of the market price in respect of options granted at the time of grant. Market price is the volume-weighted average price for the shares on the Singapore Exchange Securities Trading Limited (SGX-ST) over the three consecutive trading days prior to grant date of that option. For all options granted to date, the exercise prices are set at market price.
Share-based Incentive Plans (cont’d)
a. Share Option Plan (cont’d)
ii. After the first 12 months of lock-out period, the Group imposed a further vesting of 4 years for managers and above for retention purposes.
iii. In 2015 and 2014, all options were settled by the issuance of treasury shares.
iv. The options granted expire after 5 years for non-executive directors and associated company’s employees, and 10 years for the employees of the Group. There are no outstanding share options for non-executive directors.
v. All options will expire on June 9, 2016.
vi. Sembcorp Industries Ltd Share Option PlanAt the end of the financial year, details of the options granted under the Share Option Plan on unissued ordinary shares of the Company are as follows:
Sembcorp Industries Ltd Ordinary shares 2015 Options
Options cancelled / Options Options Options
Exercise outstanding lapsed / outstanding exercisable exercisable
Date of grant price at Options not at at at
of options per share Jan 1, 2015 exercised accepted Dec 31, 2015 Jan 1, 2015 Dec 31, 2015 Exercise period
01/07/2005 S$2.37 121,250 (71,000) (50,250) – 121,250 – 02/07/2006 to 01/07/2015
21/11/2005 S$2.36 176,750 (94,000) (82,750) – 176,750 – 22/11/2006 to 21/11/2015
09/06/2006 S$2.52 373,299 (53,750) – 319,549 373,299 319,549 10/06/2007 to 09/06/2016
671,299 (218,750) (133,000) 319,549 671,299 319,549
2014 Options
Options cancelled / Options Options Options
Exercise outstanding lapsed / outstanding exercisable exercisable
Date of grant price at Options not at at at
of options per share Jan 1, 2014 exercised accepted Dec 31, 2014 Jan 1, 2014 Dec 31, 2014 Exercise period
17/05/2004 S$0.99 26,500 (3,625) (22,875) – 26,500 – 18/05/2005 to 17/05/2014
22/11/2004 S$1.16 29,375 (5,875) (23,500) – 29,375 – 23/11/2005 to 22/11/2014
01/07/2005 S$2.37 139,875 (15,625) (3,000) 121,250 139,875 121,250 02/07/2006 to 01/07/2015
21/11/2005 S$2.36 217,625 (36,875) (4,000) 176,750 217,625 176,750 22/11/2006 to 21/11/2015
09/06/2006 S$2.52 809,049 (431,750) (4,000) 373,299 809,049 373,299 10/06/2007 to 09/06/2016
1,222,424 (493,750) (57,375) 671,299 1,222,424 671,299
SEMBCORP INDUSTRIES ANNUAL REPORT 2015 167166 BUILDING THE FUTURE

DIRECTORS’ STATEMENTYear ended December 31, 2015
Share-based Incentive Plans (cont’d)
a. Share Option Plan (cont’d)
vi. Sembcorp Industries Ltd Share Option Plan (cont’d)
The details of options of the Company awarded / exercised since commencement of the Scheme (aggregate) to December 31, 2015 are as follows:
Aggregate
options
Aggregate cancelled / Aggregate Aggregate
options lapsed / options options
Option participants granted not accepted exercised outstanding
Directors Ang Kong Hua – – – –Tang Kin Fei 3,444,052 (607,759)1 (2,836,293) –Goh Geok Ling (retired on April 21, 2015) 370,000 – (370,000) – Evert Henkes (retired on April 21, 2015) 94,000 – (94,000) – Bobby Chin Yoke Choong – – – – Margaret Lui – – – – Tan Sri Mohd Hassan Marican – – – – Tham Kui Seng – – – – Dr Teh Kok Peng – – – – Ajaib Haridass – – – – Neil McGregor – – – – Nicky Tan Ng Kuang – – – – Other executives Group 149,771,742 (69,559,413) (79,892,780) 319,549 Associated company 748,600 (215,100) (533,500) – Parent Group 2 378,500 (113,000) (265,500) – Former directors of the Company 10,641,578 (2,383,328) (8,258,250) –Total 165,448,472 (72,878,600) (92,250,323) 319,549
1. Options lapsed due to replacement of 1999 options and expiry of earlier options.
2. Parent Group refers to former employees of Singapore Technologies Pte Ltd. No options were granted to former employees of Singapore Technologies Pte Ltd since 2005.
Since the commencement of the Share Option Plan, no options have been granted to the controlling shareholders of the Company or their associates. No participant under the Share Option Plan has been granted 5% or more of the total options available. No options have been offered at a discount.
The options granted by the Company do not entitle the holders of the options, by virtue of such holdings, to any right to participate in any share issue of any company.
Share-based Incentive Plans (cont’d)
a. Share Option Plan (cont’d)
vii. Share options of a listed subsidiaryAt the end of the financial year, details of the options granted under the Share Option Plan on unissued ordinary shares of Sembcorp Marine Ltd are as follows:
Sembcorp Marine Ltd Ordinary shares 2015
Options
Options cancelled / Options Options Options
Exercise outstanding lapsed / outstanding exercisable exercisable
Date of grant price at Options not at at at
of options per share Jan 1, 2015 exercised accepted Dec 31, 2015 Jan 1, 2015 Dec 31, 2015 Exercise period
11/08/2005 S$2.11 667,190 (392,000) (275,190) – 667,190 – 12/08/2006 to 11/08/2015
02/10/2006 S$2.38 1,009,312 (22,000) (14,000) 973,312 1,009,312 973,312 03/10/2007 to 02/10/2016
1,676,502 (414,000) (289,190) 973,312 1,676,502 973,312
2014 Options
Options cancelled / Options Options Options
Exercise outstanding lapsed / outstanding exercisable exercisable
Date of grant price at Options not at at at
of options per share Jan 1, 2014 exercised accepted Dec 31, 2014 Jan 1, 2014 Dec 31, 2014 Exercise period
10/08/2004 S$0.74 168,710 (129,760) (38,950) – 168,710 – 11/08/2005 to 10/08/2014
11/08/2005 S$2.11 857,140 (173,500) (16,450) 667,190 857,140 667,190 12/08/2006 to 11/08/2015
02/10/2006 S$2.38 1,134,329 (109,617) (15,400) 1,009,312 1,134,329 1,009,312 03/10/2007 to 02/10/2016
2,160,179 (412,877) (70,800) 1,676,502 2,160,179 1,676,502
b. Performance Share PlanUnder the Performance Share Plan (SCI PSP 2010), the awards granted conditional on performance targets are set based on medium-term corporate objectives at the start of each rolling three-year performance qualifying period. A specific number of performance shares shall be awarded at the end of the three-year performance cycle depending on the extent of the achievement of the performance conditions established at the onset.
The performance levels were calibrated based on Wealth Added and Total Shareholder Return. For awards granted from 2014 onwards, the performance levels were calibrated based on Wealth Added, Total Shareholder Return and Earnings per share. A minimum threshold performance must be achieved to trigger an achievement factor, which in turn determines the number of shares to be finally awarded. Performance shares to be delivered will range between 0% to 150% of the conditional performance shares awarded.
SEMBCORP INDUSTRIES ANNUAL REPORT 2015 169168 BUILDING THE FUTURE

DIRECTORS’ STATEMENTYear ended December 31, 2015
Share-based Incentive Plans (cont’d)
b. Performance Share Plan (cont’d)
To create alignment between senior management and other employees at the time of vesting, SCI PSP 2010 has in place a plan trigger. Under this trigger mechanism, the performance shares for the performance period 2015 to 2017 will be vested to the senior management participants only if the restricted shares for the performance period 2016 to 2017 are vested, subject to the achievement of the performance conditions for the respective performance periods.
Senior management participants are required to hold a minimum percentage of the shares released to them under the Performance Share Plan to maintain a beneficial ownership stake in the Group, for the duration of their employment or tenure with the Group. A maximum cap is set based on a multiple of the individual participant’s annual base salary. Any excess can be sold off, but in the event of a shortfall, they have a two calendar year period to meet the minimum percentage requirement.
i. Sembcorp Industries Ltd Performance SharesThe details of the movement of the performance shares of Sembcorp Industries Ltd awarded during the financial year since commencement of the Performance Share Plan (aggregate) are as follows:
Movements during the year
Additional
performance Performance
Conditional shares awarded shares lapsed Conditional
Performance shares performance arising from arising from performance
participants At Jan 1 shares awarded targets met targets not met shares released At Dec 31
2015 Director of the Company: Tang Kin Fei 1,000,000 350,000 – (400,000) – 950,000 Key executives of the Group 1,004,861 481,250 – (354,861) – 1,131,250 2,004,861 831,250 – (754,861) – 2,081,250
2014 Director of the Company: Tang Kin Fei 1,100,000 300,000 – (148,000) (252,000) 1,000,000 Key executives of the Group 1,069,723 325,000 – (144,249) (245,613) 1,004,861 2,169,723 625,000 – (292,249) (497,613) 2,004,861
With the Committee’s approval on the achievement factor for the achievement of the performance targets for the performance period 2012 to 2014 (2014: performance period 2011 to 2013), no performance shares were released via the issuance of treasury shares (2014: 497,613).
In 2015, 754,861 (2014: 292,249) performance shares were lapsed for under-achievement of the performance targets for the performance period 2012 to 2014 (2014: 2011 to 2013).
The total number of performance shares in awards granted conditionally and representing 100% of targets to be achieved, but not released as at end 2015, was 2,081,250 (2014: 2,004,861). Based on the multiplying factor, the actual release of the awards could range from zero to a maximum of 3,121,875 (2014: 3,007,292) performance shares.
Share-based Incentive Plans (cont’d)
b. Performance Share Plan (cont’d)
ii. Performance shares of a listed subsidiaryThe details of the movement of the performance shares of Sembcorp Marine Ltd awarded during the year are as follows:
2015 2014
At January 1 2,810,000 1,915,000 Conditional performance shares awarded 1,215,000 1,480,000 Conditional performance shares lapsed (150,000) (62,225) Performance shares lapsed arising from targets not met (675,000) (360,715) Conditional performance shares released – (162,060)At December 31 3,200,000 2,810,000
No performance shares of Sembcorp Marine Ltd were awarded to the directors of the Company.
With the Sembcorp Marine Ltd’s committee’s approval on the achievement factor for the achievement of the performance targets for the performance period 2012 to 2014 (2014: 2011 to 2013), no performance shares were released via the issuance of treasury shares (2014: 162,060).
In 2015, 675,000 (2014: 360,715) performance shares were lapsed for under-achievement of the performance targets for the performance period 2012 to 2014 (2014: 2011 to 2013).
The total number of performance shares in awards granted conditionally and representing 100% of targets to be achieved, but not released as at December 31, 2015, was 3,200,000 (2014: 2,810,000). Based on the multiplying factor, the actual release of the awards could range from zero to a maximum of 4,800,000 (2014: 4,215,000) performance shares.
c. Restricted Share PlanUnder the Restricted Share Plan (SCI RSP 2010), the awards granted conditional on performance targets are set based on corporate objectives at the start of each rolling two-year performance qualifying period. The performance criteria for the restricted shares are calibrated based on Return on Total Assets (excluding Sembcorp Marine Ltd) and Group Profit from Operations (excluding Sembcorp Marine Ltd) for awards granted in 2015.
A minimum threshold performance must be achieved to trigger an achievement factor, which in turn determines the number of shares to be finally awarded. Based on the criteria, restricted shares to be delivered will range from 0% to 150% of the conditional restricted shares awarded.
The managerial participants of the Group will be awarded restricted shares under SCI RSP 2010, while the non-managerial participants of the Group will receive their awards in an equivalent cash value. This cash-settled notional restricted shares award for non-managerial participants is known as the Sembcorp Challenge Bonus.
A specific number of restricted shares shall be awarded at the end of the two-year performance cycle depending on the extent of the achievement of the performance conditions established at the onset. There is a further vesting period of three years after the performance period, during which one-third of the awarded shares are released each year to managerial participants. Non-managerial participants will receive the equivalent in cash at the end of the two-year performance cycle, with no further vesting conditions.
Senior management participants are required to hold a minimum percentage of the shares released to them under the Restricted Share Plan to maintain a beneficial ownership stake in the Group, for the duration of their employment or tenure with the Group. A maximum cap is set based on a multiple of the individual participant’s annual base salary. Any excess can be sold off, but in the event of a shortfall, they have a two calendar year period to meet the minimum percentage requirement.
SEMBCORP INDUSTRIES ANNUAL REPORT 2015 171170 BUILDING THE FUTURE

DIRECTORS’ STATEMENTYear ended December 31, 2015
Share-based Incentive Plans (cont’d)
c. Restricted Share Plan (cont’d)
To align the interests of the non-executive directors with the interests of shareholders, up to 30% of the aggregate directors’ fees approved by shareholders for a particular financial year may be paid out in the form of restricted share awards under the SCI RSP 2010.
From 2011, non-executive directors were not awarded any shares except as part of their directors’ fees (except for Mr Tang Kin Fei, who is the Group President & CEO, and who does not receive any directors’ fees). In 2015 and 2014, the awards granted consisted of the grant of fully paid shares outright with no performance and vesting conditions attached, but with a selling moratorium. Non-executive directors are required to hold shares (including shares obtained by other means) worth at least one-time the annual base retainer; any excess may be sold as desired. A non-executive director can dispose of all of his shares one year after leaving the Board.
The actual number of shares awarded to each non-executive director will be determined by reference to the volume-weighted average price of a share on the SGX-ST over the 14 trading days from (and including) the day on which the shares are first quoted ex-dividend after the AGM (or, if the resolution to approve the final dividend is not approved, over the 14 trading days immediately following the date of the AGM). The number of shares to be awarded will be rounded down to the nearest hundred and any residual balance will be settled in cash. A non-executive director who steps down before the payment of the share component will receive all of his director’s fees for the year (calculated on a pro-rated basis, where applicable) in cash.
i. Sembcorp Industries Ltd Restricted SharesThe details of the movement of the restricted shares of Sembcorp Industries Ltd awarded during the year are as follows:
Movements during the year
Additional
restricted
Conditional shares awarded Conditional Conditional
Restricted shares restricted arising from restricted restricted
participants At Jan 1 shares awarded targets met shares released shares lapsed At Dec 31
2015 Directors of the Company: Ang Kong Hua – 51,100 – (51,100) – – Tang Kin Fei 543,120 230,000 25,200 (188,520) – 609,800 Bobby Chin Yoke Choong – 12,900 – (12,900) – – Margaret Lui – 12,400 – (12,400) – – Tan Sri Mohd Hassan Marican – 11,400 – (11,400) – – Tham Kui Seng – 9,400 – (9,400) – – Dr Teh Kok Peng – 10,700 – (10,700) – – Ajaib Haridass – 5,800 – (5,800) – – Neil McGregor – 5,300 – (5,300) – – Other executives of the Group 6,789,809 2,876,075 266,560 (2,475,072) (238,043) 7,219,329 7,332,929 3,225,075 291,760 (2,782,592) (238,043) 7,829,129
Share-based Incentive Plans (cont’d)
c. Restricted Share Plan (cont’d)
i. Sembcorp Industries Ltd Restricted Shares (cont’d)
Movements during the year
Additional
restricted
Conditional shares awarded Conditional Conditional
Restricted shares restricted arising from restricted restricted
participants At Jan 1 shares awarded targets met shares released shares lapsed At Dec 31
2014 Directors of the Company: Ang Kong Hua – 18,400 – (18,400) – – Tang Kin Fei 471,060 180,000 63,000 (170,940) – 543,120 Goh Geok Ling (retired on April 21, 2015) – 9,900 – (9,900) – – Evert Henkes (retired on April 21, 2015) – 13,500 – (13,500) – – Bobby Chin Yoke Choong – 11,000 – (11,000) – – Margaret Lui – 9,900 – (9,900) – – Tan Sri Mohd Hassan Marican – 10,600 – (10,600) – – Tham Kui Seng – 6,600 – (6,600) – – Dr Teh Kok Peng – 7,400 – (7,400) – – Other executives of the Group 6,483,954 2,113,000 1,087,350 (2,627,146) (267,349) 6,789,809
6,955,014 2,380,300 1,150,350 (2,885,386) (267,349) 7,332,929
With the Committee’s approval on the achievement factor for the achievement of the performance targets for the performance period 2013 to 2014, a total of 802,901 restricted shares were released in 2015. For awards in relation to the performance period 2012 to 2013, a total of 1,033,746 (2014: 1,223,584) were released in 2015. For awards in relation to the performance period 2011 to 2012, a total of 823,882 (2014: 907,067) restricted shares were released in 2015. For awards in relation to the performance period 2010 to 2011, no restricted shares were released in 2015 (2014: 667,435). In 2015, there were 119,000 (2014: 87,300) shares released to non-executive directors. In 2015, there were additional 3,063 shares released to employees due to sale of a subsidiary. Of the restricted shares released, 53,354 (2014: 29,887) restricted shares were cash-settled. The remaining restricted shares were released via the issuance of treasury shares.
In 2015, additional 291,760 (2014: 1,150,350) restricted shares were awarded for the over-achievement of the performance targets for the performance period 2013 to 2014 (2014: performance period 2012 to 2013).
The total number of restricted shares outstanding, including award(s) achieved but not released, as at end 2015, was 7,829,129 (2014: 7,332,929). Of this, the total number of restricted shares in awards granted conditionally and representing 100% of targets to be achieved, but not released was 5,267,075 (2014: 4,383,100). Based on the multiplying factor, the actual release of the conditional awards could range from zero to a maximum of 7,900,613 (2014: 6,574,650) restricted shares.
SEMBCORP INDUSTRIES ANNUAL REPORT 2015 173172 BUILDING THE FUTURE

DIRECTORS’ STATEMENTYear ended December 31, 2015
Share-based Incentive Plans (cont’d)
c. Restricted Share Plan (cont’d)
i. Sembcorp Industries Ltd Restricted Shares (cont’d)
Sembcorp Challenge BonusWith the Committee’s approval on the achievement factor for the achievement of the performance targets for the performance period 2013 to 2014 (2014: performance period 2012 to 2013), a total of S$1,792,563, equivalent to 375,838 (2014: S$3,346,469 equivalent to 558,210) notional restricted shares, were paid. A total of 440,000 (2014: 450,000) notional restricted shares of Sembcorp Industries Ltd’s shares were awarded in 2015 for the Sembcorp Challenge Bonus.
The total number of notional restricted shares in awards for the Sembcorp Challenge Bonus granted conditionally and representing 100% of targets to be achieved, but not released as at end 2015, was 890,000 (2014: 850,000). Based on the multiplying factor, the number of notional restricted shares to be converted into the funding pool could range from zero to a maximum of 1,335,000 (2014: 1,275,000).
ii. Restricted shares of a listed subsidiaryThe details of the movement of the restricted shares of Sembcorp Marine Ltd awarded during the year are as follows:
Movements during the year
Additional
conditional
restricted
Conditional shares awarded Conditional Conditional
Restricted shares restricted arising from restricted restricted
participants At Jan 1 shares awarded targets met shares released shares lapsed At Dec 31
2015 Directors of the Company: Tang Kin Fei – 22,800 – (22,800) – – Tan Sri Mohd Hassan Marican – 50,100 – (50,100) – – Ajaib Haridass – 25,900 – (25,900) – – Other participants 8,262,801 5,031,701 198,159 (2,970,120) (420,956) 10,101,585 8,262,801 5,130,501 198,159 (3,068,920) (420,956) 10,101,585
2014 Directors of the Company: Tang Kin Fei – 16,500 – (16,500) – – Tan Sri Mohd Hassan Marican – 18,700 – (18,700) – – Ajaib Haridass – 18,200 – (18,200) – – Other participants 8,545,150 2,996,580 508,977 (3,504,178) (283,728) 8,262,801 8,545,150 3,049,980 508,977 (3,557,578) (283,728) 8,262,801
With the Sembcorp Marine Ltd’s committee’s approval on the achievement factor for the achievement of the performance targets for the performance period 2013 to 2014, a total of 1,013,899 restricted shares were released in 2015. For awards in relation to the performance period 2012 to 2013, a total of 950,779 (2014: 1,154,566) restricted shares were released in 2015. For awards in relation to the performance period 2011 to 2012, a total of 945,042 (2014: 1,074,512) restricted shares were released in 2015. For awards in relation to the performance period 2010 to 2011, no restricted shares were released in 2015 (2014: 1,232,100). In 2015, there were 159,200 (2014: 96,400) restricted shares released to non-executive directors. The restricted shares were released via the issuance of treasury shares.
In 2015, additional 198,159 (2014: 508,977) Sembcorp Marine Ltd’s restricted shares were awarded for the over-achievement of the performance targets for the performance period 2013 to 2014 (2014: performance period 2012 to 2013).
Share-based Incentive Plans (cont’d)
c. Restricted Share Plan (cont’d)
ii. Restricted shares of a listed subsidiary (cont’d)
The total number of Sembcorp Marine Ltd’s restricted shares outstanding, including awards achieved but not released, as at December 31, 2015, was 10,101,585 (2014: 8,262,801). Of this, the total number of restricted shares in awards granted conditionally and representing 100% of targets to be achieved, but not released was 7,623,701 (2014: 5,450,570). Based on the multiplying factor, the actual release of the awards could range from zero to a maximum of 11,435,552 (2014: 8,175,855) restricted shares.
Challenge Bonus of a listed subsidiaryWith the Sembcorp Marine Ltd’s committee’s approval on the achievement factor for the achievement of the performance targets for the performance period 2013 to 2014 (2014: performance period 2012 to 2013), a total of S$2,849,108 (2014: S$4,122,758), equivalent to 942,290 (2014: 1,010,480) notional restricted shares, were paid.
A total of 2,140,509 (2014: 1,223,280) notional restricted shares were awarded on May 27, 2015 (2014: June 15, 2014) for the Sembcorp Marine Challenge Bonus.
The total number of notional restricted shares in awards for the Sembcorp Marine Challenge Bonus granted conditionally and representing 100% of targets to be achieved, but not released as at December 31, 2015, was 3,070,668 (2014: 2,066,240). Based on the multiplying factor, the number of notional restricted shares to be converted into the funding pool could range from zero to a maximum of 4,606,002 (2014: 3,099,360).
d. Maximum Number of Shares IssuableThe maximum number of performance shares and restricted shares which could be delivered, when aggregated with the number of new shares issued and issuable in respect of all options granted, is within the 15% limit of the share capital of the Company on the day preceding the relevant date of the grant.
Audit CommitteeThe members of the Audit Committee during the year and at the date of this report are:
Bobby Chin Yoke Choong (Chairman)Tham Kui SengDr Teh Kok PengAjaib Haridass (appointed on April 22, 2015)
The Audit Committee held four meetings during the financial year. In performing its functions, the Audit Committee met with the Company’s external and internal auditors to discuss the scope of their work, the results of their examination and evaluation of the Company’s internal accounting control system.
The Audit Committee performed the functions specified in Section 201B of the Singapore Companies Act, Chapter 50, the Listing Manual of the Singapore Exchange, and the Code of Corporate Governance.
The Audit Committee also reviewed the following:
• assistance provided by the Company’s officers to the external and internal auditors;
• quarterly financial information and annual financial statements of the Group and the Company prior to their submission to the directors of the Company for adoption; and
• interested person transactions (as defined in Chapter 9 of the Listing Manual of the Singapore Exchange).
SEMBCORP INDUSTRIES ANNUAL REPORT 2015 175174 BUILDING THE FUTURE

DIRECTORS’ STATEMENTYear ended December 31, 2015
INDEPENDENT AUDITORS’ REPORTYear ended December 31, 2015
Audit Committee (cont’d)
The Audit Committee has full access to the management and is given the resources required for it to discharge its functions. It has full authority and the discretion to invite any director or executive officer to attend its meetings. The Audit Committee also recommends the appointment of the external auditors and reviews the level of audit and non-audit fees.
The Audit Committee is satisfied with the independence and objectivity of the external auditors and has recommended to the Board of Directors that the auditors, KPMG LLP, be nominated for re-appointment as auditors at the forthcoming Annual General Meeting of the Company.
In appointing our auditors for the Company, subsidiaries and significant associated companies, we have complied with Rules 712 and 715 of the SGX Listing Manual.
AuditorsThe auditors, KPMG LLP, have indicated their willingness to accept re-appointment.
On behalf of the Board of Directors
Ang Kong Hua Tang Kin Fei Chairman Director
Singapore February 17, 2016
Members of the CompanySembcorp Industries Ltd
Report on the financial statementsWe have audited the accompanying financial statements of Sembcorp Industries Ltd (the “Company”) and its subsidiaries (the “Group”), which comprise the balance sheets of the Group and the Company as at December 31, 2015, the income statement, statement of comprehensive income, statement of changes in equity and statement of cash flows of the Group for the year then ended, and a summary of significant accounting policies and other explanatory information, as set out on pages 178 to 333.
Management’s responsibility for the financial statementsManagement is responsible for the preparation of financial statements that give a true and fair view in accordance with the provisions of the Singapore Companies Act, Chapter 50 (the “Act”) and Singapore Financial Reporting Standards, and for devising and maintaining a system of internal accounting controls sufficient to provide a reasonable assurance that assets are safeguarded against loss from unauthorised use or disposition; and transactions are properly authorised and that they are recorded as necessary to permit the preparation of true and fair financial statements and to maintain accountability of assets.
Auditors’ responsibilityOur responsibility is to express an opinion on these financial statements based on our audit. We conducted our audit in accordance with Singapore Standards on Auditing. Those standards require that we comply with ethical requirements and plan and perform the audit to obtain reasonable assurance about whether the financial statements are free from material misstatement.
An audit involves performing procedures to obtain audit evidence about the amounts and disclosures in the financial statements. The procedures selected depend on the auditor’s judgement, including the assessment of the risks of material misstatement of the financial statements, whether due to fraud or error. In making those risk assessments, the auditor considers internal control relevant to the entity’s preparation of the financial statements that give a true and fair view in order to design audit procedures that are appropriate in the circumstances, but not for the purpose of expressing an opinion on the effectiveness of the entity’s internal control. An audit also includes evaluating the appropriateness of accounting policies used and the reasonableness of accounting estimates made by management, as well as evaluating the overall presentation of the financial statements.
We believe that the audit evidence we have obtained is sufficient and appropriate to provide a basis for our audit opinion.
OpinionIn our opinion, the consolidated financial statements of the Group and the balance sheet of the Company are properly drawn up in accordance with the provisions of the Act and Singapore Financial Reporting Standards so as to give a true and fair view of the financial position of the Group and of the Company as at December 31, 2015, and the financial performance, changes in equity and cash flows of the Group for the year ended on that date.
Report on other legal and regulatory requirementsIn our opinion, the accounting and other records required by the Act to be kept by the Company and by those subsidiary corporations incorporated in Singapore of which we are the auditors have been properly kept in accordance with the provisions of the Act.
KPMG LLP Public Accountants and Chartered Accountants
Singapore February 17, 2016
SEMBCORP INDUSTRIES ANNUAL REPORT 2015 177176 BUILDING THE FUTURE
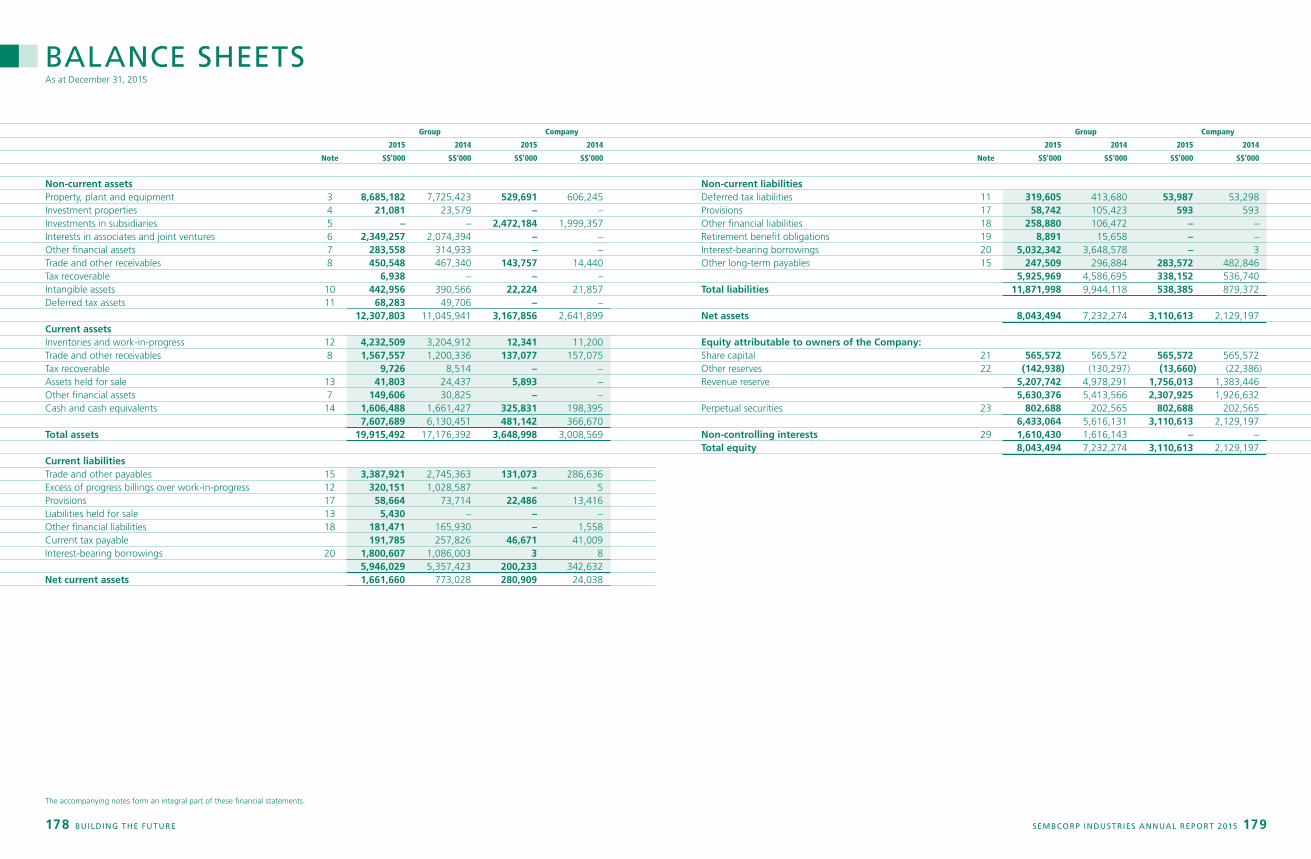
BALANCE SHEETSAs at December 31, 2015
Group Company
2015 2014 2015 2014
Note S$’000 S$’000 S$’000 S$’000
Non-current assets Property, plant and equipment 3 8,685,182 7,725,423 529,691 606,245 Investment properties 4 21,081 23,579 – – Investments in subsidiaries 5 – – 2,472,184 1,999,357 Interests in associates and joint ventures 6 2,349,257 2,074,394 – – Other financial assets 7 283,558 314,933 – – Trade and other receivables 8 450,548 467,340 143,757 14,440 Tax recoverable 6,938 – – – Intangible assets 10 442,956 390,566 22,224 21,857 Deferred tax assets 11 68,283 49,706 – – 12,307,803 11,045,941 3,167,856 2,641,899 Current assets Inventories and work-in-progress 12 4,232,509 3,204,912 12,341 11,200 Trade and other receivables 8 1,567,557 1,200,336 137,077 157,075 Tax recoverable 9,726 8,514 – – Assets held for sale 13 41,803 24,437 5,893 – Other financial assets 7 149,606 30,825 – – Cash and cash equivalents 14 1,606,488 1,661,427 325,831 198,395 7,607,689 6,130,451 481,142 366,670Total assets 19,915,492 17,176,392 3,648,998 3,008,569 Current liabilities Trade and other payables 15 3,387,921 2,745,363 131,073 286,636 Excess of progress billings over work-in-progress 12 320,151 1,028,587 – 5 Provisions 17 58,664 73,714 22,486 13,416 Liabilities held for sale 13 5,430 – – – Other financial liabilities 18 181,471 165,930 – 1,558 Current tax payable 191,785 257,826 46,671 41,009 Interest-bearing borrowings 20 1,800,607 1,086,003 3 8 5,946,029 5,357,423 200,233 342,632Net current assets 1,661,660 773,028 280,909 24,038
Group Company
2015 2014 2015 2014
Note S$’000 S$’000 S$’000 S$’000
Non-current liabilities Deferred tax liabilities 11 319,605 413,680 53,987 53,298 Provisions 17 58,742 105,423 593 593 Other financial liabilities 18 258,880 106,472 – – Retirement benefit obligations 19 8,891 15,658 – – Interest-bearing borrowings 20 5,032,342 3,648,578 – 3 Other long-term payables 15 247,509 296,884 283,572 482,846 5,925,969 4,586,695 338,152 536,740Total liabilities 11,871,998 9,944,118 538,385 879,372
Net assets 8,043,494 7,232,274 3,110,613 2,129,197
Equity attributable to owners of the Company: Share capital 21 565,572 565,572 565,572 565,572 Other reserves 22 (142,938) (130,297) (13,660) (22,386) Revenue reserve 5,207,742 4,978,291 1,756,013 1,383,446 5,630,376 5,413,566 2,307,925 1,926,632 Perpetual securities 23 802,688 202,565 802,688 202,565 6,433,064 5,616,131 3,110,613 2,129,197 Non-controlling interests 29 1,610,430 1,616,143 – –Total equity 8,043,494 7,232,274 3,110,613 2,129,197
The accompanying notes form an integral part of these financial statements.
SEMBCORP INDUSTRIES ANNUAL REPORT 2015 179178 BUILDING THE FUTURE

CONSOLIDATED INCOME STATEMENTYear ended December 31, 2015
Group
2015 2014
Note S$’000 S$’000
Turnover 25 9,544,621 10,894,660 Cost of sales (8,812,960) (9,479,983)Gross profit 731,661 1,414,677 General and administrative expenses (524,373) (352,486) Other income 531,950 103,611 Other expense (net) (113,959) (26,924) Finance income 26 32,856 19,431 Finance costs 26 (237,984) (70,132) Share of results of associates and joint ventures, net of tax 6,199 158,261Profit before tax 426,350 1,246,438 Tax credit / (expense) 27 28,052 (162,156)Profit for the year 28 454,402 1,084,282
Profit attributable to: Owners of the Company 548,855 801,096 Non-controlling interests (94,453) 283,186Profit for the year 454,402 1,084,282
Earnings per share (cents): 30 Basic 29.17 44.31 Diluted 28.95 43.98
CONSOLIDATED STATEMENT OF COMPREHENSIVE INCOMEYear ended December 31, 2015
Group
2015 2014
Note S$’000 S$’000
Profit for the year 454,402 1,084,282
Other comprehensive income Items that may be reclassified subsequently to profit or loss: Foreign currency translation differences for foreign operations 116,765 129,982 Exchange differences on monetary items forming part of net investment in foreign operation 765 (2,280) Net change in fair value of cash flow hedges (77,122) (147,973) Net change in fair value of cash flow hedges reclassified to profit or loss 113,230 18,873 Net change in fair value of available-for-sale financial assets (2,940) (33,572) Net change in fair value of available-for-sale financial assets reclassified to profit or loss 51,569 – Share of other comprehensive income of associates and joint ventures (23,835) (8,654) 178,432 (43,624) Items that may not be reclassified subsequently to profit or loss: Defined benefit plan actuarial gains and losses (6,229) 16,776 Other comprehensive income for the year, net of tax 24 172,203 (26,848)Total comprehensive income for the year 626,605 1,057,434
Total comprehensive income attributable to: Owners of the Company 684,792 766,663 Non-controlling interests (58,187) 290,771Total comprehensive income for the year 626,605 1,057,434
The accompanying notes form an integral part of these financial statements. The accompanying notes form an integral part of these financial statements.
SEMBCORP INDUSTRIES ANNUAL REPORT 2015 181180 BUILDING THE FUTURE

CONSOLIDATED STATEMENT OF CHANGES IN EQUITYYear ended December 31, 2015
Attributable to owners of the Company
Currency Share-based Non-
Share Reserve for translation Capital Merger payments Fair value Hedging Revenue Perpetual controlling Total
capital own shares reserve reserve reserve reserve reserve reserve reserve Total securities Total interests equity
Group S$’000 S$’000 S$’000 S$’000 S$’000 S$’000 S$’000 S$’000 S$’000 S$’000 S$’000 S$’000 S$’000 S$’000
At January 1, 2015 565,572 (15,041) (200,461) 304,009 29,201 (18,561) (11,958) (217,486) 4,978,291 5,413,566 202,565 5,616,131 1,616,143 7,232,274 Total comprehensive income for the year Profit for the year – – – – – – – – 548,855 548,855 – 548,855 (94,453) 454,402 Other comprehensive income Foreign currency translation differences for foreign operations – – 87,742 – – – – – – 87,742 – 87,742 29,023 116,765 Exchange differences on monetary items forming part of net investment in foreign operation – – 765 – – – – – – 765 – 765 – 765 Net change in fair value of cash flow hedges – – – – – – – (68,447) – (68,447) – (68,447) (8,675) (77,122) Net change in fair value of cash flow hedges reclassified to profit or loss – – – – – – – 106,481 – 106,481 – 106,481 6,749 113,230 Net change in fair value of available-for-sale financial assets – – – – – – (5,564) – – (5,564) – (5,564) 2,624 (2,940) Net change in fair value of available-for-sale financial assets reclassified to profit or loss – – – – – – 44,920 – – 44,920 – 44,920 6,649 51,569 Defined benefit plan actuarial gains and losses – – – – – – – – (6,125) (6,125) – (6,125) (104) (6,229) Share of other comprehensive income of associates and joint ventures – – – – – – – (23,835) – (23,835) – (23,835) – (23,835)Total other comprehensive income for the year – – 88,507 – – – 39,356 14,199 (6,125) 135,937 – 135,937 36,266 172,203 Total comprehensive income for the year – – 88,507 – – – 39,356 14,199 542,730 684,792 – 684,792 (58,187) 626,605
The accompanying notes form an integral part of these financial statements.
SEMBCORP INDUSTRIES ANNUAL REPORT 2015 183182 BUILDING THE FUTURE

CONSOLIDATED STATEMENT OF CHANGES IN EQUITYYear ended December 31, 2015
Attributable to owners of the Company
Currency Share-based Non-
Share Reserve for translation Capital Merger payments Fair value Hedging Revenue Perpetual controlling Total
capital own shares reserve reserve reserve reserve reserve reserve reserve Total securities Total interests equity
Group S$’000 S$’000 S$’000 S$’000 S$’000 S$’000 S$’000 S$’000 S$’000 S$’000 S$’000 S$’000 S$’000 S$’000
Transactions with owners of the Company, recognised directly in equity Contribution by non-controlling interests – – – – – – – – – – – – 46,757 46,757 Issue of perpetual securities – – – – – – – – – – 596,551 596,551 – 596,551 Share-based payments – – – – – 19,278 – – – 19,278 – 19,278 3,616 22,894 Purchase of treasury shares – (6,809) – – – – – – – (6,809) – (6,809) – (6,809) Treasury shares transferred to employees – 13,205 – – – (12,667) – – – 538 – 538 – 538 Treasury shares of a subsidiary – – – (875) – (6,100) – – – (6,975) – (6,975) (4,457) (11,432) Non-controlling interests of subsidiary acquired (Note 34(b)) – – – – – – – – – – – – 140,147 140,147 Acquisition of non-controlling interests – – – 4,745 – – – – – 4,745 – 4,745 (12,723) (7,978) Put liability to acquire non-controlling interests – – – (193,113) – – – – – (193,113) – (193,113) – (193,113) Realisation of reserve upon disposal of associate – – 17,116 – – – – – – 17,116 – 17,116 – 17,116 Realisation of reserve upon disposal of subsidiaries – – 10,406 – – – – – – 10,406 – 10,406 8,457 18,863 Realisation of reserve upon liquidation of subsidiary – – 111 – – – – – – 111 – 111 – 111 Perpetual securities distribution paid – – – – – – – – – – (24,367) (24,367) – (24,367) Accrued perpetual securities distribution (Note 23) – – – – – – – – (27,939) (27,939) 27,939 – – – Dividend paid to owners (Note 31) – – – – – – – – (285,866) (285,866) – (285,866) – (285,866) Dividend paid to non-controlling interests – – – – – – – – – – – – (129,323) (129,323) Unclaimed dividends – – – – – – – – 526 526 – 526 – 526Total transactions with owners – 6,396 27,633 (189,243) – 511 – – (313,279) (467,982) 600,123 132,141 52,474 184,615At December 31, 2015 565,572 (8,645) (84,321) 114,766 29,201 (18,050) 27,398 (203,287) 5,207,742 5,630,376 802,688 6,433,064 1,610,430 8,043,494
The accompanying notes form an integral part of these financial statements.
SEMBCORP INDUSTRIES ANNUAL REPORT 2015 185184 BUILDING THE FUTURE

CONSOLIDATED STATEMENT OF CHANGES IN EQUITYYear ended December 31, 2015
Attributable to owners of the Company
Currency Share-based Non-
Share Reserve for translation Capital Merger payments Fair value Hedging Revenue Perpetual controlling Total
capital own shares reserve reserve reserve reserve reserve reserve reserve Total securities Total interests equity
Group S$’000 S$’000 S$’000 S$’000 S$’000 S$’000 S$’000 S$’000 S$’000 S$’000 S$’000 S$’000 S$’000 S$’000
At January 1, 2014 565,572 (13,877) (333,798) 313,875 29,201 (14,661) 13,063 (95,033) 4,563,136 5,027,478 202,970 5,230,448 1,299,546 6,529,994 Total comprehensive income for the year Profit for the year – – – – – – – – 801,096 801,096 – 801,096 283,186 1,084,282 Other comprehensive income Foreign currency translation differences for foreign operations – – 98,545 – – – – – – 98,545 – 98,545 31,437 129,982 Exchange differences on monetary items forming part of net investment in foreign operation – – (2,280) – – – – – – (2,280) – (2,280) – (2,280) Net change in fair value of cash flow hedges – – – – – – – (132,702) – (132,702) – (132,702) (15,271) (147,973) Net change in fair value of cash flow hedges reclassified to profit or loss – – – – – – – 18,868 – 18,868 – 18,868 5 18,873 Net change in fair value of available-for-sale financial assets – – – – – – (24,986) – – (24,986) – (24,986) (8,586) (33,572) Defined benefit plan actuarial gains and losses – – – – – – – – 16,776 16,776 – 16,776 – 16,776 Share of other comprehensive income of associates and joint ventures – – – – – – (35) (8,619) – (8,654) – (8,654) – (8,654)Total other comprehensive income for the year – – 96,265 – – – (25,021) (122,453) 16,776 (34,433) – (34,433) 7,585 (26,848) Total comprehensive income for the year – – 96,265 – – – (25,021) (122,453) 817,872 766,663 – 766,663 290,771 1,057,434
The accompanying notes form an integral part of these financial statements.
SEMBCORP INDUSTRIES ANNUAL REPORT 2015 187186 BUILDING THE FUTURE

CONSOLIDATED STATEMENT OF CHANGES IN EQUITYYear ended December 31, 2015
Attributable to owners of the Company
Currency Share-based Non-
Share Reserve for translation Capital Merger payments Fair value Hedging Revenue Perpetual controlling Total
capital own shares reserve reserve reserve reserve reserve reserve reserve Total securities Total interests equity
Group S$’000 S$’000 S$’000 S$’000 S$’000 S$’000 S$’000 S$’000 S$’000 S$’000 S$’000 S$’000 S$’000 S$’000
Transactions with owners of the Company, recognised directly in equity Contribution by non-controlling interests – – – – – – – – – – – – 1,723 1,723 Share-based payments – – – – – 24,899 – – – 24,899 – 24,899 4,799 29,698 Purchase of treasury shares – (20,886) – – – – – – – (20,886) – (20,886) – (20,886) Treasury shares transferred to employees – 19,722 – – – (18,499) – – – 1,223 – 1,223 – 1,223 Treasury shares of a subsidiary – – – 3,686 – (10,300) – – – (6,614) – (6,614) (4,229) (10,843) Non-controlling interests of subsidiary acquired (Note 34(b)) – – – – – – – – – – – – 186,942 186,942 Acquisition of non-controlling interests – – – (13,552) – – – – – (13,552) – (13,552) (12,625) (26,177) Realisation of reserve when a joint venture became a subsidiary (Note 34(b)) – – 37,178 – – – – – – 37,178 – 37,178 – 37,178 Reduction of non-controlling interests upon sale of investment for sale – – – – – – – – – – – – (4,830) (4,830) Realisation of reserve upon liquidation of subsidiaries – – (106) – – – – – – (106) – (106) – (106) Perpetual securities distribution paid – – – – – – – – – – (10,000) (10,000) – (10,000) Accrued perpetual securities distribution (Note 23) – – – – – – – – (9,595) (9,595) 9,595 – – – Dividend paid to owners (Note 31) – – – – – – – – (393,124) (393,124) – (393,124) – (393,124) Dividend paid to non-controlling interests – – – – – – – – – – – – (145,954) (145,954) Unclaimed dividends – – – – – – – – 2 2 – 2 – 2Total transactions with owners – (1,164) 37,072 (9,866) – (3,900) – – (402,717) (380,575) (405) (380,980) 25,826 (355,154)At December 31, 2014 565,572 (15,041) (200,461) 304,009 29,201 (18,561) (11,958) (217,486) 4,978,291 5,413,566 202,565 5,616,131 1,616,143 7,232,274
The accompanying notes form an integral part of these financial statements.
SEMBCORP INDUSTRIES ANNUAL REPORT 2015 189188 BUILDING THE FUTURE

CONSOLIDATED STATEMENT OF CASH FLOWSYear ended December 31, 2015
Group
2015 2014
S$’000 S$’000
Cash flows from operating activities Profit for the year 454,402 1,084,282 Adjustments for: Dividend (1,026) (1,194) Finance income (32,856) (19,431) Finance costs 237,984 70,132 Depreciation and amortisation 404,961 314,834 Share of results of associates and joint ventures, net of tax (6,199) (158,261) Gain on disposal of property, plant and equipment and other financial assets (3,114) (4,150) Loss on disposal of intangible assets 9 3 Gain on disposal of investment properties (2,983) (3,097) Gain on disposal of investment in subsidiaries and an associate (425,566) – Fair value gain on re-measurement of pre-existing equity interest in a joint venture, which became a subsidiary – (3,792) Changes in fair value of financial instruments 42,126 11,225 Equity settled share-based compensation expenses 22,894 29,698 Allowance made for impairment loss in value of assets and assets written off (net) 125,364 7,024 Gain on acquisition – (13,505) Allowance for / (Write-back of) doubtful debts 198,223 (1,516) Bad debts written off 3,247 750 Work-in-progress written-down 85,518 – Provision for foreseeable losses on construction work-in-progress 277,961 – Tax (refund) / expense (Note 27) (28,052) 162,156 Operating profit before working capital changes 1,352,893 1,475,168 Changes in working capital: Inventories and work-in-progress (2,101,118) (1,383,998) Receivables (455,306) 44,414 Payables 649,458 2,652 (554,073) 138,226 Tax paid (149,760) (118,979) Net cash (used in) / from operating activities (703,833) 19,247
Group
2015 2014
S$’000 S$’000
Cash flows from investing activities Dividend received 59,547 101,958 Interest received 29,659 19,840 Proceeds from disposal of interests in subsidiaries, net of cash disposed of (Note 33) 204,173 1 Proceeds from capital reduction in a joint venture – 4,135 Proceeds from sale of investment held for sale – 7,250 Proceeds from disposal of interests in an associate 487,929 – Proceeds from sale of property, plant and equipment 2,639 7,983 Proceeds from sale of investment properties 9,983 4,031 Proceeds from sale of intangible assets 48 14 Proceeds from disposal of other financial assets 169,767 – Loan repayment from related parties 14,687 6,283 Loan to related parties (26,351) (32,631) Non-trade balances with related corporations and external parties, net of repayment 15,512 (50,315) Acquisition of subsidiary, net of cash acquired (Note 34) (213,636) 61,741 Acquisition of / additional investments in associates and joint ventures (426,961) (303,203) Acquisition of other financial assets (165,979) (7,341) Purchase of property, plant and equipment and investment property (Note (a)) (1,423,288) (1,306,419) Payment for intangible assets (8,872) (31,423) Cash balances transferred to assets held for sale (6,249) – Net cash used in investing activities (1,277,392) (1,518,096)
The accompanying notes form an integral part of these financial statements.
SEMBCORP INDUSTRIES ANNUAL REPORT 2015 191190 BUILDING THE FUTURE

CONSOLIDATED STATEMENT OF CASH FLOWSYear ended December 31, 2015
NOTES TO THE FINANCIAL STATEMENTSYear ended December 31, 2015
These notes form an integral part of the financial statements.
The financial statements were authorised for issue by the Board of Directors on February 17, 2016.
1. Domicile and ActivitiesSembcorp Industries Ltd (the “Company”) is a company incorporated in the Republic of Singapore and has its registered office at 30 Hill Street #05-04, Singapore 179360.
With the adoption of FRS110 on January 1, 2014, the Company has been assessed to be a subsidiary of Temasek Holdings (Private) Limited, a company incorporated in the Republic of Singapore. As such, the Company’s immediate and ultimate holding company is Temasek Holdings (Private) Limited.
The financial statements comprise the Company and its subsidiaries (together referred to as the “Group” and individually as “Group entities”) and the Group’s interests in associates, joint ventures and joint operations.
The principal activities of the Company include:
a. investment holding, as well as the corporate headquarter which gives strategic direction and provides management services to its subsidiaries; and
b. production and supply of utilities services, terminalling and storage of petroleum products and chemicals.
The principal activities of key subsidiaries are as follows:
i. UtilitiesThe Utilities segment’s principal activities are in the provision of energy, water, on-site logistics and solid waste management to industrial and municipal customers. Key activities in the energy sector include power generation and retail, process steam production and supply, as well as natural gas import, supply and retail. In the water sector, the business offers wastewater treatment as well as the production and supply of reclaimed, desalinated and potable water and water for industrial use;
ii. MarineThe Marine segment focuses principally on providing integrated solutions for the marine and offshore industry. Key capabilities include rigs & floaters; repairs & upgrades; offshore platforms and specialised shipbuilding;
iii. Urban DevelopmentThe Urban Development segment owns, develops, markets and manages integrated urban developments comprising industrial parks as well as business, commercial and residential space in Asia; and
iv. Others / CorporateOthers / Corporate segment comprises businesses mainly relating to minting, design and construction activities, offshore engineering and others.
Group
2015 2014
S$’000 S$’000
Cash flows from financing activities Proceeds from share issue to non-controlling interests of subsidiaries 4,549 1,723 Proceeds from share options exercised with issue of treasury shares 538 1,223 Proceeds from share options exercised with issue of treasury shares of a subsidiary 861 736 Purchase of treasury shares (6,809) (20,886) Purchase of treasury shares by a subsidiary (12,293) (11,579) Proceeds from issue of perpetual securities, net of transaction costs 596,551 – Proceeds from borrowings 2,773,318 2,292,133 Repayment of borrowings (779,852) (720,900) Payment on finance leases (4,073) (4,131) Acquisition of non-controlling interests (4) (26,177) Dividends paid to owners of the Company (285,866) (393,124) Dividends paid to non-controlling interests of subsidiaries (129,323) (145,954) Perpetual securities distribution paid (24,367) (10,000) Unclaimed dividends 526 2 Interest paid (222,171) (62,426) Net cash from financing activities 1,911,585 900,640 Net decrease in cash and cash equivalents (69,640) (598,209) Cash and cash equivalents at beginning of the year 1,659,434 2,255,865 Effect of exchange rate changes on balances held in foreign currency 14,671 1,778Cash and cash equivalents at end of the year (Note 14) 1,604,465 1,659,434
a. During the year, the Group acquired property, plant and equipment with an aggregate cost of S$1,439,405,000 (2014: S$1,276,418,000) of which S$392,000 (2014: S$604,000) was acquired by means of finance lease, S$nil (2014: S$31,479,000) relates to net payment on prior year’s accrued capital expenditure, S$16,034,000 (2014: S$nil) relates to other accrued capital expenditure and S$2,752,000 (2014: S$84,000) relates to provision for restoration costs as disclosed in Note 17.
The accompanying notes form an integral part of these financial statements.
SEMBCORP INDUSTRIES ANNUAL REPORT 2015 193192 BUILDING THE FUTURE

NOTES TO THE FINANCIAL STATEMENTSYear ended December 31, 2015
2. Summary of Significant Accounting Policiesa. Basis of Preparation
The financial statements are prepared in accordance with Singapore Financial Reporting Standards (FRS).
The financial statements are presented in Singapore dollar which is the Company’s functional currency. The financial statements have been prepared on the historical cost basis except as otherwise described in the accounting policies below.
The preparation of the financial statements in conformity with FRS requires management to make judgements, estimates and assumptions that affect the application of accounting policies and the reported amounts of assets, liabilities, income and expenses. Actual results may differ from these estimates.
Estimates and underlying assumptions are reviewed on an ongoing basis. Revisions to accounting estimates are recognised in the period in which the estimates are revised and in any future periods affected.
Information about significant areas of estimation uncertainty and critical judgements in applying accounting policies that have the most significant effect on the amounts recognised in the financial statements is discussed in Note 40.
With effect from January 1, 2015, the Group adopted the new or revised FRS that are mandatory for application from that date. The adoption of these new or revised FRS did not have any significant impact on the financial statements.
The accounting policies set out below have been applied consistently by Group entities to all periods presented in these financial statements.
b. Consolidationi. Business Combinations
Acquisitions on or after January 1, 2010Business combinations are accounted for using the acquisition method as at the acquisition date, which is the date on which control is transferred to the Group. Control is the power to govern the financial and operating policies of an entity so as to obtain benefits from its activities. In assessing control, the Group takes into consideration potential voting rights that are currently exercisable.
Deferred consideration comprises obligations to pay specific amounts at future dates. Deferred consideration is recognised and measured at fair value at the acquisition date and included in the consideration transferred. The unwinding of any interest element of deferred consideration is recognised in profit or loss.
The consideration transferred does not include amounts related to the settlement of pre-existing relationships. Such amounts are generally recognised in profit or loss.
Costs related to the acquisition, other than those associated with the issue of debt or equity securities, that the Group incurs in connection with a business combination are expensed as incurred.
Any contingent consideration payable is recognised at fair value at the acquisition date and included in the consideration transferred. If the contingent consideration is classified as equity, it is not re-measured and settlement is accounted for within equity. Otherwise, subsequent changes to the fair value of the contingent consideration are recognised in profit or loss.
2. Summary of Significant Accounting Policies (cont’d)
b. Consolidation (cont’d)
i. Business Combinations (cont’d)
Acquisitions between January 1, 2004 and December 31, 2009For acquisitions between January 1, 2004 and December 31, 2009, business combinations are accounted for using the purchase method, upon the adoption of FRS 103. Under the purchase method, the cost of an acquisition is measured at the fair value of the assets given, equity instruments issued and liabilities incurred or assumed at the date of exchange, plus costs directly attributable to the acquisition. The excess of the Group’s interest in the net fair value of the identifiable assets, liabilities and contingent liabilities over the cost of acquisition is credited to profit or loss in the period of the acquisition.
Acquisitions prior to January 1, 2004Prior to January 1, 2004, business combinations were accounted for either by the purchase method, or if they were between entities under common control, by the historical cost method similar to the pooling-of-interest method.
ii. Put Option with Non-controlling InterestsWhen an entity within the Group writes a put option with the non-controlling shareholders as part of the acquisition of a subsidiary for settlement in cash or in another financial asset, a put liability is recognised for the present value of the exercise price of the option. This creates an obligation or potential obligation for the entity to purchase its subsidiary’s instruments (constitutes the Group’s own equity in the consolidated financial statements) for cash or another financial asset.
When the non-controlling shareholders still have present access to the returns associated with the underlying ownership interests, the Group has chosen an accounting policy that the non-controlling shareholders continue to be recognised. Therefore, the present value of the option is recognised in equity. Subsequent to initial recognition of the financial liability, changes in the carrying amount of the financial liability is recognised within equity.
If the put option expires unexercised, then the charge to equity will be reversed and the financial liability will be derecognised. If the put option is exercised, then the charge to equity will be reversed and the financial liability will be derecognised and acquisition accounting will be applied.
At the entity level, the put option shall be accounted as embedded derivatives.
iii. Non-controlling InterestsFor non-controlling interests that are present ownership interests and entitle their holders to a proportionate share of the acquiree’s net assets in the event of liquidation, the Group elects on a transaction-by-transaction basis whether to measure them at fair value, or at the non-controlling interests’ proportionate share of the recognised amounts of the acquiree’s identifiable net assets, at the acquisition date. All other non-controlling interests are measured at acquisition-date fair value, unless another measurement basis is required by FRSs.
Changes in the Group’s interest in a subsidiary that do not result in a loss of control are accounted for as transactions with owners in their own capacity as owners and therefore no adjustments are made to goodwill and no gain or loss is recognised in profit or loss.
Adjustments to non-controlling interests arising from transactions that do not involve the loss of control are based on a proportionate amount of net assets of the subsidiary.
Prior to January 1, 2010, goodwill was recognised on the acquisition of non-controlling interests in a subsidiary, which represented the excess of the cost of the additional investment over the carrying amount of the interest in the net assets acquired at the date of the transaction.
SEMBCORP INDUSTRIES ANNUAL REPORT 2015 195194 BUILDING THE FUTURE

NOTES TO THE FINANCIAL STATEMENTSYear ended December 31, 2015
2. Summary of Significant Accounting Policies (cont’d)
b. Consolidation (cont’d)
iv. SubsidiariesSubsidiaries are those entities that are controlled by the Group. The Group controls an entity when it is exposed to, or has rights to, variable returns from its involvement with the entity and has the ability to affect those returns through its power over the entity.
The financial statements of subsidiaries are included in the consolidated financial statements from the date that control commences until the date control ceases. The accounting policies of subsidiaries have been changed when necessary to align them with the policies adopted by the Group.
Non-controlling interests are that part of the net results of operations and of net assets of a subsidiary attributable to the interests which are not owned directly or indirectly by the equity holders of the Company. They are shown separately in the consolidated statement of comprehensive income, statement of changes in equity and balance sheet. Total comprehensive income is attributed to the non-controlling interests based on their respective interests in a subsidiary even if this results in the non-controlling interests having a deficit balance.
v. Acquisitions from Entities under Common ControlBusiness combinations that involve entities under common control are excluded from the scope of FRS 103. Such combinations are accounted at historical cost in a manner similar to the pooling-of-interest method, in the preparation of the consolidated financial statements. Under this method of accounting, the difference between the value of the share capital issued and the value of shares received is taken to the merger reserve.
vi. Loss of ControlUpon the loss of control, the Group derecognises the assets and liabilities of the subsidiary, any non-controlling interests and the other components of equity related to the subsidiary. Any surplus or deficit arising on the loss of control is recognised in profit or loss. If the Group retains any interest in the previous subsidiary, then such interest is measured at fair value at the date that control is lost. Subsequently, it is accounted for as an equity-accounted investee or as an available-for-sale financial asset depending on the level of influence retained.
vii. AssociatesAssociates are those entities in which the Group has significant influence, but not control or joint control, over the financial and operating policies of these entities.
The existence and effect of potential voting rights that are presently exercisable or presently convertible are considered when assessing whether the Group has significant influence over another entity. Significant influence is presumed to exist when the Group holds 20% or more of the voting power of another entity.
Associates are accounted for using the equity method of accounting from the date that significant influence commences until the date that significant influence ceases and are recognised initially at cost. The cost of investments includes transaction costs. When the Group’s share of losses exceeds its interest in an equity-accounted investee, the carrying amount of the investment (including any other unsecured receivables, that in substance, form part of the Group’s net investment in the associate) is reduced to zero, and the recognition of further losses is discontinued except to the extent that the Group has an obligation or made payments on its behalf to satisfy obligations of the associate that the Group has guaranteed or otherwise committed on behalf of.
The excess of the Group’s interest in the net fair value of the identifiable assets, liabilities and contingent liabilities over the cost of acquisition is credited to profit or loss in the period of the acquisition. Where the audited financial statements are not yet available for the purpose of statutory filing, the share of results is arrived at from management financial statements made up mainly to the end of the accounting year to December 31.
2. Summary of Significant Accounting Policies (cont’d)
b. Consolidation (cont’d)
viii. Joint ArrangementsJoint VenturesA joint venture is an arrangement in which the Group has joint control, whereby the Group has rights to the net assets of the arrangement.
The existence and effect of potential voting rights that are presently exercisable or presently convertible are considered when assessing whether the Group has joint control over the entity.
Joint ventures are accounted for using the equity method of accounting from the date that joint control commences until the date that joint control ceases.
The excess of the Group’s interest in the net fair value of the identifiable assets, liabilities and contingent liabilities over the cost of acquisition is credited to profit or loss in the period of the acquisition. Where the audited financial statements are not yet available for the purpose of statutory filing, the share of results is arrived at from management financial statements made up mainly to the end of the accounting year to December 31.
Joint OperationsA joint operation is an arrangement in which the Group has joint control whereby the Group has rights to the assets, and obligations for the liabilities, relating to an arrangement. The Group accounts for each of its assets, liabilities and transactions, including its share of those held or incurred jointly, in relation to the joint operation.
ix. Transactions Eliminated on ConsolidationAll intra-group balances, transactions, and unrealised income and expenses arising from intra-group transactions, are eliminated in preparing the consolidated financial statements. Unrealised gains arising from transactions with associates and joint ventures are eliminated against the investment to the extent of the Group’s interest in the investee. Unrealised losses are eliminated in the same way as unrealised gains, but only to the extent that there is no evidence of impairment.
x. Accounting for Subsidiaries, Associates and Joint VenturesInvestments in subsidiaries, associates and joint ventures are measured in the Company’s balance sheet at cost less accumulated impairment losses.
c. Foreign Currenciesi. Foreign Currency Transactions and Balances
Transactions in foreign currencies are translated into the respective functional currencies of Group entities at foreign exchange rates at the dates of the transactions. At each reporting date:
• Foreign currency monetary assets and liabilities are retranslated to the functional currency using foreign exchange rates at that date.
• Non-monetary assets and liabilities in a foreign currency that are measured in terms of historical cost are translated using exchange rate at the date of the transaction.
• Non-monetary assets and liabilities denominated in foreign currencies that are measured at fair value are retranslated to the functional currency at exchange rates at the date the fair value was determined.
Foreign currency differences arising from the settlement or from translation of monetary items are recognised in profit or loss.
SEMBCORP INDUSTRIES ANNUAL REPORT 2015 197196 BUILDING THE FUTURE

NOTES TO THE FINANCIAL STATEMENTSYear ended December 31, 2015
2. Summary of Significant Accounting Policies (cont’d)
c. Foreign Currencies (cont’d)
i. Foreign Currency Transactions and Balances (cont’d)
Foreign currency differences arising on retranslation are recognised directly in profit or loss, except for the following differences which are recognised in other comprehensive income arising on the retranslation of:
• Available-for-sale equity instruments (except on impairment in which case foreign currency differences that have been recognised in other comprehensive income are reclassified to profit or loss);
• A financial liability designated as a hedge of a net investment in a foreign operation to the extent that the hedge is effective; or
• Qualifying cash flow hedges to the extent the hedge is effective.
ii. Foreign OperationsThe results and financial positions of foreign operations (none of which has the currency of a hyperinflationary economy) that have a functional currency different from the presentation currency are translated into the presentation currency as follows:
• Assets and liabilities are translated at foreign exchange rates ruling at the date of the balance sheet.
• Revenues and expenses are translated at average foreign exchange rates.
• All resulting foreign exchange differences are taken to the foreign currency translation reserve in other comprehensive income.
Goodwill (except those relating to acquisitions of foreign operations prior to January 1, 2004) and fair value adjustments arising from the acquisition of foreign operations are translated to the presentation currency for consolidation at the rates of exchange ruling at the balance sheet date. Goodwill arising from the acquisition of foreign operations prior to January 1, 2004 are translated at foreign exchange rates ruling at the dates of the transactions.
Foreign currency differences are recognised in other comprehensive income, and presented in the foreign currency translation reserve (currency translation reserve) in equity. However, if the foreign operation is a non-wholly-owned subsidiary, then the relevant proportionate share of the translation difference is allocated to the non-controlling interests. When a foreign operation is disposed of such that control, significant influence or joint control is lost, the cumulative amount in the translation reserve related to that foreign operation is reclassified to profit or loss as part of the gain or loss on disposal. When the Group disposes of only part of its interest in a subsidiary that includes a foreign operation while retaining control, the relevant proportion of the cumulative amount is reattributed to non-controlling interests. When the Group disposes of only part of its investment in an associate or joint venture that includes a foreign operation while retaining significant influence or joint control, the relevant proportion of the cumulative amount is reclassified to profit or loss.
When the settlement of a monetary item receivable from or payable to a foreign operation is neither planned nor likely to occur in the foreseeable future, foreign exchange gains and losses arising from such a monetary item that are considered to form part of a net investment in a foreign operation are recognised in other comprehensive income, and are presented in the translation reserve in equity.
2. Summary of Significant Accounting Policies (cont’d)
c. Foreign Currencies (cont’d)
iii. Net Investment in a Foreign OperationExchange differences arising from monetary items that in substance form part of the Company’s net investment in a foreign operation are recognised in the Company’s profit or loss. Such exchange differences are reclassified to the foreign currency translation reserve in the consolidated statement of comprehensive income and are released to the consolidated income statement upon disposal of the investment as part of the gain or loss on disposal.
d. Property, Plant and Equipmenti. Owned Assets
Property, plant and equipment are measured at cost less accumulated depreciation and accumulated impairment losses. Cost includes expenditure that is directly attributable to the acquisition of the asset.
The cost of self-constructed asset includes the cost of materials, direct labour and any other costs directly attributable to bringing the assets to a working condition for their intended use, the costs of dismantling and removing the items and restoring the site on which they are located and capitalised borrowing costs.
Cost may include transfers from equity of any gain or loss on qualifying cash flow hedges of foreign currency purchases of property, plant and equipment. Purchased software that is integral to the functionality of the related equipment is capitalised as part of that equipment.
Where an item of property, plant and equipment comprises major components having different useful lives, they are accounted for as separate items of property, plant and equipment.
ii. Subsequent ExpenditureSubsequent expenditure relating to property, plant and equipment is recognised in the carrying amount of the asset when it is probable that future economic benefits, in excess of the originally assessed standard of performance of the existing asset, will flow to the Group and its costs can be measured reliably. The costs of day-to-day servicing of property, plant and equipment are recognised as an expense when incurred.
Certain items of property, plant and equipment are subject to overhauls at regular intervals. The inherent components of the initial overhaul are determined based on the costs of the next overhaul and are separately depreciated in order to reflect the estimated intervals between two overhauls. The costs of the overhauls subsequently incurred are capitalised as additions and the carrying amounts of the replaced components are written off to profit or loss.
iii. DisposalsGains or losses arising from the retirement or disposal of property, plant and equipment are determined as the difference between the net disposal proceeds and the carrying amount of the asset and are recognised in profit or loss on the date of retirement or disposal.
iv. Leasehold LandsOperating leasehold lands have been capitalized as part of property, plant and equipment and is depreciated over the lease period or over a period in which the future economic benefits embodied in the assets are expected to be consumed.
SEMBCORP INDUSTRIES ANNUAL REPORT 2015 199198 BUILDING THE FUTURE

NOTES TO THE FINANCIAL STATEMENTSYear ended December 31, 2015
2. Summary of Significant Accounting Policies (cont’d)
d. Property, Plant and Equipment (cont’d)
v. Finance Lease AssetsFinance leases are those leasing agreements with terms of which the Group assumes substantially all the risks and rewards of ownership. Property, plant and equipment acquired by way of such leases is capitalised at the lower of its fair value and the present value of the minimum lease payments at the inception of the lease, less accumulated depreciation and impairment losses. Subsequent to initial recognition, the asset is accounted for in accordance with the accounting policy applicable to that asset.
Lease payments are apportioned between the finance charges and reduction of the lease liability so as to achieve a constant rate of interest on the remaining balance of the liability.
Finance charges are charged directly to profit or loss.
Capitalised leased assets are depreciated over the shorter of the economic useful life of the asset and the lease term.
vi. Provision for Restoration CostsA provision is recognised for the costs expected to be incurred to dismantle, remove and restore the asset upon expiry of the lease agreement. The estimated costs form part of the cost of the property, plant and equipment and are depreciated over the useful life of the asset.
vii. DepreciationDepreciation is based on the cost of an asset less its residual value. Significant components of individual assets are assessed and if a component has a useful life that is different from the remainder of that asset, that component is depreciated separately. Depreciation is recognised as an expense in profit or loss on a straight-line basis over their estimated useful lives of each component of an item of property, plant and equipment, unless it is included in the carrying amount of another asset. Depreciation is recognised from the date that the property, plant and equipment are installed and are ready for use, or in respect of internally constructed assets, from the date that the asset is completed and ready for use. Leased assets are depreciated over the shorter of the lease term and their useful lives unless it is reasonably certain that the Group will obtain ownership by the end of the lease term.
The estimated useful lives for the current and comparative years are as follows:
Leasehold land and wet berthage Lease period of 3 to 60 yearsBuildings 10 to 75 years or lease period of 3 to 60 yearsImprovements to premises 3 to 30 yearsQuays and dry docks 25 to 60 years or lease period of 6 to 22 yearsInfrastructure 8 to 80 yearsPlant and machinery 3 to 40 yearsMarine vessels 7 to 25 yearsTools and workshop equipment 3 to 10 yearsFurniture, fittings and office equipment 1 to 10 yearsMotor vehicles 2 to 10 years
The assets’ depreciation methods, useful lives and residual values, if not insignificant, are reviewed annually and adjusted if appropriate.
No depreciation is provided on freehold land and capital work-in-progress.
Fully depreciated assets are retained in the financial statements until they are no longer in use.
2. Summary of Significant Accounting Policies (cont’d)
e. Investment PropertiesInvestment properties are properties held for long-term rental yields or for capital appreciation, or both, but not for sale in the ordinary course of business, use in the production or supply of goods or services or for administrative purposes.
Investment properties are initially recognised at cost and subsequently carried at cost less accumulated depreciation and accumulated impairment losses. Depreciation is recognised in profit or loss on a straight-line basis over the estimated useful lives ranging from 20 to 50 years. The assets’ depreciation methods, useful lives and residual values are reviewed, if not insignificant, annually, and adjusted if appropriate. No depreciation is provided on the freehold land.
Cost includes expenditure that is directly attributable to the acquisition of the investment property.
Investment properties are subject to renovations or improvements at regular intervals. The cost of major renovations and improvements is capitalised as additions when it increases the future economic benefits, embodied in the specific asset to which it relates, and its costs can be measured reliably. The carrying amounts of the replaced components are written off to profit or loss. The cost of maintenance, repairs and minor improvements is recognised as an expense when incurred.
On disposal of an investment property, the difference between the net disposal proceeds and the carrying amount of the asset is recognised in profit or loss.
f. Intangible Assetsi. Goodwill
Goodwill represents the excess of:
• the fair value of the consideration transferred; plus
• the recognised amount of any non-controlling interests in the acquiree; plus
• if the business combination is achieved in stages, the fair value of the pre-existing equity interest in the acquiree, less the net amount recognised (generally fair value) of the identifiable assets acquired and liabilities assumed.
When the excess is negative, a bargain purchase gain is recognised immediately in profit or loss.
Goodwill is measured at cost less accumulated impairment losses.
Goodwill that arises upon the acquisition of subsidiaries is included in intangible assets.
Goodwill on acquisition of associates and joint ventures is included in investments in associates and joint ventures, respectively. An impairment loss on such investments is not allocated to any asset, including goodwill, that forms part of the carrying amount of the investments.
Goodwill is tested for impairment on an annual basis in accordance with Note 2(l).
ii. Goodwill / Negative Goodwill Previously Written Off Against ReservesGoodwill that has previously been taken to reserves is not taken to profit or loss when (i) the business is disposed of or discontinued or (ii) the goodwill is impaired. Similarly, negative goodwill that has previously been taken to reserves is not taken to profit or loss when the business is disposed of or discontinued.
SEMBCORP INDUSTRIES ANNUAL REPORT 2015 201200 BUILDING THE FUTURE

NOTES TO THE FINANCIAL STATEMENTSYear ended December 31, 2015
2. Summary of Significant Accounting Policies (cont’d)
f. Intangible Assets (cont’d)
iii. Intellectual Property RightsIntellectual property rights are measured at cost less accumulated amortisation and accumulated impairment losses. Amortisation is recognised in profit or loss on a straight-line basis over the estimated useful life of 10 years.
iv. Service Concession ArrangementsThe Group recognises an intangible asset arising from a service concession arrangement when it has a right to charge for usage of the concession infrastructure. An intangible asset received as consideration for providing construction or upgrade services in a service concession arrangement is measured at fair value upon initial recognition by reference to the fair value of the services provided. Subsequent to initial recognition, the intangible asset is measured at cost, which includes capitalised borrowing costs, less accumulated amortisation and accumulated impairment losses.
The estimated useful life of an intangible asset in a service concession arrangement is the period when the Group has a right to charge the public for the usage of the infrastructure to the end of the concession period.
Amortisation is recognised in profit or loss on a straight-line basis over the estimated useful lives of 25 to 30 years.
v. Long-term Revenue ContractLong-term revenue contract is fair valued using cash flow projections over the contractual period of 10 to 30 years. Amortisation is recognised in profit or loss on a straight-line basis over the contractual period.
vi. Water RightsWater rights are perpetual in nature. Water rights are measured at cost less accumulated impairment losses. Water rights are tested for impairment annually in accordance with Note 2(l).
vii. Other Intangible AssetsOther intangible assets with a finite life are measured at cost less accumulated amortisation and accumulated impairment losses. Expenditure on internally generated goodwill is recognised in profit or loss as an expense as incurred. Other intangible assets are amortised on a straight-line basis from the date the asset is available for use and over its estimated useful lives ranging from 3 to 30 years.
viii. Subsequent ExpenditureSubsequent expenditure on capitalised intangible assets is capitalised only when it increases the future economic benefits embodied in the specific asset to which it relates. All other expenditure is expensed as incurred.
ix. AmortisationAmortisation methods, useful lives and residual values are reviewed at the end of each reporting period and adjusted if appropriate.
2. Summary of Significant Accounting Policies (cont’d)
g. Financial AssetsThe Group initially recognises loans and receivables and deposits on the date that they are originated. All other financial assets (including assets designated at fair value through profit or loss) are recognised initially on the trade date, which is the date that the Group becomes a party to the contractual provisions of the instrument.
The Group derecognises a financial asset when the contractual rights to the cash flows from the asset expire, or it transfers the rights to receive the contractual cash flows on the financial asset in a transaction in which substantially all the risks and rewards of ownership of the financial asset are transferred. Any interest in transferred financial assets that is created or retained by the Group is recognised as a separate asset or liability.
Financial assets and liabilities are offset and the net amount presented in the balance sheets when, and only when, the Group has a legal right to offset the amounts and intends either to settle on a net basis or to realise the asset and settle the liability simultaneously.
The Group classifies non-derivative financial assets into the following categories: financial assets at fair value through profit or loss; held to maturity investments; loans and receivables and available-for-sale financial assets. The classification depends on the purpose for which the financial assets are acquired or held. Management determines the classification of its financial assets at initial recognition and re-evaluates this designation at every reporting date. The designation of financial assets at fair value through profit or loss is irrevocable.
i. Financial Assets at Fair Value Through Profit or LossA financial asset is classified at fair value through profit or loss if it is classified as held for trading or is designated as such upon initial recognition. Financial assets are designated at fair value through profit or loss if the Group manages such investments and makes purchase and sale decisions based on their fair value in accordance with the Group’s documented risk management or investment strategy. Upon initial recognition, attributable transaction costs are recognised in profit or loss as incurred. Financial assets at fair value through profit or loss are measured at fair value, and changes therein are recognised in profit or loss.
Financial assets designated at fair value through profit or loss comprise unquoted securities that otherwise would have been classified as available-for-sale.
ii. Held to Maturity InvestmentsWhere the Group has the positive intent and ability to hold investments to maturity, then such investments are recognised initially at fair value plus any directly attributable transaction costs and subsequently measured at amortised cost using the effective interest method less impairment losses. During the year, the Group did not hold any investment in this category.
iii. Loans and ReceivablesLoans and receivables are financial assets with fixed or determinable payments that are not quoted in an active market. They are included in current assets, except for maturities greater than 12 months after the balance sheet date for which they are classified as non-current assets. Loans and receivables are recognised initially at fair value plus any directly attributable transaction costs and subsequently measured at amortised cost using the effective interest method. Receivables with a short duration are not discounted. Loans and receivables are included in trade and other receivables in the balance sheet.
Loans and receivables comprise cash and cash equivalents, work-in-progress due from customers on construction contracts, trade and other receivables, including service concession receivables and excluding prepayments and advances to suppliers.
SEMBCORP INDUSTRIES ANNUAL REPORT 2015 203202 BUILDING THE FUTURE

NOTES TO THE FINANCIAL STATEMENTSYear ended December 31, 2015
2. Summary of Significant Accounting Policies (cont’d)
g. Financial Assets (cont’d)
iii. Loans and Receivables (cont’d)
Cash and Cash EquivalentsCash and cash equivalents comprise cash balances and bank deposits. For the purpose of the statement of cash flows, cash and cash equivalents are presented net of bank overdrafts which are repayable on demand. Bank overdrafts are shown within interest-bearing borrowings in current liabilities on the balance sheet.
Service Concession ArrangementThe Group recognises a financial asset arising from a service concession arrangement when it has an unconditional contractual right to receive cash or another financial asset from or at the direction of the grantor for the construction or upgrade services provided. Such financial assets are measured at fair value upon initial recognition. Subsequent to initial recognition, the financial assets are measured at amortised cost.
If the Group is paid for the construction services partly by a financial asset and partly by an intangible asset, then each component of the consideration is accounted for separately and is recognised initially at the fair value of the consideration (see also Note 2(f)(iv)).
iv. Available-for-Sale Financial AssetsOther financial assets held by the Group that are either designated in this category or not classified in any other category, are classified as being available-for-sale. They are included in non-current assets unless management intends to dispose of the investment within 12 months of the balance sheet date. They are recognised initially at fair value plus any directly attributable transaction costs. Subsequent to initial recognition, they are measured at fair value and changes therein, other than impairment losses and foreign currency differences are recognised directly in other comprehensive income. When these investments are derecognised, the cumulative gain or loss previously recognised directly in other comprehensive income, or part thereof, is recognised in profit or loss. Where these investments are interest-bearing, interest calculated using the effective interest method is recognised in profit or loss.
Available-for-sale financial assets comprise equity shares, unit trusts and funds, and quoted mutual funds.
ImpairmentThe Group assesses at each balance sheet date whether there is objective evidence that a financial asset or a group of financial assets is impaired. A financial asset is impaired if objective evidence indicates that a loss event has occurred after the initial recognition of the asset, and that the loss event has a negative effect on the estimated future cash flows of that asset that can be estimated reliably.
The Group considers evidence of impairment for loans and receivables and held-to-maturity investment securities at both a specific asset and collective level. All individually significant loans and receivables and held-to-maturity investment securities are assessed for specific impairment. All individually significant receivables and held-to-maturity investment securities found not to be specifically impaired are then collectively assessed for any impairment that has been incurred but not yet identified. Loans and receivables and held-to-maturity investment securities that are not individually significant are collectively assessed for impairment by grouping together loans and receivables and held-to-maturity investment securities with similar risk characteristics.
2. Summary of Significant Accounting Policies (cont’d)
g. Financial Assets (cont’d)
iv. Available-for-Sale Financial Assets (cont’d)
Impairment (cont’d)
Objective evidence that financial assets (including equity securities) are impaired can include default or delinquency by a debtor, restructuring of an amount due to the Group on terms that the Group would not consider otherwise, indications that a debtor or issuer will enter bankruptcy, adverse changes in the payment status of borrowers or issuers in the Group, economic conditions that correlate with defaults or the disappearance of an active market for a security. In addition, for an investment in an equity security, a significant or prolonged decline in its fair value below its cost is objective evidence of impairment.
When a decline in the fair value of an available-for-sale financial asset has been recognised directly in other comprehensive income and there is objective evidence that the value of the asset is impaired, the cumulative loss that had been recognised directly in other comprehensive income is recognised in profit or loss even though the financial asset has not been derecognised. The amount of the cumulative loss that is recognised in profit or loss is the excess of acquisition cost less any impairment loss on that financial asset previously recognised in profit or loss, over its current fair value.
An impairment loss in respect of a financial asset measured at amortised cost is calculated as the difference between its carrying amount and the present value of the estimated future cash flows, discounted at the asset’s original effective interest rate. Losses are recognised in profit or loss and reflected in an allowance account against loans and receivables or held-to-maturity investment securities. Interest on the impaired asset continues to be recognised. When the Group considers that there are no realistic prospects of recovery of the asset, the relevant amounts are written off. If the amount of impairment loss subsequently decreases and the decrease can be related objectively to an event occurring after the impairment was recognised, then the previously recognised impairment loss is reversed through profit or loss.
Reversals of ImpairmentAn impairment loss in respect of a held-to-maturity investment security or receivable carried at amortised cost is reversed if the subsequent increase in recoverable amount can be related objectively to an event occurring after the impairment loss was recognised. The decrease in impairment loss is reversed through profit or loss.
An impairment loss once recognised in profit or loss in respect of an investment in an equity instrument classified as available-for-sale is not reversed through profit or loss. Any subsequent increase in fair value of such assets is recognised directly in other comprehensive income. If the fair value of a debt instrument classified as available-for-sale increases and the increase can be objectively related to an event occurring after the impairment loss was recognised in profit or loss, the impairment loss shall be reversed, with the amount of the reversal recognised in profit or loss.
SEMBCORP INDUSTRIES ANNUAL REPORT 2015 205204 BUILDING THE FUTURE

NOTES TO THE FINANCIAL STATEMENTSYear ended December 31, 2015
2. Summary of Significant Accounting Policies (cont’d)
h. DerivativesDerivatives are used to manage exposures to foreign exchange, interest rate and commodity price risks arising from operational, financing and investment activities. Derivatives are not used for trading purposes. However, derivatives that do not qualify for hedge accounting are accounted for as trading instruments.
Embedded derivatives are separated from the host contract and accounted for separately if the economic characteristics and risks of the host contract and the embedded derivative are not closely related, a separate instrument with the same terms as the embedded derivative would meet the definition of a derivative, and the combined instrument is not measured at fair value through profit or loss.
Derivatives are recognised initially at fair value; attributable transaction costs are recognised in profit or loss as incurred. Subsequent to initial recognition, derivatives are re-measured at fair value and any changes in its fair value are recognised immediately in profit or loss. However, where derivatives qualify for hedge accounting, recognition of any resultant changes in the fair value depends on the nature of the item being hedged as described in Note 2(i).
i. Hedging ActivitiesThe Group documents at the inception of the transaction the relationship between the hedging instruments and hedged items, together with the methods that will be used to assess the effectiveness of the hedge relationship as well as its risk management objective and strategies for undertaking various hedge transactions. The Group also documents its assessment, both at hedge inception and on an ongoing basis, of whether the derivatives designated as hedging instruments are highly effective in offsetting changes in fair value or cash flows of the hedged items.
i. Fair Value HedgesWhere a derivative hedges the changes in fair value of a recognised asset or liability or an unrecognised firm commitment (or an identified portion of such asset, liability or firm commitment), any gain or loss on the hedging instrument is recognised in profit or loss. The hedged item is also measured at fair value in respect of the risk being hedged, with any changes recognised in profit or loss.
ii. Cash Flow HedgesWhere a derivative is designated as a hedge of the variability in cash flows attributable to a particular risk associated with a recognised asset or liability, or a highly probable forecast transaction that could affect profit or loss, the effective portion of changes in the fair value of the derivative is recognised directly in other comprehensive income and presented in the hedging reserve in equity. The ineffective portion of changes in the fair values of the derivative is recognised immediately in profit or loss.
When the forecast transaction subsequently results in the recognition of a non-financial asset or non-financial liability, the associated cumulative gain or loss is reclassified from equity and included in the initial cost or other carrying amount of the non-financial asset or liability. If a hedge of a forecast transaction subsequently results in the recognition of a financial asset or financial liability, the associated changes in fair value that were recognised directly in other comprehensive income are reclassified into profit or loss in the same period or periods during which the asset acquired or liability assumed affects profit or loss.
When the hedged item is a non-financial asset, the amount accumulated in equity is retained in other comprehensive income and reclassified to profit or loss in the same period or periods during which the non-financial item affects profit or loss. In other cases as well, the amount accumulated in equity is reclassified to profit or loss in the same period that the hedged item affects profit or loss.
If the hedging instrument no longer meets the criteria for hedge accounting, expires or is sold, terminated or exercised, or the designation is revoked, then hedge accounting is discontinued prospectively. If the forecast transaction is no longer expected to occur, then the balance in equity is reclassified to profit or loss.
2. Summary of Significant Accounting Policies (cont’d)
i. Hedging Activities (cont’d)
iii. Hedge of Monetary Assets and LiabilitiesWhere a derivative is used to hedge economically the foreign exchange exposure of a recognised monetary asset or liability, no hedge accounting is applied and any changes in fair value on the hedging instrument is recognised in profit or loss.
iv. Hedge of a Net Investment in Foreign OperationHedges of a net investment in a foreign operation, including a hedge of a monetary item that is accounted for as part of the net investment, are accounted for in a way similar to cash flow hedges. Gains or losses on the hedging instrument relating to the effective portion of the hedge are recognised as other comprehensive income while any gains or losses relating to the ineffective portion are recognised in profit or loss. When the hedged net investment is disposed of, the relevant amount in the foreign currency translation reserve is transferred to profit or loss as part of the gain or loss on disposal.
v. Separable Embedded DerivativesChanges in the fair value of separable embedded derivatives are recognised immediately in profit or loss.
j. Inventories and Work-In-Progressi. Finished Goods and Components
Inventories are measured at the lower of cost and net realisable value.
Cost is calculated using the weighted average cost formula and comprises all costs of purchase, costs of conversion and other costs incurred in bringing the inventories to their present location and condition. In the case of manufactured inventories and work-in-progress, cost includes an appropriate share of overheads based on normal operating capacity. Costs of inventories also include the transfer from other comprehensive income, if any, of gains or losses on qualifying cash flow hedges relating to purchases of raw materials.
Net realisable value is the estimated selling price in the ordinary course of business less the estimated costs of completion and the estimated costs necessary to make the sale.
The amount of any allowance for write-down of inventories to net realisable value and all losses of inventories are recognised as an expense in the period the write-down or loss occurs. The amount of any reversal of any allowance for write-down of inventories, arising from an increase in net realisable value, is recognised as a reduction in the amount of inventories recognised as an expense in the period in which the reversal occurs.
SEMBCORP INDUSTRIES ANNUAL REPORT 2015 207206 BUILDING THE FUTURE

NOTES TO THE FINANCIAL STATEMENTSYear ended December 31, 2015
2. Summary of Significant Accounting Policies (cont’d)
j. Inventories and Work-In-Progress (cont’d)
ii. Long-term ContractsThe accounting policy for recognition of contract revenue is set out in Note 2(u)(ii).
Long-term contracts-in-progress at the balance sheet date represent the gross unbilled amount expected to be collected from customers for contract work performed to date and are recorded in the balance sheet at cost plus attributable profit less recognised losses, net of progress billings and allowance for foreseeable losses, and are presented in the balance sheet as “Work-in-progress” (as an asset) or “Excess of progress billings over work-in-progress” (as a liability), as applicable. Work-in-progress represents the gross unbilled amount expected to be collected from customers for contract work completed to date. This comprises mainly uncompleted ship and rig repair, building and conversion jobs. It is measured at cost plus profit recognised to date less progress billings and recognised losses. The amount due from customers on construction contracts are classified as financial assets. Long-term contract costs includes the cost of direct materials, direct labour, sub-contractors’ costs and an appropriate allocation of fixed and variable production overheads. Allowance is made for anticipated losses, if any, on work-in-progress when the possibility of loss is ascertained. When it is probable that total contract costs will exceed total contract revenue, the expected loss is recognised as an expense immediately.
Progress billings not yet paid by the customer are included in the balance sheet under “Trade and other receivables”. Amounts received before progress billings are included in the balance sheet, as “Trade and other payables”.
iii. Development PropertiesDevelopment properties are those properties which are held with the intention of development and sale in the ordinary course of business. They are stated at the lower of cost and net realisable value.
The cost of properties under development comprise specifically identified costs, including acquisition costs, development expenditure, borrowing costs and other related expenditure. Borrowing costs payable on loans funding a development property are also capitalised, on a specific identification basis, as part of the cost of the development property until the completion of development.
Net realisable value is the estimated selling price in the ordinary course of business, less estimated costs of completion and selling expenses.
The aggregated costs incurred are presented as development properties while progress billings are presented separately as deferred income within “Trade and other payables”.
k. Government GrantsAsset related grants are credited to a deferred asset grant account at fair value when there is reasonable assurance that they will be received and the Group will comply with the conditions associated with the grant. These grants are then recognised in profit or loss as other income on the straight-line basis over the estimated useful lives of the relevant assets.
Non-monetary government grants and assets received are valued at fair value or nominal amounts.
Grants that compensate the Group for expenses incurred are recognised in profit or loss as other income on a systematic basis in the same periods in which the expenses are recognised.
2. Summary of Significant Accounting Policies (cont’d)
l. Impairment – Non-financial AssetsThe carrying amounts of the Group’s non-financial assets, other than inventories and deferred tax assets, are reviewed at each reporting date to determine whether there is any indication of impairment. If any such indication exists, the assets’ recoverable amounts are estimated. For goodwill, and intangible assets that have indefinite useful lives or that are not yet available for use, the recoverable amount is estimated each year at the same time. An impairment loss is recognised whenever the carrying amount of an asset or its cash-generating unit (CGU) exceeds its recoverable amount. A CGU is the smallest identifiable asset group that generates cash flows that largely are independent from other assets and groups. Impairment losses are recognised in profit or loss unless it reverses a previous revaluation that was credited to equity, in which case it is charged to equity. Impairment losses recognised in respect of CGUs are allocated first to reduce the carrying amount of any goodwill allocated to the CGU (group of CGUs) and then, to reduce the carrying amounts of the other assets in the CGU (group of CGUs) on a pro rata basis.
Goodwill, intangible assets with indefinite useful lives and intangible assets not yet available for use are tested for impairment annually and as and when indicators of impairment occur.
i. Calculation of Recoverable AmountThe recoverable amount of an asset or CGU is the greater of its value in use and its fair value less costs to sell. In assessing value in use, the estimated future cash flows are discounted to their present value using a pre-tax discount rate that reflects current market assessments of the time value of money and the risks specific to the asset or CGU. For the purpose of impairment testing, assets that cannot be tested individually are grouped together into the smallest group of assets that generates cash inflows from continuing use that are largely independent of the cash inflows of other assets or CGUs.
Subject to an operating segment ceiling test, for the purposes of goodwill impairment testing, CGUs to which goodwill has been allocated are aggregated so that the level at which impairment testing is performed reflects the lowest level at which goodwill is monitored for internal reporting purposes. Goodwill acquired in a business combination is allocated to groups of CGUs that are expected to benefit from the synergies of the combination.
ii. Reversals of ImpairmentAn impairment loss in respect of goodwill is not reversed, even if it relates to an impairment loss recognised in an interim period that would have been reduced or avoided had the impairment assessment been made at a subsequent reporting or balance sheet date. In respect of other assets, impairment losses recognised in prior periods are assessed at each reporting date for any indications that the loss has decreased or no longer exists.
An impairment loss is reversed if there has been a change in the estimates used to determine the recoverable amount. An impairment loss is reversed only to the extent that the assets’ carrying amount does not exceed the carrying amount that would have been determined, net of depreciation or amortisation, if no impairment loss had been recognised.
Goodwill that forms part of the carrying amount of an investment in an associate or joint venture is not recognised separately, and therefore is not tested for impairment separately. Instead, the entire amount of the investment in an associate or joint venture is tested for impairment as a single asset when there is objective evidence that the investment in an associate or joint venture may be impaired.
SEMBCORP INDUSTRIES ANNUAL REPORT 2015 209208 BUILDING THE FUTURE

NOTES TO THE FINANCIAL STATEMENTSYear ended December 31, 2015
2. Summary of Significant Accounting Policies (cont’d)
m. Non-derivative Financial LiabilitiesThe Group initially recognises debt securities issued and subordinated liabilities on the date that they are originated. All other financial liabilities (including liabilities designated at fair value through profit or loss) are recognised initially on the trade date, which is the date that the Group becomes a party to the contractual provisions of the instrument.
The Group derecognises a financial liability when its contractual obligations are discharged, cancelled or expired.
Financial assets and liabilities are offset and the net amount presented in the balance sheets when, and only when, the Group has a legal right to offset the amounts and intends either to settle on a net basis or to realise the asset and settle the liability simultaneously.
The Group classifies non-derivative financial liabilities into the other financial liabilities category. Such financial liabilities are recognised initially at fair value plus any directly attributable transaction costs. Subsequent to initial recognition, these financial liabilities are measured at amortised cost using the effective interest method.
Other financial liabilities comprise loans and borrowings, bank overdrafts, trade and other payables, other long-term liabilities (excludes deferred income, deferred grants, advance payments and long-term employee benefits) and put liability to acquire non-controlling interests.
Bank overdrafts that are repayable on demand and form an integral part of the Group’s cash management are included as a component of cash and cash equivalents for the purpose of the statement of cash flows.
n. Deferred IncomeWhen the Group receives advance payments from customers in respect of connection and capacity charges for the supply and delivery of gas and utilities, the Group recognises the deferred income to profit or loss on a straight-line basis over the period stipulated in the respective customer contract commencing from the date of supply and delivery of gas and utilities.
When the Group receives a deferred income and a financial asset as consideration for providing construction services in a service concession arrangement, the Group recognises the deferred income as the difference between the fair value of the construction services provided and the fair value of the financial asset received. The fair value of the construction services provided is estimated as the value of construction services at an arm’s length transaction between willing parties. The fair value of the financial asset received is estimated as the present value of the minimum guaranteed sum receivable from the grantor of the service concession which is discounted at the imputed rate of interest i.e. the prevailing rate of interest for a similar instrument of the grantor. On completion of the construction services, the deferred income in a service concession arrangement is amortised over the estimated useful life. Subsequent to initial recognition, the deferred income is measured at cost less accumulated amortisation.
2. Summary of Significant Accounting Policies (cont’d)
o. Employee Benefitsi. Defined Contribution Plans
A defined contribution plan is a post-employment benefit plan under which an entity pays fixed contributions into a separate entity and will have no legal or constructive obligation to pay further amounts. Obligations for contributions to defined contribution plans are recognised as an expense in profit or loss as incurred. If the contribution payable to the scheme for service received before the balance sheet date exceeds the contribution already paid, the deficit payable to the scheme is recognised as a liability after deducting the contribution already paid. If the contribution already paid exceeds the contribution due for services received before the balance sheet date, then excess is recognised as an asset to the extent that the prepayment will lead to, for example, a reduction in future payment or a cash refund.
ii. Defined Benefit PlansA defined benefit plan is a post-employment benefit plan other than a defined contribution plan. The Group’s net obligation in respect of defined benefit pension plans is calculated separately for each defined benefit plan by estimating the amount of future benefit that employees have earned in return for their service in the current and prior periods; that benefit is discounted to determine its present value. The fair value of any plan assets is deducted. The Group determines the net interest expense (income) on the net defined benefit liability (asset) for the period by applying the discount rate used to measure the defined benefit obligation at the beginning of the annual period to the net defined benefit liability (asset).
The discount rate is the yield at the reporting date on high quality bonds that have maturity dates approximating the terms of the Group’s obligations and that are denominated in the currency in which the benefits are expected to be paid.
Re-measurements from defined benefit plans comprise actuarial gains and losses, the return on plan assets (excluding interest) and the effect of the asset ceiling (if any, excluding interest). The Group recognises them immediately in other comprehensive income and all expenses related to defined benefit plans in employee benefits expense in profit or loss.
Where the calculation results in a benefit to the Group, the recognised asset is limited to the present value of economic benefits available in the form of any future refunds from the plan or reductions in future contributions to the plan. In order to calculate the present value of economic benefits, consideration is given to any minimum funding requirements that apply to any plan in the Group. An economic benefit is available to the Group if it is realisable during the life of the plan, or on settlement of the plan liabilities.
The calculation is performed annually by a qualified actuary using the projected unit credit method. When the benefits of a plan are changed, or when a plan is curtailed, the portion of the changed benefit related to past service by employees, or the gain or loss on curtailment, is recognised immediately in profit or loss when the plan amendment or curtailment occurs.
The Group recognises gains and losses on the settlement of a defined benefit plan when the settlement occurs. The gain or loss on settlement is the difference between the present value of the defined benefit obligation being settled as determined on the date of settlement and the settlement price, including any plan assets transferred and any payments made directly by the Group in connection with the settlement.
iii. Long-term Employee BenefitsThe Group’s net obligation in respect of long-term employee benefits other than pension plans is the amount of future benefit that employees have earned in return for their service in the current and prior periods. That benefit is discounted to determine its present value. This has been reported in other long-term payables.
SEMBCORP INDUSTRIES ANNUAL REPORT 2015 211210 BUILDING THE FUTURE

NOTES TO THE FINANCIAL STATEMENTSYear ended December 31, 2015
2. Summary of Significant Accounting Policies (cont’d)
o. Employee Benefits (cont’d)
iv. Short-term Employee BenefitsShort-term employee benefit obligations are measured on an undiscounted basis and are expensed as the related employment service is provided.
The amount expected to be paid is accrued when the Group has a present legal or constructive obligation to pay this amount as a result of past service provided by the employee and the obligation can be estimated reliably.
v. Staff Retirement BenefitsRetirement benefits payable to certain categories of employees upon their retirement are provided for in the financial statements based on their entitlement under the staff retirement benefit plan or, in respect of unionised employees of a subsidiary who joined on or before December 31, 1988, based on an agreement with the union.
The Group’s net obligation in respect of retirement benefits is the amount of future benefit that employees have earned in return for their service in the current and prior periods. The obligation is calculated using the projected future salary increase and is discounted to its present value and the fair value of any related assets is deducted.
vi. Equity and Equity-related Compensation BenefitsShare Option PlanThe share option programme allows the Group’s employees to acquire shares of the Group companies. The fair value is measured at grant date and spread over the period during which the employees become unconditionally entitled to the options. The fair value of options granted is recognised as an employee expense with a corresponding increase in equity. At each balance sheet date, the Company revises its estimates of the number of options that are expected to become exercisable. It recognises the impact of the revision of original estimates in employee expense and in a corresponding adjustment to equity over the remaining vesting period.
The proceeds received net of any directly attributable transaction costs are credited to share capital when new shares are issued. The amount in the share-based payments reserve is retained when the option is exercised or expires.
Where treasury shares are issued, the difference between the cost of treasury shares and the proceeds received net of any directly attributable costs are transferred to share-based payments reserve.
Performance Share PlanThe fair value of equity-related compensation is measured using the Monte Carlo simulation method as at the date of the grant. The method involves projecting future outcomes using statistical distributions of key random variables including the share prices and volatility of returns. This model takes into account the probability of achieving the performance conditions in the future.
The fair value of the compensation cost is measured at grant date and amortised over the service period to which the performance criteria relates and the period during which the employees become unconditionally entitled to the shares. In estimating the fair value of the compensation cost, market-based performance conditions are taken into account. From 2014 onwards, awards granted have both market-based and non-market-based performance conditions. The compensation cost is charged to profit or loss with a corresponding increase in equity on a basis that fairly reflects the manner in which the benefits will accrue to the employee under the plan over the service period to which the performance period relates, irrespective of whether this performance condition is satisfied.
The share-based payments reserve relating to the performance shares released is transferred to share capital when new shares are issued. When treasury shares are issued, the cost of treasury shares is transferred to share-based payments reserve.
2. Summary of Significant Accounting Policies (cont’d)
o. Employee Benefits (cont’d)
vi. Equity and Equity-related Compensation Benefits (cont’d)
Restricted Share PlanSimilar to the Performance Share Plan, the fair value of equity-related compensation is measured using the Monte Carlo simulation method as at the date of the grant. The method involves projecting future outcomes using statistical distributions of key random variables including the share prices and volatility of returns. This model takes into account the probability of achieving the performance conditions in the future.
The fair value of the compensation cost is measured at grant date and amortised over the service period to which the performance criteria relates and the period during which the employees become unconditionally entitled to the shares. Awards granted have non-market based performance conditions. The compensation cost is charged to profit or loss with a corresponding increase in equity on a basis that fairly reflects the manner in which the benefits will accrue to the employee under the plan over the service period to which the performance period relates.
At the balance sheet date, the Company revises its estimates of the number of performance-based restricted shares that the employees are expected to receive based on the achievement of non-market performance conditions and the number of shares ultimately given. It recognises the impact of the revision of the original estimates in employee expense and in a corresponding adjustment to equity over the remaining vesting period.
The share-based payments reserve relating to the restricted shares released is transferred to share capital when new shares are issued. When treasury shares are issued, the cost of treasury shares is transferred to share-based payments reserve.
In the Company’s separate financial statements, the fair value of options, performance shares and restricted shares granted to employees of its subsidiaries is recognised as an increase in the cost of the Company’s investment in subsidiaries, with a corresponding increase in equity over the vesting period.
vii. Cash-related Compensation BenefitsSembcorp Challenge BonusThe Group recognises a liability and an expense for bonuses and profit-sharing, based on a formula that takes into consideration the share price of the Company. The Group recognises a provision when contractually obliged to pay or where there is a past practice that has created a constructive obligation to pay.
The compensation cost is measured at the fair value of the liability at each balance sheet date and spread over the service period to which the performance criteria relates and the period during which the employees become unconditionally entitled to the bonus. The liability takes into account the probability of achieving the performance conditions in the future.
Until the liability is settled, the Group will re-measure the fair value of the liability at each balance sheet date and at the date of settlement with any changes in fair value recognised in profit or loss for the period.
p. ProvisionsA provision is recognised if, as a result of a past event, the Group has a present legal or constructive obligation that can be reliably estimated and it is probable that an outflow of economic benefits will be required to settle the obligation. If the effect is material, provisions are determined by discounting the expected future cash flows at a pre-tax rate that reflects current market assessments of the time value of money and, where appropriate, the risks specific to the liability. The unwinding of the discount is recognised as finance cost.
SEMBCORP INDUSTRIES ANNUAL REPORT 2015 213212 BUILDING THE FUTURE

NOTES TO THE FINANCIAL STATEMENTSYear ended December 31, 2015
2. Summary of Significant Accounting Policies (cont’d)
q. Tax ExpenseTax expense comprises current and deferred tax. Tax expense is recognised in profit or loss except to the extent that it relates to business combinations, or to items recognised directly in equity, in which case it is recognised in equity or in other comprehensive income.
Current tax is the expected tax payable or receivable on the taxable income or loss for the year, using tax rates enacted or substantively enacted at the reporting date and any adjustment to tax payable in respect of previous years.
Deferred tax is recognised in respect of temporary differences between the carrying amounts of assets and liabilities for financial reporting purposes and the amounts used for taxation purposes. Deferred tax is not recognised for the following temporary differences: the initial recognition of goodwill, the initial recognition of assets or liabilities in a transaction that is not a business combination and that affects neither accounting nor taxable profit or loss, and differences relating to investments in subsidiaries, joint ventures and associates to the extent that the Group is able to control the timing of the reversal of the temporary difference and it is probable that they will not reverse in the foreseeable future.
The measurement of deferred tax reflects the consequences that would follow the manner in which the Group expects, at the end of the reporting period, to recover or settle the carrying amount of its assets and liabilities. Deferred tax is measured at the tax rates that are expected to be applied to the temporary differences when they reverse, based on the laws that have been enacted or substantively enacted by the reporting date. Deferred tax assets and liabilities are offset if there is a legally enforceable right to offset current tax liabilities and assets and they relate to taxes levied by the same tax authority on the same taxable entity, or on different tax entities, but they intend to settle current tax liabilities and assets on a net basis or their tax assets and liabilities will be realised simultaneously.
A deferred tax asset is recognised for unused tax losses, tax credits and deductible temporary differences, to the extent that it is probable that future taxable profits will be available against which they can be utilised. Deferred tax assets are reviewed at each reporting date and are reduced to the extent that it is no longer probable that the related tax benefit will be realised.
r. Share CapitalOrdinary shares are classified as equity.
Incremental costs directly attributable to the issuance of new ordinary shares and share options are deducted against the share capital account, net of any tax effects.
Where the Company’s ordinary shares are repurchased (treasury shares), the consideration paid, excluding any directly attributable incremental costs, is deducted from equity attributable to the Company’s equity holders and presented as reserve for own shares within equity, until they are cancelled, sold or reissued.
When treasury shares are cancelled, the cost of treasury shares is deducted against the share capital account, if the shares are purchased out of capital of the Company, or against the accumulated profits of the Company, if the shares are purchased out of profits of the Company.
When treasury shares are subsequently sold or reissued pursuant to the Share-based Incentive Plans, the cost of the treasury shares is reversed from the reserve for own shares account and the realised gain or loss on sale or reissue, net of any directly attributable incremental transaction costs and related tax, is recognised as a change in equity of the Company. No gain or loss is recognised in profit or loss.
Preference shares are classified as equity if it is non-redeemable or redeemable only at the Company’s option, and any dividends are discretionary. Discretionary dividends thereon are recognised as distributions within equity upon approval by the Company’s shareholders.
2. Summary of Significant Accounting Policies (cont’d)
s. Perpetual SecuritiesThe perpetual securities do not have a maturity date and the Company is able to elect to defer making a distribution, subject to the terms and conditions of the securities issue. Accordingly, the Company is not considered to have a contractual obligation to make principal repayments or distributions in respect of its perpetual securities issue and the perpetual securities are classified and presented as equity. Distributions are treated as dividends which will be directly debited from equity. Incremental costs directly attributable to the issuance of perpetual securities are deducted against the proceeds from the issue.
t. DividendsDividends on ordinary shares are recognised when they are approved for payments. Dividends on ordinary shares and redeemable convertible preference share capital classified as equity are accounted for as movements in revenue reserve.
u. Revenue Recognitioni. Income on Goods Sold and Services Rendered
Revenue from goods sold is recognised when the significant risks and rewards of ownership have been transferred to the buyer. Revenue from the provision of consultancy services is recognised using the percentage of completion method. The stage of completion is measured by reference to the percentage of cost incurred to-date to the estimated total costs for each project. Revenue on other service work is recognised when the work is completed. Revenue excludes goods and services or other sales taxes and is after deduction of any trade discounts. No revenue is recognised if there are significant uncertainties regarding recovery of the consideration due, associated costs or the possible return of goods.
ii. Contract RevenueContract revenue includes the initial amount agreed in the contract plus any variations in contract work, claims and incentive payments, to the extent that it is probable that they will result in revenue and can be measured reliably.
Revenue from repair work, engineering, overhaul, service work, infrastructure construction and marine and civil construction contracts is recognised based on percentage of completion. The percentage of completion is assessed by reference to surveys of work performed, or by reference to the ratio of costs incurred to-date to the estimated total costs for each contract, with due consideration given to the inclusion of only those costs that reflect work performed.
When the outcome of a long-term contract can be estimated reliably, contract revenue and costs are recognised as income and expense respectively using the percentage of completion method. When the outcome of a long-term contract cannot be estimated reliably, revenue is recognised only to the extent of contract costs incurred that can probably be recovered and contract costs are recognised as an expense in the period in which they are incurred. An expected loss on a contract is recognised immediately in profit or loss when it is foreseeable.
iii. Sale of Electricity, Utilities and GasesRevenue from the sale of electricity, utilities and gases is measured at the fair value of the consideration received or receivable, net of returns and allowances, trade discounts and volume rebates. Revenue is recognised when electricity, utilities and gases are delivered based on contractual terms stipulated in respective agreements with customers.
iv. Service Concession RevenueRevenue relating to construction services under a service concession arrangement is recognised based on the stage of completion of the work performed, consistent with the Group’s accounting policy on recognising revenue on construction contracts (see (ii) above). Operation or service revenue is recognised in the period in which the services are provided by the Group. When the Group provides more than one service in a service concession arrangement, the consideration received is allocated by reference to the relative fair values of the services delivered.
SEMBCORP INDUSTRIES ANNUAL REPORT 2015 215214 BUILDING THE FUTURE

NOTES TO THE FINANCIAL STATEMENTSYear ended December 31, 2015
2. Summary of Significant Accounting Policies (cont’d)
u. Revenue Recognition (cont’d)
v. Charter Hire and Rental IncomeCharter hire and rental income receivable under operating lease is recognised in profit or loss on a straight-line basis over the term of the lease. Lease incentives granted are recognised as an integral part of total rental income, over the term of the lease.
Contingent rentals are recognised as income in the accounting period in which they are earned.
v. Dividend and Finance IncomeDividend income is recognised in profit or loss on the date that the Group’s right to receive payment is established.
Finance income is recognised in profit or loss as it accrues, using the effective interest rate method.
w. Leasesi. Operating Lease
When entities within the Group are lessees of an operating leaseWhere the Group has the use of assets under operating leases, payments made under the leases are recognised in profit or loss on a straight-line basis over the term of the lease. Lease incentives received are recognised in profit or loss as an integral part of the total lease payments made.
When entities within the Group are lessors of an operating leaseAssets subject to operating leases are included in investment properties and are measured at cost less accumulated depreciation and impairment losses. Rental income (net of any incentives given to lessees) is recognised on a straight-line basis over the lease term.
ii. Finance LeaseWhen entities within the Group are lessors of a finance leaseAmounts due from lessees under finance leases are recorded as receivables at the amount of the Group’s net investment in the leases. Finance lease income is allocated to accounting periods so as to reflect a constant periodic rate of return on the Group’s net investment outstanding in respect of the leases.
x. Finance CostsFinance costs comprise interest expense on borrowings, unwinding of the discounts on provision, amortisation of capitalised transaction costs, transaction costs written off and termination of interest rate swaps. Interest expense and similar charges are expensed in profit or loss in the period using the effective interest method, except to the extent that they are capitalised as being directly attributable to the acquisition, construction or production of a qualifying asset. The interest component of finance lease payments is recognised in profit or loss using the effective interest method. Termination of interest rate swaps are recognised in profit or loss.
y. Earnings per ShareThe Group presents basic and diluted earnings per share data for its ordinary shares. Basic earnings per share is calculated by dividing the profit or loss attributable to ordinary shareholders of the Company (excluding perpetual security holders) by the weighted average number of ordinary shares outstanding during the year, adjusted for own shares held. Diluted earnings per share is determined by adjusting the profit or loss attributable to ordinary shareholders (excluding perpetual security holders) and the weighted average number of ordinary shares outstanding, adjusted for own shares held, for the effects of all dilutive potential ordinary shares, which comprise awards of share options, restricted shares and performance shares granted to employees.
2. Summary of Significant Accounting Policies (cont’d)
z. Segment ReportingAn operating segment is a component of the Group that engages in business activities from which it may earn revenues and incur expenses, including revenues and expenses that relate to transactions with any of the Group’s other components. All operating segments’ operating results are reviewed regularly by the Group President & CEO to make decisions about resources to be allocated to the segment and assess its performance, and for which discrete financial information is available.
Segment capital expenditure is the total cost incurred during the year to acquire property, plant and equipment, and intangible assets other than goodwill.
aa. Assets (or Disposal Groups) Held For SaleNon-current assets (or disposal groups) are classified as assets held for sale and measured at the lower of carrying amount and fair value less costs to sell if they are expected to be recovered principally through a sale transaction rather than through continuing use.
Any impairment losses on initial classification and subsequent gains or losses on re-measurement are recognised in profit or loss. Subsequent increases in fair value less costs to sell are recognised in profit or loss (not exceeding the accumulated impairment loss that has been previously recognised).
ab. Financial Guarantee ContractsFinancial guarantee contracts are accounted for as insurance contracts and treated as contingent liabilities until such time as they become probable that the Company will be required to make a payment under the guarantee. A provision is recognised based on the Group’s estimate of the ultimate cost of settling all claims incurred but unpaid at the balance sheet date. The provision is assessed by reviewing individual claims and tested for adequacy by comparing the amount recognised and the amount that would be required to settle the guarantee contract.
ac. Fair Value MeasurementFair value is the price that would be received to sell an asset or paid to transfer a liability in an orderly transaction between market participants at the measurement date in the principal or, in its absence, the most advantageous market to which the Group has access at that date.
The best evidence of the fair value of a financial instrument at initial recognition is normally the transaction price, that is, the fair value of the consideration given or received. When available, the Group measures the fair value of an instrument using the quoted price in an active market for that instrument.
If there is no quoted price in an active market, then the Group uses valuation techniques that maximise the use of relevant observable inputs and minimise the use of unobservable inputs. The chosen valuation technique incorporates all of the factors that market participants would take into account in pricing a transaction.
The Group recognises transfers between levels of the fair value hierarchy as of the end of the reporting period during which the change has occurred.
SEMBCORP INDUSTRIES ANNUAL REPORT 2015 217216 BUILDING THE FUTURE

NOTES TO THE FINANCIAL STATEMENTSYear ended December 31, 2015
3. Property, Plant and Equipment
Leasehold and Furniture,
freehold land, Tools and fittings Capital
wet berthage Improvements Quays Plant and Marine workshop and office Motor work-in-
and buildings to premises and dry docks Infrastructure machinery vessels equipment equipment vehicles progress Total
Group Note S$’000 S$’000 S$’000 S$’000 S$’000 S$’000 S$’000 S$’000 S$’000 S$’000 S$’000
Cost / Valuation Balance at January 1, 2015 1,265,282 62,917 911,654 290,433 4,384,785 258,131 56,130 148,435 77,480 3,011,741 10,466,988 Translation adjustments (36,558) 163 14 (1,444) (56,442) 17,093 69 (545) (1,185) (182,209) (261,044) Additions 108,939 894 25,319 11,395 56,020 1,555 2,540 18,107 5,839 1,208,797 1,439,405 Reclassification 473,615 360 824 24,845 2,201,157 10,390 1,468 2,834 262 (2,715,755) – Transfer to intangible assets 10 – – – – – – – (8) – (3,482) (3,490) Transfer to investment properties 4 – – – – – – – – – (834) (834) Disposals / Write-offs (13,759) (2,787) (51,599) (16) (55,216) – (650) (3,682) (2,169) (4,254) (134,132) Transfer to assets held for sale 13 – (113) – – (55,976) – – (574) – – (56,663) Acquisition of subsidiaries 34 16,957 – – – 630,007 – – 66 – 64,975 712,005 Disposal of subsidiaries 33 (97,359) (5,954) – (232,177) (99,164) – – (7,573) (2,726) (12,980) (457,933)Balance at December 31, 2015 1,717,117 55,480 886,212 93,036 7,005,171 287,169 59,557 157,060 77,501 1,365,999 11,704,302 Accumulated Depreciation and Impairment Losses Balance at January 1, 2015 395,899 38,036 251,852 16,343 1,823,488 25,053 46,114 112,600 32,180 – 2,741,565 Translation adjustments 3,736 27 142 (2,198) 15,879 1,077 70 1,571 (525) – 19,779 Depreciation for the year (v), 28(a) 41,247 4,144 20,648 4,605 276,617 11,152 4,335 15,095 6,979 – 384,822 Impairment losses (vii), 28(a) – 19 – – 68,998 1,400 – 35 – – 70,452 Transfer to intangible assets 10 – – – – – – – (3) – – (3) Disposals / Write-offs (10,107) (240) (51,597) (16) (21,835) – (648) (3,505) (1,678) – (89,626) Transfer to assets held for sale 13 – (86) – – (50,481) – – (540) – – (51,107) Disposal of subsidiaries 33 (7,032) (1,134) – (2,762) (38,040) – – (6,640) (1,154) – (56,762)Balance at December 31, 2015 423,743 40,766 221,045 15,972 2,074,626 38,682 49,871 118,613 35,802 – 3,019,120 Carrying Amount At January 1, 2015 869,383 24,881 659,802 274,090 2,561,297 233,078 10,016 35,835 45,300 3,011,741 7,725,423At December 31, 2015 1,293,374 14,714 665,167 77,064 4,930,545 248,487 9,686 38,447 41,699 1,365,999 8,685,182
SEMBCORP INDUSTRIES ANNUAL REPORT 2015 219218 BUILDING THE FUTURE

NOTES TO THE FINANCIAL STATEMENTSYear ended December 31, 2015
3. Property, Plant and Equipment (cont’d)
Leasehold and Furniture,
freehold land, Tools and fittings Capital
wet berthage Improvements Quays Plant and Marine workshop and office Motor work-in-
and buildings to premises and dry docks Infrastructure machinery vessels equipment equipment vehicles progress Total
Group Note S$’000 S$’000 S$’000 S$’000 S$’000 S$’000 S$’000 S$’000 S$’000 S$’000 S$’000
Cost / Valuation Balance at January 1, 2014 1,181,757 56,026 883,133 277,039 3,468,870 247,996 53,742 130,575 63,148 1,238,360 7,600,646 Translation adjustments 8,999 268 9 (5,529) 7,293 10,135 46 390 (57) (8,174) 13,380 Additions 26,006 3,164 28,715 15,498 209,344 – 1,366 15,365 21,117 955,843 1,276,418 Reclassification 8,148 3,772 10 519 729,725 – 1,198 3,128 4,583 (751,083) – Transfer to intangible assets 10 – – – 1,344 – – – – – (3,014) (1,670) Transfer to investment properties 4 (1,450) – – – – – – (3) – – (1,453) Disposals / Write-offs (1,786) (313) (213) (235) (31,724) – (222) (2,763) (11,548) (164) (48,968) Acquisition of subsidiary 34 43,608 – – 1,797 1,277 – – 1,743 237 1,579,973 1,628,635Balance at December 31, 2014 1,265,282 62,917 911,654 290,433 4,384,785 258,131 56,130 148,435 77,480 3,011,741 10,466,988 Accumulated Depreciation and Impairment Losses Balance at January 1, 2014 358,420 33,978 231,259 12,759 1,641,388 15,306 41,904 102,362 36,620 – 2,473,996 Translation adjustments 2,064 42 8 (2,363) 6,790 453 41 437 (354) – 7,118 Depreciation for the year (v), 28(a) 37,040 4,233 20,623 5,947 198,547 9,294 4,388 12,470 6,420 – 298,962 Reclassification (44) 64 – – – – – (20) – – – Transfer to investment properties 4 (879) – – – – – – (3) – – (882) Disposals / Write-offs (702) (281) (38) – (23,237) – (219) (2,646) (10,506) – (37,629)Balance at December 31, 2014 395,899 38,036 251,852 16,343 1,823,488 25,053 46,114 112,600 32,180 – 2,741,565 Carrying Amount At January 1, 2014 823,337 22,048 651,874 264,280 1,827,482 232,690 11,838 28,213 26,528 1,238,360 5,126,650At December 31, 2014 869,383 24,881 659,802 274,090 2,561,297 233,078 10,016 35,835 45,300 3,011,741 7,725,423
SEMBCORP INDUSTRIES ANNUAL REPORT 2015 221220 BUILDING THE FUTURE

NOTES TO THE FINANCIAL STATEMENTSYear ended December 31, 2015
3. Property, Plant and Equipment (cont’d)
Leasehold and Furniture,
freehold land, fittings Capital
wet berthage Improvements Quays and Plant and and office Motor work-in-
and buildings to premises dry docks machinery equipment vehicles progress Total
Company Note S$’000 S$’000 S$’000 S$’000 S$’000 S$’000 S$’000 S$’000
Cost Balance at January 1, 2015 19,566 7,905 8,226 821,117 16,945 1,788 5,719 881,266 Additions – 663 – 13,082 1,046 135 3,802 18,728 Reclassification – – – 4,828 279 – (5,107) – Transfer to intangible assets 10 – – – – – – (368) (368) Disposals / Write-offs (9) – – (3,019) (344) – – (3,372) Transfer to assets held for sale 13 – (91) – (33,698) (265) – – (34,054)Balance at December 31, 2015 19,557 8,477 8,226 802,310 17,661 1,923 4,046 862,200 Accumulated Depreciation and Impairment Losses Balance at January 1, 2015 6,679 4,872 2,833 246,878 12,504 1,255 – 275,021 Depreciation for the year 1,050 1,208 405 48,553 2,184 186 – 53,586 Disposals / Write-offs (3) – – (2,613) (341) – – (2,957) Transfer to assets held for sale 13 – (64) – (28,203) (231) – – (28,498) Impairment losses (xi) – 19 – 35,325 13 – – 35,357 Balance at December 31, 2015 7,726 6,035 3,238 299,940 14,129 1,441 – 332,509 Carrying Amount At January 1, 2015 12,887 3,033 5,393 574,239 4,441 533 5,719 606,245At December 31, 2015 11,831 2,442 4,988 502,370 3,532 482 4,046 529,691
Cost Balance at January 1, 2014 19,656 7,576 8,226 616,520 15,450 1,635 193,065 862,128 Additions – 338 – 13,806 1,439 153 5,277 21,013 Reclassification – – – 191,619 538 – (192,157) – Transfer to intangible assets 10 – – – – – – (307) (307) Disposals / Write-offs (90) (9) – (828) (482) – (159) (1,568)Balance at December 31, 2014 19,566 7,905 8,226 821,117 16,945 1,788 5,719 881,266 Accumulated Depreciation and Impairment Losses Balance at January 1, 2014 5,653 3,776 2,429 200,840 10,816 1,024 – 224,538 Depreciation for the year 1,052 1,105 404 46,455 2,163 231 – 51,410 Disposals / Write-offs (26) (9) – (417) (475) – – (927)Balance at December 31, 2014 6,679 4,872 2,833 246,878 12,504 1,255 – 275,021 Carrying Amount At January 1, 2014 14,003 3,800 5,797 415,680 4,634 611 193,065 637,590At December 31, 2014 12,887 3,033 5,393 574,239 4,441 533 5,719 606,245
SEMBCORP INDUSTRIES ANNUAL REPORT 2015 223222 BUILDING THE FUTURE

NOTES TO THE FINANCIAL STATEMENTSYear ended December 31, 2015
3. Property, Plant and Equipment (cont’d)
Groupi. Property, plant and equipment with the following net book values have been pledged to secure loan facilities granted to
subsidiaries:
Group
2015 2014
Note S$’000 S$’000
Freehold land and buildings 50,644 31,084 Leasehold land and buildings 37,914 90,365 Plant and machinery 2,698,739 68,613 Capital work-in-progress 89,162 1,873,660 Other assets 27,041 4,313
20(b) 2,903,500 2,068,035
ii. Assets with net book value of S$620,000 (2014: S$17,070,000) were acquired under finance lease.
iii. Included in the cost of leasehold land and buildings, quays and dry docks and plant and machinery are amounts of S$120,866,000, S$100,900,000 and S$667,000 (2014: S$120,866,000, S$100,900,000 and S$667,000) respectively which were measured at valuation as determined by firms of professional valuers. Also included in the cost of quays and dry docks is an amount of S$25,152,000 (2014: S$25,152,000) which was measured at Directors’ valuation. These revaluations were done on a one-off basis prior to January 1, 1997.
iv. During the year, interest and direct staff costs amounting to S$146,952,000 (2014: S$78,140,000) and S$22,644,000 (2014: S$17,470,000), respectively were capitalised as capital work-in-progress. Included in these amounts are capitalised interest costs calculated using a capitalisation rate of 12.1% (2014: nil%).
v. During the year, depreciation amounting to S$1,262,000 and no amortisation (2014: S$573,000 and S$217,000) of intangible assets were capitalised as work-in-progress.
vi. Property, plant and equipment arising from the acquisition of subsidiary was at fair value.
vii. In 2015, management noted indicators of impairment with respect to certain wastewater treatment plants, boilers and other assets. Due to changes in its operating environment with the closures of certain customers’ facilities and its estimated future ongoing operating costs, management has decided to retire these wastewater treatment plants and boilers. Management has estimated the recoverable amount based on the value-in-use method, to be zero due to no incoming cash flows being estimated for the foreseeable future. Hence, the carrying amount of the above assets amounting to S$69,052,000 was fully impaired and the impairment losses was recognised in cost of sales.
Owing to the adverse developments in the offshore marine sector, there was an indication that the Group’s marine accommodation vessel might be impaired. The Group used the discounted cash flow projections which took into account the existing charter rates over the remaining contractual period and assumed renewal rates, and certain utilisation rate. Based on the Group’s assessment of the recoverable amount of the marine accommodation vessel, an impairment loss of S$1,400,000 was recognised in cost of sales.
3. Property, Plant and Equipment (cont’d)
Group (cont’d)
viii. During the year, property, plant and equipment included provision for restoration costs amounting to S$6,020,000 (2014: S$84,000) (Note 17).
ix. During the year, construction-in-progress of a subsidiary in the Group’s China water treatment business had ceased, pending the receipt of the Environmental Protection Bureau’s approval. As the application for approval is in progress, no impairment has been recorded as at December 31, 2015.
x. A subsidiary in India has entered into an agreement to convert an existing leasehold land upon which its property, plant and equipment reside to freehold land. The subsidiary has fully paid for the conversion of the leasehold land based on the freehold rate. As at December 31, 2015, the land has not been transferred to the subsidiary. Pursuant to the current lease agreement, it is provided that in the event that the land is not transferred, the lessor is obliged to renew the lease for a further period on mutually agreed terms and conditions. No impairment, revision of useful life or provision for restoration cost has been recorded nor assessment of impact to the tax benefit availed under the Mega Power Status amounting to S$164,600,000 as at December 31, 2015, as the alienation of this leasehold land is in progress (approved by the Chief Minister and awaiting final approval of the Group of Ministers).
Companyi. During the year, due to change in operating environment with the closures of certain customers’ facilities and estimated
ongoing operating costs to be incurred, management has decided to retire certain wastewater treatment plants, boilers and other assets. Management has estimated the recoverable amount based on the value-in-use method, to be zero due to no incoming cash flows being estimated for the foreseeable future. Accordingly, an impairment loss of S$35,357,000 was recognised in cost of sales.
SEMBCORP INDUSTRIES ANNUAL REPORT 2015 225224 BUILDING THE FUTURE

NOTES TO THE FINANCIAL STATEMENTSYear ended December 31, 2015
5 Investment in Subsidiaries
Company
2015 2014
S$’000 S$’000
At cost and carrying value: Quoted equity shares 739,225 739,225 Unquoted equity shares 1,443,912 870,911 Preference shares 287,500 387,500 Share-based payments reserve 1,547 1,721 2,472,184 1,999,357
The fair value of the equity interest of the listed subsidiary with carrying amount of S$739,225,000 (2014: S$739,225,000), amounts to S$2,229,974,000 (2014: S$4,154,122,000) based on the last transacted market price as at December 31, 2015 (December 31, 2014).
Details of key subsidiaries are set out in Note 43.
4. Investment Properties
Group
2015 2014
Note S$’000 S$’000
Cost Balance at January 1 44,061 43,499 Translation adjustments 391 43 Additions 4,323 – Transfer from property, plant and equipment 3 834 1,453 Disposals (13,216) (934)Balance at December 31 36,393 44,061 Accumulated Depreciation and Impairment Losses Balance at January 1 20,482 22,545 Translation adjustments 2 – Depreciation for the year 28(a) 1,044 870 Transfer from property, plant and equipment 3 – 882 Reversal of impairment 28(a) – (3,815) Disposals (6,216) –Balance at December 31 15,312 20,482 Carrying Amount At December 31 21,081 23,579
The following amounts are recognised in profit or loss:
Group
2015 2014
S$’000 S$’000
Rental income 6,443 6,613 Operating expenses arising from rental of investment properties 4,552 3,489
The fair value of the investment properties as at the balance sheet date is S$58,683,000 (2014: S$62,349,000). The fair values are mostly determined by independent professional valuers using a combination of investment income method and direct or market comparison techniques, including adjustments to reflect the specific use of the investment properties. Such valuation is derived from observable market data from an active and transparent market. In the absence of current prices in an active market, the fair values are determined by considering the aggregate of the estimated cash flow expected to be received from renting out the properties or Directors’ valuation. A yield that reflects the specific risks inherent in the cash flows is then applied to the net annual cash flows to obtain the fair values.
SEMBCORP INDUSTRIES ANNUAL REPORT 2015 227226 BUILDING THE FUTURE

NOTES TO THE FINANCIAL STATEMENTSYear ended December 31, 2015
6. Interests in Associates and Joint Ventures
Group
2015 2014
Note S$’000 S$’000
Interests in associates and joint ventures 2,292,190 2,019,160 Quasi-equity loan to an associate (a) 57,067 55,234 2,349,257 2,074,394
In 2015, the Group received dividends of S$58,521,000 from its investments in associates and joint ventures (2014: S$100,764,000).
The carrying value as at year end includes goodwill on acquisition as follows:
Group
2015 2014
S$’000 S$’000
Balance at January 1 9,335 2,034 Translation during the year (43) 329 Allowance made for impairment – (1,688) Goodwill on acquisition – 8,660Balance at December 31 9,292 9,335
a. The quasi-equity loan to an associate is unsecured, bears interest rate at 3.72% (2014: 3.72%) per annum and the settlement of the amount is neither planned nor likely to occur in the foreseeable future.
6. Interests in Associates and Joint Ventures (cont’d)
AssociatesThe Group has one (2014: nil) associate that is material and a number of associates that are individually immaterial to the Group. All are equity accounted. The following is the material associate:
Effective equity
held by the Group
Country of 2015 2014
Name of material associate Principal activity incorporation % %
Cosco Shipyard Group Co., Ltd Provision of services for repairs of vessels; People’s Republic 18.30 18.30 repairs, construction and conversion of China of offshore platforms and offshore engineering facilities; and related services
The following summarises the financial information of the Group’s material associate based on the financial statements prepared in accordance with FRS:
Cosco Shipyard Immaterial
Group Co., Ltd associates Total Total
2015 2015 2015 2014
S$’000 S$’000 S$’000 S$’000
Revenue 3,515,121Loss from continuing operations (900,754) Other comprehensive income – Total comprehensive income (900,754) Attributable to non-controlling interests (329,024) Attributable to investee’s shareholders (571,730) Non-current assets 2,447,946 Current assets 7,751,894 Non-current liabilities (2,755,377) Current liabilities (6,382,233) Net assets 1,062,230 Attributable to non-controlling interests 247,179 Attributable to investee’s shareholders 815,051 Group’s interest in net assets of investees at January 1 395,094 622,267 1,017,361 985,223 Group’s share of: – (Loss) / Profit from continuing operations (171,519) 48,798 (122,721) 80,532 – Other comprehensive income – (12,784) (12,784) 5,810 – Total comprehensive income (171,519) 36,014 (135,505) 86,342 Translation 11,259 784 12,043 7,044 Dividend received – (21,736) (21,736) (61,248) Divestment of an associate during the year – (140,329) (140,329) – Carrying amount of interest in investees at December 31 234,834 497,000 731,834 1,017,361
SEMBCORP INDUSTRIES ANNUAL REPORT 2015 229228 BUILDING THE FUTURE

NOTES TO THE FINANCIAL STATEMENTSYear ended December 31, 2015
6. Interests in Associates and Joint Ventures (cont’d)
Associates (cont’d)
The fair value of the equity interest of a listed associate amounts to S$341,030,000 (2014: S$289,839,000) based on the last transacted market price as at December 31, 2015 (December 31, 2014).
Joint VenturesNo individual joint ventures are considered to be material to the Group. All are equity accounted. Summarised financial information of the joint ventures are presented in aggregate, representing the Group’s share, is as follows:
Group
2015 2014
S$’000 S$’000
Carrying amount 1,617,423 1,057,033
Profit for the year 128,920 77,729 Other comprehensive income (12,329) 15,069Total comprehensive income 116,591 92,798
The Group’s share of the capital commitments of the joint ventures at the balance sheet date amounted to S$303,398,000 (2014: S$292,561,000).
The Group’s interest in joint ventures with total carrying amount of S$365,260,000 (2014: S$236,176,000) as at balance sheet date has been pledged to banks to secure credit facilities granted to the joint venture entities.
In 2015, the Group paid S$215,509,000 (2014: S$57,347,000) for Fully and Compulsory Convertible Debentures (FCCDs) of NCC Power Projects Limited (NCCPP). The FCCDs will be converted into equity upon fulfilling the agreed conversion criteria. Upon the conversion of FCCDs to equity, there will be a call option for the other shareholder to have the right to buy some of the shares resulting from the conversion of the FCCDs from the Group not more than once every financial year during the option period (from commencement of operation of the plant to March 1, 2019).
In December 2015, the Group formed a joint venture with Chongqing Energy Investment Group’s subsidiary, Chongqing Songzao Coal and Power LLC, in Chongqing, China. The Group holds 49% interest in the joint venture, ChongQing SongZao Sembcorp Electric Power Co., Ltd. The total cash consideration amounted to S$201,801,000.
The Group’s stake in Phu My 3 was deemed to have increased from 33.33% to 66.67% in 2014 on the basis that management determined that the outstanding remaining condition precedent to be an administrative procedure. As the venture with the other partner under the contractual agreement requires unanimous consent for all major decisions over the relevant activities, Phu My 3 remains a joint venture.
In 2014, the Group increased its stake in Thermal Powertech Corporation India Limited (TPCIL) from 49% to 65% and it became a subsidiary of the Group (Note 34).
Details of the key associates and joint ventures are set out in Note 44.
7. Other Financial Assets
Group
2015 2014
Note S$’000 S$’000
a. Non-current AssetsAvailable-for-sale financial assets: – Equity shares (a) 244,155 242,199 – Unit trusts and funds (b) 12,137 12,600 256,292 254,799 Financial assets at fair value through profit or loss, on initial recognition: – Equity shares (c) – 52,432 – Unit trusts and funds – 1,957 – Cross currency swaps 11,155 – 11,155 54,389 Cash flow hedges: – Forward foreign exchange contracts 3,189 2,592 – Fuel oil swaps 83 30 – Interest rate swaps 12,839 3,123 16,111 5,745
283,558 314,933
b. Current AssetsAvailable-for-sale financial assets: – Unit trusts and funds (b) 25,855 – Financial assets at fair value through profit or loss, on initial recognition: – Equity shares (c) 51,033 – – Forward foreign exchange contracts 56,253 15,180 – Foreign exchange swap contracts 77 120 107,363 15,300 Hedge of net investment in foreign operations: – Forward foreign exchange contracts 122 122 Cash flow hedges: – Forward foreign exchange contracts 16,217 14,616 – Fuel oil swaps 49 787
16,266 15,403 149,606 30,825
a. During the year, impairment losses on available-for-sale financial assets amounting to S$51,569,000 (2014: S$nil) were recognised in profit or loss through reclassifying the losses accumulated in the fair value reserve in equity.
b. Included in unit trusts and funds are amounts of S$26,219,000 (2014: S$nil) pledged to secure loan facilities.
c. The non-derivative financial assets designated at fair value through profit or loss relate to investment in equity shares of a company, which owns, operates and manages a coal-fired power plant in the People’s Republic of China. Based on the agreement, the Group will transfer all of its rights and interests in the company to the other shareholders in 2016.
SEMBCORP INDUSTRIES ANNUAL REPORT 2015 231230 BUILDING THE FUTURE

NOTES TO THE FINANCIAL STATEMENTSYear ended December 31, 2015
8. Trade and Other Receivables
Group Company
2015 2014 2015 2014
Non-current Current Total Non-current Current Total Non-current Current Total Non-current Current Total
Note S$’000 S$’000 S$’000 S$’000 S$’000 S$’000 S$’000 S$’000 S$’000 S$’000 S$’000 S$’000
Trade receivables 6,000 1,037,208 1,043,208 7,543 624,264 631,807 2,484 99,205 101,689 7,543 85,900 93,443 Service concession receivables (a) 228,271 11,764 240,035 234,849 11,221 246,070 – – – – – – Amounts due from related parties 9 127,809 57,972 185,781 118,382 80,422 198,804 135,000 13,741 148,741 – 11,422 11,422 Amount due from non- controlling interests – 75,414 75,414 1,542 54,749 56,291 – – – – – – Staff loans 34 27 61 54 168 222 – – – – – – Deposits 23,769 21,864 45,633 44,049 18,547 62,596 – 1,664 1,664 – 1,368 1,368 Sundry receivables (b) 17,620 94,936 112,556 – 88,137 88,137 – 495 495 – 831 831 Unbilled receivables (c) – 271,291 271,291 – 271,956 271,956 – 38,626 38,626 – 53,647 53,647 Loan receivables – 3,803 3,803 – 3,824 3,824 – – – – – – Recoverable 1,105 7,901 9,006 7 7,177 7,184 – 1,068 1,068 – 1,363 1,363 Interest receivable – 1,992 1,992 – 905 905 – 61 61 – 93 93 404,608 1,584,172 1,988,780 406,426 1,161,370 1,567,796 137,484 154,860 292,344 7,543 154,624 162,167 Allowance for doubtful trade and other receivables (18,837) (208,036) (226,873) (1,137) (35,286) (36,423) – (20,686) (20,686) – (1,603) (1,603)Loan and receivables 36(b) 385,771 1,376,136 1,761,907 405,289 1,126,084 1,531,373 137,484 134,174 271,658 7,543 153,021 160,564 Prepayments (e) 64,777 59,479 124,256 54,903 47,329 102,232 6,273 2,590 8,863 6,897 3,592 10,489 Defined benefit assets 19(b) – – – 7,148 – 7,148 – – – – – – Advance to suppliers – 131,942 131,942 – 26,923 26,923 – 313 313 – 462 462 450,548 1,567,557 2,018,105 467,340 1,200,336 1,667,676 143,757 137,077 280,834 14,440 157,075 171,515
SEMBCORP INDUSTRIES ANNUAL REPORT 2015 233232 BUILDING THE FUTURE

NOTES TO THE FINANCIAL STATEMENTSYear ended December 31, 2015
8. Trade and Other Receivables (cont’d)
a. Service Concession ReceivablesThe subsidiaries in Singapore, Chile and Panama each have entered into service concession arrangements with the local governments. Under these arrangements, the subsidiaries are to supply treated water to the local governments for periods ranging from 25 years to 30 years. All of these arrangements fall within the scope of INT FRS 112.
The significant aspects of the service concession arrangements are as follows:
i. The subsidiaries will receive a minimum guaranteed sum from the grantors in exchange for services performed. The subsidiaries recognised these as financial receivables as they have contractual rights under the concession arrangements. The financial receivables are measured on initial recognition at their fair values using interest rates ranging from 3.62% to 17.0%; and
ii. Upon expiry of the concession arrangements, the assets are to be transferred to the local governments between 2024 to 2035.
b. Sundry receivablesSundry receivables represent mainly GST receivables.
c. Unbilled receivablesUnbilled receivables represent revenue accrued for sale of utilities services, electricity, gas and other related products. Included in the Company’s unbilled receivables are amounts of S$5.4 million (2014: S$5.5 million) due from related companies.
d. Trade and other receivablesTrade and other receivables of S$428,195,000 (2014: S$92,840,000) have been pledged to secure loan facilities.
e. PrepaymentsPrepayments are charged to profit or loss on a straight-line basis over the period of prepayments. They relate primarily to:
Groupi. Connection fees prepaid under the Generation Connection and Use of System Agreement for the use of the transmission
lines to a related corporation amounted to S$32,208,000 (2014: S$34,188,000);
ii. Service fees prepaid under the Gasoil Supply and Storage Agreement for the usage of the tank; and
iii. Capacity charges prepaid for the use of gas delivery pipelines, prepaid insurance premium, transport tariff recoverable and maintenance of plant.
Companyi. Connection and capacity charges prepaid for the use of pipelines and piperacks.
8. Trade and Other Receivables (cont’d)
The impairment losses on loans and receivables are as follow:
Gross Impairment Net Gross Impairment Net
2015 2015 2015 2014 2014 2014
Note S$’000 S$’000 S$’000 S$’000 S$’000 S$’000
Group Trade receivables 1,043,208 (192,575) 850,633 631,807 (28,060) 603,747 Amounts due from related parties 9 185,781 (2,422) 183,359 198,804 (2,028) 196,776 Other receivables 759,791 (31,876) 727,915 737,185 (6,335) 730,850 36(b) 1,988,780 (226,873) 1,761,907 1,567,796 (36,423) 1,531,373
Company Trade receivables 101,689 (20,686) 81,003 93,443 (1,529) 91,914 Amounts due from related parties 9 148,741 – 148,741 11,422 – 11,422 Other receivables 41,914 – 41,914 57,302 (74) 57,228 36(b) 292,344 (20,686) 271,658 162,167 (1,603) 160,564
SEMBCORP INDUSTRIES ANNUAL REPORT 2015 235234 BUILDING THE FUTURE
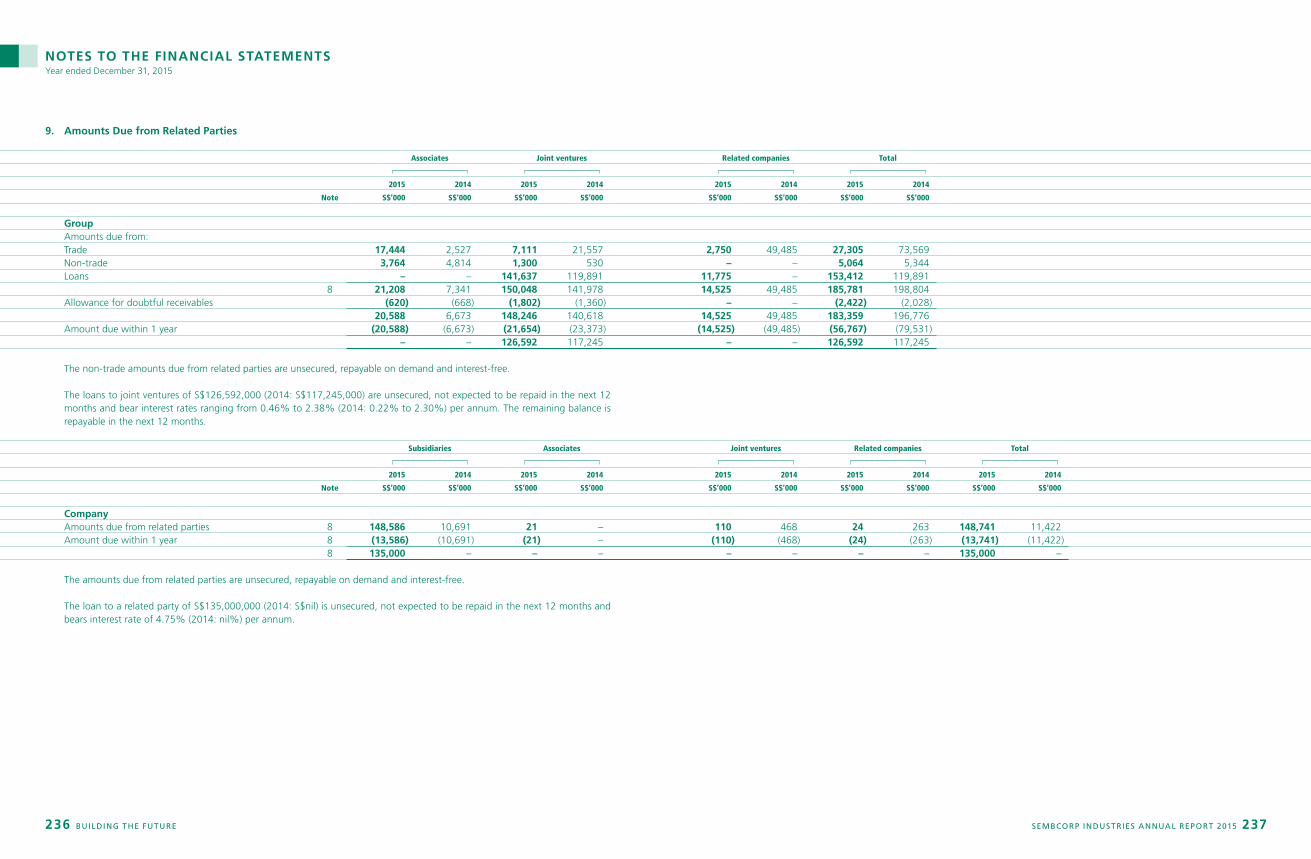
NOTES TO THE FINANCIAL STATEMENTSYear ended December 31, 2015
9. Amounts Due from Related Parties
Associates Joint ventures Related companies Total
2015 2014 2015 2014 2015 2014 2015 2014
Note S$’000 S$’000 S$’000 S$’000 S$’000 S$’000 S$’000 S$’000
Group Amounts due from: Trade 17,444 2,527 7,111 21,557 2,750 49,485 27,305 73,569 Non-trade 3,764 4,814 1,300 530 – – 5,064 5,344 Loans – – 141,637 119,891 11,775 – 153,412 119,891 8 21,208 7,341 150,048 141,978 14,525 49,485 185,781 198,804 Allowance for doubtful receivables (620) (668) (1,802) (1,360) – – (2,422) (2,028) 20,588 6,673 148,246 140,618 14,525 49,485 183,359 196,776 Amount due within 1 year (20,588) (6,673) (21,654) (23,373) (14,525) (49,485) (56,767) (79,531) – – 126,592 117,245 – – 126,592 117,245
The non-trade amounts due from related parties are unsecured, repayable on demand and interest-free.
The loans to joint ventures of S$126,592,000 (2014: S$117,245,000) are unsecured, not expected to be repaid in the next 12 months and bear interest rates ranging from 0.46% to 2.38% (2014: 0.22% to 2.30%) per annum. The remaining balance is repayable in the next 12 months.
Subsidiaries Associates Joint ventures Related companies Total
2015 2014 2015 2014 2015 2014 2015 2014 2015 2014
Note S$’000 S$’000 S$’000 S$’000 S$’000 S$’000 S$’000 S$’000 S$’000 S$’000
Company Amounts due from related parties 8 148,586 10,691 21 – 110 468 24 263 148,741 11,422 Amount due within 1 year 8 (13,586) (10,691) (21) – (110) (468) (24) (263) (13,741) (11,422) 8 135,000 – – – – – – – 135,000 –
The amounts due from related parties are unsecured, repayable on demand and interest-free.
The loan to a related party of S$135,000,000 (2014: S$nil) is unsecured, not expected to be repaid in the next 12 months and bears interest rate of 4.75% (2014: nil%) per annum.
SEMBCORP INDUSTRIES ANNUAL REPORT 2015 237236 BUILDING THE FUTURE

NOTES TO THE FINANCIAL STATEMENTSYear ended December 31, 2015
10. Intangible Assets
Service Long-term Intellectual
concession revenue property Water
Goodwill arrangements contract rights rights Others Total
Note S$’000 S$’000 S$’000 S$’000 S$’000 S$’000 S$’000
Group Cost Balance at January 1, 2015 165,791 143,987 39,775 60,072 10,168 33,635 453,428 Translation adjustments (645) (9,515) (2,360) – (491) (2,128) (15,139) Additions – 1,159 – – – 7,713 8,872 Acquisition of subsidiaries 34 43,107 – 56,190 – – 10,645 109,942 Disposal of subsidiaries 33 (33,145) – – – – (15,511) (48,656) Transfer from property, plant and equipment 3 – – – – – 3,490 3,490 Transfer to assets held for sale (1,901) – – – – (17) (1,918) Disposals – (101) – – – (6) (107) Write-offs 28(a) – (976) – – – (9) (985)Balance at December 31, 2015 173,207 134,554 93,605 60,072 9,677 37,812 508,927 Accumulated Amortisation and Impairment Losses Balance at January 1, 2015 1,901 28,961 – 13,637 – 18,363 62,862 Translation adjustments – (3,540) (55) – – (494) (4,089) Amortisation charge for the year 28(a) – 7,591 3,253 6,007 – 3,509 20,360 Impairment loss – – – – – 19 19 Disposal of subsidiaries 33 – – – – – (10,543) (10,543) Transfer from property, plant and equipment 3 – – – – – 3 3 Transfer to assets held for sale (1,901) – – – – (17) (1,918) Disposals – (90) – – – (2) (92) Write-offs 28(a) – (631) – – – – (631)Balance at December 31, 2015 – 32,291 3,198 19,644 – 10,838 65,971 Carrying Amount At January 1, 2015 163,890 115,026 39,775 46,435 10,168 15,272 390,566At December 31, 2015 173,207 102,263 90,407 40,428 9,677 26,974 442,956
10. Intangible Assets (cont’d)
Service Long-term Intellectual
concession revenue property Water
Goodwill arrangements contract rights rights Others Total
Note S$’000 S$’000 S$’000 S$’000 S$’000 S$’000 S$’000
Group Cost Balance at January 1, 2014 137,660 145,334 – 33,559 11,265 28,375 356,193 Translation adjustments 2,000 (2,527) 865 – (1,097) (151) (910) Additions – 899 – 26,513 – 4,011 31,423 Acquisition of subsidiary 34 26,131 – 38,910 – – 244 65,285 Transfer from property, plant and equipment 3 – 411 – – – 1,259 1,670 Disposals – (130) – – – (89) (219) Write-offs 28(a) – – – – – (14) (14)Balance at December 31, 2014 165,791 143,987 39,775 60,072 10,168 33,635 453,428 Accumulated Amortisation and Impairment Losses Balance at January 1, 2014 1,901 22,160 – 9,397 – 14,512 47,970 Translation adjustments – (677) – – – (7) (684) Amortisation charge for the year 28(a) – 7,591 – 4,240 – 3,961 15,792 Disposals – (113) – – – (89) (202) Write-offs 28(a) – – – – – (14) (14)Balance at December 31, 2014 1,901 28,961 – 13,637 – 18,363 62,862 Carrying Amount At January 1, 2014 135,759 123,174 – 24,162 11,265 13,863 308,223At December 31, 2014 163,890 115,026 39,775 46,435 10,168 15,272 390,566
In 2014, the Group’s amortisation amounting to S$217,000 was capitalised as work-in-progress (Note 3(v)).
Intangible assets of S$487,000 (2014: S$484,000) have been pledged to secure loan facilities.
SEMBCORP INDUSTRIES ANNUAL REPORT 2015 239238 BUILDING THE FUTURE

NOTES TO THE FINANCIAL STATEMENTSYear ended December 31, 2015
10. Intangible Assets (cont’d)
Goodwill Others Total
Note S$’000 S$’000 S$’000
Company Cost Balance at January 1, 2015 18,946 6,095 25,041 Additions – 1,910 1,910 Transfer from property, plant and equipment 3 – 368 368Balance at December 31, 2015 18,946 8,373 27,319 Accumulated Amortisation and Impairment Losses Balance at January 1, 2015 – 3,184 3,184 Amortisation charge for the year – 1,911 1,911Balance at December 31, 2015 – 5,095 5,095 Carrying Amount At January 1, 2015 18,946 2,911 21,857At December 31, 2015 18,946 3,278 22,224
Company Cost Balance at January 1, 2014 18,946 3,911 22,857 Additions – 1,978 1,978 Transfer from property, plant and equipment 3 – 307 307 Disposal – (87) (87) Write-Off – (14) (14)Balance at December 31, 2014 18,946 6,095 25,041 Accumulated Amortisation and Impairment Losses Balance at January 1, 2014 – 1,789 1,789 Amortisation charge for the year – 1,496 1,496 Disposal – (87) (87) Write-Off – (14) (14)Balance at December 31, 2014 – 3,184 3,184 Carrying Amount At January 1, 2014 18,946 2,122 21,068At December 31, 2014 18,946 2,911 21,857
10. Intangible Assets (cont’d)
AmortisationThe amortisation of intangible assets is analysed as follows:
Group
2015 2014
S$’000 S$’000
Cost of sales 17,256 12,022 Administrative expenses 3,104 3,553 Capitalised as capital work-in-progress – 217Total 20,360 15,792
Service concession arrangementsThe subsidiaries in Chile, Panama, South Africa and China have service concession agreements with the local municipalities in Chile; Panama; Mbombela and Ilembe in South Africa; and Fuzhou, Xinmin and Yanjiao in People’s Republic of China. Under these agreements, the subsidiaries are to supply drinking water to the local communities for periods of 25 to 30 years. All of these arrangements fall within the scope of INT FRS 112.
The significant aspects of the above service concession arrangements are as follows:
• The arrangements are 25 to 30 years concession arrangements for water treatment with the respective municipal governments. The Group has a total of 4 Build-Own-Operate-Transfer (BOOT) arrangements and 3 concession contracts as at the end of the reporting period.
• Under the BOOT arrangement, the operator is required to design, construct, own as well as operate, manage and maintain the assets and water services works for the supply of water.
• Under the concession contract, the operator has a right of use of all assets of the local authority concerning water and sanitation. Concessional rights include rights to possess, use, operate, manage, maintain, rehabilitate, redesign, improve and expand existing assets and water services, as well as rights to own, design, construct any new assets and water services works within the geographical scope of concession.
• Upon expiry of the concession arrangements, the assets are to be transferred to the local municipality at no cost.
• The tariffs in the South African subsidiaries are subject to review every 5 years. The tariffs are adjusted annually with an escalation formula based on costs specified in the contract. Tariff adjustments have to be approved by the Local Municipality in the city where the project is located. The tariffs in China are regulated by the Administrative Measures on Pricing of Municipal Water Supply issued by the State Development and Reform Commission (SDRC). Tariffs adjustments have to be approved by the Water Supply Company and Price Bureau, with the local institution controlling prices under the SDRC, in the city where the project is located. The tariff adjustment is based on the previous year consumer price index as stipulated in the concession agreements.
Long-term revenue contractThe subsidiaries in India have long-term power purchase agreements (PPAs) with the local Electricity Board and commercial customers.
SEMBCORP INDUSTRIES ANNUAL REPORT 2015 241240 BUILDING THE FUTURE

NOTES TO THE FINANCIAL STATEMENTSYear ended December 31, 2015
10. Intangible Assets (cont’d)
Long-term revenue contract (cont’d)
The significant terms of the above PPAs are as follows:
• A subsidiary in India has a long-term contract to provide 500 megawatts of power to the Andhra Pradesh Power distribution companies for a period of 25 years.
• In 2015, the acquired subsidiaries in the renewables sector in India have long-term contracts with India’s State Electricity Boards in Gujarat, Karnataka, Maharashtra, Rajasthan and Tamil Nadu, with tenures ranging from 10 to 30 years. These subsidiaries also sell electricity to commercial customers with tenures ranging from 10 to 25 years.
Intellectual property rightsIntellectual property rights relate to acquired patents of offshore designs.
Water rightsThe water rights have infinite useful lives and are perpetual in nature. The water rights as established in the acquisition contracts were obtained from the General Water Directorate (DGA), a regulatory body under the Ministry of Public Works in Chile. The rights allow the Group to extract water from the specific water sources and supply water to end customers.
GoodwillGroupImpairment Testing for GoodwillFor the purpose of impairment testing, goodwill is allocated to the Group’s operating divisions which represent the lowest level within the Group at which the goodwill is monitored for internal management purposes.
The aggregate carrying amounts of goodwill allocated to each unit are as follows:
Group
2015 2014
Note S$’000 S$’000
Cash-generating Unit (CGU) SUT Division (a) 18,946 18,946 Sembcorp Cogen Pte Ltd (b) 26,378 26,378 Sembcorp Gas Pte Ltd (c) 41,986 41,986 Thermal Powertech Corporation India Limited (d) 26,586 26,712 Sembcorp Bournemouth Water Limited (e) – 32,049 Sembcorp Green Infra Limited and its subsidiaries (f) 41,441 – Multiple units with insignificant goodwill 17,870 17,819 173,207 163,890
10. Intangible Assets (cont’d)
Goodwill (cont’d)
Group (cont’d)
Impairment Testing for Goodwill (cont’d)
The recoverable amounts for SUT Division, Sembcorp Cogen Pte Ltd, Sembcorp Gas Pte Ltd, Thermal Powertech Corporation India Limited and Sembcorp Green Infra Limited and its subsidiaries were determined using value-in-use calculations. Cash flow projections used in the value-in-use calculations were prepared based on management’s past experience in operating the business and forward market outlook over the long-term nature of the utilities and power business. Pre-tax discount rates between 4.7% to 5.8% (2014: 4.4% to 5.9%) had been used.
At the balance sheet date, based on the following key assumptions, the recoverable amounts exceeded their carrying amounts.
a. SUT Divisioni. Use cash flow projections over a period of 10 years (2014: 10 years);
ii. Estimation of demand and supply for industrial utilities and services are computed based on long-term secured contracts with customers updated with new contracts signed over the financial year;
iii. Scheduled plant maintenance and its associated costs have been accounted for in the forecast. Yearly maintenance cost is assumed to be 1% to 2% (2014: 4%) of the asset value;
iv. Expected capital expenditure for replenishment of parts has been included in the forecast in accordance with plant maintenance programme;
v. Inflation rate of 0.8% to 2.1% (2014: 2.7%) has been used to project overheads and other general expenses; and
vi. No terminal value is considered.
b. Sembcorp Cogen Pte Ltdi. Use cash flow projections over a period of 11 years (2014: 12 years);
ii. Estimation of demand and supply of electricity and electricity margin is derived based on forecasted market conditions leading to pool price movement;
iii. Scheduled plant maintenance and its associated costs have been accounted for in the forecast based on the remaining economic useful lives of the plants. Yearly maintenance costs are assumed to range from 3% to 5% (2014: 3% to 4%) of the asset value;
iv. Expected capital expenditure for replenishment of parts has been included in the forecasts in accordance with plant maintenance programme;
v. Inflation rate assumption ranging from 0.8% to 2.1% (2014: 2.7%) has been used to project overheads and other general expenses; and
vi. No terminal value is considered.
SEMBCORP INDUSTRIES ANNUAL REPORT 2015 243242 BUILDING THE FUTURE

NOTES TO THE FINANCIAL STATEMENTSYear ended December 31, 2015
10. Intangible Assets (cont’d)
Goodwill (cont’d)
Group (cont’d)
c. Sembcorp Gas Pte Ltdi. Use cash flow projections over a period of 11 years (2014: 12 years);
ii. Estimation of sale and purchases of gas quantity is derived based on the contractual period of the existing contracts;
iii. Forward USD / SGD exchange rate and High Sulphur Fuel Oil (HSFO) prices against current financial year were assumed in the forecast performance;
iv. Yearly maintenance costs to service the gas pipelines are assumed to range from 3% to 5% (2014: 3% to 4%) of the asset value;
v. Inflation rate assumption range from 0.8% to 2.1% (2014: 2.7%) has been used to project overheads and other general expenses; and
vi. No terminal value is considered.
d. Thermal Powertech Corporation India Limited (TPCIL)i. Use of cash flow projections over a period of 25 years;
ii. Estimation of demand and supply of electricity and electricity margin is derived based on a combination of forecasted short to medium and long-term secured contracts;
iii. Scheduled plant maintenance and its associated costs have been accounted for in the forecast based on Indian regulatory guidelines;
iv. Expected capital expenditure for replenishment of parts has been included in the forecasts in accordance with plant maintenance programme;
v. Inflation rate assumption of 5% has been used to project overheads and other general expenses;
vi. Cash flows are estimated based on the long-term secured contract on the premise that the conversion of the leasehold land, which the subsidiary has already paid in full, will be converted to freehold (Note 3(x)); and
vii. No terminal value is considered.
e. Sembcorp Bournemouth Water LimitedThe recoverable amount was based on its fair value less costs to sell, determined by reference to the Regulatory Capital Value (RCV) plus a premium (Level 2 in fair value in hierarchy). The RCV is a published figure in United Kingdom (UK), and the premium was calculated based on the premiums paid on the recent acquisitions of water companies in the UK. The recoverable amount was higher than its carrying value. In 2015, the Group has disposed its 100% interest in Sembcorp Bournemouth Water Limited. Upon disposal, the goodwill was derecognised (Note 33).
10. Intangible Assets (cont’d)
Goodwill (cont’d)
Group (cont’d)
f. Sembcorp Green Infra Limited and its subsidiariesi. Use of cash flow projections over a period of 25 years;
ii. Estimation demand and supply of electricity and electricity margin is derived based on forecasted wind resource, and forecasted and long-term secured contracts;
iii. Expected capital expenditure for replenishment of parts has been included in the forecast in accordance with plant maintenance programme;
iv. Inflation rate assumption of 5% has been used to project overheads and other general expenses; and
v. No terminal value is considered.
CompanyThe Company’s goodwill relates to goodwill of SUT on the acquisition of the SUT Division in 2008.
SEMBCORP INDUSTRIES ANNUAL REPORT 2015 245244 BUILDING THE FUTURE

NOTES TO THE FINANCIAL STATEMENTSYear ended December 31, 2015
11. Deferred Tax Assets and LiabilitiesMovements in deferred tax assets and liabilities (prior to offsetting of balances) during the year are as follows:
Recognised
in profit Recognised Disposal of Acquisition
or loss in equity subsidiary of subsidiary Translation
At Jan 1 (Note 27) (Note 24) (Note 33) (Note 34) adjustments At Dec 31
S$’000 S$’000 S$’000 S$’000 S$’000 S$’000 S$’000
Group 2015 Deferred tax liabilities Property, plant and equipment 471,387 (39,473) – (44,836) 65,300 (4,075) 448,303 Interests in associates 10,284 (8,576) – – – – 1,708 Other financial assets 22,659 666 1,616 – 1,336 (64) 26,213 Trade and other receivables 9,471 583 – – – (180) 9,874 Intangible assets 11,442 (573) – – 19,830 (797) 29,902 Other items 9,907 792 (1,540) – – 235 9,394Total 535,150 (46,581) 76 (44,836) 86,466 (4,881) 525,394
Deferred tax assets Property, plant and equipment (77,257) (2,933) – 19 – 333 (79,838) Inventories (508) (367) – – – – (875) Trade receivables (361) 232 – – – 2 (127) Trade and other payables (8,932) (1,464) – – (3,734) (93) (14,223) Tax losses (4,991) (61,455) – – (47,088) 1,967 (111,567) Provisions (25,727) 6,823 – – – 20 (18,884) Other financial liabilities (48,793) 124 5,886 – – (137) (42,920) Retirement benefit obligations (3,255) (41) 230 223 – (320) (3,163) Other items (1,352) 61 – – (1,238) 54 (2,475)Total (171,176) (59,020) 6,116 242 (52,060) 1,826 (274,072)
11. Deferred Tax Assets and Liabilities (cont’d)
Recognised
in profit Recognised Disposal of Acquisition
or loss in equity subsidiary of subsidiary Translation
At Jan 1 (Note 27) (Note 24) (Note 33) (Note 34) adjustments At Dec 31
S$’000 S$’000 S$’000 S$’000 S$’000 S$’000 S$’000
Group 2014 Deferred tax liabilities Property, plant and equipment 392,872 49,973 – – 28,132 410 471,387 Interests in associates 9,709 575 – – – – 10,284 Other financial assets 22,442 – 210 – – 7 22,659 Trade and other receivables 8,366 1,168 – – – (63) 9,471 Intangible assets – – – – 11,206 236 11,442 Other items 8,072 695 1,104 – – 36 9,907Total 441,461 52,411 1,314 – 39,338 626 535,150
Deferred tax assets Property, plant and equipment (56,122) (21,072) – – – (63) (77,257) Inventories (477) (31) – – – – (508) Trade receivables (343) (29) – – – 11 (361) Trade and other payables (4,314) (4,634) – – – 16 (8,932) Tax losses (1,410) (3,845) – – – 264 (4,991) Provisions (29,029) 3,052 – – – 250 (25,727) Other financial liabilities (21,931) 316 (27,176) – – (2) (48,793) Retirement benefit obligations (6,458) 15 3,233 – – (45) (3,255) Other items (951) (445) – – – 44 (1,352)Total (121,035) (26,673) (23,943) – – 475 (171,176)
Recognised Recognised
At in profit Recognised At in profit Recognised At
Jan 1, 2014 or loss in equity Dec 31, 2014 or loss in equity Dec 31, 2015
S$’000 S$’000 S$’000 S$’000 S$’000 S$’000 S$’000
Company Deferred tax liabilities Property, plant and equipment 48,487 9,351 – 57,838 (3,851) – 53,987 Derivative assets – – (265) (265) – 265 –Total 48,487 9,351 (265) 57,573 (3,851) 265 53,987
Deferred tax assets Trade and other payables (1,059) – – (1,059) 1,059 – – Provisions (3,216) – – (3,216) 3,216 – –Total (4,275) – – (4,275) 4,275 – –
SEMBCORP INDUSTRIES ANNUAL REPORT 2015 247246 BUILDING THE FUTURE

NOTES TO THE FINANCIAL STATEMENTSYear ended December 31, 2015
11. Deferred Tax Assets and Liabilities (cont’d)
Deferred tax liabilities and assets are offset when there is a legally enforceable right to offset current tax assets against current tax liabilities and when the deferred taxes relate to the same taxation authority. The amounts determined after appropriate offsetting included in the balance sheet are as follows:
Group Company
2015 2014 2015 2014
S$’000 S$’000 S$’000 S$’000
Deferred tax liabilities 319,605 413,680 53,987 53,298 Deferred tax assets (68,283) (49,706) – – 251,322 363,974 53,987 53,298
As at December 31, a deferred tax liability of S$17,018,000 (2014: S$14,258,000) for potential taxable temporary differences arising from undistributed retained earnings related to investment in subsidiaries and joint ventures were not recognised.
Deferred tax assets have not been recognised in respect of the following items:
Group
2015 2014
S$’000 S$’000
Deductible temporary differences 12,348 13,212 Tax losses 271,424 128,084 Capital allowances 1,394 1,154 285,166 142,450
Tax losses of the Group amounting to S$69,748,000 (2014: S$6,596,000) will expire between 2016 and 2023 (2014: 2015 and 2019). The remaining tax losses, capital allowances and deductible temporary differences do not expire under current tax legislation.
Deferred tax assets have not been recognised under the following circumstances:
a. Where they qualified for offset against the tax liabilities of member companies within the Group under the Loss Transfer System of Group Relief but the terms of the transfer have not been ascertained as at year end; and
b. Where it is uncertain that future taxable profit will be available against which certain subsidiaries of the Group can utilise the benefits.
12. Inventories and Work-In-Progress
Group Company
2015 2014 2015 2014
Note S$’000 S$’000 S$’000 S$’000
Raw materials 160,871 94,219 3,338 4,442 Finished goods 153,947 139,902 8,538 6,758 314,818 234,121 11,876 11,200 Allowance for inventory obsolescence (24,754) (23,045) – – 290,064 211,076 11,876 11,200 Work-in-progress (a) 3,829,050 2,993,836 465 – Properties under development 113,395 – – – 4,232,509 3,204,912 12,341 11,200
In 2015, raw materials and changes in finished goods included as cost of sales amounted to S$316,261,000 (2014: S$157,723,000).
In 2015, the net write-down of inventories to net realisable value by the Group amounted to S$2,492,000 (2014: S$3,183,000) and is included in cost of sales.
Inventories of S$63,663,000 (2014: S$nil) have been pledged to secure loan facilities.
Group Company
2015 2014 2015 2014
Note S$’000 S$’000 S$’000 S$’000
(a) Work-in-progress: Costs and attributable profits less allowance for foreseeable losses 10,623,888 8,135,344 465 3,154 Progress billings (7,114,989) (6,170,095) – (3,159) 3,508,899 1,965,249 465 (5)
Comprising: Due from customers on construction contracts 36 3,325,798 2,705,106 – – Work-in-progress 503,252 288,730 465 – 3,829,050 2,993,836 465 – Excess of progress billings over work-in-progress (320,151) (1,028,587) – (5) 3,508,899 1,965,249 465 (5)
During the financial year, the Group conducted a review of all of its long-term construction contracts and concluded that certain contracts were loss-making, resulting in an allowance of S$277,961,000 (2014: S$nil). Such losses took into account the expected contract price adjustments from modifications to the original contract terms and deterioration in credit risk assessment on these customers. Other considerations include the timeline and total costs to complete these construction contracts.
In 2015, the net write-down of work-in-progress to net realisable value by the Group amounted to S$85,518,000 (2014: S$nil) and is included in cost of sales.
SEMBCORP INDUSTRIES ANNUAL REPORT 2015 249248 BUILDING THE FUTURE

NOTES TO THE FINANCIAL STATEMENTSYear ended December 31, 2015
13. Assets Held for Sale
Group Company
Investment Assets Assets Assets
held for sale held for sale Total held for sale held for sale
2015 2015 2015 2014 2015
Note S$’000 S$’000 S$’000 S$’000 S$’000
Property, plant and equipment 3 – 5,556 5,556 24,437 5,556 Inventories and work-in-progress – 337 337 – 337 Interest in joint venture 6 452 – 452 – – Trade and other receivables 29,209 – 29,209 – – Cash and cash equivalents 6,249 – 6,249 – –Assets held for sale 35,910 5,893 41,803 24,437 5,893
Trade and other payables 3,783 – 3,783 – – Current tax payable 1,647 – 1,647 – –Liabilities held for sale 5,430 – 5,430 – –
2015The disposal plan for the 2014 plant and machinery has changed into a divestment of the Group’s entire stake in Sembcorp Air Products (Hyco) Pte Ltd (SembAP) and SembAP’s 50% owned joint venture, Sakra Island Carbon Dioxide Pte Ltd (SICD). As at December 31, 2015, the assets and liabilities related to SembAP have been classified as assets and liabilities held for sale. The disposal was completed on January 28, 2016. Accordingly, an amount of S$14,534,000 is written back and presented in general and administrative expense.
There are no other items in other comprehensive income relating to the disposal of investment.
The Group’s and the Company’s carrying value of the plant and machinery and inventories of S$5,893,000 reflects the recoverable amount.
2014The carrying value of the plant and machinery of S$24,437,000 reflected the agreed consideration amount.
14. Cash and Cash Equivalents
Group Company
2015 2014 2015 2014
Note S$’000 S$’000 S$’000 S$’000
Fixed deposits with banks 419,074 306,151 – – Cash and bank balances 1,187,414 1,355,276 325,831 198,395Cash and cash equivalents in the balance sheets 1,606,488 1,661,427 325,831 198,395 Bank overdrafts 20 (2,023) (1,993) – –Cash and cash equivalents in the consolidated statement of cash flows 1,604,465 1,659,434 325,831 198,395
Fixed deposits with banks of the Group earn interest at rates ranging from 0.01% to 14.14% (2014: 0.02% to 11.59%) per annum.
Included in the cash and bank balances are amount of S$278,796,000 (2014: S$356,877,000) placed with a related corporation.
14. Cash and Cash Equivalents (cont’d)
Included in the Group’s cash and cash equivalents in the balance sheet is an amount of S$104,497,000 (2014: S$79,282,000) which banks have a first charge in the event that the subsidiaries do not meet the debt servicing requirement.
Included in the Company’s cash and cash equivalents at the balance sheet date are amounts of S$325.1 million (2014: S$196.4 million) placed with a bank under the Group’s cash pooling arrangement by a subsidiary and amounts of S$0.7 million (2014: S$2.0 million) placed with a related corporation.
15. Trade and Other Payables
Group Company
2015 2014 2015 2014
Note S$’000 S$’000 S$’000 S$’000
Current liabilities Trade payables 2,668,166 1,873,742 4,318 10,329 Advance payments from customers 36,843 50,460 1,377 1,742 Amounts due to related parties 16 8,073 5,612 24,854 118,828 Amounts due to non-controlling interests 989 2,884 – – Accrued operating expenses (a) 428,643 452,808 92,613 136,848 Deposits 28,745 34,790 342 342 Accrued interest payable 44,495 39,564 – – Accrued capital expenditure 82,063 66,029 3,616 5,478 Retirement benefit obligations 19 259 503 – – Other creditors 89,645 218,971 3,953 13,069 3,387,921 2,745,363 131,073 286,636
Non-current liabilities Deferred income (b) 110,181 161,290 15,928 13,323 Deferred grants (c) 2,802 4,412 – – Amounts due to related parties 16 – – 246,000 449,000 Loan due to non-controlling interests (d) – 8,362 – – Other payables (e) 134,526 122,820 21,644 20,523Other long-term payables 247,509 296,884 283,572 482,846
a. Included in the Company’s accrued operating expenses are amounts of S$25.2 million (2014: S$1.8 million) due to related companies.
b. Deferred income relates mainly to:
i. advance payments received from customers in respect of connection and capacity charges for the supply and delivery of gas and utilities; and
ii. the difference between the fair value of the construction services provided pursuant to service concession arrangements and the fair value of the financial asset receivable.
c. Deferred grants relate to government grants for capital assets.
d. In 2014, loan due to non-controlling interests of S$8,362,000 was unsecured, non-interest bearing. In 2015, the loan due to non-controlling interests was no longer consolidated upon divestment of a subsidiary.
e. Other long-term payables include retention monies of subsidiaries, long-term employee benefits and accrued operating and maintenance services which will be billed only after the initial payment-free period, which is more than one year.
SEMBCORP INDUSTRIES ANNUAL REPORT 2015 251250 BUILDING THE FUTURE

NOTES TO THE FINANCIAL STATEMENTSYear ended December 31, 2015
16. Amounts Due to Related Parties
Associates Joint ventures Related companies Total
2015 2014 2015 2014 2015 2014 2015 2014
Note S$’000 S$’000 S$’000 S$’000 S$’000 S$’000 S$’000 S$’000
Group Amounts due to: Trade 23 130 3,605 2,302 728 145 4,356 2,577 Non-trade 300 17 9 287 – – 309 304 Advance payment – trade – – 3,408 2,731 – – 3,408 2,731 15 323 147 7,022 5,320 728 145 8,073 5,612
The non-trade amounts due to related parties are unsecured, interest-free and repayable on demand.
Subsidiaries Joint ventures Related companies Total
2015 2014 2015 2014 2015 2014 2015 2014
Note S$’000 S$’000 S$’000 S$’000 S$’000 S$’000 S$’000 S$’000
Company Amounts due to: Trade (i) 21,574 16,413 – 48 95 53 21,669 16,514 Non-trade 2,185 2,314 – – – – 2,185 2,314 Loans from a related party (ii) 247,000 549,000 – – – – 247,000 549,000 270,759 567,727 – 48 95 53 270,854 567,828 Amounts due after 1 year (246,000) (449,000) – – – – (246,000) (449,000) 15 24,759 118,727 – 48 95 53 24,854 118,828
i. The amounts due to related parties are unsecured, interest-free and repayable on demand.
ii. The loans from a related party of S$247,000,000 (2014: S$549,000,000) bear interest rates ranging from 1.84% to 3.82% (2014: 1.7% to 3.82%) per annum and were unsecured.
SEMBCORP INDUSTRIES ANNUAL REPORT 2015 253252 BUILDING THE FUTURE

NOTES TO THE FINANCIAL STATEMENTSYear ended December 31, 2015
17. Provisions
Onerous Restoration
Claims contracts costs Warranty Others Total
Note S$’000 S$’000 S$’000 S$’000 S$’000 S$’000
Group 2015 Balance at January 1 54,814 – 62,338 54,649 7,336 179,137 Translation adjustments 256 – (84) 401 221 794 Provisions made / (written back) during the year, net (9,362) – 2,752 (37,464) (85) (44,159) Provisions utilised during the year (20,087) – (3,246) (329) (1,578) (25,240) Acquisition of subsidiaries 34 – – 3,268 – – 3,268 Disposal of subsidiaries 35 3,345 – – – – 3,345 Unwind of discount on restoration costs 26 – – 261 – – 261Balance at December 31 28,966 – 65,289 17,257 5,894 117,406
Provisions due: – within 1 year 28,826 – 10,129 17,257 2,452 58,664 – after 1 year but within 5 years 140 – 1,882 – 1,755 3,777 – after 5 years – – 53,278 – 1,687 54,965 28,966 – 65,289 17,257 5,894 117,406
2014 Balance at January 1 67,936 823 62,221 58,502 4,558 194,040 Translation adjustments 134 – 33 280 130 577 Provisions made / (written back) during the year, net (7,765) (823) 84 (4,133) 1,688 (10,949) Provisions utilised during the year (5,491) – – – (148) (5,639) Other adjustments – – – – 1,108 1,108Balance at December 31 54,814 – 62,338 54,649 7,336 179,137
Provisions due: – within 1 year 54,198 – – 15,187 4,329 73,714 – after 1 year but within 5 years 616 – 3,214 39,462 985 44,277 – after 5 years – – 59,124 – 2,022 61,146 54,814 – 62,338 54,649 7,336 179,137
17. Provisions (cont’d)
Restoration
Claims costs Total
S$’000 S$’000 S$’000
Company 2015 Balance at January 1 13,416 593 14,009 Provisions made / (written back) during the year, net 9,137 – 9,137 Provisions utilised during the year (67) – (67)Balance at December 31 22,486 593 23,079
Provisions due: – within 1 year 22,486 – 22,486 – after 5 years – 593 593 22,486 593 23,079
2014 Balance at January 1 20,931 593 21,524 Provisions made / (written back) during the year, net (2,035) – (2,035) Provisions utilised during the year (5,480) – (5,480)Balance at December 31 13,416 593 14,009
Provisions due: – within 1 year 13,416 – 13,416 – after 5 years – 593 593 13,416 593 14,009
ClaimsThis provision relates to the obligations arising from contractual and commercial arrangements in the Group’s and the Company’s operations, based on the best estimate of the possible outflow considering both contractual and commercial factors.
Onerous ContractsThe provision for onerous contracts relates to the Group’s exposure to the unavoidable cost of meeting its obligations under the contracts, which exceeds the expected benefits to be derived by the Group. The provision is measured at the present value of the lower of the expected cost of terminating the contract and the expected net cost of continuing with the contract. Before a provision is established, the Group recognises any impairment loss on the assets associated with the contracts.
Restoration CostsRestoration costs relate to cost of dismantling and removing assets and restoring the premises to its original condition as stipulated in the operating lease agreements. The subsidiaries expect to incur the liability upon termination of the lease.
WarrantyProvision for warranties relate to contracts with contractual warranty terms. The provision for warranty is based on estimates from weighing all possible outcomes by their associated probabilities and estimates made from historical warranty data associated with similar projects.
SEMBCORP INDUSTRIES ANNUAL REPORT 2015 255254 BUILDING THE FUTURE

NOTES TO THE FINANCIAL STATEMENTSYear ended December 31, 2015
17. Provisions (cont’d)
OthersOthers include provision for maintenance obligation recognised for the contractual obligations to maintain the infrastructure and equipment to specified levels of serviceability under the service concession agreements. The provisions are measured at the best estimate of the expenditure required and timing of outflows, to settle the present obligation at the end of each reporting period.
18. Other Financial Liabilities
Group Company
2015 2014 2015 2014
Note S$’000 S$’000 S$’000 S$’000
Current Liabilities Financial liabilities at fair value through profit or loss, on initial recognition: – Forward foreign exchange contracts 298 3,254 – – – Foreign exchange swap contracts 1,318 4,536 – – Hedge of net investment in foreign operations: – Foreign exchange swap contracts 596 – – – Cash flow hedges: – Interest rate swaps 477 1,747 – – – Forward foreign exchange contracts 106,040 47,803 – 1,558 – Fuel oil swaps 72,742 108,590 – – 181,471 165,930 – 1,558
Non-current Liabilities Financial liabilities at fair value through profit or loss, on initial recognition: – Forward foreign exchange contracts 575 – – – – Interest rate swaps 157 – – – Hedge of net investment in foreign operations: – Cross currency swaps 46,526 42,072 – – Cash flow hedges: – Interest rate swaps 2,198 6,796 – – – Forward foreign exchange contracts 2,399 35,203 – – – Fuel oil swaps 13,912 22,401 – – Put liability to acquire non-controlling interests (a) 193,113 – – – 258,880 106,472 – –
(a) This represents the fair value of the put liability to acquire the non-controlling interests as part of the share purchase agreement of a subsidiary. Under the agreement, the Group entered into put and call options with the existing shareholders (i.e. non-controlling shareholders upon the Group’s acquisition of 60% in SGI) of SGI (Note 34) as follows:
• Put option – Non-controlling shareholder has the right to sell to the Group its entire shares during the option period (February 11, 2015 to July 31, 2018) at the put option consideration.
• Call option – The Group has the right to buy the entire shares of the non-controlling shareholder during the option period (January 1, 2018 to July 31, 2018) at the call option consideration.
• IPO call option – The Group has the right to buy the entire shares of the non-controlling shareholder during the option period (within 20 days from the final determination of the valuation of the shares for IPO prospects) at 90% of the valuation to be determined.
19. Retirement Benefit Obligations
Group
2015 2014
Note S$’000 S$’000
Provision for retirement gratuities (a) 3,284 2,624 Defined benefit obligations (b) 5,866 13,537 9,150 16,161
Current 15 259 503 Non-current 8,891 15,658
a. Provision for Retirement Gratuities Group
2015 2014
S$’000 S$’000
Balance at January 1 2,624 2,064 Translation adjustments 144 81 Provision made during the year 816 756 Less: Amount paid (300) (277)Balance at December 31 3,284 2,624
SEMBCORP INDUSTRIES ANNUAL REPORT 2015 257256 BUILDING THE FUTURE

NOTES TO THE FINANCIAL STATEMENTSYear ended December 31, 2015
19. Retirement Benefit Obligations (cont’d)
b. Defined Benefit Obligations (cont’d)
The proportion of fair value of plan assets at the balance sheet is analysed as follows:
Group
2015 2014
S$’000 S$’000
Equity instruments 78,466 133,205 Debt instruments 125,722 229,605 Other assets 26,285 36,397
230,473 399,207
The plan assets do not include any of the Group’s own financial instruments, nor any property occupied by, or other assets used by the Group.
Movement in net defined benefit (asset) liabilityThe following table shows a reconciliation from the opening balances to the closing balances for net defined benefit liability (asset) and its components.
Defined Fair value Net defined benefit
benefit obligation of plan assets liability / (asset)
2015 2014 2015 2014 2015 2014
S$’000 S$’000 S$’000 S$’000 S$’000 S$’000
Group Balance at January 1 405,596 375,101 (399,207) (345,776) 6,389 29,325 Included in income statement Service cost (3,427) 33 – – (3,427) 33 Interest cost / (income) 8,756 16,381 (8,292) (15,174) 464 1,207 Administrative expenses – – (9) 396 (9) 396 5,329 16,414 (8,301) (14,778) (2,972) 1,636 Included in other comprehensive income Re-measurements loss / (gain): – Actuarial loss / (gain) arising from: – demographic assumptions (1,893) 3,014 – – (1,893) 3,014 – financial assumptions 10,849 29,541 – – 10,849 29,541 – experience adjustment (3,752) (3,388) – – (3,752) (3,388) – Return on plan assets excluding interest income – – 2,335 (50,280) 2,335 (50,280) Effect of movements in exchange rates 3,510 1,097 (3,453) (861) 57 236 8,714 30,264 (1,118) (51,141) 7,596 (20,877) Other Contributions paid by employer – – (2,412) (3,727) (2,412) (3,727) Benefits paid (7,907) (16,323) 7,874 16,323 (33) – Disposal of subsidiaries (see Note 33) (175,697) – 172,860 – (2,837) – Acquisition of subsidiaries (see Note 34) 304 140 (169) (108) 135 32 (183,300) (16,183) 178,153 12,488 (5,147) (3,695)
Balance at December 31 236,339 405,596 (230,473) (399,207) 5,866 6,389
19. Retirement Benefit Obligations (cont’d)
b. Defined Benefit ObligationsCertain subsidiaries provide pension arrangements to its full time employees through defined benefit plans and the related costs are assessed in accordance with the advice of professionally qualified actuaries.
One of the pension schemes has been closed to further accruals from June 1, 2013. The pensions for all active members at the closure date, which are based on service prior to closure, remain linked to final pensionable salary.
The numbers shown below have been based on calculations carried out by qualified independent actuaries to take into account the requirements of FRS 19 in order to assess the liabilities of the schemes at December 31, 2015 and December 31, 2014.
The present values of the funded defined benefit obligations, the related current service cost and, where applicable, past service cost were measured using the projected unit credit method. Details of the schemes are as follows:
Group
2015 2014
S$’000 S$’000
Present value of funded defined benefit obligations 236,339 405,596 Fair value of plan assets (230,473) (399,207)Deficit in scheme 5,866 6,389
The amounts included in the balance sheet are as follows:
Group
2015 2014
Note S$’000 S$’000
Defined benefit obligations 5,866 13,537 Defined benefit assets 8 – (7,148)
5,866 6,389
SEMBCORP INDUSTRIES ANNUAL REPORT 2015 259258 BUILDING THE FUTURE

NOTES TO THE FINANCIAL STATEMENTSYear ended December 31, 2015
19. Retirement Benefit Obligations (cont’d)
b. Defined Benefit Obligations (cont’d)
The weighted average duration of the defined benefit obligation at the end of the reporting period is 19 (2014: 16 to 19) years.
Principal actuarial assumptionsThe main financial assumptions used by the independent qualified actuaries to calculate the liabilities under FRS 19 were as follows:
Group
2015 2014
% %
Discount rate at December 31 3.8 3.7 Expected return on plan assets at December 31 3.8 4.5 – 5.5 Future rate of annual salary increases – 3.3 Future rate of pension increases 1.9 – 3.1 1.9 – 3.6
Assumptions regarding future mortality are based on published statistics and mortality tables. The expected remaining life expectancy of an individual retiring at age 65 is 21 (2014: 22) for male and 24 (2014: 25) for female.
20. Interest-bearing Borrowings
Group Company
2015 2014 2015 2014
Note S$’000 S$’000 S$’000 S$’000
Current Liabilities Secured term loans (b) 794,434 545,630 – – Unsecured term loans (c) 1,003,863 534,736 – – Bank overdrafts 14 2,023 1,993 – – Finance lease liabilities (d) 287 3,644 3 8 1,800,607 1,086,003 3 8Non-current Liabilities Non-convertible debentures (a) 10,523 – – – Secured term loans (b) 1,451,860 1,129,882 – – Unsecured term loans (c) 3,569,483 2,506,498 – – Finance lease liabilities (d) 476 12,198 – 3 5,032,342 3,648,578 – 3 6,832,949 4,734,581 3 11
Included in interest-bearing borrowings are S$1,181,325,000 (2014: S$822,679,000) of loans taken with a related corporation.
SEMBCORP INDUSTRIES ANNUAL REPORT 2015 261260 BUILDING THE FUTURE

NOTES TO THE FINANCIAL STATEMENTSYear ended December 31, 2015
20. Interest-bearing Borrowings (cont’d)
Effective interest rates and maturity of liabilities (excluding finance lease liabilities)
Group Company
2015 2014 2015 2014
% % % %
Floating rate loans 0.68 – 15.15 0.82 – 13.75 – – Fixed rate loans 1.10 – 14.90 0.72 – 14.00 – – Bonds & notes 2.22 – 4.25 0.87 – 4.25 – – Debentures 12.00 – – –
Group Company
2015 2014 2015 2014
S$’000 S$’000 S$’000 S$’000
Within 1 year 1,800,320 1,082,359 – – After 1 year but within 5 years 2,956,551 1,362,517 – – After 5 years 2,075,315 2,273,863 – –Total borrowings 6,832,186 4,718,739 – –
a. Non-convertible DebenturesDuring the year, a subsidiary had issued non-convertible debentures of INR 500 million at interest rate of 12.0% per annum and repayable from 2020 to 2023.
b. Secured Term LoansThe secured term loans are collaterised by the following assets:
Group
Net Book Value
2015 2014
Note S$’000 S$’000
Property, plant and equipment 3(i) 2,903,500 2,068,035 Unit trusts and funds 7 26,219 – Trade and other receivables 8 428,195 92,840 Intangible assets 10 487 484 Inventories 12 63,663 – Cash and cash equivalents 14 104,497 79,282 Net assets of a subsidiary – 181,110 Equity share of a subsidiary 402,431 74,035
20. Interest-bearing Borrowings (cont’d)
c. Unsecured Term LoansIncluded in the unsecured term loans are the following medium term notes of the Group:
The Company jointly with Sembcorp Financial Services Pte Ltd (SFS), a wholly-owned subsidiary of the Company, has a S$2 billion Multicurrency Multi-Issuer Debt Issuance Programme (the “Programme”), pursuant to which the Company, together with SFS and certain other subsidiaries of the Company (the “Issuing Subsidiaries”), may from time to time issue Notes and Securities under the Programme subject to availability of funds from the market. The obligations of the Issuing Subsidiaries under the Programme are fully guaranteed by the Company.
As at December 31, 2015, SFS has the following outstanding medium term notes issued under the Programme:
Principal
Year of Year of amount
Nominal interest rate issue maturity S$’000
S$ medium term notes 3.7325% 2010 2020 300,000 S$ medium term notes 4.25% 2010 2025 100,000 S$ medium term notes 6 month SOR + 0.55% 2010 2017 100,000 S$ medium term notes 3.64% 2013 2024 200,000 S$ medium term notes 2.94% 2014 2021 100,000 S$ medium term notes 3.593% 2014 2026 150,000
950,000
Apart from the medium term notes issued by SFS, the Company has S$800 million outstanding perpetual securities of which S$200 million was issued in 2013 and another S$600 million in 2015 under the Programme. The perpetual securities are accounted as equity of the Group.
As at December 31, an amount of S$140,000,000 (2014: S$140,000,000) medium term notes was held by a related corporation.
Sembcorp Marine Ltd (SCM), a subsidiary of the Company has a S$2 billion Multicurrency Multi-Issuer Debt Issuance Programme (the “Programme”) pursuant to which SCM, together with its subsidiaries, Jurong Shipyard Pte Ltd, Sembcorp Marine Repairs & Upgrades Pte Ltd (formerly known as Sembawang Shipyard Pte Ltd) and SMOE Pte Ltd (the “Issuing SCM Subsidiaries”), may from time to time issue the notes, subject to availability of funds from the market. The obligations of Issuing SCM Subsidiaries under the Programme are fully guaranteed by SCM.
Under the Programme, SCM or any of the Issuing SCM Subsidiaries may from time to time issue notes in series or tranches in Singapore Dollars or any other currency. Such notes are listed on the Singapore Exchange Securities Trading Limited and are cleared through the Central Depository (Pte) Ltd. The notes are redeemable at par.
SEMBCORP INDUSTRIES ANNUAL REPORT 2015 263262 BUILDING THE FUTURE

NOTES TO THE FINANCIAL STATEMENTSYear ended December 31, 2015
20. Interest-bearing Borrowings (cont’d)
c. Unsecured Term Loans (cont’d)
During the year, Jurong Shipyard Pte Ltd has issued the following medium term notes under the Programme:
Principal
Year of Year of amount
Nominal interest rate issue maturity S$’000
S$ medium term notes 2.95% 2014 2021 275,000 S$ medium term notes 3.85% 2014 2029 325,000
600,000
As at December 31, 2015, an amount of S$167,500,000 (2014: S$167,500,000) medium term notes was held by a related corporation.
d. Finance Lease LiabilitiesThe Group has obligations under finance leases that are payable as follows:
2015 2014
Payments Interest Principal Payments Interest Principal
S$’000 S$’000 S$’000 S$’000 S$’000 S$’000
Group Within 1 year 336 49 287 4,118 474 3,644 After 1 year but within 5 years 524 48 476 8,100 1,182 6,918 After 5 years – – – 5,595 315 5,280Total 860 97 763 17,813 1,971 15,842
Under the terms of the lease agreements, no contingent rents are payable. The interest rates range from 1.60% to 13.92% (2014: 1.75% to 15.57%) per annum.
The Company has obligations under finance leases that are payable as follows:
2015 2014
Payments Interest Principal Payments Interest Principal
S$’000 S$’000 S$’000 S$’000 S$’000 S$’000
Company Within 1 year 3 – 3 13 5 8 After 1 year but within 5 years – – – 3 – 3Total 3 – 3 16 5 11
Under the terms of the lease agreements, no contingent rents are payable. The effective interest rate is 8.4% (2014: 6.09%) per annum.
21. Share Capital
Group and Company
No. of ordinary shares
2015 2014
Issued and fully paid, with no par value: At the beginning and end of the year 1,787,547,732 1,787,547,732
The holders of ordinary shares are entitled to receive dividends as declared from time to time and are entitled to one vote per share at meetings of the Company. All shares rank equally with regard to the Company’s residual assets.
22. Other Reserves
Group Company
2015 2014 2015 2014
Note S$’000 S$’000 S$’000 S$’000
Distributable Reserve for own shares (a) (8,645) (15,041) (8,645) (15,041) Non-distributable Currency translation reserve (b) (84,321) (200,461) – – Capital reserve (c) 114,766 304,010 (121,709) (109,042) Merger reserve (d) 29,201 29,201 – – Share-based payments reserve (e) (18,050) (18,562) 116,694 102,990 Fair value reserve (f) 27,398 (11,958) – – Hedging reserve (g) (203,287) (217,486) – (1,293) (142,938) (130,297) (13,660) (22,386)
a. Reserve for Own SharesAt December 31, 2015, the Company held 2,371,253 (2014: 3,319,241) of its own uncancelled shares as treasury shares.
b. Currency Translation ReserveThe currency translation reserve comprises:
i. Foreign exchange differences arising from the translation of the financial statements of foreign operations whose functional currencies are different from the presentation currency of the Group;
ii. Exchange differences on monetary items which form part of the Group’s net investment in foreign operations; and
iii. Gains or losses on instruments used to hedge the Group’s net investment in foreign operations that are determined to be effective hedges.
SEMBCORP INDUSTRIES ANNUAL REPORT 2015 265264 BUILDING THE FUTURE

NOTES TO THE FINANCIAL STATEMENTSYear ended December 31, 2015
22. Other Reserves (cont’d)
c. Capital reserve comprises acquisitions and disposals with non-controlling interests that do not result in a change of control, capitalisation of accumulated profits for the issue of bonus shares, capital reserve (net of goodwill) on consolidation and equity accounting, capital redemption reserve, convertible loan stock reserve and transfer from revenue reserve in accordance with the regulations of the foreign jurisdiction in which the Group’s subsidiaries, associates and joint ventures operate, and treasury shares of a subsidiary.
In 2015, capital reserve also comprises the charge of the present value of a put liability in relation to put options entered into with the non-controlling shareholders on their equity interests in a subsidiary. Subsequent changes in the carrying value of the put liability are also recognised within capital reserve.
d. Merger reserve represents the difference between the value of shares issued by the Company in exchange for the value of shares acquired in respect of the acquisition of subsidiaries accounted for under the pooling-of-interest method.
e. Share-based payments reserve comprises the cumulative value of services received from employees recorded on grant of equity-settled share options, performance shares and performance based restricted shares. The expense for service received is recognised over the performance period and / or vesting period.
f. Fair value reserve includes the cumulative net change in the fair value of available-for-sale investments until the investments are derecognised.
g. Hedging reserve comprises the effective portion of the cumulative net change in the fair value of cash flow hedging instruments related to hedged transactions that have not yet occurred.
23. Perpetual SecuritiesOn May 20, 2015, the Company issued subordinated perpetual securities (the “perpetual securities”) with an aggregate principal amount of S$600,000,000. Incremental costs incurred amounting to S$3,449,000 were recognised in equity as a deduction from proceeds.
Such perpetual securities bear distributions at a rate of 4.75% per annum, payable semi-annually. Subject to the relevant terms and conditions in the offering memorandum, the Company may elect to defer making distributions on the perpetual securities, and is not subject to any limits as to the number of times a distribution can be deferred.
As a result, the perpetual securities do not meet the definition for classification as a financial liability under FRS 32 Financial Instruments: Disclosure and Presentation. The whole instrument is presented within equity, and distributions are treated as dividends.
During the financial year, distributions amounting to S$27,939,000 (2014: S$9,595,000) were accrued to perpetual security holders.
As at December 31, an amount of S$17,000,000 (2014: S$7,000,000) perpetual securities was held by a related corporation.
24. Other Comprehensive IncomeTax effects relating to each component of other comprehensive income:
Group Group
2015 2014
Before tax Tax expense Net of tax Before tax Tax expense Net of tax
S$’000 S$’000 S$’000 S$’000 S$’000 S$’000
Foreign currency translation differences for foreign operations 116,765 – 116,765 129,982 – 129,982 Exchange differences on monetary items forming part of net investment in a foreign operation 765 – 765 (2,280) – (2,280) Share of other comprehensive income of associates and joint ventures (23,835) – (23,835) (8,654) – (8,654) Cash flow hedges: net movement in hedging reserves (Note (a)) 43,628 (7,520) 36,108 (156,066) 26,966 (129,100) Available-for-sale financial assets: net movement in fair value reserve (Note (b)) 48,611 18 48,629 (33,572) – (33,572) Defined benefit plan actuarial gains and losses (7,539) 1,310 (6,229) 21,113 (4,337) 16,776Other comprehensive income 178,395 (6,192) 172,203 (49,477) 22,629 (26,848)
Group
2015 2014
S$’000 S$’000
a. Cash flow hedges:Net change in fair value of hedging instruments (92,754) (178,748) Amount reclassified to profit or loss 136,382 22,682 Tax expense (7,520) 26,966Net movement in the hedging reserve during the year recognised in other comprehensive income 36,108 (129,100)
b. Available-for-sale financial assets:Changes in fair value (2,958) (33,572) Amount reclassified to profit or loss 51,569 – Tax expense 18 –Net changes in fair value during the year recognised in other comprehensive income 48,629 (33,572)
SEMBCORP INDUSTRIES ANNUAL REPORT 2015 267266 BUILDING THE FUTURE

NOTES TO THE FINANCIAL STATEMENTSYear ended December 31, 2015
25. Turnover
Group
2015 2014
S$’000 S$’000
Sale of gas, water, electricity and related services 4,099,551 4,730,457 Ship and rig repair, building, conversion, charter hire and related services 4,944,732 5,804,792 Construction and engineering related activities 303,092 171,868 Service concession revenue 47,173 53,041 Others 150,073 134,502 9,544,621 10,894,660
26. Finance Income and Finance Costs
Group
2015 2014
S$’000 S$’000
Finance income – associates and joint ventures 4,988 3,474 – bank and others 27,868 15,957 32,856 19,431
The finance income arose from loan and receivables.
Finance costs Interest paid and payable to, measured at amortised cost: – banks and others 232,118 67,753 Amortisation of capitalised transaction costs 6,928 3,920 Unwind of discount on restoration costs 261 – Interest rate swap – termination of interest rate swaps (1,122) (1,541) – changes in fair value through profit or loss (201) – 237,984 70,132
27. Tax (Credit) / Expense
Group
2015 2014
S$’000 S$’000
Current tax expense Current year 104,989 146,489 Over provided in prior years (29,664) (12,434) Foreign withholding tax 2,224 2,363 77,549 136,418Deferred tax expense Movements in temporary differences (100,825) 33,096 Over provided in prior years (4,776) (7,358) (105,601) 25,738Tax (credit) / expense (28,052) 162,156
Reconciliation of effective tax rate Profit for the year 454,402 1,084,282 Total tax expense (28,052) 162,156 Share of results of associates and joint ventures, net of tax (6,199) (158,261)Profit before share of results of associates and joint ventures, and tax expense 420,151 1,088,177 Tax using Singapore tax rate of 17% 71,426 184,990 Effect of different tax rates in foreign jurisdictions 410 2,884 Tax incentives and income not subject to tax (131,503) (48,232) Expenses not deductible for tax purposes 47,988 26,818 Utilisation of deferred tax benefits not previously recognised (2,073) (1,306) Over provided in prior years (34,440) (19,792) Deferred tax benefits not recognised 28,705 24,079 Foreign withholding tax 2,224 2,363 Tax adjustment on changes in undistributed profits from foreign entities (8,576) 575 Others (2,213) (10,223)Tax (credit) / expense (28,052) 162,156
SEMBCORP INDUSTRIES ANNUAL REPORT 2015 269268 BUILDING THE FUTURE

NOTES TO THE FINANCIAL STATEMENTSYear ended December 31, 2015
28. Profit for the YearThe following items have been included in arriving at profit for the year:
Group
2015 2014
Note S$’000 S$’000
a. ExpensesAllowance made for / (reversal of) impairment losses (net) – property, plant and equipment 3 70,452 – – investment property 4 – (3,815) – joint ventures – 3,349 – interests in other investments – (16) – receivables 36(b) 198,223 (1,516) – inventory obsolescence 12 2,492 3,183 Amortisation of intangible assets 10 20,360 15,575 Audit fees paid / payable – auditors of the Company 1,955 1,430 – overseas affiliates of the auditors of the Company 822 1,182 – other auditors 717 333 Non-audit fees paid / payable – auditors of the Company 826 731 – overseas affiliates of the auditors of the Company 253 352 – other auditors 445 392 Depreciation – property, plant and equipment 3 383,557 298,389 – investment properties 4 1,044 870 Professional fee paid to directors or a firm in which a director is a member 1 1 Operating lease expenses 31,994 44,242 Property, plant and equipment written off 1,317 7,506 Intangible assets written off 10 354 – Bad debts written off 3,247 750 Net change in fair value of cash flow hedges 119,788 24,695 Work-in-progress written-down 85,518 – Provision for foreseeable losses on construction work-in-progress 277,961 –
Staff costs Staff costs 863,954 901,086
Included in staff costs are: Equity-settled share-based payments 22,894 29,698 Cash-settled share-based payments (827) 5,352 Contributions to: – defined benefit plan (3,427) 33 – defined contribution plan 46,661 43,813
28. Profit for the Year (cont’d)
Group
2015 2014
Note S$’000 S$’000
b. Other incomeGrants received – income related 7,741 4,265 Gross dividend income from available-for-sale financial assets 1,026 1,194 Gain / (loss) on disposal of – property, plant and equipment 661 4,150 – investment properties 2,983 3,097 – subsidiaries 72,409 – – associate 353,157 – Gain on acquisition – 13,505 Fair value gain on re-measurement of pre-existing equity interest in joint venture, which became a subsidiary 34 – 3,792 Settlement amounts from customers 24,150 –
c. Other expenses (net)Net exchange loss (14,728) (9,499) Net change in fair value of cash flow hedges (34,691) (26,755) Net change in fair value of financial assets measured at fair value through profit or loss (9,088) 15,530 Impairment losses on available-for-sale financial assets 7 (51,569) –
29. Non-controlling InterestsThe following subsidiary has material non-controlling interests:
Ownership interests held by
non-controlling interests
Country of Operating 2015 2014
Name of company incorporation Segment % %
Sembcorp Marine Group Singapore Marine 39.0 39.0
SEMBCORP INDUSTRIES ANNUAL REPORT 2015 271270 BUILDING THE FUTURE

NOTES TO THE FINANCIAL STATEMENTSYear ended December 31, 2015
29. Non-controlling Interests (cont’d)
The following summarises the financial information of the Group’s subsidiary with material non-controlling interest, based on its (consolidated) financial statements prepared in accordance with FRS.
Sembcorp Marine Group
S$’000
2015 Revenue 4,968,132Loss for the year (299,966) Other comprehensive income 99,429 Total comprehensive income (200,537) Attributable to non-controlling interests: Loss for the year (123,237) Other comprehensive income 45,391 Total comprehensive income (77,846) Non-current assets 4,084,086 Current assets 5,117,036 Non-current liabilities (2,639,797) Current liabilities (3,897,046)Net assets 2,664,279 Net assets attributable to non-controlling interests 1,127,277 Cash flows used in operating activities (989,099) Cash flows used in investing activities (932,197) Cash flows from financing activities 1,467,085Net decrease in cash and cash equivalents (454,211)
Dividends paid to non-controlling interests (14,558)
2014 Revenue 5,832,595Profit for the year 601,275 Other comprehensive income 4,803 Total comprehensive income 606,078 Attributable to non-controlling interests: Profit for the year 259,671 Other comprehensive income 5,951 Total comprehensive income 265,622 Non-current assets 3,671,302 Current assets 4,567,118 Non-current liabilities (1,657,796) Current liabilities (3,448,597)Net assets 3,132,027 Net assets attributable to non-controlling interests 1,318,784 Cash flows used in operating activities (508,273) Cash flows used in investing activities (770,389) Cash flows from financing activities 667,742Net decrease in cash and cash equivalents (610,920)
Dividends paid to non-controlling interests (13,399)
30. Earnings Per Share
Group
2015 2014
S$’000 S$’000
a. Basic earnings per shareBasic earnings per share is based on: i. Profit attributable to owners of the Company: Profit attributable to equity holders of the Company 548,855 801,096 Less: Profit attributable to perpetual security holders of the Company (27,939) (9,595)
Profit attributable to owners of the Company 520,916 791,501
No. of shares No. of shares
’000 ’000
ii. Weighted average number of ordinary shares: Issued ordinary shares at January 1 1,784,228 1,784,782 Effect of share options exercised, performance shares and restricted shares released 2,356 3,180 Effect of own shares held (819) (1,858)
Weighted average number of ordinary shares December 31 1,785,765 1,786,104
Group
2015 2014
S$’000 S$’000
b. Diluted earnings per shareDiluted earnings per share is based on: i. Profit attributable to owners of the Company: Profit attributable to equity holders of the Company 548,855 801,096 Less: Profit attributable to perpetual security holders of the Company (27,939) (9,595)
Profit attributable to owners of the Company 520,916 791,501
No. of shares No. of shares
’000 ’000
ii. Weighted average number of shares issued used in the calculation of basic earnings per share 1,785,765 1,786,104 Weighted average number of unissued ordinary shares from: – share options 187 424 – performance shares 2,787 2,773 – restricted shares 10,659 10,223
Weighted average number of ordinary shares 1,799,398 1,799,524
SEMBCORP INDUSTRIES ANNUAL REPORT 2015 273272 BUILDING THE FUTURE

NOTES TO THE FINANCIAL STATEMENTSYear ended December 31, 2015
30. Earnings Per Share (cont’d)
For the purpose of calculating diluted earnings per ordinary share, the weighted average number of ordinary shares outstanding is adjusted for the effects of all dilutive potential ordinary shares. The Company has three categories of dilutive potential ordinary shares: share options, performance shares and restricted shares.
For share options, the weighted average number of ordinary shares in issue is adjusted to take into account the dilutive effect arising from the exercise of all outstanding share options granted to employees where such shares would be issued at a price lower than the fair value (average share price during the year). The difference between the weighted average number of shares to be issued at the exercise prices under the options and the weighted average number of shares that would have been issued at the fair value (i.e. average market price) based on assumed proceeds from the issue of these shares are treated as ordinary shares issued for no consideration. The number of such shares issued for no consideration is added to the number of ordinary shares outstanding in the computation of diluted earnings per share. No adjustment is made to the profit attributable to owners of the Company. The average market value of the Company’s shares for purposes of calculating the dilutive effect of share options was based on quoted market prices for the period during which the options were outstanding.
For performance shares and restricted shares, the weighted average number of ordinary shares in issue is adjusted as if all dilutive performance shares and restricted shares are released. No adjustment is made to the profit attributable to owners of the Company.
31. DividendsSubject to the approval by the shareholders at the next Annual General Meeting, the directors have proposed a final ordinary one-tier tax exempt dividend of 6.0 cents per share (2014: one-tier tax exempt dividend of 11.0 cents per share) amounting to an estimated net dividend of S$107,111,000 (2014: S$196,265,000) in respect of the year ended December 31, 2015, based on the number of issued shares as at December 31, 2015.
The proposed dividend of 6.0 (2014: 11.0) cents per share has not been included as a liability in the financial statements.
Group and Company
2015 2014
S$’000 S$’000
Dividend paid Interim one-tier tax exempt dividend of 5.0 cents per share in respect of year 2015 (2014: 5.0 cents per share in respect of year 2014) 89,338 89,351 Final one-tier tax exempt dividend of 11.0 cents per share in respect of year 2014 (2014: 15.0 cents per share in respect of year 2013) 196,528 268,056 Final bonus one-tier tax exempt dividend of nil cents per share in respect of year 2014 (2014: 2.0 cents per share in respect of year 2013) – 35,717 285,866 393,124
32. Share-based Incentive PlansThe Company’s Performance Share Plan (SCI PSP 2010) and Restricted Share Plan (SCI RSP 2010) (collectively, the “2010 Share Plans”) were approved and adopted by the shareholders at an Extraordinary General Meeting of the Company held on April 22, 2010. The 2010 Share Plans replaced the Share Plans which were approved and adopted by the shareholders at an Extraordinary General Meeting of the Company held on June 5, 2000 and expired in 2010.
The Executive Resource & Compensation Committee (the “Committee”) of the Company has been designated as the Committee responsible for the administration of the Share Plans. The Committee comprises the following members, all of whom are directors:
Ang Kong Hua (Chairman)Margaret LuiTan Sri Mohd Hassan MaricanDr Teh Kok Peng (appointed on April 22, 2015)
The SCI RSP 2010 is the incentive scheme for directors and employees of the Group whereas SCI PSP 2010 is aimed primarily at key executives of the Group.
The 2010 Share Plans are intended to increase the Company’s flexibility and effectiveness in its continuing efforts to attract, retain and incentivise participants to higher standards of performance and encourage greater dedication and loyalty by enabling the Company to give recognition to past contributions and services; as well as motivating participants to contribute to the long-term prosperity of the Group. The 2010 Share Plans will strengthen the Company’s competitiveness in attracting and retaining talented key senior management and senior executives.
The SCI RSP 2010 is intended to apply to a broad base of senior executives as well as to the non-executive directors, while the SCI PSP 2010 is intended to apply to a select group of key senior management. Generally, it is envisaged that the range of performance targets to be set under the SCI RSP 2010 and the SCI PSP 2010 will be different, with the latter emphasising stretched or strategic targets aimed at sustaining longer term growth.
The 2010 Share Plans will provide incentives to high performing key senior management and senior executives to excel in their performance and encourage greater dedication and loyalty to the Company. Through the 2010 Share Plans, the Company will be able to motivate key senior management and senior executives to continue to strive for the Group’s long-term shareholder value. In addition, the 2010 Share Plans aim to foster a greater ownership culture within the Group which align the interests of participants with the interests of shareholders, and to improve performance and achieve sustainable growth for the Company in the changing business environment.
The 2010 Share Plans use methods fairly common among major local and multinational companies to incentivise and motivate key senior management and senior executives to achieve pre-determined targets which create and enhance economic value for shareholders. The Company believes that the 2010 Share Plans will be effective tools in motivating key senior management and senior executives to strive to deliver long-term shareholder value.
While the 2010 Share Plans cater principally to Group executives, it is recognised that there are other persons who can make significant contributions to the Group through their close working relationship with the Group. Such persons include employees of associated companies over which the Company has operational control.
A participant’s awards under the 2010 Share Plans will be determined at the sole discretion of the Committee. In considering an award to be granted to a participant, the Committee may take into account, inter alia, the participant’s performance during the relevant period, and his capability, entrepreneurship, scope of responsibility and skill set.
SEMBCORP INDUSTRIES ANNUAL REPORT 2015 275274 BUILDING THE FUTURE

NOTES TO THE FINANCIAL STATEMENTSYear ended December 31, 2015
32. Share-based Incentive Plans (cont’d)
a. Share Option PlanOther information regarding the 2010 Share Plans and Share Option Plan is as follows:
Under the rules of the Share Option Plan, participants who ceased to be employed by the Group or the associated company by reason of ill health, injury or disability, redundancy, retirement at or after the legal retirement age, retirement before the legal retirement age, death, etc., or any other event approved by the Committee, may be allowed by the Committee to retain their unexercised options. The Committee may determine the number of shares comprised in that option which may be exercised and the period during which such option shall be exercisable, being a period not later than the expiry of the exercise period in respect of that option. Such option may be exercised at any time notwithstanding that the date of exercise of such option falls on a date prior to the first day of the exercise period in respect of such option.
Other information regarding the Share Option Plan is as follows:
i. The exercise price of the options can be set at market price or a discount to the market price not exceeding 20% of the market price in respect of options granted at the time of grant. Market price is the volume-weighted average price for the shares on the Singapore Exchange Securities Trading Limited (SGX-ST) over the three consecutive trading days prior to grant date of that option. For all options granted to date, the exercise prices are set at market price.
ii. After the first 12 months of lock-out period, the Group imposed a further vesting of 4 years for managers and above for retention purposes.
iii. In 2015 and 2014, all options were settled by the issuance of treasury shares.
iv. The options granted expire after 5 years for non-executive directors and associated company’s employees, and 10 years for the employees of the Group. There are no outstanding share options for non-executive directors.
v. All options will expire on June 9, 2016.
At the end of the year, details of the options granted under the Share Option Plan on unissued ordinary shares of the Company are as follows:
Sembcorp Industries Ltd Ordinary shares 2015 Options
Options cancelled / Options Options Options
Exercise outstanding lapsed / outstanding exercisable exercisable
Date of grant price at Options not at at at
of options per share Jan 1, 2015 exercised accepted Dec 31, 2015 Jan 1, 2015 Dec 31, 2015 Exercise period
01/07/2005 S$2.37 121,250 (71,000) (50,250) – 121,250 – 02/07/2006 to 01/07/2015
21/11/2005 S$2.36 176,750 (94,000) (82,750) – 176,750 – 22/11/2006 to 21/11/2015
09/06/2006 S$2.52 373,299 (53,750) – 319,549 373,299 319,549 10/06/2007 to 09/06/2016
671,299 (218,750) (133,000) 319,549 671,299 319,549
32. Share-based Incentive Plans (cont’d)
a. Share Option Plan (cont’d)
Sembcorp Industries Ltd Ordinary shares 2014 Options
Options cancelled / Options Options Options
Exercise outstanding lapsed / outstanding exercisable exercisable
Date of grant price at Options not at at at
of options per share Jan 1, 2014 exercised accepted Dec 31, 2014 Jan 1, 2014 Dec 31, 2014 Exercise period
17/05/2004 S$0.99 26,500 (3,625) (22,875) – 26,500 – 18/05/2005 to 17/05/2014
22/11/2004 S$1.16 29,375 (5,875) (23,500) – 29,375 – 23/11/2005 to 22/11/2014
01/07/2005 S$2.37 139,875 (15,625) (3,000) 121,250 139,875 121,250 02/07/2006 to 01/07/2015
21/11/2005 S$2.36 217,625 (36,875) (4,000) 176,750 217,625 176,750 22/11/2006 to 21/11/2015
09/06/2006 S$2.52 809,049 (431,750) (4,000) 373,299 809,049 373,299 10/06/2007 to 09/06/2016
1,222,424 (493,750) (57,375) 671,299 1,222,424 671,299
At the end of the financial year, details of the options granted under the Share Option Plan on unissued ordinary shares of Sembcorp Marine Ltd are as follows:
Sembcorp Marine Ltd Ordinary shares 2015
Options
Options cancelled / Options Options Options
Exercise outstanding lapsed / outstanding exercisable exercisable
Date of grant price at Options not at at at
of options per share Jan 1, 2015 exercised accepted Dec 31, 2015 Jan 1, 2015 Dec 31, 2015 Exercise period
11/08/2005 S$2.11 667,190 (392,000) (275,190) – 667,190 – 12/08/2006 to 11/08/2015
02/10/2006 S$2.38 1,009,312 (22,000) (14,000) 973,312 1,009,312 973,312 03/10/2007 to 02/10/2016
1,676,502 (414,000) (289,190) 973,312 1,676,502 973,312
2014 Options
Options cancelled / Options Options Options
Exercise outstanding lapsed / outstanding exercisable exercisable
Date of grant price at Options not at at at
of options per share Jan 1, 2014 exercised accepted Dec 31, 2014 Jan 1, 2014 Dec 31, 2014 Exercise period
10/08/2004 S$0.74 168,710 (129,760) (38,950) – 168,710 – 11/08/2005 to 10/08/2014
11/08/2005 S$2.11 857,140 (173,500) (16,450) 667,190 857,140 667,190 12/08/2006 to 11/08/2015
02/10/2006 S$2.38 1,134,329 (109,617) (15,400) 1,009,312 1,134,329 1,009,312 03/10/2007 to 02/10/2016
2,160,179 (412,877) (70,800) 1,676,502 2,160,179 1,676,502
SEMBCORP INDUSTRIES ANNUAL REPORT 2015 277276 BUILDING THE FUTURE

NOTES TO THE FINANCIAL STATEMENTSYear ended December 31, 2015
32. Share-based Incentive Plans (cont’d)
a. Share Option Plan (cont’d)
Except as disclosed above, there were no unissued shares of the Company or its subsidiaries under options granted by the Company or its subsidiaries as at the end of the financial year.
Sembcorp Industries Ltd’s options exercised in 2015 and 2014 were all settled by way of issuance of treasury shares. Sembcorp Industries Ltd’s options were exercised on a regular basis throughout the year. The weighted average share price during the year was S$3.81 (2014: S$5.16).
Sembcorp Marine Ltd’s options exercised in 2015 resulted in 414,000 (2014: 412,877) ordinary shares being issued at a weighted average price of S$3.09 (2014: S$4.20). Sembcorp Marine Ltd’s options were exercised on a regular basis throughout the year. The weighted average share price during the year was S$2.68 (2014: S$3.77).
Fair value of share optionsThe fair value of services received is measured by reference to the fair value of share options granted.
b. Performance Share PlanUnder the Performance Share Plan (SCI PSP 2010), the awards granted conditional on performance targets are set based on medium-term corporate objectives at the start of each rolling three-year performance qualifying period. A specific number of performance shares shall be awarded at the end of the three-year performance cycle depending on the extent of the achievement of the performance conditions established at the onset.
The performance levels were calibrated based on Wealth Added and Total Shareholder Return. For awards granted from 2014 onwards, the performance levels were calibrated based on Wealth Added, Total Shareholder Return and Earnings per share. A minimum threshold performance must be achieved to trigger an achievement factor, which in turn determines the number of shares to be finally awarded. Performance shares to be delivered will range between 0% to 150% of the conditional performance shares awarded.
To create alignment between senior management and other employees at the time of vesting, SCI PSP 2010 has in place a plan trigger. Under this trigger mechanism, the performance shares for the performance period 2015 to 2017 will be vested to the senior management participants only if the restricted shares for the performance period 2016 to 2017 are vested, subject to the achievement of the performance conditions for the respective performance periods.
Senior management participants are required to hold a minimum percentage of the shares released to them under the Performance Share Plan to maintain a beneficial ownership stake in the Group, for the duration of their employment or tenure with the Group. A maximum cap is set based on a multiple of the individual participant’s annual base salary. Any excess can be sold off, but in the event of a shortfall, they have a two calendar year period to meet the minimum percentage requirement.
32. Share-based Incentive Plans (cont’d)
b. Performance Share Plan (cont’d)
i. Sembcorp Industries Ltd Performance SharesThe details of the movement of the performance shares of Sembcorp Industries Ltd awarded during the year are as follows:
2015 2014
At January 1 2,004,861 2,169,723 Conditional performance shares awarded 831,250 625,000 Performance shares lapsed arising from targets not met (754,861) (292,249) Conditional performance shares released – (497,613)At December 31 2,081,250 2,004,861
With the Committee’s approval on the achievement factor for the achievement of the performance targets for the performance period 2012 to 2014 (2014: performance period 2011 to 2013), no performance shares were released via the issuance of treasury shares (2014: 497,613).
In 2015, 754,861 (2014: 292,249) performance shares were lapsed for under-achievement of the performance targets for the performance period 2012 to 2014 (2014: 2011 to 2013).
The total number of performance shares in awards granted conditionally and representing 100% of targets to be achieved, but not released as at end 2015, was 2,081,250 (2014: 2,004,861). Based on the multiplying factor, the actual release of the awards could range from zero to a maximum of 3,121,875 (2014: 3,007,292) performance shares.
ii. Performance shares of a listed subsidiaryThe details of the movement of the performance shares of Sembcorp Marine Ltd awarded during the year are as follows:
2015 2014
At January 1 2,810,000 1,915,000 Conditional performance shares awarded 1,215,000 1,480,000 Conditional performance shares lapsed (150,000) (62,225) Performance shares lapsed arising from targets not met (675,000) (360,715) Conditional performance shares released – (162,060)At December 31 3,200,000 2,810,000
No performance shares of Sembcorp Marine Ltd were awarded to the directors of the Company.
With the Sembcorp Marine Ltd’s committee’s approval on the achievement factor for the achievement of the performance targets for the performance period 2012 to 2014 (2014: performance period 2011 to 2013), no performance shares were released via the issuance of treasury shares (2014: 162,060).
In 2015, 675,000 (2014: 360,715) performance shares were lapsed for under-achievement of the performance targets for the performance period 2012 to 2014 (2014: 2011 to 2013).
The total number of performance shares in awards granted conditionally and representing 100% of targets to be achieved, but not released as at December 31, 2015, was 3,200,000 (2014: 2,810,000). Based on the multiplying factor, the actual release of the awards could range from zero to a maximum of 4,800,000 (2014: 4,215,000) performance shares.
SEMBCORP INDUSTRIES ANNUAL REPORT 2015 279278 BUILDING THE FUTURE

NOTES TO THE FINANCIAL STATEMENTSYear ended December 31, 2015
32. Share-based Incentive Plans (cont’d)
b. Performance Share Plan (cont’d)
ii. Performance shares of a listed subsidiary (cont’d)
Fair value of performance sharesThe fair values of the performance shares are estimated using a Monte Carlo simulation methodology at the grant dates.
The fair values of performance shares granted during the year are as follows:
Fair value Fair value Fair value Fair value
of Sembcorp of Sembcorp of Sembcorp of Sembcorp
Industries Ltd Industries Ltd Marine Ltd Marine Ltd
performance performance performance performance
shares shares shares shares
granted on granted on granted on granted on
May 11, 2015 May 9, 2014 May 27, 2015 June 15, 2014
Fair value at measurement date S$2.44 S$3.57 S$1.40 S$1.35
Assumptions under the Monte Carlo model Share price S$4.29 S$5.40 S$2.99 S$4.04 Expected volatility: Sembcorp Industries Ltd / Sembcorp Marine Ltd 18.0% 24.0% 18.3% 26.1% Morgan Stanley Capital International (MSCI) AC Asia Pacific excluding Japan Industrials Index 11.8% 17.2% 11.6% 17.0%Correlation with MSCI (33.2%) 50.2% 39.5% 60.6%Risk-free interest rate 1.23% 0.6% 1.2% 0.6% Expected dividend 4.35% 3.0% 4.3% 4.2%
The expected volatility is based on the historical volatility over the most recent period that is close to the expected life of the performance shares.
During the year, the Group charged S$3,513,000 (2014: S$4,217,000) to the profit or loss based on the fair value of the performance shares at the grant date being expensed over the vesting period.
c. Restricted Share PlanUnder the Restricted Share Plan (SCI RSP 2010), the awards granted conditional on performance targets are set based on corporate objectives at the start of each rolling two-year performance qualifying period. The performance criteria for the restricted shares are calibrated based on Return on Total Assets (excluding Sembcorp Marine Ltd) and Group Profit from Operations (excluding Sembcorp Marine Ltd) for awards granted in 2015.
A minimum threshold performance must be achieved to trigger an achievement factor, which in turn determines the number of shares to be finally awarded. Based on the criteria, restricted shares to be delivered will range from 0% to 150% of the conditional restricted shares awarded.
The managerial participants of the Group will be awarded restricted shares under SCI RSP 2010, while the non-managerial participants of the Group will receive their awards in an equivalent cash value. This cash-settled notional restricted shares award for non-managerial participants is known as the Sembcorp Challenge Bonus.
32. Share-based Incentive Plans (cont’d)
c. Restricted Share Plan (cont’d)
A specific number of restricted shares shall be awarded at the end of the two-year performance cycle depending on the extent of the achievement of the performance conditions established at the onset. There is a further vesting period of three years after the performance period, during which one-third of the awarded shares are released each year to managerial participants. Non-managerial participants will receive the equivalent in cash at the end of the two-year performance cycle, with no further vesting conditions.
Senior management participants are required to hold a minimum percentage of the shares released to them under the Restricted Share Plan to maintain a beneficial ownership stake in the Group, for the duration of their employment or tenure with the Group. A maximum cap is set based on a multiple of the individual participant’s annual base salary. Any excess can be sold off, but in the event of a shortfall, they have a two calendar year period to meet the minimum percentage requirement.
To align the interests of the non-executive directors with the interests of shareholders, up to 30% of the aggregate directors’ fees approved by shareholders for a particular financial year may be paid out in the form of restricted shares awards under the SCI RSP 2010.
From 2011, non-executive directors were not awarded any shares except as part of their directors’ fees (except for Mr Tang Kin Fei, who is the Group President & CEO, and who does not receive any directors’ fees). In 2015 and 2014, the awards granted consisted of the grant of fully paid shares outright with no performance and vesting conditions attached, but with a selling moratorium. Non-executive directors are required to hold shares (including shares obtained by other means) worth at least one-time the annual base retainer; any excess may be sold as desired. A non-executive director can dispose of all of his shares one year after leaving the Board.
The actual number of shares awarded to each non-executive director will be determined by reference to the volume-weighted average price of a share on the SGX-ST over the 14 trading days from (and including) the day on which the shares are first quoted ex-dividend after the AGM (or, if the resolution to approve the final dividend is not approved, over the 14 trading days immediately following the date of the AGM). The number of shares to be awarded will be rounded down to the nearest hundred and any residual balance will be settled in cash. A non-executive director who steps down before the payment of the share component will receive all of his director’s fees for the year (calculated on a pro-rated basis, where applicable) in cash.
i. Sembcorp Industries Ltd Restricted SharesThe details of the movement of the restricted shares of Sembcorp Industries Ltd awarded during the year are as follows:
2015 2014
At January 1 7,332,929 6,955,014 Conditional restricted shares awarded 3,225,075 2,380,300 Conditional restricted shares lapsed (238,043) (267,349) Additional restricted shares awarded arising from targets met 291,760 1,150,350 Conditional restricted shares released (2,782,592) (2,885,386)At December 31 7,829,129 7,332,929
SEMBCORP INDUSTRIES ANNUAL REPORT 2015 281280 BUILDING THE FUTURE

NOTES TO THE FINANCIAL STATEMENTSYear ended December 31, 2015
32. Share-based Incentive Plans (cont’d)
c. Restricted Share Plan (cont’d)
i. Sembcorp Industries Ltd Restricted Shares (cont’d)
With the Committee’s approval on the achievement factor for the achievement of the performance targets for the performance period 2013 to 2014, a total of 802,901 restricted shares were released in 2015. For awards in relation to the performance period 2012 to 2013, a total of 1,033,746 (2014: 1,223,584) were released in 2015. For awards in relation to the performance period 2011 to 2012, a total of 823,882 (2014: 907,067) restricted shares were released in 2015. For awards in relation to the performance period 2010 to 2011, no restricted shares were released in 2015 (2014: 667,435). In 2015, there were 119,000 (2014: 87,300) shares released to non-executive directors. In 2015, there were additional 3,063 shares released to employees due to sale of a subsidiary. Of the restricted shares released, 53,354 (2014: 29,887) restricted shares were cash-settled. The remaining restricted shares were released via the issuance of treasury shares.
In 2015, additional 291,760 (2014: 1,150,350) restricted shares were awarded for the over-achievement of the performance targets for the performance period 2013 to 2014 (2014: performance period 2012 to 2013).
The total number of restricted shares outstanding, including award(s) achieved but not released, as at end 2015, was 7,829,129 (2014: 7,332,929). Of this, the total number of restricted shares in awards granted conditionally and representing 100% of targets to be achieved, but not released was 5,267,075 (2014: 4,383,100). Based on the multiplying factor, the actual release of the conditional awards could range from zero to a maximum of 7,900,613 (2014: 6,574,650) restricted shares.
Sembcorp Challenge BonusWith the Committee’s approval on the achievement factor for the achievement of the performance targets for the performance period 2013 to 2014 (2014: performance period 2012 to 2013), a total of S$1,792,563, equivalent to 375,838 (2014: S$3,346,469, equivalent to 558,210) notional restricted shares, were paid. A total of 440,000 (2014: 450,000) notional restricted shares of Sembcorp Industries Ltd’s shares were awarded in 2015 for the Sembcorp Challenge Bonus.
The total number of notional restricted shares in awards for the Sembcorp Challenge Bonus granted conditionally and representing 100% of targets to be achieved, but not released as at end 2015, was 890,000 (2014: 850,000). Based on the multiplying factor, the number of notional restricted shares to be converted into the funding pool could range from zero to a maximum of 1,335,000 (2014: 1,275,000).
32. Share-based Incentive Plans (cont’d)
c. Restricted Share Plan (cont’d)
ii. Restricted shares of a listed subsidiaryThe details of the movement of the restricted shares of Sembcorp Marine Ltd awarded during the year are as follows:
2015 2014
At January 1 8,262,801 8,545,150 Conditional restricted shares awarded 5,130,501 3,049,980 Conditional restricted shares lapsed (420,956) (283,728) Additional restricted shares awarded arising from targets met 198,159 508,977 Conditional restricted shares released (3,068,920) (3,557,578)At December 31 10,101,585 8,262,801
With the Sembcorp Marine Ltd’s committee’s approval on the achievement factor for the achievement of the performance targets for the performance period 2013 to 2014, a total of 1,013,899 restricted shares were released. For awards in relation to the performance period 2012 to 2013, a total of 950,779 (2014: 1,154,566) restricted shares were released. For awards in relation to the performance period 2011 to 2012, a total of 945,042 (2014: 1,074,512) restricted shares were released. For awards in relation to the performance period 2010 to 2011, no restricted shares were released (2014: 1,232,100). In 2015, 159,200 (2014: 96,400) restricted shares released to non-executive directors. The restricted shares were released via the issuance of treasury shares.
In 2015, additional 198,159 (2014: 508,977) Sembcorp Marine Ltd’s restricted shares were awarded for the over-achievement of the performance targets for the performance period 2013 to 2014 (2014: performance period 2012 to 2013).
The total number of Sembcorp Marine Ltd’s restricted shares outstanding, including awards achieved but not released, as at December 31, 2015, was 10,101,585 (2014: 8,262,801). Of this, the total number of restricted shares in awards granted conditionally and representing 100% of targets to be achieved, but not released was 7,623,701 (2014: 5,450,570). Based on the multiplying factor, the actual release of the awards could range from zero to a maximum of 11,435,552 (2014: 8,175,855) restricted shares.
Challenge Bonus of a listed subsidiaryWith the Sembcorp Marine Ltd’s committee’s approval on the achievement factor for the achievement of the performance targets for the performance period 2013 to 2014 (2014: performance period 2012 to 2013), a total of S$2,849,108 (2014: S$4,122,758), equivalent to 942,290 (2014: 1,010,480) notional restricted shares, were paid.
A total of 2,140,509 (2014: 1,223,280) notional restricted shares were awarded on May 27, 2015 (2014: June 15, 2014) for the Sembcorp Marine Challenge Bonus.
The total number of notional restricted shares in awards for the Sembcorp Marine Challenge Bonus granted conditionally and representing 100% of targets to be achieved, but not released as at December 31, 2015, was 3,070,668 (2014: 2,066,240). Based on the multiplying factor, the number of notional restricted shares to be converted into the funding pool could range from zero to a maximum of 4,606,002 (2014: 3,099,360).
SEMBCORP INDUSTRIES ANNUAL REPORT 2015 283282 BUILDING THE FUTURE

NOTES TO THE FINANCIAL STATEMENTSYear ended December 31, 2015
32. Share-based Incentive Plans (cont’d)
c. Restricted Share Plan (cont’d)
ii. Restricted shares of a listed subsidiary (cont’d)
Fair value of restricted sharesThe fair values of the restricted shares are estimated using a Monte Carlo simulation methodology at the grant dates.
The fair values of restricted shares granted during the year are as follows:
Fair value Fair value Fair value Fair value
of Sembcorp of Sembcorp of Sembcorp of Sembcorp
Industries Ltd Industries Ltd Marine Ltd Marine Ltd
restricted restricted restricted restricted
shares shares shares shares
granted on granted on granted on granted on
May 11, 2015 May 9, 2014 May 27, 2015 June 15, 2014
Fair value at measurement date S$3.79 S$4.91 S$2.65 S$3.56
Assumptions under the Monte Carlo model Share price S$4.29 S$5.40 S$2.99 S$4.04 Expected volatility: Sembcorp Industries Ltd / Sembcorp Marine Ltd 18.0% 24.0% 18.3% 26.1% Risk-free interest rate 1.06% – 1.41% 0.4% – 0.9% 1.0% – 1.4% 0.4% – 0.9% Expected dividend 4.35% 3.0% 4.3% 4.2%
The expected volatility is based on the historical volatility over the most recent period that is close to the expected life of the restricted shares.
During the year, the Group charged S$18,492,000 (2014: S$25,481,000) to the profit or loss based on the fair value of restricted shares at the grant date being expensed over the vesting period.
Fair value of Sembcorp Challenge BonusDuring the year, the Group wrote back charges of S$827,000 (2014: charged S$5,352,000) to the profit or loss based on the market values of the shares at the balance sheet date. The fair value of the compensation cost is based on the notional number of restricted shares awarded for Sembcorp Challenge Bonus and the market price at the vesting date.
33. Disposal of subsidiaries and associatei. On April 16, 2015, the Group’s wholly-owned UK subsidiary, Sembcorp Holdings Limited, completed the sale of its 100%
stake in Sembcorp Bournemouth Water Investment (SBWI) to the Pennon group PLC (Pennon) for an enterprise value of £191.5 million (approximately S$393 million), with cash proceeds from the sale of £104.5 million (approximately S$214 million). The gain on disposal of S$54.7 million was recognised in other income.
ii. On August 24, 2015, the Group’s wholly-owned subsidiary, China Water Company (Zhumadian) Limited has completed the sale of its entire 51% stake in Zhumadian China Water Company Limited to Beijing Enfei Environmental Protection Co for RMB90 million (approximately S$19.5 million). The gain on disposal of S$17.7 million was recognised in other income.
Group
2015
Note S$’000
Property, plant and equipment 3 401,171 Long-term receivables 10,026 Intangible assets 10 38,113 Deferred tax assets 11 19 Inventories and work-in-progress 1,191 Trade and other receivables 32,919 Cash and cash equivalents 28,841 Trade and other payables (44,383) Current tax payable (472) Deferred tax liabilities 11 (44,613) Provisions 17 3,345 Retirement benefit obligations (2,837) Interest bearing borrowings (209,986) Other long-term payables (71,595)Net assets derecognised 141,739 Non-controlling interests 8,460 Realisation of currency translation reserve upon disposal 10,406 160,605 Gain on disposal of subsidiaries 28(b) 72,409Consideration received, satisfied in cash 233,014 Less: Cash and cash equivalents disposed of due to de-consolidation (28,841)Net cash inflow 204,173
iii. During the year, the Group’s wholly-owned subsidiary, Sembcorp Environment has disposed its 40% interest in SembSita Pacific Pte Ltd (SembSita) to 60% joint venture partner, Suez Environnement Asia (Suez), for a consideration of S$487.9 million and a gain of S$353.2 million has been recognised in other income.
34. Acquisition of Subsidiaries2015On February 13, 2015, Sembcorp acquired a 60% stake in Sembcorp Green Infra Limited (SGI), a renewable energy company in India with a wind and solar portfolio. Consequently, SGI’s financials were consolidated into the Group’s financial statements.
The principal activity of SGI is to sell power generated under a combination of long-term Power Purchase Agreements in India.
This acquisition marks Sembcorp’s entry into India’s attractive renewable energy market, and is a major step in the Group’s strategy to grow its renewable energy market.
SEMBCORP INDUSTRIES ANNUAL REPORT 2015 285284 BUILDING THE FUTURE

NOTES TO THE FINANCIAL STATEMENTSYear ended December 31, 2015
34. Acquisition of Subsidiaries (cont’d)
2015 (cont’d)
Revenue and profit contributionThe acquired business contributed revenue of S$115,460,000 and profit for the year of S$16,132,000 to the Group’s results for the period from February 13, 2015 to December 31, 2015.
Had SGI been consolidated from January 1, 2015, the Group’s consolidated revenue and consolidated profit for the year ended December 31, 2015 would have been S$9,549,286,000 and S$451,176,000 respectively.
Consideration transferredThe following table summarises the acquisition date fair value of each major class of consideration transferred:
2015
S$’000
a. Effect on cash flows of the GroupCash paid 232,483 Less: Cash and cash equivalents in subsidiary acquired (18,847)Cash outflow on acquisition 213,636
At fair value
Note S$’000
b. Identifiable assets acquired and liabilities assumedProperty, plant and equipment 3 712,005 Other financial assets 38,799 Intangible assets 10 66,835 Trade and other receivables 57,855 Deferred tax assets 11 4,344 Tax recoverable 3,548 Cash and cash equivalents 18,847Total assets 902,233 Trade and other payables 91,641 Provisions 17 3,268 Other financial liabilities 109 Current tax payable 1,012 Deferred tax liabilities 11 38,750 Retirement benefit obligations 19 135 Borrowings 437,795Total liabilities 572,710 Total net identifiable assets 329,523 Less: Non-controlling interests (140,147) Add: Goodwill 10 43,107Consideration transferred for the business 232,483
34. Acquisition of Subsidiaries (cont’d)
2015 (cont’d)
Measurement of fair valuesThe valuation techniques used for measuring the fair value of material assets acquired were as follows:
Assets acquired Valuation technique Key assumptions
Property, plant and equipment Freehold land – Sales comparison • Freehold land – Prevailing market rates of similar Buildings, Plant and machinery agricultural lands from real estate agent / – Depreciated replacement / property brokers. reproduction cost • Buildings, Plant and machinery – Current replacement costs were derived from market quotes received from suppliers / manufacturers.
Intangible assets Multi-period excess earnings • Revenue forecasted based on contracted tariffs as method (MEEM) per long-term Power Purchase Agreements. • The excess earning is obtained after deducting the Contributory Asset Charges (CACs) which represents the required return on all other assets employed to generate future income. • Discount rate of 17%.
Acquired receivablesIncluded in trade receivables are trade receivables stated at fair value of S$13,031,000. The gross contractual amount for the trade receivables due was S$13,031,000 and expected to be collectible.
Non-controlling interestsThe Group has elected to measure the non-controlling interest (NCI) based on their proportionate interest of SGI’s net identifiable assets as recognised by the Group, which amounted to S$140,147,000.
GoodwillThe acquisition will provide a platform to accelerate the Group’s growth in the renewable energy sector. It also includes local market knowledge and capability residing in the experienced management team which cannot be separately recognised as intangible asset from goodwill. None of the goodwill recognised is expected to be deductible for tax purposes.
Acquisition-related costsThe Group incurred acquisition-related costs of S$2,160,000 on legal fees and due diligence costs. These costs have been included in ‘General and administrative expenses’.
SEMBCORP INDUSTRIES ANNUAL REPORT 2015 287286 BUILDING THE FUTURE

NOTES TO THE FINANCIAL STATEMENTSYear ended December 31, 2015
34. Acquisition of Subsidiaries (cont’d)
2014In July 14, 2014, Sembcorp’s interest in Thermal Powertech Corporation India Limited (TPCIL) was increased from 49% to 65% and became a subsidiary of the Group. Consequently, TPCIL’s financials were consolidated into the Group’s financial statements.
The principal activities of TPCIL are to build, own and operate a 1,320 megawatt (2 x 660 megawatt units) coal-fired power plant in India.
Revenue and profit contributionThe acquired business contributed losses amounting to S$1,660,000 to the Group’s results for the period from July 14, 2014 to December 31, 2014. TPCIL has not commenced operations and hence no revenue recognised.
Had TPCIL been consolidated from January 1, 2014, the Group’s consolidated revenue and consolidated profit for the year ended December 31, 2014 would have been S$10,894,660,000 and S$1,084,244,000 respectively.
Consideration transferredThe following table summarises the acquisition date fair value of each major class of consideration transferred:
2014
S$’000
a. Effect on cash flows of the GroupCash paid – Less: Cash and cash equivalents in subsidiary acquired 61,741Cash inflow on acquisition 61,741
At fair value
Note S$’000
b. Identifiable assets acquired and liabilities assumedProperty, plant and equipment 3 1,628,635 Intangible assets 10 39,154 Trade and other receivables 106,226 Tax recoverable 1,674 Cash and cash equivalents 61,741Total assets 1,837,430 Trade and other payables 177,457 Deferred tax liabilities 11 39,338 Retirement benefit obligations 19 32 Borrowings 1,221,621Total liabilities 1,438,448 Total net identifiable assets 398,982 Less: Non-controlling interests (186,942) Add: Goodwill 10 26,131 Less: Amount previously accounted for as joint venture (197,201) Less: Foreign currency translation reserve realized when joint venture became a subsidiary (37,178) Less: Fair value gain on step up acquisition of a joint venture (3,792)Consideration transferred for the business –
34. Acquisition of Subsidiaries (cont’d)
2014 (cont’d)
Measurement of fair valuesThe valuation techniques used for measuring the fair value of material assets acquired were as follows:
Assets acquired Valuation technique Key assumptions
Property, plant and equipment Market comparison technique Supplier’s quotations for major component parts of the and cost technique power plant (mainly the boiler, turbines and generators).
Intangible assets Multi-period excess earnings • Contract revenue are based on the contracted method (MEEM) tariffs stipulated in the long-term power purchase agreement. • Constant gross profit margin assumed on the understanding that any volatility in fuel cost incurred will be passed on to customer. • Discounted rates of 18%.
Acquired receivablesThe fair value of trade and other receivables is S$106,266,000. TPCIL has not commenced operations at the date of acquisition. Receivables mainly pertain to the capital contribution receivable from shareholders.
Non-controlling interestsThe Group has elected to measure the non-controlling interest (NCI) based on their proportionate interest of TPCIL’s net identifiable assets as recognised by the Group, which amounted to S$186,942,000.
GoodwillThe goodwill of S$26,131,000 recognised on acquisition is attributable to the control premium to acquire a controlling stake in TPCIL. None of the goodwill recognised is expected to be deductible for tax purposes.
The re-measurement to fair value of the Group’s existing 49% interest in TPCIL resulted in a gain of S$3,792,000. This amount has been recognised in “Other income” in the consolidated income statement (see Note 28).
SEMBCORP INDUSTRIES ANNUAL REPORT 2015 289288 BUILDING THE FUTURE

NOTES TO THE FINANCIAL STATEMENTSYear ended December 31, 2015
35. Related Partiesa. Related party transactions
The Group had the following significant outstanding balances and transactions with related parties during the year:
Outstanding balances Transactions
2015 2014 2015 2014
S$’000 S$’000 S$’000 S$’000
Related Corporations Sales 2,750 49,485 84,067 711,149 Purchases including rental 728 145 196,557 191,814 Loans due from 11,775 – – – Finance income – – 3,536 2,928 Finance expense – – 33,591 9,227
Associates and Joint Ventures Sales 23,769 23,654 78,890 69,200 Purchases including rental 7,036 5,163 18,740 20,177 Payment on behalf – – 5,566 4,555 Loans due from 140,621 118,961 – –
The Group has no financial assistance to non-wholly-owned subsidiary companies. The balances due from related parties arose from the usual trade transactions, reimbursements and for financing of capital expansion.
b. Compensation of key management personnelThe Group considers the directors of the Company (including the Group President & CEO of the Company), the Group Chief Financial Officer, the President & CEO of Sembcorp Marine Ltd, the Executive Vice President & Head of Group Business Development & Commercial, the Executive Vice President & Head, Group Asset Management, Utilities, the CEO of Sembcorp Development Ltd to be key management personnel in accordance with FRS 24 Related Party Disclosures. These persons have the authority and responsibility for planning, directing and controlling the activities of the Group.
The key management personnel compensation is as follows:
Group
2015 2014
S$’000 S$’000
Directors’ fees and remuneration 8,432 7,772 Other key management personnel remuneration 9,606 10,110 18,038 17,882
Fair value of share-based compensation 4,739 5,430
Remuneration includes salary (which includes allowances, fees and other emoluments) and bonus (which includes AWS, discretionary bonus and performance targets bonus).
In addition to the above, the Company provides medical benefits to all employees including key management personnel.
35. Related Parties (cont’d)
b. Compensation of key management personnel (cont’d)
The Group adopts an incentive compensation plan, which is tied to the creation of Economic Value Added (EVA), as well as to attainment of individual and Group performance goals for its key executives. A “bonus bank” is used to hold incentive compensation credited in any year. Typically, one-third of the available balance is paid out in cash each year, with the balance being carried forward to the following year. The balances of the bonus bank in future will be increased or decreased by the yearly EVA performance of the Group and its subsidiaries achieved and the payouts made from the bonus bank.
The fair value of share-based compensation relates to performance shares and restricted shares granted that were charged to the profit or loss.
36. Financial InstrumentsFinancial risk management objectives and policiesThe Group’s activities expose it to market risk (including interest rate risk, foreign currency risk and price risk), credit risk and liquidity risk.
As part of the Group’s Enterprise Risk Management framework, Group treasury policies and financial authority limits are documented and reviewed periodically. The policies set out the parameters for management of Group liquidity, counterparty risk, foreign exchange and derivative transactions and financing.
The Group utilises foreign exchange contracts, foreign exchange swaps, interest rate swaps, fuel oil swaps, contracts for differences and various financial instruments to manage exposures to interest rate, foreign exchange and commodity price risks arising from operating, financing and investment activities. Exposures to foreign currency risks are also hedged naturally by a matching sale or purchase of a matching asset or liability of the same currency and amount where possible. All such transactions must involve underlying assets or liabilities and no speculative transactions are allowed.
The financial authority limits seek to limit and mitigate transactional risks by setting out the threshold of approvals required for the entry into contractual obligations and investments.
a. Market riskMarket risk is the risk that changes in market prices, such as interest rates, foreign exchange rates and prices will affect the Group’s income or the value of its holdings of financial instruments. The objective of market risk management is to manage and reduce market risk exposures within acceptable parameters.
i. Interest rate riskThe Group’s exposure to market risk for changes in interest rate environment relates mainly to its debt obligations.
The Group’s policy is to maintain an efficient and optimal interest cost structure using a mix of fixed and variable rate debts and long-term and short-term borrowings.
The Group enters into interest rate swaps and cross currency interest rate swaps to reduce its exposure to interest rate volatility. In accordance with the Group’s policy, the duration of such interest rate swaps must not exceed the tenor of the underlying debt.
At December 31, 2015, the Group had interest rate swaps and cross currency interest rate swaps with an aggregate notional amount of S$1,197,097,000 (2014: S$940,904,000), of which S$1,135,153,000 (2014: S$910,253,000) was designated as cash flow hedges. The Group receives a variable interest rate and pays a fixed rate interest ranging from 1.53% to 13.05% (2014: 1.53% to 4.94%) per annum on the notional amount. Interest rate swaps with notional amounts of S$326,000,000 (2014: S$353,327,000) are taken with a related corporation.
SEMBCORP INDUSTRIES ANNUAL REPORT 2015 291290 BUILDING THE FUTURE

NOTES TO THE FINANCIAL STATEMENTSYear ended December 31, 2015
36. Financial Instruments (cont’d)
a. Market risk (cont’d)
i. Interest rate risk (cont’d)
Sensitivity analysisIt is estimated that 100 basis points (bp) change in interest rate at the reporting date would increase / (decrease) equity and profit before tax by the following amounts. This analysis assumes that all other variables, in particular foreign currency rates, remain constant.
Profit before tax Equity
100 bp 100 bp 100 bp 100 bp
Increase Decrease Increase Decrease
S$’000 S$’000 S$’000 S$’000
Group December 31, 2015 Variable rate financial instruments (5,452) 5,452 27,479 (28,063)
December 31, 2014 Variable rate financial instruments 1,762 (1,762) 24,943 (25,431)
Company December 31, 2015 Variable rate financial instruments 3,231 (3,231) – –
December 31, 2014 Variable rate financial instruments 924 (924) – –
ii. Foreign currency riskThe Group operates globally and is exposed to currency risk on sales, purchases and borrowings that are denominated in a currency other than the respective functional currencies of the Company and its subsidiaries. The currencies in which these transactions are primarily denominated in are Singapore dollars (SGD), United States dollars (USD), Euros (EURO), Pounds Sterling (GBP) and Brazilian Real (BRL). Such risks are hedged either by forward foreign exchange contracts in respect of actual or forecasted currency exposures which are reasonably certain or hedged naturally by a matching sale or purchase of a matching asset or liability of the same currency and amount.
The Group’s investments in its UK subsidiaries are hedged by GBP / SGD Cross Currency Swaps with notional amount of S$333,758,000 (2014: S$374,717,000) and GBP / SGD foreign exchange forward contract with notional amount of S$nil (2014: S$43,727,000), which mitigates the currency risks arising from the subsidiaries’ net assets. The Group’s investments in its Middle East (ME) subsidiaries are hedged by a USD / SGD foreign exchange swap contract with a notional amount of S$73,024,000 (2014: S$nil). On consolidation, the effective portions of the fair value loss of S$8,859,000 (2014: S$7,703,000), fair value gain of S$nil (2014: S$1,052,000) and fair value loss of S$2,263,000 (2014: S$nil) arising from the GBP / SGD Cross Currency Swaps, GBP / SGD foreign exchange forward contract and USD / SGD foreign exchange swap contract respectively, are recognised directly in the foreign currency translation reserves. These financial instruments are designated as hedge of a net investment in foreign operations and were effective as at December 31, 2015.
Foreign exchange forward contracts and cross currency swaps with notional amounts of S$270,275,000 (2014: S$468,219,000) and S$239,608,000 (2014: S$280,567,000) respectively are taken with a related corporation.
36. Financial Instruments (cont’d)
a. Market risk (cont’d)
ii. Foreign currency risk (cont’d)
The summary of quantitative data about the Group’s exposure to foreign currency risk (excluding the GBP / SGD Cross Currency Swaps, GBP / SGD foreign exchange forward contract and foreign exchange swap contract that are designated as a hedge of the Group’s net investments in its subsidiaries in UK and ME) as provided to the management of the Group based on its risk management policy was as follows:
SGD USD EURO GBP BRL Others
S$’000 S$’000 S$’000 S$’000 S$’000 S$’000
Group 2015 Financial assets Cash and cash equivalents 39,168 358,377 26,467 92,757 – 12,368 Trade and other receivables 9,078 1,293,143 18,548 88,893 – 74,026 Due from customers on construction contracts 118 2,025,446 8,546 – 156,030 41,068 Other financial assets – 27,463 – – – 32,725 48,364 3,704,429 53,561 181,650 156,030 160,187Financial liabilities Trade and other payables 157,324 917,885 107,485 81,905 51,284 94,673 Interest-bearing borrowings – 1,387,029 – – – 14,037 157,324 2,304,914 107,485 81,905 51,284 108,710Net financial (liabilities) / assets (108,960) 1,399,515 (53,924) 99,745 104,746 51,477 Add: Firm commitments and highly probable forecast transactions in foreign currencies (24,451) (94,066) (111,507) 213,944 (26,897) (87,745) Less: Foreign exchange forward contracts 23,209 (232,056) 117,000 (297,127) – 46,086Net currency exposure (110,202) 1,073,393 (48,431) 16,562 77,849 9,818 2014 Financial assets Cash and cash equivalents 58,976 304,256 47,349 12,860 – 23,721 Trade and other receivables 15,260 1,218,824 23,367 95,539 38,436 67,858 Due from customers on construction contracts 1,024 1,380,402 – – – – Other financial assets – 29,059 – – – 14,876 75,260 2,932,541 70,716 108,399 38,436 106,455 Financial liabilities Trade and other payables 133,852 948,196 113,736 73,640 45,004 151,675 Interest-bearing borrowings – 945,574 – – – 7,260 133,852 1,893,770 113,736 73,640 45,004 158,935Net financial (liabilities) / assets (58,592) 1,038,771 (43,020) 34,759 (6,568) (52,480) Add: Firm commitments and highly probable forecast transactions in foreign currencies (49,326) 1,272,537 (71,956) 17,254 – (55,315) Less: Foreign exchange forward contracts 77,425 (1,467,480) 46,743 16,824 – 194,316Net currency exposure (30,493) 843,828 (68,233) 68,837 (6,568) 86,521
SEMBCORP INDUSTRIES ANNUAL REPORT 2015 293292 BUILDING THE FUTURE

NOTES TO THE FINANCIAL STATEMENTSYear ended December 31, 2015
36. Financial Instruments (cont’d)
a. Market risk (cont’d)
ii. Foreign currency risk (cont’d)
The Company’s gross exposure to foreign currencies is as follows:
USD EURO GBP Others
S$’000 S$’000 S$’000 S$’000
Company 2015 Financial assets Cash and cash equivalents 19,350 – 20 – Trade and other receivables 72,384 30 31 – Long-term trade receivables 2,484 – – – 94,218 30 51 –Financial liabilities Trade and other payables 17,848 110 155 913Net financial assets / (liabilities) 76,370 (80) (104) (913)
Net currency exposure 76,370 (80) (104) (913)
2014 Financial assets Cash and cash equivalents 11,134 – – – Trade and other receivables 89,088 136 – – Long-term trade receivables 7,543 – – – 107,765 136 – –Financial liabilities Trade and other payables 30,091 226 1 517Net financial assets / (liabilities) 77,674 (90) (1) (517)
Less: Foreign exchange forward contracts (25,329) – – – Net currency exposure 52,345 (90) (1) (517)
36. Financial Instruments (cont’d)
a. Market risk (cont’d)
ii. Foreign currency risk (cont’d)
Sensitivity analysisA 10% strengthening of the following currencies against the functional currencies of the Company and its subsidiaries at the balance sheet date would have increased / (decreased) equity and profit before tax by the amounts shown below. The analysis assumes that all other variables, in particular interest rates, remain constant and ignores any impact of firm commitments and highly probable forecast transactions in foreign currencies. The analysis is performed on the same basis for 2014.
Group Company
Equity Profit before tax Equity Profit before tax
S$’000 S$’000 S$’000 S$’000
2015 SGD 1,512 (10,422) – – USD (25,620) 126,921 – 7,637 EURO 27,106 (5,391) – (8) GBP (19,591) 4,984 – (10) BRL – 10,475 – – Others 9,361 1,223 – (91)
2014 SGD 3,234 (2,090) – – USD (81,314) 63,890 (4,828) 7,768 EURO 522 (355) – (9) GBP (119) 1,928 – – BRL – (657) – – Others 13,665 726 – (51)
A 10% weakening of the above currencies against the functional currencies of the Company and its subsidiaries at the balance sheet date would have had the equal but opposite effect on the above currencies to the amounts shown above, on the basis that all other variables remain constant.
SEMBCORP INDUSTRIES ANNUAL REPORT 2015 295294 BUILDING THE FUTURE

NOTES TO THE FINANCIAL STATEMENTSYear ended December 31, 2015
36. Financial Instruments (cont’d)
a. Market risk (cont’d)
iii. Price riskUnit trust and funds, and equity securities price riskThe Group is exposed to unit trust and funds, and equity securities price risk because of the investments held by the Group which are classified on the consolidated balance sheet either as available-for-sale or at fair value through profit or loss.
Sensitivity analysisIf prices for unit trust and funds, and equity securities increase by 10% with all other variables held constant, the increase in equity and profit before tax will be:
Group
2015 2014
S$’000 S$’000
Equity 27,450 24,715 Profit before tax 5,103 5,439
A 10% decrease in the underlying unit trust and funds, and equity securities would have had the equal but opposite effect to the amounts shown above. The analysis is performed on the same basis for 2014 and assumes that all other variables remain constant.
Commodity riskThe Group hedges against fluctuations in commodity prices that affect revenue and cost. Exposures are managed via swaps, options, contracts for differences, fixed price and forward contracts.
Contracts for differences are entered into with a counterparty at a strike price, with or without fixing the quantity upfront, to hedge against adverse price movements on the sale of electricity. Exposure to price fluctuations arising on the purchase of fuel is managed via fuel oil swaps where the price of fuel is indexed to a benchmark fuel price index, for example Singapore High Sulphur Fuel Oil 180 CST fuel oil and Dated Brent.
Sensitivity analysisIf prices for commodities increase by 10% with all other variables held constant, the increase in equity as a result of fair value changes on cash flow hedges will be:
Group
2015 2014
S$’000 S$’000
Equity 8,426 17,270
A 10% decrease in the prices for commodities would have had the equal but opposite effect to the amounts shown above. The analysis is performed on the same basis for 2014 and assumes that all other variables remain constant.
36. Financial Instruments (cont’d)
a. Market risk (cont’d)
iii. Price risk (cont’d)
Notional amountAt the balance sheet date, the Group had financial instruments with the following notional contract amounts:
Group
2015 2014
Notional Notional
amount amount
S$’000 S$’000
Fuel oil swap agreements 188,038 338,233
Fuel oil swap agreements with notional amounts of S$331,000 (2014: S$2,136,000) are taken with a related corporation.
b. Credit riskThe Group monitors its exposure to credit risks arising from sales to trade customers on an on-going basis, and credit evaluations are done on customers that require credit. The credit quality of customers is assessed after taking into account its financial position and past experience with the customers.
The Group only deals with pre-approved customers and financial institutions with good credit rating. To minimise the Group’s counterparty risk, the Group enters into derivative transactions only with creditworthy institutions. Cash and fixed deposits are placed in banks and financial institutions with good credit rating. One of the financial institutions has become a related corporation in 2014.
As the Group and the Company does not hold any collateral, the maximum exposure to credit risk is the carrying amount of each financial asset, including derivatives, in the balance sheet.
The Group’s and the Company’s maximum exposure to credit risk for loans and receivables at the balance sheet date is as follows:
Group Company
2015 2014 2015 2014
Note S$’000 S$’000 S$’000 S$’000
By business activity Utilities 1,068,235 1,035,103 271,658 160,564 Marine 3,898,236 3,174,346 – – Urban Development 21,795 5,553 – – Others 99,439 21,477 – – 5,087,705 4,236,479 271,658 160,564
Loans and receivables Non-current * 385,771 405,289 137,484 7,543 Current 4,701,934 3,831,190 134,174 153,021 8, 12 5,087,705 4,236,479 271,658 160,564* Not past due.
SEMBCORP INDUSTRIES ANNUAL REPORT 2015 297296 BUILDING THE FUTURE

NOTES TO THE FINANCIAL STATEMENTSYear ended December 31, 2015
36. Financial Instruments (cont’d)
b. Credit risk (cont’d)
The age analysis of current loans and receivables is as follows:
Gross Impairment Gross Impairment
2015 2015 2014 2014
S$’000 S$’000 S$’000 S$’000
Group Not past due 4,410,901 9,161 3,613,788 913 Past due 0 to 3 months 214,861 363 179,661 2,245 Past due 3 to 6 months 42,648 161 20,524 1,886 Past due 6 to 12 months 142,448 103,729 14,833 5,852 More than 1 year 99,112 94,622 37,670 24,390 4,909,970 208,036 3,866,476 35,286
Company Not past due 67,718 – 125,064 350 Past due 0 to 3 months 19,755 – 26,791 723 Past due 3 to 6 months 13,157 – 1,339 433 Past due 6 to 12 months 52,032 19,519 1,046 15 More than 1 year 2,198 1,167 384 82 154,860 20,686 154,624 1,603
Movements in the allowance for impairment of current and non-current loans and receivables are as follows:
Group Company
2015 2014 2015 2014
Note S$’000 S$’000 S$’000 S$’000
Balance at January 1 36,423 38,158 1,603 250 Currency translation difference 3,249 (26) – – Allowance made 205,128 4,310 19,172 1,353 Allowance utilised (9,310) (193) (10) – Allowance written back (6,905) (5,826) (79) – Acquisition of subsidiary 1,036 – – – Disposal of subsidiary (2,748) – – –Balance at December 31 8 226,873 36,423 20,686 1,603
During the year, impairment losses of S$173,156,000 (2014: S$nil) were related to two customers currently undergoing financial restructuring. In addition, impairment losses of S$24,969,000 (2014: S$nil) was related to a receivable that is not past due but made after assessing the customers’ credit worthiness.
The total net impairment losses of S$198,223,000 (2014: net write back of S$1,516,000) have been recognised in the general and administrative expenses.
The allowance account in respect of loans and receivables is used to record impairment losses unless the Group is satisfied that no recovery of the amount owing is possible. At that point, the financial asset is considered irrecoverable and the amount charged to the allowance account is written against the carrying amount of the impaired financial asset. Apart from the above, no impairment allowance is necessary in respect of outstanding trade receivables.
36. Financial Instruments (cont’d)
c. Liquidity riskThe Group manages its liquidity risk with the view to maintaining a healthy level of cash and cash equivalents appropriate to the operating environment and expected cash flows of the Group. Liquidity requirements are maintained within the credit facilities established and are adequate and available to the Group to meet its obligations.
The table below analyses the maturity profile of the Group’s and the Company’s financial liabilities (including derivatives financial liabilities) based on contractual undiscounted cash inflows / (outflows), including estimated interest payments and excluding the impact of netting agreements:
Cash Flows
Carrying Contractual Less than Between 1 Over
amount cash flow 1 year and 5 years 5 years
S$’000 S$’000 S$’000 S$’000 S$’000
Group 2015 Derivatives Derivative financial liabilities 247,238 – inflow 2,067,024 1,699,078 367,946 – – outflow (2,316,712) (1,884,455) (432,195) (62) Derivative financial assets (99,984) – inflow 1,273,717 1,175,743 92,439 5,535 – outflow (1,171,406) (1,100,535) (70,871) – Non-derivative financial liabilities Trade and other payables * 3,362,571 (3,362,571) (3,340,714) (19,696) (2,161) Put liability to acquire non-controlling interests 193,113 (193,113) – (193,113) – Interest-bearing borrowings 6,832,949 (8,739,384) (2,112,435) (3,882,096) (2,744,853)
10,535,887 (12,442,445) (5,563,318) (4,137,586) (2,741,541)
2014 Derivatives Derivative financial liabilities 272,402 – inflow 2,743,529 1,428,992 1,314,537 – – outflow (3,020,465) (1,605,442) (1,414,856) (167) Derivative financial assets (36,570) – inflow 1,061,332 1,002,547 58,785 – – outflow (1,019,963) (970,510) (49,453) – Non-derivative financial liabilities Trade and other payables * 2,690,501 (2,690,501) (2,677,838) (1,975) (10,688) Interest-bearing borrowings 4,734,581 (6,304,181) (1,287,748) (2,078,267) (2,938,166)
7,660,914 (9,230,249) (4,109,999) (2,171,229) (2,949,021)
* Excludes advance payments, deferred income, deferred grants, rental payable, Goods and Services Tax, and employee benefits.
SEMBCORP INDUSTRIES ANNUAL REPORT 2015 299298 BUILDING THE FUTURE

NOTES TO THE FINANCIAL STATEMENTSYear ended December 31, 2015
36. Financial Instruments (cont’d)
c. Liquidity risk (cont’d)
Cash Flows
Carrying Contractual Less than Between 1 Over
amount cash flow 1 year and 5 years 5 years
S$’000 S$’000 S$’000 S$’000 S$’000
Company 2015 Non-derivative financial liabilities Trade and other payables * 394,922 (456,639) (136,511) (156,765) (163,363) Interest-bearing borrowings 3 (3) (3) – –
394,925 (456,642) (136,514) (156,765) (163,363)
2014 Derivatives Derivative financial liabilities 1,558 – inflow 25,329 25,329 – – – outflow (26,887) (26,887) – – Non-derivative financial liabilities Trade and other payables * 744,199 (880,070) (290,666) (88,424) (500,980) Interest-bearing borrowings 11 (11) (8) (3) –
745,768 (881,639) (292,232) (88,427) (500,980)
* Excludes advance payments, deferred income, deferred grants, rental payable, Goods and Services Tax, and employee benefits.
36. Financial Instruments (cont’d)
c. Liquidity risk (cont’d)
The following table indicates the periods in which the cash flow associated with derivatives that are cash flow hedges are expected to impact the profit or loss and the fair value of the related hedging instruments.
Cash Flows
Carrying Contractual Less than Between 1 Over
amount cash flow 1 year and 5 years 5 years
S$’000 S$’000 S$’000 S$’000 S$’000
Group 2015 Derivative financial liabilities 197,768 – inflow 1,257,454 1,227,467 29,987 – – outflow (1,456,871) (1,408,648) (48,223) – Derivative financial assets (32,377) – inflow 554,209 467,390 86,819 – – outflow (520,512) (449,641) (70,871) –
165,391 (165,720) (163,432) (2,288) –
2014 Derivative financial liabilities 222,540 – inflow 1,796,784 865,426 931,358 – – outflow (2,021,860) (1,028,471) (993,222) (167) Derivative financial assets (21,148) – inflow 490,157 431,372 58,785 – – outflow (467,314) (417,861) (49,453) –
201,392 (202,233) (149,534) (52,532) (167)
Company 2015 Derivative financial liabilities – inflow – – – – – – outflow – – – – –
– – – – –
2014 Derivative financial liabilities 1,558 – inflow 25,329 25,329 – – – outflow (26,887) (26,887) – –
1,558 (1,558) (1,558) – –
SEMBCORP INDUSTRIES ANNUAL REPORT 2015 301300 BUILDING THE FUTURE

NOTES TO THE FINANCIAL STATEMENTSYear ended December 31, 2015
36. Financial Instruments (cont’d)
d. Estimation of fair valuesFRS 107 establishes a fair value hierarchy that prioritises the inputs used to measure fair value. The three levels of the fair value input hierarchy defined by FRS 107 are as follows:
• Level 1 – Fair values are measured based on quoted prices (unadjusted) from active markets for identical financial instruments.
• Level 2 – Fair values are measured using inputs, other than those used for Level 1, that are observable for the financial instruments either directly (prices) or indirectly (derived from prices).
• Level 3 – Fair values are measured using inputs which are not based on observable market data (unobservable input).
SecuritiesThe fair value of financial assets at fair value through profit or loss, and available-for-sale financial assets, is based on quoted market prices (bid price) in an active market at the balance sheet date without any deduction for transaction costs. If the market for a quoted financial asset is not active, and for unquoted financial assets, the Group establishes fair value by using valuation techniques.
DerivativesThe fair value of foreign exchange contracts and foreign exchange swaps are accounted for based on the difference between the contractual price and the current market price.
The fair values of interest rate swaps and cross currency swaps are the indicative amounts that the Group is expected to receive or pay to terminate the swap with the swap counterparties at the balance sheet date.
The fair value of fuel oil swaps contracts is accounted for based on the difference between the contractual strike price with the counterparty and the current market price.
Contracts for differences (CFDs) are accounted for based on the difference between the contracted price entered into with the counterparty and the reference price. The electricity futures market was launched on April 1, 2015. There have been minimal trades made and the fair values of the electricity futures would need to be adjusted to reflect the illiquidity. The utilisation of valuation techniques involving prices from the electricity future market to compute the fair values of the CFDs will result in a wide range of estimated fair values. As such, it is determined that the fair value of the CFDs cannot be measured reliably. The CFDs are measured at cost at the measurement date. Upon settlement, the gains and losses for CFDs are taken to profit or loss.
Non-derivative non-current financial assets and liabilitiesFair values determined for non-derivative non-current financial assets and liabilities are calculated based on discounted expected future principal and interest cash flows at the market rate of interest at the reporting date. This includes determination for fair value disclosure purpose as well.
Fair value determined for the put liability is calculated based on the present value of the obligation computed based on the expected exercise price.
For finance leases, the market rate of interest is determined by reference to similar lease agreements.
36. Financial Instruments (cont’d)
d. Estimation of fair values (cont’d)
Other financial assets and liabilitiesThe carrying amounts of financial assets and liabilities with a maturity of less than one year (including trade and other receivables, cash and cash equivalents, and trade and other payables) are assumed to approximate their fair values because of the short period to maturity.
For financial instruments that are not actively traded in the market, the fair value is determined by independent third party or using valuation techniques where applicable. The Group may use a variety of methods and make assumptions that are based on existing market conditions at each balance sheet date. Quoted market prices or dealer quotes for similar instruments are used to estimate the fair value for medium term notes for disclosure purposes. Other techniques, such as estimated discounted cash flows, are used to determine fair value for the remaining financial instruments. Where discounted cash flow techniques are used, the management will estimate the future cash flows and use relevant market rate as the discount rate at the balance sheet date.
e. Fair value hierarchyThe following table sets forth by level within the fair value hierarchy of the financial assets and liabilities that were accounted for at fair value on a recurring basis as of December 31, 2015. These financial assets and liabilities are classified in their entirety based on the lowest level of input that is significant to the fair value measurement. The assessment of the significance of a particular input to the fair value measurement requires judgement, and may affect the valuation of assets and liabilities and their placement within the fair value hierarchy levels.
Financial assets and liabilities carried at fair value
Fair value measurement using:
Level 1 Level 2 Level 3 Total
S$’000 S$’000 S$’000 S$’000
Group At December 31, 2015 Available-for-sale financial assets 239,524 500 34,477 274,501 Financial assets at fair value through profit or loss – – 51,033 51,033 Derivative financial assets – 99,984 – 99,984 239,524 100,484 85,510 425,518 Put liability – – (193,113) (193,113) Derivative financial liabilities – (247,238) – (247,238) 239,524 (146,754) (107,603) (14,833)
At December 31, 2014 Available-for-sale financial assets 218,638 449 28,068 247,155 Financial assets at fair value through profit or loss 1 1,957 52,431 54,389 Derivative financial assets – 36,570 – 36,570 218,639 38,976 80,499 338,114 Put liability – – – – Derivative financial liabilities – (272,402) – (272,402) 218,639 (233,426) 80,499 65,712
SEMBCORP INDUSTRIES ANNUAL REPORT 2015 303302 BUILDING THE FUTURE

NOTES TO THE FINANCIAL STATEMENTSYear ended December 31, 2015
36. Financial Instruments (cont’d)
e. Fair value hierarchy (cont’d)
Financial assets and liabilities carried at fair value (cont’d)
Fair value measurement using:
Level 1 Level 2 Level 3 Total
S$’000 S$’000 S$’000 S$’000
Company At December 31, 2015 Derivative financial liabilities – – – –
– – – –
At December 31, 2014 Derivative financial liabilities – (1,558) – (1,558) – (1,558) – (1,558)
In 2015 and 2014, there have been no transfers between the different levels of the fair value hierarchy.
Level 3 fair valuesi. Available-for-sale financial assets
The following table shows a reconciliation from the beginning balances to the ending balances for fair value measurements of available-for-sale financial assets in Level 3 of the fair value hierarchy:
Available-for-sale
S$’000
Group At January 1, 2015 28,068 Additions 1,652 Net change in fair value recognised in other comprehensive income 4,757At December 31, 2015 34,477
At January 1, 2014 23,264 Additions 1,924 Net change in fair value recognised in other comprehensive income 2,880At December 31, 2014 28,068
Available-for-sale financial assets in Level 3 of the fair value hierarchy include unquoted equity shares, venture capital funds and unquoted funds.
The fair value of the unquoted equity shares and venture capital funds are determined by reference to the investment’s net asset values as stated in the unaudited financial statements and audited fund valuation report respectively.
The fair value of the unquoted funds is based on the latest available unaudited net asset values of the underlying funds provided by the administrator of those funds on the basis that their net asset values approximate their fair value at reporting date. The key unobservable inputs include net asset value for fund investment and / or recent transaction price among investors.
The estimated fair value would increase / (decrease) if the net asset values for unquoted equity shares and fund investments were higher / (lower), or if the recent transaction prices were higher / (lower).
36. Financial Instruments (cont’d)
e. Fair value hierarchy (cont’d)
Level 3 fair values (cont’d)
ii. Fair value through profit or loss financial assetsThe following table shows a reconciliation from the beginning balances to the ending balances for fair value measurements of financial assets at fair value through profit or loss in Level 3 of the fair value hierarchy:
Fair value through
profit or loss
S$’000
Group At January 1, 2015 52,431 Currency translation adjustments 1,424 Total loss recognised in profit or loss (2,822)At December 31, 2015 51,033
At January 1, 2014 56,385 Currency translation adjustments 3,147 Total loss recognised in profit or loss (7,101)At December 31, 2014 52,431
See Note 7 for details on the investment in equity shares designated at fair value through profit or loss.
Although the Group believes that its estimates of fair value are appropriate, the use of different assumptions could lead to different measurement of fair value.
The fair value of the investment in equity shares is calculated by using expected cash flows and risk-adjusted discount rate of the Group. Key input and assumption used in the model at December 31, 2015 included the following:
• Forecast coal prices growth at 10.0%; and
• Risk-adjusted discount rate at 22%.
Sensitivity analysisIf the coal price increases or decreases by 10% with all other assumptions held constant, the favourable / (unfavourable) impact to the profit or loss is as follows:
Profit or loss
Favourable (Unfavourable)
S$’000 S$’000
Group December 31, 2015 Fair value through profit or loss 13,347 –
December 31, 2014 Fair value through profit or loss 4,392 (4,614)
The favourable and unfavourable effect of using reasonably possible alternative assumption has been calculated by recalibrating the model using alternative estimates of expected cash flows that might reasonably have been considered by a market participant for the purpose of pricing the instruments at the reporting date.
In 2015, there is no unfavourable effect as there is a minimum return guaranteed to be received in 2016, when this investment expires.
SEMBCORP INDUSTRIES ANNUAL REPORT 2015 305304 BUILDING THE FUTURE

NOTES TO THE FINANCIAL STATEMENTSYear ended December 31, 2015
36. Financial Instruments (cont’d)
e. Fair value hierarchy (cont’d)
Level 3 fair values (cont’d)
iii. Put LiabilityThe following table shows a reconciliation from the beginning balances to the ending balances for fair value measurements of put liability in Level 3 of the fair value hierarchy:
Put Liability
Note S$’000
Group At January 1, 2015 – Additions at acquisition of subsidiary 18(a) 186,968 Net changes in present value recognised 6,145At December 31, 2015 193,113
Both additions and changes are recognised in Capital Reserves (Note 22(c)).
The valuation model considers the present value of the expected payment, discounted using the Company’s cost of debt. Key inputs and assumptions used in the model at December 31, 2015 include the Company’s cost of debt with tenure of 2 to 3 years at 8.5%. The expected payment is determined by considering the exercise price on July 31, 2018.
Sensitivity analysisIf the cost of debt increases or decreases by 10% with all other assumptions held constant, the favourable / (unfavourable) impact to the equity statement is as follows:
Equity
Favourable (Unfavourable)
S$’000 S$’000
Group December 31, 2015 Capital reserve 3,854 (3,964)
The estimated present value of put liability to acquire non-controlling interests would increase / (decrease) if the cost of debt decreases / (increases).
36. Financial Instruments (cont’d)
e. Fair value hierarchy (cont’d)
Assets and liabilities not carried at fair value but for which fair values are disclosed *
Fair value measurement using:
Level 1 Level 2 Level 3 Total
S$’000 S$’000 S$’000 S$’000
Group At December 31, 2015 Investment properties – 21,600 37,083 58,683 Interests in an associate 341,030 – – 341,030 Long-term service concession receivables – 232,620 – 232,620 Long-term trade receivables – 2,305 – 2,305 Amounts due from related parties – 21,569 – 21,569 Due from customers on construction contracts – 3,320,849 – 3,320,849 Long-term interest-bearing borrowings – (4,995,230) – (4,995,230)
At December 31, 2014 Investment properties – – 62,349 62,349 Interests in an associate 289,839 – – 289,839 Long-term service concession receivables – 239,563 – 239,563 Long-term trade receivables – 7,253 – 7,253 Amounts due from related parties – 25,270 – 25,270 Due from customers on construction contracts – 2,693,302 – 2,693,302 Long-term interest-bearing borrowings – (3,752,761) – (3,752,761)
Company At December 31, 2015 Interest in a subsidiary 2,229,974 – – 2,229,974 Long-term trade receivables – 2,305 – 2,305 Amounts due from related parties – 135,879 – 135,879
At December 31, 2014 Interest in a subsidiary 4,154,122 – – 4,154,122 Long-term trade receivables – 7,253 – 7,253
* Excludes financial assets and financial liabilities whose carrying amounts measured on the amortised cost basis approximate their fair values due to their short-term nature, frequent pricing and where the effect of discounting is immaterial.
In 2015, there was a transfer of S$21,600,000 pertaining to an investment property from level 3 to level 2 due to a change in the fair value of the investment property from a combination of direct comparison method and investment income method to direct comparison method.
The fair value of the investment properties (Level 3) is calculated based on a combination of direct comparison method and investment income method. The direct comparison method looks at researching recent sales of similar properties and comparing those properties with the subject property. Key inputs correspond to prices per square meter for comparable buildings. The latter method involves applying an investment yield to the property to work out rental income which is then discounted to determine market value. Key inputs correspond to market rents for comparable buildings.
Key unobservable inputs in relation to the investment income method correspond to:
• Investment property yields derived from specialised publications from the related markets and comparable transactions.
• Discount rate, based on the risk-free rate in the relevant market, adjusted for a risk premium to reflect both the increased risk of investing in the asset class.
SEMBCORP INDUSTRIES ANNUAL REPORT 2015 307306 BUILDING THE FUTURE

NOTES TO THE FINANCIAL STATEMENTSYear ended December 31, 2015
36. Financial Instruments (cont’d)
f. Fair value versus carrying amounts
Other financial Other financial
liabilities liabilities
Fair value within the outside the Total
Designated – hedging Available- Loans and scope of scope of carrying
at fair value instruments for-sale receivables FRS 39 FRS 39 amount Fair value
Note S$’000 S$’000 S$’000 S$’000 S$’000 S$’000 S$’000 S$’000
Group December 31, 2015 Cash and cash equivalents 14 – – – 1,606,488 – – 1,606,488 1,606,488 Trade receivables 8 – – – 850,633 – – 850,633 850,454 Service concession receivables 8 – – – 240,035 – – 240,035 244,384 Amounts due from non-controlling interests 8 – – – 75,414 – – 75,414 75,414 Other loans and receivables * 8 – – – 365,877 – – 365,877 365,877 Amounts due from related parties 9 – – – 183,359 – – 183,359 181,590 Due from customers on construction contracts 12 – – – 3,325,798 – – 3,325,798 3,320,849 Available-for-sale financial assets: – Equity shares 7 – – 244,155 – – – 244,155 236,509 – Unit trusts and funds 7 – – 37,992 – – – 37,992 37,992 Financial assets at fair value through profit or loss, on initial recognition: – Equity shares 7 51,033 – – – – – 51,033 51,033 – Forward foreign exchange contracts 7 56,253 – – – – – 56,253 56,253 – Foreign exchange swap contracts 7 77 – – – – – 77 77 – Cross currency swaps 7 11,155 – – – – – 11,155 11,155 Hedge of net investment in foreign operations: – Forward foreign exchange contracts 7 – 122 – – – – 122 122 Cash flow hedges: – Forward foreign exchange contracts 7 – 19,406 – – – – 19,406 19,406 – Fuel oil swaps 7 – 132 – – – – 132 132 – Interest rate swaps 7 – 12,839 – – – – 12,839 12,839
118,518 32,499 282,147 6,647,604 – – 7,080,768 7,070,574
* Excludes Goods and Services Tax.
SEMBCORP INDUSTRIES ANNUAL REPORT 2015 309308 BUILDING THE FUTURE

NOTES TO THE FINANCIAL STATEMENTSYear ended December 31, 2015
36. Financial Instruments (cont’d)
f. Fair value versus carrying amounts (cont’d)
Other financial Other financial
liabilities liabilities
Fair value within the outside the Total
Designated – hedging Available- Loans and scope of scope of carrying
at fair value instruments for-sale receivables FRS 39 FRS 39 amount Fair value
Note S$’000 S$’000 S$’000 S$’000 S$’000 S$’000 S$’000 S$’000
Group December 31, 2015 Trade payables 15 – – – – 2,668,166 – 2,668,166 2,668,166 Amounts due to non-controlling interests ** 15 – – – – 989 – 989 989 Other payables ** 15 – – – – 666,894 – 666,894 666,894 Other long-term payables ** 15 – – – – 21,857 – 21,857 18,810 Amounts due to related parties ** 16 – – – – 4,665 – 4,665 4,665 Financial liabilities at fair value through profit or loss, on initial recognition: – Forward foreign exchange contracts 18 873 – – – – – 873 873 – Foreign exchange swap contracts 18 1,318 – – – – – 1,318 1,318 – Interest rate swaps 18 157 – – – – – 157 157 Hedge of net investment in foreign operations: – Foreign exchange swap contracts 18 – 596 – – – – 596 596 – Cross currency swaps 18 – 46,526 – – – – 46,526 46,526 Cash flow hedges: – Forward foreign exchange contracts 18 – 108,439 – – – – 108,439 108,439 – Interest rate swaps 18 – 2,675 – – – – 2,675 2,675 – Fuel oil swaps 18 – 86,654 – – – – 86,654 86,654 Put liability to acquire non-controlling interests 18 – – – – 193,113 – 193,113 193,113 Interest-bearing borrowings: – Short-term borrowings 20 – – – – 1,800,320 – 1,800,320 1,800,320 – Long-term borrowings 20 – – – – 5,031,866 – 5,031,866 4,995,230 – Finance lease liabilities 20 – – – – – 763 763 763
2,348 244,890 – – 10,387,870 763 10,635,871 10,596,188
** Excludes advance payments, deferred income, deferred grants, rental payable, Goods and Services Tax, and employee benefits.
SEMBCORP INDUSTRIES ANNUAL REPORT 2015 311310 BUILDING THE FUTURE

NOTES TO THE FINANCIAL STATEMENTSYear ended December 31, 2015
36. Financial Instruments (cont’d)
f. Fair value versus carrying amounts (cont’d)
Other financial Other financial
liabilities liabilities
Fair value within the outside the Total
Designated – hedging Available- Loans and scope of scope of carrying
at fair value instruments for-sale receivables FRS 39 FRS 39 amount Fair value
Note S$’000 S$’000 S$’000 S$’000 S$’000 S$’000 S$’000 S$’000
Group December 31, 2014 Cash and cash equivalents 14 – – – 1,661,427 – – 1,661,427 1,661,427 Trade receivables 8 – – – 603,747 – – 603,747 603,457 Service concession receivables 8 – – – 246,070 – – 246,070 250,784 Amounts due from non-controlling interests 8 – – – 56,291 – – 56,291 56,291 Other loans and receivables * 8 – – – 382,933 – – 382,933 382,933 Amounts due from related parties 9 – – – 196,776 – – 196,776 196,628 Due from customers on construction contracts 12 – – – 2,705,106 – – 2,705,106 2,693,302 Available-for-sale financial assets: – Equity shares 7 – – 242,199 – – – 242,199 242,199 – Unit trusts and funds 7 – – 12,600 – – – 12,600 12,600 Financial assets at fair value through profit or loss, on initial recognition: – Equity shares 7 52,432 – – – – – 52,432 52,432 – Unit trusts and funds 7 1,957 – – – – – 1,957 1,957 – Forward foreign exchange contracts 7 15,180 – – – – – 15,180 15,180 – Foreign exchange swap contracts 7 120 – – – – – 120 120 Hedge of net investment in foreign operations: – Forward foreign exchange contracts 7 – 122 – – – – 122 122 Cash flow hedges: – Forward foreign exchange contracts 7 – 17,208 – – – – 17,208 17,208 – Fuel oil swaps 7 – 817 – – – – 817 817 – Interest rate swaps 7 – 3,123 – – – – 3,123 3,123
69,689 21,270 254,799 5,852,350 – – 6,198,108 6,190,580
* Excludes Goods and Services Tax.
SEMBCORP INDUSTRIES ANNUAL REPORT 2015 313312 BUILDING THE FUTURE

NOTES TO THE FINANCIAL STATEMENTSYear ended December 31, 2015
36. Financial Instruments (cont’d)
f. Fair value versus carrying amounts (cont’d)
Other financial Other financial
liabilities liabilities
Fair value within the outside the Total
Designated – hedging Available- Loans and scope of scope of carrying
at fair value instruments for-sale receivables FRS 39 FRS 39 amount Fair value
Note S$’000 S$’000 S$’000 S$’000 S$’000 S$’000 S$’000 S$’000
Group December 31, 2014 Trade payables 15 – – – – 1,873,742 – 1,873,742 1,873,742 Amounts due to non-controlling interests ** 15 – – – – 11,246 – 11,246 11,246 Other payables ** 15 – – – – 798,331 – 798,331 798,331 Other long-term payables ** 15 – – – – 4,301 – 4,301 4,301 Amounts due to related parties ** 16 – – – – 2,881 – 2,881 2,881 Financial liabilities at fair value through profit or loss, on initial recognition: – Forward foreign exchange contracts 18 3,254 – – – – – 3,254 3,254 – Foreign exchange swap contracts 18 4,536 – – – – – 4,536 4,536 Hedge of net investment in foreign operations: 18 – Forward foreign exchange contracts 18 – – – – – – – – – Cross currency swaps 18 – 42,072 – – – – 42,072 42,072 Cash flow hedges: – Forward foreign exchange contracts 18 – 83,006 – – – – 83,006 83,006 – Interest rate swaps 18 – 8,543 – – – – 8,543 8,543 – Fuel oil swaps 18 – 130,991 – – – – 130,991 130,991 Put liability to acquire non-controlling interests 18 – – – – – – – – Interest-bearing borrowings: – Short-term borrowings 20 – – – – 1,082,359 – 1,082,359 1,082,359 – Long-term borrowings 20 – – – – 3,636,380 – 3,636,380 3,752,761 – Finance lease liabilities 20 – – – – – 15,842 15,842 15,842
7,790 264,612 – – 7,409,240 15,842 7,697,484 7,813,865
** Excludes advance payments, deferred income, deferred grants, rental payable, Goods and Services Tax, and employee benefits.
SEMBCORP INDUSTRIES ANNUAL REPORT 2015 315314 BUILDING THE FUTURE

NOTES TO THE FINANCIAL STATEMENTSYear ended December 31, 2015
36. Financial Instruments (cont’d)
f. Fair value versus carrying amounts (cont’d)
Other financial Other financial
liabilities liabilities
Fair value within the outside the Total
– hedging Loans and scope of scope of carrying
instruments receivables FRS 39 FRS 39 amount Fair value
Note S$’000 S$’000 S$’000 S$’000 S$’000 S$’000
Company December 31, 2015 Cash and cash equivalents 14 – 325,831 – – 325,831 325,831 Trade receivables 8 – 81,003 – – 81,003 80,824 Other loans and receivables * 8 – 41,914 – – 41,914 41,914 Amounts due from related parties 9 – 148,741 – – 148,741 149,620 – 597,489 – – 597,489 598,189
Trade payables 15 – – 4,318 – 4,318 4,318 Other payables ** 15 – – 98,106 – 98,106 98,106 Amounts due to related parties 16 – – 270,854 – 270,854 269,143 Cash flow hedges: – Forward foreign exchange contracts 18 – – – – – – Interest-bearing borrowings: – Finance lease liabilities 20 – – – 3 3 3 – – 373,278 3 373,281 371,570
December 31, 2014 Cash and cash equivalents 14 – 198,395 – – 198,395 198,395 Trade receivables 8 – 91,914 – – 91,914 91,624 Other loans and receivables * 8 – 57,228 – – 57,228 57,228 Amounts due from related parties 9 – 11,422 – – 11,422 11,422 – 358,959 – – 358,959 358,669
Trade payables 15 – – 10,329 – 10,329 10,329 Other payables ** 15 – – 124,996 – 124,996 124,996 Amounts due to related parties 16 – – 567,828 – 567,828 575,022 Cash flow hedges: – Forward foreign exchange contracts 18 1,558 – – – 1,558 1,558 Interest-bearing borrowings: – Finance lease liabilities 20 – – – 11 11 11 1,558 – 703,153 11 704,722 711,916
* Excludes Goods and Services Tax.
** Excludes advance payments, deferred income, deferred grants, Goods and Services Tax and employee benefits.
36. Financial Instruments (cont’d)
g. Capital managementThe Group aims to maintain a sound capital base so as to maintain investor, creditor and market confidence and to sustain future development and growth of its businesses, while at the same time maintaining an appropriate dividend policy to reward shareholders. The Group monitors Economic Value Added attributable to shareholders, which the Group defines as net operating profit after tax less capital charge excluding non-controlling interests. Management also monitors the level of dividends paid to ordinary shareholders.
The Group seeks to maintain a balance between the higher returns that might be possible with higher levels of borrowings and the advantages and security afforded by a sound capital position. Capital is defined as equity attributable to the equity holders. The Group’s debt to capitalisation ratio as at the balance sheet was as follows:
Group
2015 2014
S$’000 S$’000
Debt 6,832,949 4,742,943 Total equity 8,043,494 7,232,274Total debt and equity 14,876,443 11,975,217
Debt-to-capitalisation ratio 0.46 0.40
There were no changes in the Group’s approach to capital management during the year.
Neither the Company nor any of its subsidiaries are subject to externally imposed capital requirements.
37. Contingent Assets / Liabilities (Unsecured)The principal risk to which the Group and the Company is exposed is credit risk in connection with guarantee contracts it has issued. The credit risk represents the loss that would be recognised upon a default by the parties to which the guarantees were given on behalf of. To mitigate these risks, management continually monitors the risks and has established processes including performing credit evaluations of the parties it is providing the guarantee on behalf of.
There are no terms and conditions attached to the guarantee contracts that would have a material effect on the amount, timing and uncertainty of the Group’s and Company’s future cash flows.
Estimates of the Group’s and Company’s obligation arising from financial guarantee contracts may be affected by future events, which cannot be predicted with any certainty. The assumptions made may well vary from actual experience so that the actual liability may vary considerably from the best estimates. As of balance sheet date, there is no provision made in respect of the obligations.
Contingent AssetsGroupTwo of the Group’s entities in India suffered asset damage and coal loss as a result of the cyclone that occurred in November 2015. As at December 31, 2015, these entities have reported losses to be claimed from the respective insurers.
SEMBCORP INDUSTRIES ANNUAL REPORT 2015 317316 BUILDING THE FUTURE

NOTES TO THE FINANCIAL STATEMENTSYear ended December 31, 2015
37. Contingent Assets / Liabilities (Unsecured) (cont’d)
Contingent LiabilitiesGroupThe Group has provided guarantees to banks to secure banking facilities provided to joint ventures. These financial guarantee contracts are accounted for as insurance contracts. As at the balance sheet date, the Group had the following contingent liabilities:
Group
2015 2014
S$’000 S$’000
Guarantees given to banks to secure banking facilities provided to: – Joint ventures 1,135,887 903,388 – Others 3,154 5,114 Performance guarantees to external parties 234,492 246,010 The periods in which the financial guarantees expire are as follows:
Group
2015 2014
S$’000 S$’000
Less than 1 year 577,595 32,942 Between 1 to 5 years 264,708 738,815 More than 5 years 296,738 136,745 1,139,041 908,502
a. A Wayleave Agreement was entered into between Sembcorp Gas Pte Ltd (SembGas) and the Government of Singapore with respect to certain pipelines where SembGas would indemnify the Government of Singapore against all claims, actions, demands, proceedings, liabilities, damages, costs and expenses arising out of or in connection with any occurrence during the use, maintenance or operations of these pipelines. No such claim has arisen to date.
b. Thermal Powertech Corporation India Limited (TPCIL) had received the provisional Mega Power Project status on September 26, 2011. With the status, TPCIL is exempted from payment of customs duty on import of plant and equipment. TPCIL is required to fulfil conditions stipulated for the Mega Power Project within 5 years from the date of import for provisional mega power projects. If the conditions are not fulfilled, TPCIL is required to make payment of the benefits availed, including interest (note 3(x)). The management is of the view that no provision is required at the year end as the status will be fulfilled in 2016. In February 2016, TPCIL has secured the letter of award for a second long-term power purchase agreement and is eligible for mega power status.
c. Certain of the Group’s subsidiaries are involved in litigations and land disputes in India as at the year end. Due to the nature of these disputes and also in view of the uncertainty of the outcome, the Group believes that the amount of exposure cannot currently be determinable.
37. Contingent Assets / Liabilities (Unsecured) (cont’d)
Contingent Liabilities (cont’d)
Group (cont’d)
d. During the year, a customer, Marco Polo Drilling (I) Pte. Ltd. (MPD), alleged that a subsidiary of Sembcorp Marine Ltd (SCM) has not complied with certain of its material contractual obligations and purported to terminate the contract and consequently sought refund of 50% of the initial instalment being the sum of S$30,094,000 (US$21,430,000) from the subsidiary and related interest charges. The subsidiary disagrees with MPD’s allegations and right to terminate the contract, and has not recognised a provision for refund, as claimed by MPD. The subsidiary strongly believes that it has the contractual entitlement to retain the 50% of the initial instalment.
Subsequently, the subsidiary terminated the contract after MPD failed to make payment of the balance 50% of the initial instalment being the sum of S$30,094,000 (US$21,430,000) which was due since February 2014. Accordingly, the contract revenue and related cost of sales, previously recognised according to the stage of completion, were reversed up to the cash collected upon termination of the contract.
The subsidiary continues to seek payment of S$30,094,000 (US$21,430,000) from MPD since the subsidiary’s contractual right of payment extends to the full initial instalment received and receivable from MPD. Based on the prevailing facts and circumstances surrounding the contract termination with MPD, the contingent asset of S$30,094,000 (US$21,430,000) has not been recognised as at the balance sheet date.
The disputes with MPD may in due course be referred to arbitration. The subsidiary has also commenced an action against MPD’s parent company in the Singapore High Court on December 1, 2015 to recover among others, the balance 50% of the initial instalment.
Companya. The Company has provided guarantees to banks to secure banking facilities provided to a wholly-owned subsidiary,
Sembcorp Financial Services Pte Ltd. These financial guarantee contracts are accounted for as insurance contracts.
Intra-group financial guarantees comprise guarantees granted by the Company to banks in respect of banking facilities amounting to S$3,618 million (2014: S$3,460 million), which include S$1,190 million (2014: S$1,292 million) drawn down as at balance sheet date. The periods in which the financial guarantees expire are as follows:
Company
2015 2014
S$’000 S$’000
Less than 1 year 91,494 101,660 Between 1 to 5 years 548,580 321,326 More than 5 years 550,000 868,748
1,190,074 1,291,734
SEMBCORP INDUSTRIES ANNUAL REPORT 2015 319318 BUILDING THE FUTURE

NOTES TO THE FINANCIAL STATEMENTSYear ended December 31, 2015
37. Contingent Assets / Liabilities (Unsecured) (cont’d)
Contingent Liabilities (cont’d)
Company (cont’d)
b. The Company has provided corporate guarantees of S$81.2 million (2014: S$104.9 million) to a subsidiary, Sembcorp Cogen Pte Ltd (SembCogen) for the following:
i. long-term contract (End User Agreement) dated January 15, 1999 with a fellow subsidiary, SembGas to purchase natural gas over the period of 22 years.
Under the End User Guarantee Agreement, the Company and one of its subsidiaries, Sembcorp Utilities Pte Ltd, issued corporate guarantees in favour of SembGas for 70% and 30% respectively of SembCogen’s obligations under the End User Agreement.
ii. two long-term agreements entered in 2010 for the purchase of a total 42 BBtud (Billion British thermal units per day) of liquefied natural gas (LNG) from BG Singapore Gas Marketing Pte Ltd (BG). The agreements have a term of 10 years and SembCogen has an option to extend the term by 2 successive periods of 5 years each subject to fulfilment of conditions set in the agreements. The obligations of SembCogen under the LNG purchase agreements are currently secured by corporate guarantees issued by the Company in favour of BG.
38. CommitmentsCommitments not provided for in the financial statements are as follows:
Group
2015 2014
S$’000 S$’000
– Commitments in respect of contracts placed 672,949 849,232 – Uncalled capital and commitments to subscribe for additional shares in joint ventures and other investments 182,362 378,761 855,311 1,227,993
At the balance sheet date, commitments in respect of payments for non-cancellable operating leases mainly for land and buildings with a term of more than one year are as follows:
Group Company
2015 2014 2015 2014
S$’000 S$’000 S$’000 S$’000
Lease payments due: Within 1 year 38,613 37,740 9,885 9,638 Between 1 and 5 years 117,824 123,667 23,912 26,842 After 5 years 478,180 511,598 56,446 60,517 634,617 673,005 90,243 96,997
On January 15, 1999, Sembcorp Gas Pte Ltd (SembGas) entered into a long-term Gas Sales Agreement to purchase 2,625,000 BBtu (Billion British thermal units) of natural gas over a period of 22 years. SembGas also entered into agreements with certain customers for the on-sale of this gas, which agreements incorporated provisions, which specifically deal with, inter alia, SembGas’ liability for shortfalls in deliveries of gas and relief from such liability in certain circumstances.
On April 15, 2008, SembGas entered into another agreement to import an additional tranche of 90 BBtu per day of natural gas over a period of 15 years, with first delivery of gas taken place in 2011.
38. Commitments (cont’d)
In 2010, Sembcorp Cogen Pte Ltd entered into two long-term agreements to purchase liquefied natural gas (LNG), usage of LNG Terminal and other charges over a period of 10 years and has the option to extend the term by two successive periods of 5 years.
In 2012, Thermal Powertech Corporation India Limited (TPCIL) had entered into a 10-year agreement with PT. Bayan Resources TBK, to purchase a total of 10 million metric tonnes of coal. The coal price shall be based on Global Coal Index at the time of delivery. In 2013, TPCIL entered into a 20-year agreement with Mahanadi Coalfields Limited, to purchase a 2.54 million metric tonnes at the price governed by local government authority.
The Group leases out its investment properties and marine vessel. Non-cancellable operating lease rentals are receivable as follows:
Group
2015 2014
S$’000 S$’000
Lease receivable: Within 1 year 72,231 64,726 Between 1 and 5 years 112,104 168,092 More than 5 years 1,235 – 185,570 232,818
39. Segment Reportinga. Operating Segments
For management purposes, the Group is organised into business units based on their products and services, and has four reportable operating segments as follows:
i. The Utilities segment’s principal activities are in the provision of energy, water, on-site logistics and solid waste management to industrial and municipal customers. Key activities in the energy sector include power generation and retail, process steam production and supply, as well as natural gas import, supply and retail. In the water sector, the business offers wastewater treatment as well as the production and supply of reclaimed, desalinated and potable water and water for industrial use.
ii. The Marine segment focuses principally on providing integrated solutions for the marine and offshore industry. Key capabilities include rigs & floaters; repairs & upgrades; offshore platforms and specialised shipbuilding.
iii. The Urban Development segment owns, develops, markets and manages integrated urban developments comprising industrial parks as well as business, commercial and residential space in Asia.
iv. Others / Corporate segment comprises businesses mainly relating to minting, design and construction activities, offshore engineering and others.
SEMBCORP INDUSTRIES ANNUAL REPORT 2015 321320 BUILDING THE FUTURE

NOTES TO THE FINANCIAL STATEMENTSYear ended December 31, 2015
39. Segment Reporting (cont’d)
a. Operating Segments (cont’d)
Management monitors the operating results of its business units separately for the purpose of making decisions about resource allocation and performance assessment. Information regarding the results of each reportable segment is included below:
Urban Others /
Utilities Marine Development Corporate Elimination Total
S$’000 S$’000 S$’000 S$’000 S$’000 S$’000
2015 Turnover External sales 4,227,353 4,967,438 7,949 341,881 – 9,544,621 Inter-segment sales 31,098 694 4,224 2,057 (38,073) –Total 4,258,451 4,968,132 12,173 343,938 (38,073) 9,544,621
Results Segment results 825,849 (168,569) (6,999) (25,002) – 625,279 Finance income 21,953 10,813 236 51,942 (52,088) 32,856 Finance costs (194,555) (46,775) (2,631) (46,111) 52,088 (237,984) 653,247 (204,531) (9,394) (19,171) – 420,151 Share of results of associates and joint ventures, net of tax 121,657 (173,499) 45,517 12,524 – 6,199 774,904 (378,030) 36,123 (6,647) – 426,350 Tax (expense) / credit (43,596) 77,860 (1,381) (4,831) – 28,052 Non-controlling interests (29,838) 123,731 (1,252) 1,812 – 94,453Net profit / (loss) for the year 701,470 (176,439) 33,490 (9,666) – 548,855
Assets Segment assets 8,386,532 8,862,186 409,377 1,687,124 (1,863,931) 17,481,288 Interests in associates and joint ventures 1,287,580 328,030 632,810 100,837 – 2,349,257 Tax assets 57,271 27,392 – 284 – 84,947Total assets 9,731,383 9,217,608 1,042,187 1,788,245 (1,863,931) 19,915,492
Liabilities Segment liabilities 5,074,185 6,442,885 226,872 1,480,597 (1,863,931) 11,360,608 Tax liabilities 403,109 91,594 1,951 14,736 – 511,390Total liabilities 5,477,294 6,534,479 228,823 1,495,333 (1,863,931) 11,871,998
Capital expenditure 535,693 904,891 682 7,011 – 1,448,277
Significant non-cash items Depreciation and amortisation 261,731 132,165 1,711 9,354 – 404,961 Allowance made for impairment in value of assets and assets written off (net) 70,685 20,122 19 34,538 – 125,364 Allowance made / (Written back) for doubtful debts and bad debts 47,589 153,894 37 (50) – 201,470 Work-in-progress written down – 85,518 – – – 85,518 Provision for foreseeable losses on construction work-in-progress – 277,961 – – – 277,961
39. Segment Reporting (cont’d)
a. Operating Segments (cont’d)
Urban Others /
Utilities Marine Development Corporate Elimination Total
S$’000 S$’000 S$’000 S$’000 S$’000 S$’000
2014 Turnover External sales 4,849,816 5,830,739 6,539 207,566 – 10,894,660 Inter-segment sales 41,078 1,856 4,198 10,871 (58,003) –Total 4,890,894 5,832,595 10,737 218,437 (58,003) 10,894,660
Results Segment results 432,846 707,966 (295) (1,639) – 1,138,878 Finance income 13,492 9,711 69 46,612 (50,453) 19,431 Finance costs (52,634) (20,960) (1,746) (45,245) 50,453 (70,132) 393,704 696,717 (1,972) (272) – 1,088,177 Share of results of associates and joint ventures, net of tax 89,026 9,859 47,800 11,576 – 158,261 482,730 706,576 45,828 11,304 – 1,246,438 Tax (expense) / credit (53,326) (105,506) 319 (3,643) – (162,156) Non-controlling interests (21,450) (261,052) (1,805) 1,121 – (283,186)Net profit for the year 407,954 340,018 44,342 8,782 – 801,096
Assets Segment assets 7,153,442 7,760,835 347,755 1,754,605 (1,972,859) 15,043,778 Interests in associates and joint ventures 933,693 486,251 565,438 89,012 – 2,074,394 Tax assets 49,669 8,247 214 90 – 58,220Total assets 8,136,804 8,255,333 913,407 1,843,707 (1,972,859) 17,176,392
Liabilities Segment liabilities 4,356,366 4,850,190 169,530 1,869,385 (1,972,859) 9,272,612 Tax liabilities 401,793 254,062 1,375 14,276 – 671,506Total liabilities 4,758,159 5,104,252 170,905 1,883,661 (1,972,859) 9,944,118
Capital expenditure 503,595 798,499 3,336 2,411 – 1,307,841
Significant non-cash items Depreciation and amortisation 189,608 115,561 1,441 8,224 – 314,834 Allowance for / (Write-back of) impairment in value of assets and assets written off (net) 10,541 232 (3,749) – – 7,024 (Written back) / Allowance made for doubtful debts and bad debts (1,524) 489 (120) 389 – (766)
SEMBCORP INDUSTRIES ANNUAL REPORT 2015 323322 BUILDING THE FUTURE

NOTES TO THE FINANCIAL STATEMENTSYear ended December 31, 2015
39. Segment Reporting (cont’d)
b. Geographical SegmentsThe Group operates in ten principal geographical areas: Singapore, Rest of ASEAN & Australia, China, India, Middle East & Africa, UK, Rest of Europe, Brazil, U.S.A and Other Countries. In presenting information on the basis of geographical segments, segment revenue is based on the geographical location of customers. Segment assets and total assets are based on the geographical location of the assets.
Rest of ASEAN Middle East Rest of Other
Singapore & Australia China India & Africa UK Europe Brazil U.S.A Countries Total
S$’000 S$’000 S$’000 S$’000 S$’000 S$’000 S$’000 S$’000 S$’000 S$’000 S$’000
2015 Revenue from external customers 3,727,411 394,983 165,952 456,871 105,884 465,764 2,658,376 89,466 1,403,199 76,715 9,544,621Total assets 10,515,550 1,022,301 1,935,721 4,140,771 451,242 334,314 261,054 1,083,112 7,182 164,245 19,915,492Non-current assets 4,533,966 762,070 1,534,751 3,487,111 392,469 201,197 238,003 1,011,258 5,089 141,889 12,307,803Capital expenditure 559,864 15,442 79,954 308,814 5,229 18,122 – 449,692 112 11,048 1,448,277
2014 Revenue from external customers 5,074,017 698,344 162,123 22,510 123,201 550,908 2,084,138 127,511 1,327,512 724,396 10,894,660Total assets 9,628,618 875,032 1,746,961 2,389,553 446,370 792,988 248,466 883,696 6,924 157,784 17,176,392Non-current assets 4,197,697 844,871 1,503,947 2,267,496 348,903 665,287 233,144 841,018 4,675 138,903 11,045,941Capital expenditure 402,810 20,303 70,617 256,060 4,733 29,165 – 514,785 29 9,339 1,307,841
40. Significant Accounting Estimates and JudgementsEstimates, assumptions concerning the future and judgements are made in the preparation of the financial statements. They affect the application of the Group’s accounting policies, reported amounts of assets, liabilities, income and expenses, and disclosures made. They are assessed on an on-going basis and are based on experience and relevant factors, including expectations of future events that are believed to be reasonable under the circumstances.
Key sources of estimation uncertaintyThe key assumptions concerning the future and other key sources of estimation uncertainty at the balance sheet date, that have a significant risk of causing a material adjustment to the carrying amounts of assets and liabilities within the next financial year are discussed below.
Information on other significant areas of estimation uncertainty and critical judgements in applying accounting policies that have the most significant effect on the amounts recognised in the financial statements are described in the following notes:
a. Impairment of non-financial assetsThe Group assess whether there are any indicators of impairment for all non-financial assets at each reporting date. Goodwill and other intangible assets are tested for impairment annually and at other times when such indicators exist. Other non-financial assets are tested for impairment when there are indicators that the carrying amounts may not be recoverable.
This requires an estimation of the value in use of the cash-generating units to which the non-financial assets are allocated. Estimating the value-in-use requires the Group to make an estimate of the expected future cash flows from the cash-generating unit and also to choose a suitable discount rate in order to calculate the present value of those cash flows. Information about the assumptions and their risk factors relating to non-financial assets are disclosed in Notes 3 and 10.
SEMBCORP INDUSTRIES ANNUAL REPORT 2015 325324 BUILDING THE FUTURE

NOTES TO THE FINANCIAL STATEMENTSYear ended December 31, 2015
40. Significant Accounting Estimates and Judgements (cont’d)
Key sources of estimation uncertainty (cont’d)
b. TaxesThe Group is subject to taxes in numerous jurisdictions. Significant judgement is involved in determining the group-wide provision for taxes. In determining the amount of current and deferred tax, the Group takes into account the impact of uncertain tax positions and whether additional taxes and interest may be due.
There are certain transactions and computation for which the ultimate tax determination is uncertain during the ordinary course of business. The Group recognises liabilities for expected tax issues based on estimates of whether additional taxes will be due. The Group believes that its accruals for tax liabilities are adequate for all open years based on its assessment of many factors, including interpretations of tax law and prior experience. This assessment relies on estimates and assumptions and may involve a series of judgements about future events. Where the final tax outcome of these matters is different from the amounts that were initially recorded, such differences will impact the taxes and deferred tax provisions in the period in which such determination is made. The tax expense is disclosed in Note 27.
c. Pension assumptionsThe Group has decided on certain principal actuarial assumptions, as detailed in Note 19, in estimating its pension liability as at the balance sheet date. If there were adverse changes to these actuarial assumptions, then the Group’s re-measurements from defined benefit plans would increase.
d. Depreciation of property, plant and equipmentProperty, plant and equipment are depreciated on a straight-line basis over their estimated useful lives. Management estimates the useful lives of these property, plant and equipment to be within 1 to 80 years. The carrying amount of the Group’s property, plant and equipment are set out in Note 3. Changes in the expected level of usage and technological developments could impact the economic useful lives and the residual values of these assets, therefore future depreciation charges could be revised.
e. Provision for restoration costsThe provision recognised represents management’s best estimate of the present value of the future costs required. Significant estimates and assumptions are made in determining the amount of restoration provisions. Those estimates and assumptions deal with uncertainties such as: changes to the relevant legal and regulatory framework; the timing, extent and costs required. These uncertainties may result in future actual expenditure differing from the amounts currently provided. The provisions recognised are periodically reviewed and updated based on the facts and circumstances available at the time. Changes to the estimated future costs are recognised in the balance sheet by adjusting both the asset and provision. Such changes give rise to a change in future depreciation and interest charges.
f. Fair value measurementThe Group has made certain assumptions in estimating fair values which are defined in Note 2(ac) and included in Note 18 – Put liability to acquire non-controlling interests.
40. Significant Accounting Estimates and Judgements (cont’d)
Key sources of estimation uncertainty (cont’d)
g. Provisions and contingent liabilitiesEstimates of the Group’s obligations arising from contracts or regulations that exist as at balance sheet date may be affected by future events, which cannot be predicted with any certainty. The assumptions and estimates are made based on the management’s knowledge and experience and may vary from actual experience so that the actual liability may vary considerably from the best estimates.
Where it is not probable that an outflow of economic benefits will be required, or the amount cannot be estimated reliably, the obligation is disclosed as a contingent liability, unless the probability of outflow of economic benefits is remote. Possible obligations, whose existence will only be confirmed by the occurrence or non-occurrence of one or more future events are also disclosed as contingent liabilities unless the probability of outflow of economic benefits is remote. Movements in provisions and disclosure of contingent liabilities are detailed in Note 17 and Note 37 respectively.
h. Determination of net realisable value of inventoriesThe net realisable value of certain inventories of the offshore marine sector is estimated by reference to latest quotations and independent brokers’ valuation. However, such net realisable value estimated where a reasonably possible range is provided by the independent brokers, may not be the actual realisable value. Such uncertainties may significantly affect the net realisable value of inventories and there is a significant risk of resulting in a material adjustment to the carrying amounts of inventories in future periods.
Critical accounting judgements in applying the Group’s accounting policiesIn the process of applying the Group’s accounting policies, management has made certain judgements, apart from those involving estimations, which have significant effect on the amounts recognised in the financial statements.
a. Revenue recognitionThe Group has recognised revenue on construction contract, rigs & floaters, repairs & upgrades and offshore platforms based on the percentage of completion method in proportion to the stage of completion. The percentage of completion is assessed by reference to surveys of work performed. Significant judgement is required in determining the appropriate stage of completion and estimating a reasonable contribution margin for revenue and costs recognition. Revenue from construction contract, ship and rig repair, building and conversion is disclosed in Note 25.
Significant judgement is also required in determining the triggering point of suspension of revenue recognition when it is no longer probable that inflow of economic benefits associated with the contracts will occur. Such considerations include the Group’s assessment of the credit-worthiness of customers and an evaluation of the contract performance obligations discharged by the customers.
b. Assessment of risk of foreseeable losses and cost allocation method on long-term land development and construction contractsThe Group conducts critical review of all its long-term land development and construction contracts regularly. Allowance is made where necessary to account for foreseeable losses where total costs to complete the contracts exceed the contract revenue. To determine the total costs, the Group monitors and reviews constantly the progress of all long-term land development and construction contracts taking into consideration all inputs from both internal project managers and external customers. The review includes evaluation of any potential risks and factors which may affect the contract price and timely completion. The review also encompasses the cost analysis process whereby both actual costs incurred and future costs to complete are critically examined.
Land development costs incurred are capitalised as work-in-progress and allocated to the respective parcels of land based on the relative sales method.
SEMBCORP INDUSTRIES ANNUAL REPORT 2015 327326 BUILDING THE FUTURE

NOTES TO THE FINANCIAL STATEMENTSYear ended December 31, 2015
40. Significant Accounting Estimates and Judgements (cont’d)
Critical accounting judgements in applying the Group’s accounting policies (cont’d)
c. Impairment of investments and financial assetsThe Group follows the guidance of FRS 39 Financial Instruments: Recognition and Measurement in determining when an investment or financial asset is other than temporarily impaired. This determination requires significant judgement. The Group evaluates, among other factors, the duration and extent to which the fair value of an investment and financial asset is less than its cost; and the financial health of and near-term business outlook for the investment or financial asset, including factors such as industry and sector performance, changes in technology and operational and financing cash flow. The carrying amounts of investments and financial assets are disclosed in the following notes:
• Note 7 – Other Financial Assets
• Note 8 – Trade and Other Receivables
In assessing whether there is any objective evidence that its investment in available-for-sale financial assets is impaired, the Group takes into consideration whether there is a significant or prolonged decline in the fair value of its investment, alongside with other considerations such as volatility of the share price relative to general stock indices, analysts’ reports on outlook of the underlying security, recovery in share price shortly after the year end provided that it was not concluded that the investment was impaired in the past, and other qualitative factors such as the financial performance of the investment.
d. Impairment assessment of property, plant and equipmentThe carrying value of property, plant and equipment is tested for impairment whenever there is any objective evidence or indication that the property, plant and equipment may be impaired. This determination requires significant judgement. This impairment takes into account the market value of the asset, changes to the technological, market, economic or legal environment in which the Group operates, market interest rates, evidence of obsolescence or physical damage to the property, plant and equipment and changes to the expected usage to the property, plant and equipment..
40. Significant Accounting Estimates and Judgements (cont’d)
Critical accounting judgements in applying the Group’s accounting policies (cont’d)
d. Impairment assessment of property, plant and equipment (cont’d)
Impairment assessment of the Group’s shipyardsOwing to the current year’s losses and adverse macroeconomic conditions impacting the offshore and marine sector, there was an indication that the Group’s subsidiary, Sembcorp Marine Ltd’s (SCM) shipyards (the “cash generating units” (CGU)) might be impaired. Under the Group’s formal impairment assessment of the individual CGUs in: (i) Singapore (together with its sub-contracting shipyards in Indonesia and the United Kingdom); and (ii) Brazil, the recoverable amounts for the Group’s individual CGUs were determined using the value in use calculations.
The value in use calculation for the Group’s CGUs used discounted cash flow projections which took into account management’s assessment of the forecasted order book over a period of 5 years and 10 years for Singapore and Brazil (the “projection periods”), respectively, with applicable growth rates for Singapore and Brazil, respectively, beyond the projection periods. The forecasted order book and the related project margins are the key drivers supporting the recoverable amounts. The projected cash flows are supported by the Group’s historical experience, market observable data surrounding the oil majors’ capital commitment in oil and gas production and exploration activities, market expectations and developments for contract order prices, and other external sources. These cash flows are then discounted using the applicable discount rate based on their weighted average cost of capital for the Singapore individual CGUs and for Brazil; and the Group assessed that no impairment loss is required for all these individual CGUs.
The forecasted order book assumed in the value in use calculation is, however, subject to estimation uncertainties that may have a significant risk of resulting in a material adjustment in any future periods affected.
The estimation uncertainties of the forecasted order book of the Singapore CGU are, however, reduced by a certain level of firm committed order books already secured by the Group. Nevertheless, there are remaining estimation uncertainties surrounding the remaining uncommitted order book, and forecast project margins, that may result in significant adjustments in the future periods.
The Brazil CGU is presently undergoing yard construction in Brazil, and completion of yard facilities that is key to production is projected to be the end of 2016; and the yard will gradually ramp up to its full operational capacity. The Group has prepared a 10 year projection period and changes in the recoverable amount are sensitive to impairment losses if the forecast order book beyond the near term were to deviate significantly from the original forecast. The recoverable amount of the Brazil CGU will be subject to review at regular intervals.
Impairment assessment of the Group’s marine vesselIn estimating the recoverable amount of the marine accommodation vessel, the Group assumed a post-contractual renewal rate, determined to be at 10% discount from the existing contractual rate and operating at 95% utilisation rate throughout the cash flow periods. The assumed renewal rates, after the contract expires in 2018, as well as the expected utilisation rate, however, continue to be subject to estimation uncertainties that may result in material adjustments on the vessel’s recoverable amounts in future periods.
e. Classification of development propertiesIn assessing the classification of development properties, management considers its intention with regards to the use of the properties, i.e. held with the intention of development and sale in the ordinary course of business or for rental and capital appreciation. Where there is a change in intended use, a change in classification may be required.
SEMBCORP INDUSTRIES ANNUAL REPORT 2015 329328 BUILDING THE FUTURE

NOTES TO THE FINANCIAL STATEMENTSYear ended December 31, 2015
43. SubsidiariesDetails of key subsidiaries are as follows:
Effective equity
held by the Group
Country of 2015 2014
Name of key subsidiaries incorporation % %
Utilities Sembcorp Utilities Pte Ltd 1 Singapore 100 100 Sembcorp Cogen Pte Ltd 1 Singapore 100 100 Sembcorp Gas Pte Ltd 1 Singapore 70.00 70.00 Sembcorp Utilities (UK) Limited 2 United Kingdom 100 100 Sembcorp Utilities (Netherlands) N.V. 2 The Netherlands 100 100 Sembcorp Environment Pte. Ltd. 1 Singapore 100 100 SembWaste Pte Ltd 1 Singapore 100 100 Sembcorp Yangcheng Power Co Pte Ltd 1 Cayman Islands 100 100 Thermal Powertech Corporation India Limited 2, a India 67.40 65.00 Sembcorp Green Infra Limited 2, b India 64.06 –
Marine Sembcorp Marine Ltd 1 Singapore 61.01 60.99 Jurong Shipyard Pte Ltd 1 Singapore 61.01 60.99 PPL Shipyard Pte Ltd 1 Singapore 51.85 51.84 Sembcorp Marine Repairs & Upgrades Pte. Ltd. 1 (formerly known as Sembawang Shipyard Pte Ltd) Singapore 61.01 60.99 SMOE Pte Ltd 1 Singapore 61.01 60.99
Urban Development Sembcorp Development Ltd 1 Singapore 100 100 Vietnam Singapore Industrial Park Pte Ltd 1 Singapore 92.88 92.88 Singapore Technologies Industrial Corp Ltd 1 Singapore 100 100 Nanjing Riverside Quay Co., Ltd 3 China 100 –
Others Sembcorp Design and Construction Pte Ltd 1 Singapore 100 100 Singapore Precision Industries Pte Ltd 1 Singapore 100 100
1. Audited by KPMG LLP, Singapore.
2. Audited by overseas affiliates of KPMG LLP.
3. Audited by BDO China Shu Lun Pan Certified Public Accountants Co., Ltd.
Acquisition of non-controlling interests
a. In March 2015, the Group subscribed additional shares in Thermal Powertech Corporation India Limited (TPCIL) which became a subsidiary in 2014 (Note 34). The Group’s stake in TPCIL has increased to 67.4%. As at December 31, 2015, the Group has fully injected its portion of capital to be subscribed into TPCIL but the non-controlling interest (NCI) had deferred its injection. This resulted in the Group’s shareholding to be 83.7% based on paid up subscriptions. The Group has agreed to defer the NCI injection, not to exercise dilution rights and the subscription period remains open till March 31, 2016. With that, the Group’s effective shareholding remains at 67.4%.
b. In February 2015, the Group acquired a 60% stake in Sembcorp Green Infra Limited (SGI) for a consideration of S$232,483,000 (Note 34). The Group increased its stake from 60% to 64.06% in July 2015 for a consideration amounting to S$42,912,000.
The following summarises the effect of changes of the Group’s ownership interest in TPCIL and SGI:
2015 TPCIL SGI Total S$’000 S$’000 S$’000
Group’s ownership interest at January 1 / February 13, 2015 353,210 189,376 542,586 Effect of increase in Group’s ownership interest 14,676 (1,953) 12,723 Share of comprehensive income and capital injection during the year 45,181 43,528 88,709
Group’s ownership interest at December 31, 2015 413,067 230,951 644,018
41. Subsequent Eventsi. On January 28, 2016, the Group’s wholly-owned entity Sembcorp Utilities has completed the divestment of its entire
60% stake in Sembcorp Air Products (Hyco) Pte Ltd (SembAP) to Eastman Chemical Singapore Pte. Ltd. (Eastman) for approximately S$4 million. This mutually-agreed cash amount is subject to final adjustment within 60 days; however such adjustments are not expected to be material to the Group. In addition, the Group has transferred its propylene purification plant on Jurong Island to Eastman for S$5.7 million.
ii. On February 5, 2016, the Group’s wholly-owned subsidiary China Water Company (Yancheng) Ltd has signed a conditional sale and purchase agreement to divest its entire 49% stake in Yancheng China Water Co. Ltd to Yancheng City Municipal Utilities Investment Company Ltd for RMB260 million (approximately S$57 million). Completion of the divestment is expected in mid-2016, subject to the satisfaction of certain conditions precedent, including approval by China’s relevant authorities. A net gain of approximately S$35 million is expected to be recognized upon completion of the transaction.
42. New or Revised Accounting Standards and InterpretationsA number of new standards, amendments to standards and interpretations are effective for annual periods beginning after January 1, 2015, and have not been applied in preparing these financial statements. The Group is currently assessing the potential impact of adopting these new standards and interpretations, on the financial statements of the Group and the Company.
These new standards include, among others, FRS 115 Revenue from Contracts with Customers and FRS 109 Financial Instruments which are mandatory for adoption by the Group on January 1, 2018.
FRS 115 Revenue from Contracts with Customers. It establishes a comprehensive framework for determining whether, how much and costs of obtaining and fulfilling contracts to be recognised as separate assets when specified criteria are met. When effective, FRS 115 replaces existing revenue recognition guidance, including FRS 18 Revenue, FRS 11 Construction Contracts, INT FRS 113 Customer Loyalty Programmes, INT FRS 115 Agreements for the Construction of Real Estate, INT FRS 118 Transfers of Assets from Customers and INT FRS 31 Revenue – Barter Transactions Involving Advertising Services.
FRS 109 Financial Instruments. It replaces most of the existing guidance in FRS 39 Financial Instruments: Recognition and Measurement. It includes revised guidance on classification and measurement of financial instruments, a new expected credit loss model for calculating impairment on financial assets, and new general hedge accounting requirements.
Management is currently evaluating the impact of the implementation of these standards, in view of the complexities and the potential wide-ranging implications.
The Accounting Standards Council announced on May 29, 2014 that Singapore-incorporated companies listed on the Singapore Exchange (SGX) will apply a new financial reporting framework identical to the International Financial Reporting Standards (IFRS) for financial year ending December 31, 2018. Singapore-incorporated companies listed in SGX will have to assess the impact of IFRS 1 First-time adoption of IFRS when transitioning to the new reporting framework. The Group is currently evaluating the impact of transitioning to the new reporting framework on its financial statements.
SEMBCORP INDUSTRIES ANNUAL REPORT 2015 331330 BUILDING THE FUTURE

NOTES TO THE FINANCIAL STATEMENTSYear ended December 31, 2015
44. Associates, Joint Ventures and Joint OperationsDetails of key associates, joint ventures and joint operations are as follows:
Effective equity held
by the Group
Country of 2015 2014
Name of key associates incorporation % %
Utilities * SembSita Pacific Pte Ltd 1 Singapore – 40.00 ^^ Sembcorp Salalah Power and Water Company SAOG Oman 40.00 40.00
Marine ## Cosco Shipyard Group Co Ltd 2 People’s Republic of China 18.30 18.30
Urban Development ^^ Wuxi-Singapore Industrial Park Development Co., Ltd People’s Republic of China 45.36 45.36
Effective equity held
by the Group
Country of 2015 2014
Name of key joint ventures incorporation % %
Utilities ^ Phu My 3 BOT Power Company Ltd. 3 Vietnam 66.67 66.67 # Shanghai Cao Jing Co-generation Co. Ltd People’s Republic of China 30.00 30.00 *** Emirates Sembcorp Water & Power Company P.J.S.C United Arab Emirates 40.00 40.00 ^^^ NCC Power Projects Limited India 49.00 49.00
Urban Development ^^ Vietnam Singapore Industrial Park J.V. Co., Ltd. Vietnam 47.37 47.37 ** Sino-Singapore Nanjing Eco Hi-tech Island Development Co., Ltd People’s Republic of China 21.50 21.50 ## Sino-Singapore (Chengdu) Innovation Park Development Co., Ltd People’s Republic of China 25.00 25.00 **** PT Kawansan Industri Kendal Indonesia 49.00 49.00
44. Associates, Joint Ventures and Joint Operations (cont’d)
Effective equity held
by the Group
Country of 2015 2014
Name of key joint operations incorporation % %
Others ### Sinohydro-Sembcorp Joint Venture 4 Singapore 50.00 50.00
The auditors of key associates, joint ventures and joint operations are as follows:
* Audited by Ernst & Young LLP.
^^ Audited by overseas affiliates of KPMG LLP.
## Audited by Zhongrui Yuehua Certified Public Accountants Co., Ltd.
^ Audited by Ernst & Young Vietnam Limited.
# Audited by PricewaterhouseCoopers Zhong Tian CPAs Limited Company.
*** Audited by Ernst & Young, Abu Dhabi.
** Audited by Jiangsu Gongzheng Tianye Certified Public Accountants Co., Ltd, China.
^^^ Jointly audited by M Bhaskara Rao & Co., Chartered Accountants, India, and Deloitte Haskins & Sells, Chartered Accountants, India.
### Audited by RSM Chio Lim.
**** Audited by BDO Indonesia.
1. In November 2015, the Group has completed its divestment of its 40% stake in SembSita Pacific Pte Ltd to Suez Environnement Asia.
2. The Group has significant influence in Cosco Shipyard Group through its holdings in Sembcorp Marine Ltd.
3. In September 2014, the Group has completed its acquisition of additional interest in Phu My 3 BOT Power Company (Phu My 3) on the basis that the remaining condition precedent outstanding, has been determined by management to be of an administrative procedure. As such, for accounting purposes, the Group’s stake in Phu My 3 is deemed to have increased from 33.33% to 66.67%. As the venture with the other partner under the contractual agreement requires unanimous consent for all major decisions over the relevant activities, Phu My 3 remains a joint venture.
4. In July 2014, the Group entered a 50:50 project joint agreement with Sinohydro Corporation Ltd (Singapore branch).
See Note 6 for details on pledge on the Company’s interests in its joint ventures.
SEMBCORP INDUSTRIES ANNUAL REPORT 2015 333332 BUILDING THE FUTURE

SUPPLEMENTARY INFORMATIONYear ended December 31, 2015
(Under SGX-ST Listing Manual requirements)A. Directors’ and Key Executives’ Remuneration Earned for the Year
Summary compensation table for the year ended December 31, 2015
Fair value of
share-based
compensation Directors’ fees Brought
Bonus granted for forward
Salary 1 earned the year 3 Cash-based 4 Share-based 5 bonus bank 2
Name of Director S$’000 S$’000 S$’000 S$’000 S$’000 S$’000
Payable by Company Ang Kong Hua – – – 525 225 – Tang Kin Fei 1,190 1,534 1,726 – – 3,303 Goh Geok Ling (retired on April 21, 2015) – – – 64 – – Evert Henkes (retired on April 21, 2015) – – – 78 – – Bobby Chin Yoke Choong – – – 152 65 – Margaret Lui 4 – – – 135 58 – Tan Sri Mohd Hassan Marican – – – 126 54 – Tham Kui Seng – – – 122 52 – Dr Teh Kok Peng – – – 136 58 – Ajaib Haridass – – – 123 53 – Neil McGregor 4 – – – 96 41 – Nicky Tan (appointed on November 1, 2015) – – – 12 5 –
Payable by Subsidiaries Tang Kin Fei 4 – – – 293 88 – Tan Sri Mohd Hassan Marican – – – 420 180 – Ajaib Haridass – – – 247 106 – Tham Kui Seng – – – 35 – –
Fair value of
share-based
compensation Directors’ fees Brought
Bonus granted for forward
Salary 1 earned the year 3 Cash-based 4 Share-based 5 bonus bank 2
Name of Key Executive S$’000 S$’000 S$’000 S$’000 S$’000 S$’000
Tan Cheng Guan 4 660 911 578 3 – 1,580 Koh Chiap Khiong 4 586 982 578 201 71 1,533 Ng Meng Poh 4 611 652 578 47 – 1,755 Wong Weng Sun 926 (2,699) 863 – – 6,820 Kelvin Teo 4 412 184 432 10 – 347
(Under SGX-ST Listing Manual requirements)A. Directors’ and Key Executives’ Remuneration Earned for the Year (cont’d)
Notes:
1. The amount shown is inclusive of basic salary, fixed allowances, AWS and other emoluments.
2. The Brought Forward Bonus Bank is the outstanding balance of bonus as at December 31, 2015 (incorporating any adjustment made to the bank balance but excluding the bonus earned during the financial year). Typically, one-third of the accumulated bonus comprising Bonus Earned in the financial year and the Brought Forward Bonus is paid out in cash each year, with the balance being carried forward to the following year. The balances of the bonus bank in future will be adjusted by the yearly EVA performance of the Group and its subsidiaries and the payouts made from the Bonus Bank.
3. The fair value of the share plans granted for the year is disclosed. The shares granted to key executives are contingent upon meeting performance measures. If these performance measures are not met, the key executive will not be vested with any shares.
4. Directors’ fees for Margaret Liu are payable to Azalea Asset Management Pte Ltd. Directors’ fees for Neil McGregor are payable to Temasek International Pte Ltd. Directors’ fees for Nicky Tan are payable to Tan Kok Wah and Tee Min Foundation Ltd. Directors’ fees in cash from subsidiaries for Mr Tang Kin Fei, Mr Tan Cheng Guan, Mr Koh Chiap Khiong and Mr Ng Meng Poh are payable to SCI. Directors’ fees in cash from subsidiaries for Mr Kelvin Teo are payable to Sembcorp Parks Management Pte Ltd.
5. To align the interests of the non-executive directors with the interests of shareholders, up to 30% of the aggregate directors’ fees approved by shareholders for a particular financial year may be paid out in the form of restricted share awards under the Sembcorp Industries Restricted Share Plan 2010.
From 2011, the awards granted under the Sembcorp Industries Restricted Share Plan 2010 to all directors as part of their directors’ fees (except for Mr Tang Kin Fei, who is the Group President & CEO, and who does not receive any directors’ fees) will consist of the grant of fully paid shares outright with no performance and vesting conditions attached, but with a selling moratorium. Non-executive directors are required to hold shares (including shares obtained by other means) worth at least one-time the annual base retainer (currently S$75,000); any excess may be sold as desired. A non-executive director can dispose of all of his shares one year after leaving the Board.
The actual number of shares awarded to each non-executive director will be determined by reference to the volume-weighted average price of a share on the SGX-ST over the 14 trading days from (and including) the day on which the shares are first quoted ex-dividend after the AGM (or, if the resolution to approve the final dividend is not approved, over the 14 trading days immediately following the date of the AGM). The number of shares to be awarded will be rounded down to the nearest hundred and any residual balance will be settled in cash. A non-executive director who steps down before the payment of the share component will receive all of his director’s fees for the year (calculated on a pro-rated basis, where applicable) in cash.
Details on the share options, performance shares and restricted shares granted to the directors are set out in the Share-based Incentive Plans of the Directors’ Statement.
SEMBCORP INDUSTRIES ANNUAL REPORT 2015 335334 BUILDING THE FUTURE

SUPPLEMENTARY INFORMATIONYear ended December 31, 2015
EVA STATEMENT
2015 2014
Note S$’000 S$’000
Net operating profit before tax expense 420,151 1,088,177 Adjusted for: Share of associates’ and joint ventures’ profits 42,415 194,538 Interest expense 1 240,212 77,829 Others 2 (6,358) (6,796)Adjusted profit before interest and tax 696,420 1,353,748 Cash operating taxes 3 (154,774) (186,171)Net operating profit after tax (NOPAT) 541,646 1,167,577 Average capital employed 4 15,101,288 11,083,735Weighted average cost of capital 5 6.2% 5.8%Capital charge 936,280 642,857 Economic Value Added (EVA) (394,634) 524,720 Non-controlling share of EVA 250,728 (184,792)EVA attributable to shareholders (143,906) 339,928 Less: Unusual items (UI) gains 6 (421,023) (5,960)EVA attributable to shareholders (exclude UI) (564,929) 333,968
Notes:
1. Interest expense includes imputed interest on present value of operating leases and capitalised interest charged to profit or loss upon disposal of the assets.
2. Other adjustments include recovery of investment costs, timing difference of allowances made for / (write-back) of doubtful debts, warranty, inventory obsolescence and goodwill written off / impaired and construction-in-progress.
3. The reported current tax is adjusted for the statutory tax impact of interest expense.
4. Average capital employed is computed by taking monthly average total assets less non interest-bearing liabilities plus timing provision, goodwill written off / impaired and present value of operating leases.
2015 2014
S$’000 S$’000
Major Capital Components: Property, plant and equipment 8,894,600 6,660,189 Investments 2,711,106 2,386,455 Other long-term assets 873,257 692,849 Net working capital and long-term liabilities 2,622,325 1,344,242Average capital employed 15,101,288 11,083,735
5. The Weighted Average Cost of Capital is calculated in accordance with the Sembcorp Group EVA Policy as follows:
i. Cost of Equity using Capital Asset Pricing Model with market risk premium at 5.0% (2014: 5.0%);
ii. Risk-free rate 2.26% (2014: 2.12%) based on yield-to-maturity of Singapore Government 10-year Bonds;
iii. Ungeared beta ranging from 0.5 to 1.0 (2014: 0.5 to 1.0) based on Sembcorp Industries’ risk categorisation; and
iv. Cost of Debt rate at 2.65% (2014: 2.47%).
6. Unusual items (UI) refer to gain / loss on divestment of subsidiaries, associates, joint ventures, long-term investments and disposal of major property, plant and equipment.
(Under SGX-ST Listing Manual requirements)B. Interested Person Transactions
Interested person transactions carried out during the financial year which fall under Chapter 9 of the Listing Manual of the Singapore Exchange Securities Trading Limited (SGX-ST) are as follows:
Aggregate value of all interested person transactions conducted under shareholders’ mandate
pursuant to Rule 920 of the SGX-ST Listing Manual (excluding transactions less than S$100,000)
2015
S$’000
Sale of goods and services Temasek Holdings (Private) Limited and its Associates – Accuron Technologies Limited and its Associates 1,424 – Mapletree Investments Pte Ltd and its Associates 3,041 – PSA International Pte Ltd and its Associates 6,328 – Singapore Power Limited and its Associates 11,671 – Singapore Technologies Telemedia Pte Ltd and its Associates 260 – Temasek Capital (Private) Limited and its Associates 9,306 – Wildlife Reserves Singapore Pte Ltd and its Associates 3,091 35,121 Olam International Ltd and its Associates 910 Starhub Ltd and its Associates 8,769 SATS Ltd and its Associates 132 Singapore Airlines Limited and its Associates 4,944 Singapore Technologies Engineering Ltd and its Associates 18,562 STATS ChipPAC Ltd and its Associates 379 68,817Purchase of goods and services Temasek Holdings (Private) Limited and its Associates – Mapletree Investments Pte Ltd and its Associates 3,124 – Singapore Power Limited and its Associates 4,930 – Temasek Capital (Private) Limited and its Associates 1 579,887 587,941 Singapore Technologies Engineering Ltd and its Associates 441 588,382Management and support services Temasek Holdings (Private) Limited and its Associates – Temasek Capital (Private) Limited and its Associates 3,039Total interested person transactions 660,238
Note:
1. This relates mainly to the purchase of gas by Sembcorp Cogen Pte Ltd from Sembcorp Gas Pte Ltd for the generation of electricity. Sembcorp Gas Pte Ltd is 30% owned by Seletar Investments Pte Ltd, a wholly-owned subsidiary of Temasek Holdings (Private) Limited.
SEMBCORP INDUSTRIES ANNUAL REPORT 2015 337336 BUILDING THE FUTURE

SHAREHOLDERS’ INFORMATION
Statistics of Shareholders as of March 1, 2016Issued and fully paid-up capital: S$565,571,683.28Number of issued shares: 1,787,547,732Number / percentage of treasury shares: 2,727,253 (0.15%)Number of shareholders: 37,374Class of shares: Ordinary shares with equal voting rights 1
Shareholdings Held by the PublicBased on information available to the company as of March 1, 2016, 50.47%2 of the issued ordinary shares of the company is held by the public and therefore, the company has complied with Rule 723 of the SGX-ST Listing Manual.
Substantial Shareholders Direct Interest Indirect Interest Total %2
Temasek Holdings (Private) Limited 871,200,328 12,718,760 3 883,919,088 49.53
Top 20 Shareholders as of March 1, 2016
No. Name No. of Ordinary Shares Held %2
1 Temasek Holdings (Private) Limited 871,200,328 48.81 2 DBS Nominees Pte Ltd 244,140,415 13.68 3 Citibank Nominees Singapore Pte Ltd 146,220,128 8.19 4 DBSN Services Pte Ltd 69,634,846 3.90 5 HSBC (Singapore) Nominees Pte Ltd 60,152,975 3.37 6 United Overseas Bank Nominees Pte Ltd 44,551,914 2.50 7 Raffles Nominees (Pte) Ltd 28,266,174 1.58 8 Startree Investments Pte Ltd 9,400,000 0.53 9 BNP Paribas Securities Services 8,962,809 0.50 10 OCBC Nominees Singapore Private Limited 8,346,478 0.47 11 Bank Of Singapore Nominees Pte Ltd 5,023,295 0.28 12 Merrill Lynch (Singapore) Pte Ltd 4,925,273 0.28 13 CIMB Securities (Singapore) Pte Ltd 4,759,917 0.27 14 OCBC Securities Private Ltd 4,517,812 0.2515 Tang Kin Fei 3,688,006 4 0.2116 DB Nominees (S) Pte Ltd 3,167,334 0.18 17 UOB Kay Hian Pte Ltd 2,562,480 0.14 18 Phillip Securities Pte Ltd 2,023,091 0.11 19 Low Sin Leng 1,804,437 0.10 20 DBS Vickers Securities (S) Pte Ltd 1,690,259 0.09
1,525,037,971 85.44
1 Ordinary shares purchased and held as treasury shares by the company will have no voting rights.2 The percentage of issued ordinary shares is calculated based on the number of issued ordinary shares of the company as of March 1, 2016 excluding 2,727,253
ordinary shares held as treasury shares as at that date.3 Temasek is deemed to be interested in the 12,718,760 Shares in which its subsidiaries and / or associated companies have or are deemed to have an interest
pursuant to Section 7 of the Companies Act.4 In addition, Tang Kin Fei has 2,000,000 shares, of which 1,000,000 shares are held in the name of DBS Nominees Pte Ltd and another 1,000,000 shares are held
in the name of Citibank Nominees Singapore Pte Ltd.
Analysis of Shareholdings as of March 1, 2016
No. of Ordinary
Shares Held
No. of Ordinary (excluding
Range of Shareholdings Shareholders % treasury shares) %
1 – 99 527 1.41 18,522 0.00 100 – 1,000 6,858 18.35 5,755,652 0.32 1,001 – 10,000 25,397 67.95 98,890,027 5.54 10,001 – 1,000,000 4,569 12.23 151,588,460 8.50 1,000,001 and above 23 0.06 1,528,567,818 85.64 37,374 100.00 1,784,820,479 100.00
SEMBCORP INDUSTRIES ANNUAL REPORT 2015 339338 BUILDING THE FUTURE

GOVERNANCE DISCLOSURE GUIDE
Guideline Questions How has Sembcorp complied?
General a. Has the company complied with all the principles and guidelines of the Singapore Code of Corporate Governance 2012 (the Code)? If not, please state the specific deviations and the alternative corporate governance practices adopted by the company in lieu of the recommendations in the Code.
Sembcorp has complied in all material aspects with the principles and guidelines set out in the Code.
b. In what respect do these alternative corporate governance practices achieve the objectives of the principles and conform to the guidelines in the Code?
BOARD RESPONSIBILITY
Guideline 1.5 What are the types of material transactions which require approval from the board?
Significant investments and transactions exceeding threshold limits are approved by the board. Transactions below the threshold limit are approved by the board’s Executive Committee and management to facilitate operational efficiency, in accordance with applicable financial authority limits.
Guideline Questions How has Sembcorp complied?
MEMBERS OF THE BOARD
Guideline 2.6 a. What is the board’s policy with regard to diversity in identifying director nominees?
b. Please state whether the current composition of the board provides diversity on each of the following – skills, experience, gender and knowledge of the company, and elaborate with numerical data where appropriate.
c. What steps has the board taken to achieve the balance and diversity necessary to maximise its effectiveness?
a. The board seeks to ensure that it has the required diversity, including gender diversity, as well as competencies needed, to support the company’s growth. Best efforts are taken to ensure that in addition to contributing their valuable expertise and insights to board deliberations, directors also bring to the board independent and objective perspectives to allow balanced and well-considered decisions to be made.
b. In 2015, the Nominating Committee (NC) reviewed the composition of our board to ensure that it had the diversity and necessary competencies to support the company’s growth. Our current board includes business leaders and professionals with strong experience in areas relevant to the Group’s businesses. This includes experience in the engineering, petrochemicals, oil and gas and real estate industries, as well as the accounting, finance and legal sectors.
c. With reference to the Group’s strategies and business plans, the NC reviews the skills mix of board members to ensure that the board has the required diversity, including gender diversity, as well as the necessary competencies to support the company’s growth. When the need for a new director arises, the NC consults with management and identifies a list of potential candidates. These candidates are sourced through an extensive network of contacts and external databases where appropriate, based on the skill sets, experience, knowledge and attributes required to position the board to lead the growth of the company. Thereafter, the NC will interview the candidates and make its recommendation to the board for approval. All appointments to the board are made on merit and measured against objective criteria. Candidates must be able to discharge their responsibilities as directors while upholding the highest standards of governance practised by the Group.
SEMBCORP INDUSTRIES ANNUAL REPORT 2015 341340 BUILDING THE FUTURE

GOVERNANCE DISCLOSURE GUIDE
Guideline Questions How has Sembcorp complied?
MEMBERS OF THE BOARD
Guideline 4.6 Please describe the board nomination process for the company in the last financial year for:
a. Selecting and appointing new directors and
b. Re-electing incumbent directors
a. When the need for a new director arises, the NC consults with management and identifies a list of potential candidates. These candidates are sourced through an extensive network of contacts and external databases where appropriate, based on the skill sets, experience, knowledge and attributes required to position the board to lead the growth of the company. Thereafter, the NC will interview the candidates and make its recommendation to the board for approval.
b. While reviewing the re-appointment and re-election of directors, the NC considers the directors’ contributions, other board representations and principal commitments to ensure they have sufficient time to discharge their responsibilities adequately. The board also recognises the contributions of directors who have, over time, developed deep insight into the Group’s businesses. It exercises its discretion to retain the services of such directors where appropriate, to avoid an abrupt loss of experienced directors with a valuable understanding of the Group.
Guideline Questions How has Sembcorp complied?
MEMBERS OF THE BOARD
Guideline 1.6 a. Are new directors given formal training? If not, please explain why.
b. What are the types of information and training provided to
i. new directors and ii. existing directors
to keep them up to date?
a. Yes, the company conducts comprehensive orientation programmes for new directors.
b. i. All new directors receive formal letters of appointment explaining the Group’s governance policies and practices, as well as their duties and obligations as directors. New directors also receive an information pack that contains the Group’s organisation structure, the contact details of members of senior management, the company’s Constitution, respective committees’ terms of reference, the Group’s policy relating to disclosure of interests in securities and prohibition on dealings in Sembcorp securities, as well as guidelines on directors’ fees. Comprehensive orientation programmes for new directors are also conducted. The programmes include briefings on board policies and processes, presentations by senior management on the Group’s organisation structure and strategy, business activities in various markets and financial performance, as well as facility visits.
ii. The company provides its directors complete, adequate and timely information on an ongoing basis to enable them to make informed decisions, discharge their duties and keep abreast of the Group’s operational and financial performance, key issues, challenges and opportunities. This includes management and operation reports, financial statements and quarterly highlights of the Group’s performance and key developments. The board also has ready access to the Group President & CEO, senior management, the company secretary and internal and external auditors at all times, should it need additional information. Details may be found on page 106 of the Corporate Governance Statement in this annual report.
As part of training and professional development for the board, the company also ensures that directors are briefed from time to time on changes to regulations, guidelines and accounting standards, as well as other relevant trends or issues. These are done either during board meetings, at board dinners or at specially convened sessions, including training sessions and seminars conducted by external professionals. Details may be found on page 100 of the Corporate Governance Statement of this annual report.
SEMBCORP INDUSTRIES ANNUAL REPORT 2015 343342 BUILDING THE FUTURE

GOVERNANCE DISCLOSURE GUIDE
Guideline Questions How has Sembcorp complied?
MEMBERS OF THE BOARD
Guideline 4.4 a. What is the maximum number of listed company board representations that the company has prescribed for its directors? What are the reasons for this number?
b. If a maximum number has not been determined, what are the reasons?
c. What are the specific considerations in deciding on the capacity of directors?
a. The board has determined that the maximum number of listed company board representations held by any Sembcorp Industries director should not exceed six. This is based on the total time commitment required of our directors for involvement in our board and board committees. It aims to ensure that all directors have sufficient time and attention to devote to the affairs of the company and discharge their duties adequately.
b. Not applicable
c. In deciding such matters, the board considers the total time commitment required of the directors for involvement in our board and board committees, as well as for their other appointments outside our company.
BOARD EVALUATION
Guideline 5.1 a. What was the process upon which the board reached the conclusion on its performance for the financial year?
b. Has the board met its performance objectives?
a. Each director is required to complete a questionnaire on the effectiveness of the board and board committees, as well as directors’ contributions and performance. The evaluation and feedback are then consolidated and presented to the board for discussion.
b. Yes. The board believes that it has met its performance objectives. This is reflected in the overall long-term performance of the Group.
INDEPENDENCE OF DIRECTORS
Guideline 2.1 Does the company comply with the guideline on the proportion of independent directors on the board? If not, please state the reasons for the deviation and the remedial action taken by the company.
Yes. The current board comprises 10 directors, seven of whom are independent directors.
Guideline Questions How has Sembcorp complied?
INDEPENDENCE OF DIRECTORS
Guideline 2.3 a. Is there any director who is deemed to be independent by the board, notwithstanding the existence of a relationship as stated in the Code that would otherwise deem him not to be independent? If so, please identify the director and specify the nature of such a relationship.
b. What are the board’s reasons for considering him independent? Please provide a detailed explanation.
a. Yes. Tan Sri Mohd Hassan Marican and Ajaib Haridass both sit on the board of Sembcorp Marine, a listed subsidiary of Sembcorp Industries from which the company has received payment in excess of S$200,000 in aggregate for consultancy services and provision of utilities services.
In addition, Bobby Chin is a director on the board of Temasek Holdings (Temasek), the largest shareholder of Sembcorp, and Tan Sri Mohd Hassan Marican and Tham Kui Seng respectively hold the positions of Senior International Advisor and Corporate Advisor at Temasek International Advisors, a subsidiary of Temasek.
b. The board has assessed this matter and is of the view that the payment received from Sembcorp Marine for consultancy services and provision of utilities services is not significant in the context of the Group’s earnings. The board believes that Tan Sri Mohd Hassan Marican and Mr Haridass’ directorships in Sembcorp Marine have not and will not interfere, or be reasonably perceived to interfere, with their ability to exercise independent judgement and act in the best interest of Sembcorp Industries.
Furthermore, the board believes that Mr Chin, Tan Sri Mohd Hassan Marican and Mr Tham have consistently exercised strong independent judgement in their deliberations. They have acted and continue to act in the best interest of the company and are not accustomed or under an obligation, whether formal or informal, to act in accordance with the directions, instructions or wishes of Temasek.
Guideline 2.4 Has any independent director served on the board for more than nine years from the date of his first appointment? If so, please identify the director and set out the board’s reasons for considering him independent.
No. Since the retirement of Goh Geok Ling and Evert Henkes from the board in April 2015, the company no longer has any director who has served beyond nine years from their date of first appointment to the board.
A term limit of nine years is set for independent directors of the Group. Should the board decide to retain any director beyond this nine-year term, it will rigorously review the independence of that director and determine if he / she should continue to be regarded as an independent director.
SEMBCORP INDUSTRIES ANNUAL REPORT 2015 345344 BUILDING THE FUTURE

GOVERNANCE DISCLOSURE GUIDE
Guideline Questions How has Sembcorp complied?
DISCLOSURE ON REMUNERATION
Guideline 9.2 Has the company disclosed each director’s and the CEO’s remuneration as well as a breakdown (in percentage or dollar terms) into base / fixed salary, variable or performance-related income / bonuses, benefits in kind, stock options granted, share-based incentives and awards, and other long-term incentives? If not, what are the reasons for not disclosing so?
Yes. Information on each director’s and the Group President & CEO’s remuneration may be found under the related item in the Supplementary Information section of the Financial Statements in this annual report.
Guideline 9.3 a. Has the company disclosed each key management personnel’s remuneration, in bands of S$250,000 or in more detail, as well as a breakdown (in percentage or dollar terms) into base / fixed salary, variable or performance-related income / bonuses, benefits in kind, stock options granted, share-based incentives and awards, and other long-term incentives? If not, what are the reasons for not disclosing so?
b. Please disclose the aggregate remuneration paid to the top five key management personnel (who are not directors or the CEO).
a. Information on key management personnel’s remuneration may be found under the related item in the Supplementary Information section of the Financial Statements in this annual report.
b. The aggregate remuneration paid in the financial year 2015 to the top five key management personnel, excluding our Group President & CEO, amounted to approximately S$10 million, comprising salaries and bonuses.
Guideline Questions How has Sembcorp complied?
DISCLOSURE ON REMUNERATION
Guideline 9.4 Is there any employee who is an immediate family member of a director or the CEO, and whose remuneration exceeds S$50,000 during the year? If so, please identify the employee and specify the relationship with the relevant director or the CEO.
No, in 2015 the company had no employees who were immediate family members of a director or the Group President & CEO.
Guideline 9.6 a. Please describe how the remuneration received by executive directors and key management personnel has been determined by the performance criteria.
b. What were the performance conditions used to determine their entitlement under the short-term and long-term incentive schemes?
c. Were all of these performance conditions met? If not, what were the reasons?
a. With the exception of our Group President & CEO, who does not receive director’s fees, all our board members are non-executive directors. Remuneration for our key management personnel and executive director comprises three primary components: fixed remuneration, as well as annual variable bonuses and share-based incentives that are conditional upon meeting certain performance targets.
Annual variable bonuses are linked to the achievement of pre-agreed financial and non-financial performance targets, as well as the creation of economic value added.
Share-based incentives are long-term incentive schemes which use methods fairly common among major local and multinational companies to incentivise and motivate employees to achieve pre-determined targets that create and enhance economic value for shareholders.
b. Information on the remuneration received by key management and executive director and details on share-based incentives and performance targets are available in the Directors’ Statement and Note 32 in the Notes to the Financial Statements in this annual report.
c. All the performance conditions under the Restricted Share Plan were met. As for the Performance Share Plan, all the performance conditions were not met due to adverse market conditions. Arising from the under-achievement of performance targets, 754,861 performance shares lapsed in 2015 and were not paid out.
SEMBCORP INDUSTRIES ANNUAL REPORT 2015 347346 BUILDING THE FUTURE

GOVERNANCE DISCLOSURE GUIDE
Guideline Questions How has Sembcorp complied?
RISK MANAGEMENT AND INTERNAL CONTROLS
Guideline 6.1 What types of information does the company provide to independent directors to enable them to understand its business, the business and financial environment as well as the risks faced by the company? How frequently is the information provided?
On an ongoing basis, directors are provided with complete, adequate and timely information to enable them to make informed decisions and keep abreast of the Group’s operational and financial performance, key issues, challenges and opportunities. Management and operation reports as well as financial statements are presented to the board on a regular basis.
On a quarterly basis, financial highlights of the Group’s performance and key developments are presented at board meetings.
On a regular basis, risk-related reports are submitted to the Risk Committee (RC). The RC, comprising of selected board members, assists the board in overseeing risk management for the Group. These reports include updates on the Group’s risk portfolio, reports on major risk exposure and any other risk-related issues, as well as actions taken to monitor and manage exposure to such risks or issues.
For more details on briefings, updates and information provided to our directors, please refer to pages 100 and 106 of the Corporate Governance Statement in this annual report.
Guideline 13.1 Does the company have an internal audit function? If not, please explain why.
Yes. The Group Internal Audit department reports directly to the Audit Committee on audit matters and to the Group President & CEO on administrative matters.
Guideline Questions How has Sembcorp complied?
RISK MANAGEMENT AND INTERNAL CONTROLS
Guideline 11.3 a. In relation to the major risks faced by the company, including financial, operational, compliance, information technology and sustainability, please state the bases for the board’s view on the adequacy and effectiveness of the company’s internal controls and risk management systems.
b. In respect of the past 12 months, has the board received assurance from the CEO and the CFO as well as the internal auditor that:
i. the financial records have been properly maintained and the financial statements give a true and fair view of the company’s operations and finances; and
ii. the company’s risk management and internal control systems are effective
If not, how does the board assure itself of points i. and ii. above?
a. The Group has implemented a comprehensive enterprise risk management (ERM) framework. Supporting the ERM framework is a system of internal controls, comprising a code of business conduct, group-wide governance and internal control policies, procedures, guidelines dictating the segregation of duties, approval authorities and limits, as well as checks and balances embedded in business processes.
The ERM framework is complemented by a governance assurance framework and a risk-based control self-assessment programme.
During the year, the Group’s risk profile was reviewed and updated and the effectiveness of our internal controls was assessed and enhanced through a combination of management control self-assessments, certifications and internal audits, as well as actions taken in follow up to these exercises.
Furthermore, the Group Internal Audit department audited the entities that are listed in its annual internal audit plan, which has been approved by the Audit Committee. Internal audit reports were issued and reviewed by the Audit Committee, expressing its view on the adequacy and effectiveness of the company’s internal controls relating to finance, operations, compliance and information technology.
Based on the internal controls established and maintained by the Group, work performed by external and internal auditors and reviews performed by senior management, the board, with the concurrence of the Audit Committee, is of the opinion that the company’s internal controls were adequate and effective as at December 31, 2015 to address the financial, operational, compliance and information technology risks of the Group.
b. Yes. For the financial year 2015, the board has been assured by the Group President & CEO and Group Chief Financial Officer that financial records have been properly maintained, that the financial statements give a true and fair view of the company’s operations and finances and that the risk management and internal control systems of the Group are adequate and effective.
SEMBCORP INDUSTRIES ANNUAL REPORT 2015 349348 BUILDING THE FUTURE

GOVERNANCE DISCLOSURE GUIDE
Guideline Questions How has Sembcorp complied?
RISK MANAGEMENT AND INTERNAL CONTROLS
Guideline 12.6 a. Please provide a breakdown of the fees paid in total to the external auditors for audit and non-audit services for the financial year.
b. If the external auditors have supplied a substantial volume of non-audit services to the company, please state the bases for the Audit Committee’s view on the independence of the external auditors.
a. As disclosed in Note 28(a) in the Notes to the Financial Statements, the fees paid / payable to external auditors for audit and non-audit services for the financial year are:
S$’000
Audit fees paid / payable – To auditors of the company 1,955 – To overseas affiliates of the auditors of the company 822 2,777Non-audit fees paid / payable – To auditors of the company 826 – To overseas affiliates of the auditors of the company 253 1,079
b. Non-audit fees amount to only 39% of the total annual audit fees, and are not deemed substantial.
Guideline Questions How has Sembcorp complied?
COMMUNICATION WITH SHAREHOLDERS
Guideline 15.4 a. Does the company regularly communicate with shareholders and attend to their questions? How often does the company meet with institutional and retail investors?
b. Is this done by a dedicated investor relations team (or equivalent)? If not, who performs this role?
c. How does the company keep shareholders informed of corporate developments, apart from SGXNET announcements and the annual report?
a. Yes, Sembcorp regularly communicates with shareholders and addresses any queries raised. Investor relations officers are also available by email or telephone to answer questions from shareholders, analysts and the media, as long as the information requested does not conflict with SGX-ST’s rules of fair disclosure.
Details of shareholder meetings, including the frequency and examples of types of meetings, are available in the Investor Relations chapter and Corporate Governance Statement of this annual report.
b. Yes, Sembcorp has a dedicated investor relations team that communicates with investors.
c. Sembcorp uses multiple communication channels and platforms to keep its shareholders and the investing public informed and updated in accordance with SGX-ST’s rules of fair disclosure. Aside from the annual report and SGX announcements, channels utilised include results briefings, annual general meetings, investor roadshows, conferences and forums, investor and media meetings, media interviews, site visits, news releases and circulars, the corporate website, group briefings and other appropriate channels.
Guideline 15.5 If the company is not paying any dividends for the financial year, please explain why.
Not applicable.
For 2015, a final tax exempt one-tier dividend of 6 cents per ordinary share has been proposed subject to shareholders’ approval. Together with the interim dividend of 5 cents per ordinary share that has already been paid out, this would bring our total dividend for the financial year to 11 cents per ordinary share.
SEMBCORP INDUSTRIES ANNUAL REPORT 2015 351350 BUILDING THE FUTURE

CORPORATE INFORMATION NOTICE OF ANNUAL GENERAL MEETING
Registered Office30 Hill Street #05-04Singapore 179360Tel: (65) 6723 3113Fax: (65) 6822 3254www.sembcorp.com
Board of DirectorsAng Kong HuaChairman
Tang Kin FeiGroup President & CEO
Bobby Chin Yoke ChoongMargaret LuiTan Sri Mohd Hassan MaricanTham Kui SengDr Teh Kok PengAjaib HaridassNeil McGregorNicky Tan Ng Kuang
Executive CommitteeAng Kong HuaChairman
Tang Kin FeiMargaret LuiNicky Tan Ng Kuang
Audit CommitteeBobby Chin Yoke ChoongChairman
Tham Kui SengDr Teh Kok PengAjaib Haridass
Risk CommitteeAjaib HaridassChairman
Bobby Chin Yoke ChoongNeil McGregorTham Kui Seng
Executive Resource & Compensation CommitteeAng Kong HuaChairman
Margaret LuiTan Sri Mohd Hassan MaricanDr Teh Kok Peng
Nominating CommitteeAng Kong HuaChairman
Margaret LuiTan Sri Mohd Hassan MaricanBobby Chin Yoke Choong
Technology Advisory PanelAng Kong HuaChairman
Tang Kin FeiDr Teh Kok PengDr Josephine Kwa Lay KengDr Ng How YongProf Lui Pao Chuen
Company SecretaryKwong Sook May
RegistrarM & C Services Private Limited112 Robinson Road #05-01Singapore 068902
Principal BankersAustralia and New Zealand Banking Group Limited
CIMB Bank Berhad
Citibank N.A.
DBS Bank
Mizuho Bank Ltd
Oversea-Chinese Banking Corporation Limited
Standard Chartered Bank
Sumitomo Mitsui Banking Corporation
The Bank of Tokyo-Mitsubishi UFJ, Ltd
The Hongkong and Shanghai Banking Corporation Limited
United Overseas Bank Limited
AuditorsKPMG LLPCertified Public Accountants16 Raffles Quay #22-00Hong Leong BuildingSingapore 048581
Partner-in-Charge: Ling Su Min(Appointed during the financial year ended
December 31, 2014)
Sembcorp Industries Ltd Co Regn No. 199802418D (Incorporated in the Republic of Singapore)
Notice is hereby given that the Eighteenth Annual General Meeting of Sembcorp Industries Ltd (the “Company”) will be held at The Auditorium, NTUC Centre, Level 7, One Marina Boulevard, Singapore 018989 on Tuesday, April 19, 2016 at 11.00 a.m. for the following purposes:
Routine Business
1. To receive and adopt the Directors’ Statement and Audited Financial Statements for the year ended December 31, 2015 and the Auditors’ Report thereon.
2. To declare a final ordinary one-tier tax exempt dividend of 6 cents per share for the year ended December 31, 2015.
3. To re-elect the following directors, each of whom will retire by rotation pursuant to Article 93 of the Company’s Constitution and who, being eligible, will offer themselves for re-election:
a. Tang Kin Feib. Margaret Luic. Tan Sri Mohd Hassan Marican
4. To re-elect Nicky Tan Ng Kuang, a director who will retire pursuant to Article 99 of the Company’s Constitution and who, being eligible, will offer himself for re-election.
5. To re-appoint Ang Kong Hua, a director who will retire under the resolution passed at the Annual General Meeting held on April 21, 2015 pursuant to Section 153 of the Companies Act, Chapter 50 (which was then in force), to hold office from the date of this Annual General Meeting.
6. To approve directors’ fees of up to S$2,500,000 for the year ending December 31, 2016 (2015: up to S$2,500,000).
7. To re-appoint KPMG LLP as Auditors of the Company and to authorise the directors to fix their remuneration.
Resolution 1
Resolution 2
Resolution 3 Resolution 4 Resolution 5
Resolution 6
Resolution 7
Resolution 8
Resolution 9
SEMBCORP INDUSTRIES ANNUAL REPORT 2015 353352 BUILDING THE FUTURE

NOTICE OF ANNUAL GENERAL MEETING
Resolution 10
Special Business
To consider and, if thought fit, to pass, with or without modifications, the following resolutions, of which Resolutions 10, 11, 12 and 13 will be proposed as Ordinary Resolutions and Resolution 14 will be proposed as a Special Resolution:
8. That authority be and is hereby given to the directors to:
a. i. issue shares of the Company (“shares”) whether by way of rights, bonus or otherwise; and / or
ii. make or grant offers, agreements or options (collectively, “Instruments”) that might or would require shares to be issued, including but not limited to the creation and issue of (as well as adjustments to) warrants, debentures or other instruments convertible into shares,
at any time and upon such terms and conditions and for such purposes and to such persons as the directors may, in their absolute discretion, deem fit; and
b. (notwithstanding the authority conferred by this Resolution may have ceased to be in force) issue shares in pursuance of any Instrument made or granted by the directors while this Resolution was in force,
provided that:
(1) the aggregate number of shares to be issued pursuant to this Resolution (including shares to be issued in pursuance of Instruments made or granted pursuant to this Resolution) does not exceed 50% of the total number of issued shares excluding treasury shares (as calculated in accordance with paragraph (2) below), of which the aggregate number of shares to be issued other than on a pro rata basis to shareholders of the Company (including shares to be issued in pursuance of Instruments made or granted pursuant to this Resolution) shall not exceed 5% of the total number of issued shares excluding treasury shares (as calculated in accordance with paragraph (2) below);
(2) (subject to such manner of calculation as may be prescribed by the Singapore Exchange Securities Trading Limited (the “SGX-ST”)) for the purpose of determining the aggregate number of shares that may be issued under paragraph (1) above, the percentage of issued shares shall be based on the total number of issued shares excluding treasury shares at the time this Resolution is passed, after adjusting for:
(i) new shares arising from the conversion or exercise of any convertible securities or share options or vesting of share awards which are outstanding or subsisting at the time this Resolution is passed; and
(ii) any subsequent bonus issue or consolidation or subdivision of shares;
(3) in exercising the authority conferred by this Resolution, the Company shall comply with the provisions of the Listing Manual of the SGX-ST for the time being in force (unless such compliance has been waived by the SGX-ST) and the Constitution for the time being of the Company; and
(4) (unless revoked or varied by the Company in General Meeting) the authority conferred by this Resolution shall continue in force until the conclusion of the next Annual General Meeting of the Company or the date by which the next Annual General Meeting of the Company is required by law to be held, whichever is the earlier.
Resolution 11
Resolution 12
Special Business (cont’d)
9. That approval be and is hereby given to the directors to:
a. grant awards in accordance with the provisions of the Sembcorp Industries Performance Share Plan 2010 (the “SCI PSP 2010”) and / or the Sembcorp Industries Restricted Share Plan 2010 (the “SCI RSP 2010”) (the SCI PSP 2010 and SCI RSP 2010, together the “Share Plans”); and
b. allot and issue from time to time such number of fully paid-up ordinary shares of the Company as may be required to be delivered pursuant to the vesting of awards under the Share Plans,
provided that:
(1) the aggregate number of (i) new ordinary shares allotted and issued and / or to be allotted and issued, (ii) existing ordinary shares (including shares held in treasury) delivered and / or to be delivered, and (iii) ordinary shares released and / or to be released in the form of cash in lieu of ordinary shares, pursuant to the Share Plans, shall not exceed 7% of the total number of issued ordinary shares of the Company (excluding treasury shares) from time to time; and
(2) the aggregate number of ordinary shares under awards to be granted pursuant to the Share Plans during the period commencing from this Annual General Meeting and ending on the date of the next Annual General Meeting of the Company or the date by which the next Annual General Meeting of the Company is required by law to be held, whichever is the earlier, shall not exceed 1% of the total number of issued ordinary shares of the Company (excluding treasury shares) from time to time.
10. That:
a. approval be and is hereby given, for the purposes of Chapter 9 of the Listing Manual (“Chapter 9”) of the Singapore Exchange Securities Trading Limited, for the Company, its subsidiaries and associated companies that are entities at risk (as that term is used in Chapter 9), or any of them, to enter into any of the transactions falling within the types of interested person transactions described in Appendix 1 to the Company’s Letter to Shareholders dated March 28, 2016 (the “Letter”) with any party who is of the class of interested persons described in Appendix 1 to the Letter, provided that such transactions are made on normal commercial terms and in accordance with the review procedures for such interested person transactions;
b. the approval given in paragraph (a) above (the “IPT Mandate”) shall, unless revoked or varied by the Company in General Meeting, continue in force until the conclusion of the next Annual General Meeting of the Company; and
c. the directors and / or any of them be and are hereby authorised to complete and do all such acts and things (including executing all such documents as may be required) as they and / or he may consider expedient or necessary or in the interests of the Company to give effect to the IPT Mandate and / or this Resolution.
SEMBCORP INDUSTRIES ANNUAL REPORT 2015 355354 BUILDING THE FUTURE

NOTICE OF ANNUAL GENERAL MEETING
Resolution 13
Resolution 14
Special Business (cont’d)
11. That:
a. for the purposes of Sections 76C and 76E of the Companies Act, Chapter 50 (the “Companies Act”), the exercise by the directors of all the powers of the Company to purchase or otherwise acquire issued ordinary shares of the Company (“Shares”) not exceeding in aggregate the Maximum Limit (as hereafter defined), at such price or prices as may be determined by the directors from time to time up to the Maximum Price (as hereafter defined), whether by way of:
i. market purchase(s) on the Singapore Exchange Securities Trading Limited (the “SGX-ST”); and / or
ii. off-market purchase(s) (if effected otherwise than on the SGX-ST) in accordance with any equal access scheme(s) as may be determined or formulated by the directors as they consider fit, which scheme(s) shall satisfy all the conditions prescribed by the Companies Act,
and otherwise in accordance with all other laws and regulations and rules of the SGX-ST as may for the time being be applicable, be and is hereby authorised and approved generally and unconditionally (the “Share Purchase Mandate”);
b. unless varied or revoked by the Company in General Meeting, the authority conferred on the directors pursuant to the Share Purchase Mandate may be exercised by the directors at any time and from time to time during the period commencing from the date of the passing of this Resolution and expiring on the earliest of:
i. the date on which the next Annual General Meeting of the Company is held;
ii. the date by which the next Annual General Meeting of the Company is required by law to be held; and
iii. the date on which purchases and acquisitions of Shares pursuant to the Share Purchase Mandate are carried out to the full extent mandated;
c. in this Resolution:
“Average Closing Price” means the average of the last dealt prices of a Share for the five consecutive market days on which the Shares are transacted on the SGX-ST immediately preceding the date of market purchase by the Company or, as the case may be, the date of the making of the offer pursuant to the off-market purchase, and deemed to be adjusted in accordance with the listing rules of the SGX-ST for any corporate action which occurs after the relevant five-day period;
“date of the making of the offer” means the date on which the Company makes an offer for the purchase or acquisition of Shares from holders of Shares, stating therein the relevant terms of the equal access scheme for effecting the off-market purchase;
“Maximum Limit” means that number of issued Shares representing 2% of the total number of issued Shares as at the date of the passing of this Resolution (excluding any Shares which are held as treasury shares as at that date); and
Special Business (cont’d)
“Maximum Price”, in relation to a Share to be purchased or acquired, means the purchase price (excluding brokerage, commission, applicable goods and services tax and other related expenses) which shall not exceed:
(a) in the case of a market purchase of a Share, 105% of the Average Closing Price of the Shares; and
(b) in the case of an off-market purchase of a Share pursuant to an equal access scheme, 110% of the Average Closing Price of the Shares; and
d. the directors and / or any of them be and are hereby authorised to complete and do all such acts and things (including executing all such documents as may be required) as they and / or he may consider expedient or necessary or in the interests of the Company to give effect to the transactions contemplated and / or authorised by this Resolution.
12. That the regulations contained in the new Constitution submitted to this meeting and, for the purpose of identification, subscribed to by the Chairman thereof, be approved and adopted as the Constitution of the Company in substitution for, and to the exclusion of, the existing Constitution.
By Order of the Board
Kwong Sook MayCompany Secretary
Singapore March 28, 2016
SEMBCORP INDUSTRIES ANNUAL REPORT 2015 357356 BUILDING THE FUTURE

NOTICE OF ANNUAL GENERAL MEETING
Explanatory Notes:
Resolutions 3 to 7 – detailed information on these directors can be found under the Board of Directors and Corporate Governance Statement sections in the Annual Report 2015. These directors (save for Mr Tang who is the Group President & Chief Executive Officer of the Company and Mrs Lui who is the Chief Executive Officer and a Director of Azalea Asset Management Pte Ltd, a related company of Temasek Holdings (Private) Limited) have no relationships (including immediate family relationships) with each other or with the other directors, the Company or its 10% shareholders.
Resolution 7 – is to re-appoint the director who is over 70 years old and who is retiring under the resolution passed at the Annual General Meeting held on April 21, 2015 as pursuant to Section 153(6) of the Companies Act, Chapter 50 which was then in force, such resolution could only permit the re-appointment of the director to hold office until this Annual General Meeting. If passed, Resolution 7 will approve and authorise the continuation of the director in office from the date of this Annual General Meeting onwards without limitation in tenure, save for prevailing applicable laws, listing rules and / or regulations, including the Company’s Constitution.
Resolution 8 – if passed, will facilitate the payment of directors’ fees during the financial year in which the fees are incurred, that is, during the financial year ending December 31, 2016. The exact amount of directors’ fees received by each director for the financial year ended December 31, 2015 is disclosed in full in the Supplementary Information section of the Annual Report 2015. Directors and their associates will abstain from voting on Resolution 8.
The amount of the directors’ fees is computed based on the anticipated number of board and committee meetings for year 2016, assuming full attendance by all of the non-executive directors. The amount also caters for additional ad-hoc board and committee meetings, and includes travel allowances for overseas non-executive directors. In the event that the amount proposed is insufficient, approval will be sought at the next Annual General Meeting in year 2017 (“2017 AGM”) before any payments are made to directors for the shortfall.
The current intention is that the directors’ fees for the non-executive directors for year 2016 will comprise a cash component and a share component, with up to 30% being paid out in the form of restricted share awards under the Sembcorp Industries Restricted Share Plan 2010. Any such award would typically consist of the grant of fully paid shares outright with no performance or vesting conditions attached, but with a selling moratorium. Under the Directors’ Fee Framework, non-executive directors are required to hold shares (including shares obtained by other means) worth S$75,000; any excess may be sold as desired. A non-executive director can dispose of all of his shares one year after leaving the Board. See the Corporate Governance Statement in the Annual Report 2015 for more details.
The cash component of the directors’ fees for year 2016 is intended to be paid half-yearly in arrears. The share component of the directors’ fees for year 2016 is intended to be paid after the 2017 AGM has been held. The actual number of shares to be awarded to each non-executive director holding office at the time of the payment is intended to be determined by reference to the volume-weighted average price of a share on the Singapore Exchange Securities Trading Limited (the “SGX-ST”) over the 14 trading days from (and including) the day on which the shares are first quoted ex-dividend after the 2017 AGM (or, if no final dividend is proposed at the 2017 AGM, or the resolution to approve any such final dividend is not approved at the 2017 AGM, over the 14 trading days immediately following the date of the 2017 AGM). The number of shares to be awarded will be rounded down to the nearest hundred and any residual balance will be settled in cash. A non-executive director who steps down before the payment of the share component will receive all of his directors’ fees for year 2016 (calculated on a pro-rated basis, where applicable) in cash.
Explanatory Notes: (cont’d)
Statement pursuant to Article 55 of the Constitution of the Company:
Resolution 10 – is to empower the directors to issue shares of the Company and to make or grant Instruments (such as warrants or debentures) convertible into shares, and to issue shares in pursuance of such Instruments, up to a number not exceeding 50% of the total number of issued shares of the Company excluding treasury shares, of which up to 5% may be issued other than on a pro rata basis to shareholders. The aggregate number of shares which may be issued shall be based on the total number of issued shares of the Company excluding treasury shares at the time that Resolution 10 is passed, after adjusting for (a) new shares arising from the conversion or exercise of any convertible securities or share options or vesting of share awards which are outstanding or subsisting at the time that Resolution 10 is passed, and (b) any subsequent bonus issue or consolidation or subdivision of shares.
Resolution 11 – is to empower the directors to offer and grant awards pursuant to the Sembcorp Industries Performance Share Plan 2010 and the Sembcorp Industries Restricted Share Plan 2010 (collectively, the “Share Plans”) and to issue ordinary shares of the Company pursuant to the vesting of awards granted pursuant to the Share Plans provided that: (a) the aggregate number of (i) new ordinary shares allotted and issued and / or to be allotted and issued, (ii) existing ordinary shares (including shares held in treasury) delivered and / or to be delivered, and (iii) ordinary shares released and / or to be released in the form of cash in lieu of ordinary shares, pursuant to the Share Plans shall not exceed 7% of the total number of issued ordinary shares of the Company (excluding treasury shares) from time to time; and (b) the aggregate number of ordinary shares under awards to be granted pursuant to the Share Plans during the period commencing from this Annual General Meeting to the next Annual General Meeting shall not exceed 1% of the total number of issued ordinary shares of the Company (excluding treasury shares) from time to time. Approval for the adoption of the Share Plans was given by shareholders at an Extraordinary General Meeting of the Company held on April 22, 2010. The grant of awards under the Share Plans will be made in accordance with their respective provisions.
Resolution 12 – is to renew the mandate to enable the Company, its subsidiaries and associated companies that are entities at risk (as that term is used in Chapter 9 of the Listing Manual), or any of them, to enter into certain interested person transactions with specified classes of interested persons, as described in the Letter to Shareholders dated March 28, 2016 (the “Letter”). Please refer to the Letter for more details.
SEMBCORP INDUSTRIES ANNUAL REPORT 2015 359358 BUILDING THE FUTURE

NOTICE OF ANNUAL GENERAL MEETING
Explanatory Notes: (cont’d)
Resolution 13 – is to renew the mandate to enable the Company to purchase or otherwise acquire issued ordinary shares of the Company, on the terms and subject to the conditions set out in the Resolution.
The Company intends to use its internal sources of funds to finance the purchase or acquisition of its ordinary shares. The amount of financing required for the Company to purchase or acquire its ordinary shares, and the impact on the Company’s financial position, cannot be ascertained as at the date of this Notice as these will depend on the number of ordinary shares purchased or acquired, the price at which such ordinary shares were purchased or acquired and whether the ordinary shares purchased or acquired are held in treasury or cancelled.
Based on the existing issued ordinary shares as at March 1, 2016 (the “Latest Practicable Date”) and excluding any ordinary shares held in treasury, the purchase by the Company of 2% of its issued ordinary shares (and disregarding the ordinary shares held in treasury) will result in the purchase or acquisition of 35,696,409 Shares.
In the case of market purchases by the Company and assuming that the Company purchases or acquires 35,696,409 ordinary shares at the maximum price of S$2.79 for one ordinary share (being the price equivalent to 105% of the average of the last dealt prices of the ordinary shares for the five consecutive market days on which the ordinary shares were traded on the SGX-ST immediately preceding the Latest Practicable Date), the maximum amount of funds required for the purchase or acquisition of 35,696,409 Shares is S$99,592,981.
In the case of off-market purchases by the Company and assuming that the Company purchases or acquires 35,696,409 ordinary shares at the maximum price of S$2.92 for one ordinary share (being the price equivalent to 110% of the average of the last dealt prices of the ordinary shares for the five consecutive market days on which the ordinary shares were traded on the SGX-ST immediately preceding the Latest Practicable Date), the maximum amount of funds required for the purchase or acquisition of 35,696,409 ordinary shares is S$104,233,514.
The financial effects of the purchase or acquisition of such ordinary shares by the Company pursuant to the proposed Share Purchase Mandate on the audited financial statements of the Group and the Company for the financial year ended December 31, 2015 based on these assumptions are set out in paragraph 3.7 of the Letter.
Please refer to the Letter for more details.
Resolution 14 – is to adopt a new Constitution following the wide-ranging changes to the Companies Act, Chapter 50 (the “Companies Act”) introduced pursuant to the Companies (Amendment) Act 2014 (the “Amendment Act”). The new Constitution will consist of the memorandum and articles of association of the Company which were in force immediately before January 3, 2016 and incorporate amendments to (inter alia) take into account the changes to the Companies Act introduced pursuant to the Amendment Act. Resolution 14 will be proposed as a Special Resolution. Please refer to the Letter for more details.
Notes:
1. (a) A member who is not a relevant intermediary is entitled to appoint not more than two proxies to attend, speak and vote at the meeting. Where such member’s form of proxy appoints more than one proxy, the proportion of the shareholding concerned to be represented by each proxy shall be specified in the form of proxy.
(b) A member who is a relevant intermediary is entitled to appoint more than two proxies to attend, speak and vote at the meeting, but each proxy must be appointed to exercise the rights attached to a different share or shares held by such member. Where such member’s form of proxy appoints more than two proxies, the number and class of shares in relation to which each proxy has been appointed shall be specified in the form of proxy.
“Relevant intermediary” has the meaning ascribed to it in Section 181 of the Companies Act, Chapter 50.
2. A proxy need not be a member of the Company.
3. The instrument appointing a proxy or proxies must be lodged at the office of the Company’s Share Registrar, M & C Services Private Limited, 112 Robinson Road #05-01, Singapore 068902 not less than 48 hours before the time appointed for the Annual General Meeting.
Personal Data Privacy
By submitting an instrument appointing a proxy(ies) and / or representative(s) to attend, speak and vote at the Annual General Meeting and / or any adjournment thereof, a member of the Company (i) consents to the collection, use and disclosure of the member’s personal data by the Company (or its agents or service providers) for the purpose of the processing, administration and analysis by the Company (or its agents or service providers) of proxies and representatives appointed for the Annual General Meeting (including any adjournment thereof) and the preparation and compilation of the attendance lists, minutes and other documents relating to the Annual General Meeting (including any adjournment thereof), and in order for the Company (or its agents or service providers) to comply with any applicable laws, listing rules, take-over rules, regulations and / or guidelines (collectively, the “Purposes”), (ii) warrants that where the member discloses the personal data of the member’s proxy(ies) and / or representative(s) to the Company (or its agents or service providers), the member has obtained the prior consent of such proxy(ies) and / or representative(s) for the collection, use and disclosure by the Company (or its agents or service providers) of the personal data of such proxy(ies) and / or representative(s) for the Purposes, and (iii) agrees that the member will indemnify the Company in respect of any penalties, liabilities, claims, demands, losses and damages as a result of the member’s breach of warranty.
Notice of Books Closure and Dividend Payment Date
Notice is hereby given that the Register of Members and Share Transfer Books of the Company will be closed on April 27, 2016 to determine the shareholders’ entitlements to the proposed dividend. Duly completed transfers of shares received by the Company’s Share Registrar, M & C Services Private Limited at 112 Robinson Road #05-01, Singapore 068902, up to 5.00 p.m. on April 26, 2016 (the “Book Closure Date”) will be registered to determine shareholders’ entitlements to the proposed dividend. Subject as aforesaid, shareholders whose securities accounts with The Central Depository (Pte) Limited are credited with ordinary shares of the Company as at 5.00 p.m. on the Book Closure Date will be entitled to the proposed dividend.
The proposed dividend, if approved by the members at the Annual General Meeting, will be paid on May 17, 2016.
SEMBCORP INDUSTRIES ANNUAL REPORT 2015 361360 BUILDING THE FUTURE

Signature(s) or Common Seal of Member(s) Date
Sembcorp Industries LtdCo Regn No. 199802418D (Incorporated in the Republic of Singapore)
Eighteenth Annual General Meeting
I / We, (Name), (NRIC / Passport / Co Reg No.)
of (Address)
being a member / members of SEMBCORP INDUSTRIES LTD (“the Company”) hereby appoint:
Name Address NRIC / Passport No. % of Shareholdings
and / or (delete as appropriate)
Name Address NRIC / Passport No. % of Shareholdings
as my / our proxy / proxies to attend, speak and vote for me / us on my / our behalf at the 18th Annual General Meeting (“18th AGM”) of the Company to be held on Tuesday, April 19, 2016 at 11.00 a.m. at The Auditorium, NTUC Centre, Level 7, One Marina Boulevard, Singapore 018989 and at any adjournment thereof.(Voting will be conducted by poll. Please indicate with an “X” in the spaces provided whether you wish your vote(s) to be cast for or against the Resolutions as set out in the Notice of 18th AGM (of which Resolutions 1 to 13 will be proposed as Ordinary Resolutions and Resolution 14 will be proposed as a Special Resolution). In the absence of specific directions, the proxy / proxies will vote or abstain as he / they may think fit, as he / they will on any other matter arising at the 18th AGM.)
Resolutions For Against
ROUTINE BUSINESS
1. To adopt the Directors’ Statement and Financial Statements
2. To declare a final dividend
3. To re-elect Tang Kin Fei
4. To re-elect Margaret Lui
5. To re-elect Tan Sri Mohd Hassan Marican
6. To re-elect Nicky Tan Ng Kuang
7. To re-appoint Ang Kong Hua
8. To approve directors’ fees for financial year ending December 31, 2016
9. To re-appoint KPMG LLP as Auditors and to fix their remuneration
SPECIAL BUSINESS
10. To approve the proposed renewal of the Share Issue Mandate
11. To authorise the directors to grant awards and issue shares under the Sembcorp Industries Share Plans
12. To approve the proposed renewal of the IPT Mandate
13. To approve the proposed renewal of the Share Purchase Mandate
14. To approve the proposed adoption of the new Constitution
Total Number of Shares Held
PROXY FORM IMPORTANT1. Relevant intermediaries as defined in Section 181 of the Companies Act, Chapter 50 may
appoint more than two proxies to attend, speak and vote at the Annual General Meeting.2. For CPF / SRS investors who have used their CPF / SRS moneys to buy shares in Sembcorp
Industries Ltd, this form of proxy is not valid for use and shall be ineffective for all intents and purposes if used or purported to be used by them. CPF / SRS investors should contact their respective Agent Banks / SRS Operators if they have any queries regarding their appointment as proxies.
3. By submitting an instrument appointing a proxy(ies) and / or representative(s), the member accepts and agrees to the personal data privacy terms set out in the Notice of Annual General Meeting dated March 28, 2016.
This page is intentionally left blank.

The Company SecretarySembcorp Industries Ltd
c/o M & C Services Private Limited112 Robinson Road #05-01
Singapore 068902
Postage will be paid by addressee.
For posting in Singapore only.
BUSINESS REPLY SERVICE PERMITNO. 06735
Notes:
1. If the member has shares entered against his name in the Depository Register (maintained by The Central Depository (Pte) Limited), he should insert that number of shares. If the member has shares registered in his name in the Register of Members (maintained by or on behalf of the Company), he should insert that number of shares. If the member has shares entered against his name in the Depository Register and registered in his name in the Register of Members, he should insert the aggregate number of shares. If no number is inserted, this form of proxy will be deemed to relate to all shares held by the member.
2. (a) A member who is not a relevant intermediary is entitled to appoint not more than two proxies to attend, speak and vote at the meeting. Where such member’s form of proxy appoints more than one proxy, the proportion of the shareholding concerned to be represented by each proxy shall be specified in the form of proxy.
(b) A member who is a relevant intermediary is entitled to appoint more than two proxies to attend, speak and vote at the meeting, but each proxy must be appointed to exercise the rights attached to a different share or shares held by such member. Where such member’s form of proxy appoints more than two proxies, the number and class of shares in relation to which each proxy has been appointed shall be specified in the form of proxy.
“Relevant intermediary” has the meaning ascribed to it in Section 181 of the Companies Act, Chapter 50.
3. A proxy need not be a member of the Company.
4. The instrument appointing a proxy or proxies must be deposited at the office of the Company’s Registrar, M & C Services Private Limited, 112 Robinson Road #05-01, Singapore 068902 not less than 48 hours before the time appointed for the Annual General Meeting.
5. Completion and return of this instrument appointing a proxy or proxies shall not preclude a member from attending and voting in person at the Annual General Meeting if he finds that he is able to do so. In such event, the relevant instrument appointing a proxy or proxies will be deemed to be revoked.
6. The instrument appointing a proxy or proxies must be under the hand of the appointor or of his attorney duly authorised in writing. Where the instrument appointing a proxy or proxies is executed by a corporation, it must be executed either under its seal or under the hand of an officer or attorney duly authorised. Where an instrument appointing a proxy or proxies is signed on behalf of the appointor by an attorney, the letter or power of attorney or a duly certified copy thereof must (failing previous registration with the Company) be lodged with the instrument of proxy, failing which the instrument may be treated as invalid.
7. A corporation which is a member may authorise by resolution of its directors or other governing body such person as it thinks fit to act as its representative at the Annual General Meeting, in accordance with Section 179 of the Companies Act, Chapter 50.
8. The Company shall be entitled to reject the instrument appointing a proxy or proxies if it is incomplete, improperly completed or illegible or where the true intentions of the appointor are not ascertainable from the instructions of the appointor specified in the instrument (including any related attachment) appointing a proxy or proxies. In addition, in the case of members whose shares are entered against their names in the Depository Register, the Company may reject any instrument appointing a proxy or proxies lodged if such members are not shown to have shares entered against their names in the Depository Register 72 hours before the time appointed for holding the Annual General Meeting as certified by the Central Depository (Pte) Limited to the Company.
Fold here
Seal with clear tape. Do not staple.Seal with clear tape. Do not staple.
Sembcorp Industries Financial Calendar 2016
February 17, 2016 Announcement of full year results for the year ended December 31, 2015
April 19, 2016 18th Annual General Meeting
April 22, 2016 Ex-dividend date for 2015 final dividend
May 4, 2016* Announcement of first quarter results for the period ending March 31, 2016
May 17, 2016 Payment of 2015 final dividend
August 2, 2016* Announcement of half year results for the period ending June 30, 2016
October 27, 2016* Announcement of third quarter results for the period ending September 30, 2016
* Provisional. Updates will be posted at www.sembcorp.com.
Identification no.: 003-031The full-colour section of this report is printed on paper containing recycled pulp from pre-consumer and post-consumer waste. This report is printed using soy-based ink, which is more environmentally friendly as opposed to traditional petroleum-based ink.

Sembcorp Industries Ltd30 Hill Street #05-04Singapore 179360Tel: (65) 6723 3113Fax: (65) 6822 3254www.sembcorp.comCo Regn No. 199802418D


