Semarang, 11 th July 2011 Renewable Energy For Productivity and Added Value.
23
RENEWABLE ENERGY ACTION PLAN IN WEST NUSA TENGGARA PROVINCE Semarang, 11 th July 2011 Renewable Energy For Productivity and Added Value
-
Upload
dania-mundy -
Category
Documents
-
view
215 -
download
0
Transcript of Semarang, 11 th July 2011 Renewable Energy For Productivity and Added Value.

RENEWABLE ENERGYACTION PLAN
IN WEST NUSA TENGGARA PROVINCE
Semarang, 11th July 2011
Renewable Energy For Productivity and Added Value

NATIONAL ENERGY POLICY
20%
30%33%
5% 5%5% 2%
Energy Mix Target : KEN
PetroleumNatural GasCoalBiofuelGeothermalOther RELiquified Coal

REGIONAL ENERGY POLICY
* For electricity generation
23%
9%
28%
38%
2%
Energy Mix Target : KED
PetroleumBiofuelCoalGeothermal and HydroOther RE

RENEWABLE ENERGY UTILIZATION Current Condition
Type of EnergyEnergy Utilization
(SBM)Avtur 94.922,06Premium 1.462.157,36Kerosene 365.204,95ADO for Electricity 1.163.826,98 ADO for Transportation 550.109,73 LPG 44.987,79Coal 2.563.503,97Renewable Energy (microhydro, solar power and biogas)
3.215,43
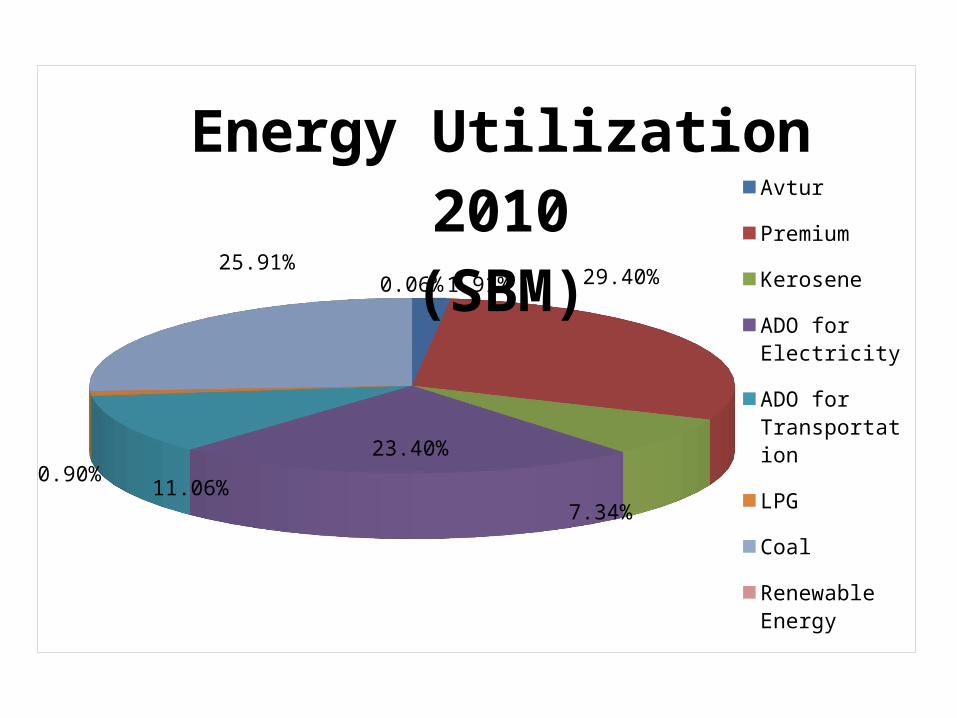
1.91%29.40%
7.34%
23.40%
11.06%0.90%
25.91%
0.06%
Energy Utilization 2010(SBM) Avtur
Premium
Kerosene
ADO for Electric-ity
ADO for Transporta-tionLPG
Coal
Renewable Energy

50.97%
48.42%
0.19% 0.42%
Energy Mix for Electricity Generation (Current Condition)
Coal
ADO
Wind
Solar
Geothermal
Hydro
Microhydro

RE POTENTIAL AND IT’S UTILIZATION
Type of Energy PotentialInstalled Capacity
Utilization
Minihydro 198,75 MW - -Microhydro 13,73 MW 0,979 MW 1.274,02 BOE/YearGeothermal 145 MWe - -Biofuel- Oil (Jatropha) - Cake
115.186 BOE125.424 BOE
- -
- -
Biomass 667.479 BOE Listrik
- -
Biogas 61.198.712m3/Year
98 m3 1.300,60 BOE/Year
Wind - - -Solar - 0,448 MW 640,81 BOE/YearCurrent Sea - - -

RE DEVELOPMENT OPPORTUNITIESType of Energy Dev’t Opportunity Maximum Capacity
Minihydro power plant Connect to grid (tradeable) 198,75 MWMicrohydro power plant Rural electrification (local) 12,57 MWGeothermal power plant Connect to grid (tradeable) 145 MWeBiofuel- Crude Jatropha Oil - Cake
CommercialHousehold use
115.186 SBM125.424 SBM
Biomass power plant Electricity 667.479 SBM ListrikBiogas Household use 10.220.185 m3
Wind power plant Electricity -Solar (SHS/centralized) Electricity -Current sea power plant Electricity -

RE UTILIZATION PROJECTION
Note. Value are accumulative of the previous year
Type of Energy Utilization 2010 2015 2020 2025Minihydro Power Plant Grid - 96.941,86 99.338,44 99.338,44
Microhydro Power Plant Local 1.274,02 1.449,42 1.952,59 1.952,59
Solar Power Local 640,81 927,20 1.141,99 1.356,79
Biogas Local 955,54 9.648,31 9.847,38 10.046,45Geothermal Power Plant Grid - 289.974,00 579.947,00 608.944,00
Biofuel Commercial - 240.610,21 240.610,21 240.610,21
Biomass Power Plant
Industry - 409.118,00 413.905,00 418.748,00
Wind Power Local - 1.342,47 1.342,47 1.342,47

NEW ENERGY MIX TARGETType of Energy 2010 2025
Minihydro power plant - 100.000Microhydro power plant 1.274 2.000Solar (SHS/centralized) 641 1.500Biogas 1.301 10.000Geothermal power plant - 600.000Biofuel - 250.000Biomass power plant - 400.000Wind power plant - 1.500
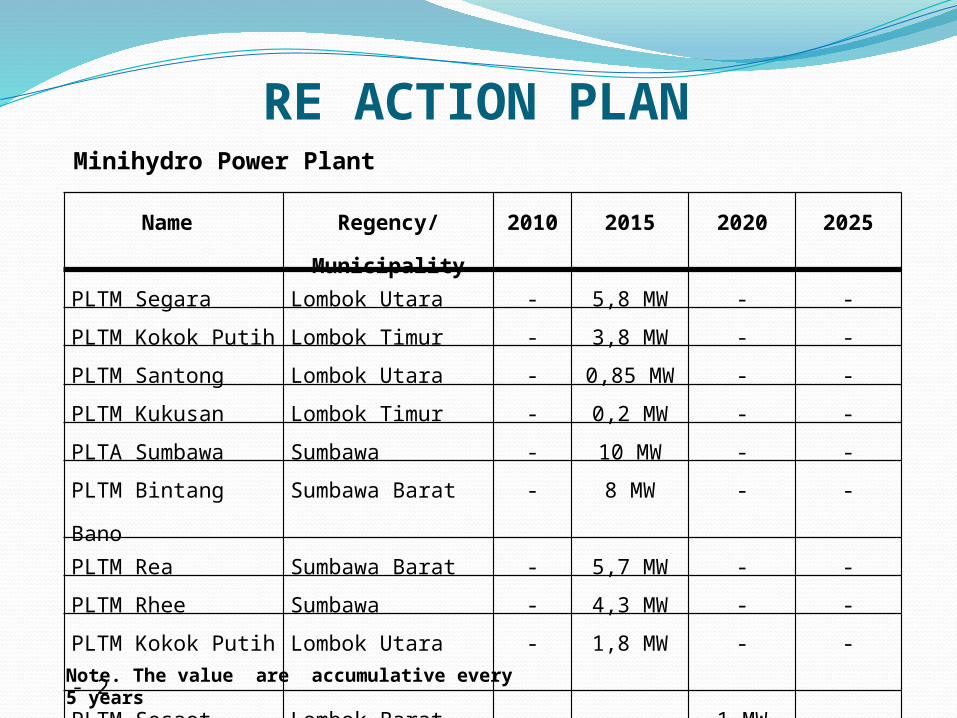
RE ACTION PLANMinihydro Power Plant
Name Regency/Municipality 2010 2015 2020 2025
PLTM Segara Lombok Utara - 5,8 MW - -
PLTM Kokok Putih Lombok Timur - 3,8 MW - -
PLTM Santong Lombok Utara - 0,85 MW - -
PLTM Kukusan Lombok Timur - 0,2 MW - -
PLTA Sumbawa Sumbawa - 10 MW - -
PLTM Bintang Bano Sumbawa Barat - 8 MW - -
PLTM Rea Sumbawa Barat - 5,7 MW - -
PLTM Rhee Sumbawa - 4,3 MW - -
PLTM Kokok Putih - 2 Lombok Utara - 1,8 MW - -
PLTM Sesaot Lombok Barat - - 1 MW -
Total - 40,45 MW 1 MW -
Note. The value are accumulative every 5 years

Microhydro Power Plant
Name Regency/Municipality 2010 2015 2020 2025
PLTMH Murpeji Lombok Utara 0,05 - - -
PLTMH Kok Sabang Lombok Utara - 0,05 - -
PLTMH Sedau Lombok Barat - 0,08 - -
PLTMH Pemotoh Lombok Tengah - 0,03 - -
PLTMH Kalijaga Timur Lombok Timur - 0,025 - -
PLTMH Kalijaga Selatan Lombok Timur - 0,012 - -
PLTMH Sesaot Lombok Barat - 0,05 - -
PLTMH Karang Sidemen Lombok Tengah - 0,05 - -
PLTMH Jelateng Lombok Barat - 0,022 - -
PLTMH Tepal - 2 Sumbawa - 0,098 - -
PLTMH Baturotok - 2 Sumbawa - - 0,441 -
PLTMH Rarak Ronges Sumbawa Barat - - 0,05 -
PLTMH Pekat Dompu - - 0,025 -
Total 0,05 MW 0,417 MW 0,516 MW -
Note. The value are accumulative every 5 years
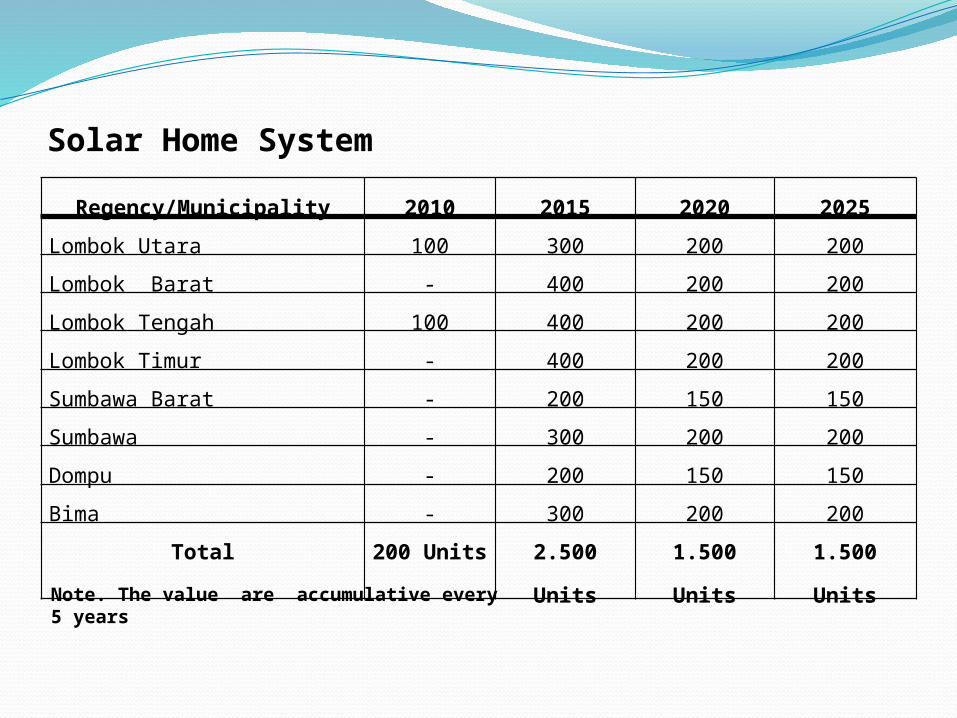
Solar Home System
Regency/Municipality 2010 2015 2020 2025
Lombok Utara 100 300 200 200
Lombok Barat - 400 200 200
Lombok Tengah 100 400 200 200
Lombok Timur - 400 200 200
Sumbawa Barat - 200 150 150
Sumbawa - 300 200 200
Dompu - 200 150 150
Bima - 300 200 200
Total 200 Units 2.500 Units 1.500 Units 1.500 Units
Note. The value are accumulative every 5 years

Centralized PV
Regency/Municipality 2010 2015 2020 2025
Lombok Utara - 2 2 2
Lombok Barat 1 2 2 2
Lombok Tengah - 2 2 2
Lombok Timur - 3 3 3
Sumbawa Barat - 1 1 1
Sumbawa - 1 1 1
Dompu - 2 2 2
Bima - 2 2 2
Total 1 Unit 15 Units 15 Units 15 Units
Note. The value are accumulative every 5 years

Biogas
Regency/Municipality 2010 2015 2020 2025
Lombok Utara 1 130 3 3
Lombok Barat 9 154 4 4
Lombok Tengah 61 184 4 4
Lombok Timur 19 161 4 4
Sumbawa 1 - - -
Dompu 7 - - -
Total 98 Units 629 Units 15 Units 15 Units
Note. The value are accumulative every 5 years

Wind Power Plant
Geothermal Power Plant
Note. The value are accumulative every 5 years
Regency/Municipality 2010 2015 2020 2025
Lombok Barat - 0,60 MW - -
Lombok Tengah - 0,60 MW - -
Lombok TimurDompu
- 0,65 MW0,65 MW
--
--
Total - 2,50 MW - -
Regency/Municipality 2010 2015 2020 2025
Lombok Timur - 40 MW 20 MW -
Sumbawa - 20 MW 40 MW 6 MW
Dompu - 20 MW 40 MW -
Total - 60 MW 60 MW 6 MW

Biomass Power Plant
Note. The value are accumulative every 5 years
Regency/Municipality 2010 2015 2020 2025
Lombok Tengah - 0,03 - -
Sumbawa - - 0,03 -
Dompu - - - 0,03
Total - 0,03 MW 0,03 MW 0,03 MW

IMPLEMENTATION STRATEGY1. Establish and carry out a forum consist of
related institution responsible for RE implementation;
2. Formulate and implement funding sheme;3. Increasing the quality of human resources
and technology;4. Formulate the detail of implementation
plan.

Regional Energy Forum
(FORKENDA)
RE Dev’t Team
Minihydro Microhydro Solar Biofuel Biomassa Geothermal Biogas
1. RE INSTITUTION SET UP
1. There are 2 (two) teams have been established, both team responsible for the development of microhydro and biofuel in West Nusa Tenggara Province;
2. The problem is, starting from 2011, each dinas budget based on target, so it would be difficult to ask another dinas to lead a team which goal is for RE development, because it is not their target/responsibility.

2. FUNDING SCHEME
Gov’t SharingInvestment CostRp.
2015 2020 2025Sharing 25 % 1.099.272.525.000 883.339.623.334 180.731.248.399
Sharing 50 % 732.848.350.000 588.893.082.223 120.487.498.932
Sharing 75 % 366.424.175.000 294.446.541.111 60.243.749.466
Note. Rate interest = 12 %
Type of Energy Investment CostMinihydro USD 2.000/kWMicrohydro USD 2.890/kWSolar home system USD 694/unit 50 WpCentralized solar system USD 9.000/kWBiogas USD 153/m3
Geothermal Power Plant USD 1.200/kWBiomass Power Plant USD 1.500/kWWind Power USD 5.000/kW

3. HUMAN RESOURCES AND TECHNOLOGY
Increase human resources competency by following training and short course in the field of renewable energy;
Join cooperation with institutions to conduct research in the field of renewable energy;
Provide community development funds to educate people who lived surround RE project area.

4. DETAIL IMPLEMENTATION PLANIdentification of village and sub village which
are have not been electrified;Collecting data and information about RE
potential, for instance microhydro, hydro power plant, wind power etc;
Conduct feasibility study and detail design engineering on potential locations;
Increasing the local content of RE technology;Creating healthy and safe climate of investment;Implementation of feed in tariff.

Powerpoint Templates
THANK YOU VERY MUCH FOR YOUR ATTENTION
Renewable Energy for Productivity and Added Value