
Selling “Performance” Assessments with Inaccurate Pictures · PDF fileSelling...
17
DISCUSSION PAPER Bluegrass Institute for Public Policy Solutions, P.O. Box 11706, Lexington, KY 40577 Page 1 Selling ‘Performance’ Assessments with Inaccurate Pictures from Kentucky Richard G. Innes Staff Education Analyst Bluegrass Institute for Public Policy Solutions (www.bipps.org) March 2, 2015 Introduction A new white paper from Ace Parsi and Linda Darling‐Hammond, “Performance Assessments: How State Policy Can Advance Assessments for 21st Century Learning,” 1 includes comments about supposed successes of the Kentucky Instructional Results Information System (KIRIS) used in the Bluegrass State from 1992 to 1998. Those comments need more discussion. Parsi is the project director for deeper learning at the National Association of State Boards of Education in Arlington, Virginia. 2 Darling‐Hammond is the Charles E. Ducommun Professor of Education and the Faculty Director, Stanford Center for Opportunity Policy in Education at Stanford University in California. 3 She also serves as the senior research advisor to the Smarter Balanced Assessment Consortium. 4 The Kentucky‐related comments in the Parsi/Darling‐Hammond paper claim a basis in a technical report titled “Commonwealth Accountability and Testing System: 2007–08 Technical report, Version 1.2” created by Measured Progress in 2009. Unfortunately, the Kentucky Department of Education recently redesigned its website and this technical report is no longer online. However, if the report actually does show the information attributed to it by Parsi and Darling‐Hammond, that information is incorrect. As a closeout epitaph of yet another failure, Kentucky’s Commonwealth Accountability Testing System (CATS), which followed the failed KIRIS system, the creation of the 2007‐08 technical report may not have received an appropriate level of attention to detail. The focus in Kentucky at the time the technical report was rendered was on trying to finally create something new and better rather than rehashing past failures. In any event, new attempts to add performance‐assessment elements to Common Core‐based education programs make it important to understand how such elements really performed in Kentucky’s old assessment programs. Discussion The comments below draw as much as possible from reports issued during or shortly after the events occurred and on this observer’s more than 20 years of experience as a Kentucky resident and researcher
Transcript of Selling “Performance” Assessments with Inaccurate Pictures · PDF fileSelling...
DISCUSSION PAPER
Bluegrass Institute for Public Policy Solutions, P.O. Box 11706, Lexington, KY 40577 Page 1
Selling ‘Performance’ Assessments with Inaccurate Pictures
from Kentucky
Richard G. Innes
Staff Education Analyst
Bluegrass Institute for Public Policy Solutions (www.bipps.org)
March 2, 2015
Introduction
A new white paper from Ace Parsi and Linda Darling‐Hammond, “Performance Assessments: How State
Policy Can Advance Assessments for 21st Century Learning,”1 includes comments about supposed
successes of the Kentucky Instructional Results Information System (KIRIS) used in the Bluegrass State
from 1992 to 1998. Those comments need more discussion.
Parsi is the project director for deeper learning at the National Association of State Boards of Education
in Arlington, Virginia.2 Darling‐Hammond is the Charles E. Ducommun Professor of Education and the
Faculty Director, Stanford Center for Opportunity Policy in Education at Stanford University in
California.3 She also serves as the senior research advisor to the Smarter Balanced Assessment
Consortium.4
The Kentucky‐related comments in the Parsi/Darling‐Hammond paper claim a basis in a technical report
titled “Commonwealth Accountability and Testing System: 2007–08 Technical report, Version 1.2”
created by Measured Progress in 2009. Unfortunately, the Kentucky Department of Education recently
redesigned its website and this technical report is no longer online. However, if the report actually does
show the information attributed to it by Parsi and Darling‐Hammond, that information is incorrect.
As a closeout epitaph of yet another failure, Kentucky’s Commonwealth Accountability Testing System
(CATS), which followed the failed KIRIS system, the creation of the 2007‐08 technical report may not
have received an appropriate level of attention to detail. The focus in Kentucky at the time the technical
report was rendered was on trying to finally create something new and better rather than rehashing
past failures.
In any event, new attempts to add performance‐assessment elements to Common Core‐based
education programs make it important to understand how such elements really performed in Kentucky’s
old assessment programs.
Discussion
The comments below draw as much as possible from reports issued during or shortly after the events
occurred and on this observer’s more than 20 years of experience as a Kentucky resident and researcher
DISCUSSION PAPER
Bluegrass Institute for Public Policy Solutions, P.O. Box 11706, Lexington, KY 40577 Page 2
of the state’s troubled education reform. This period has seen the rise and demise of two assessment
programs that relied rather strongly on performance‐based assessment elements. A key lesson to be
learned from this discussion is that some exercises that might be effective for well‐trained teachers in a
classroom environment might not be suitable for statewide assessment and accountability programs.
In the following discussion, statements from the Parsi/Darling‐Hammond paper are in bulleted bold
italic typeface with my comments following in standard typeface. Here is the first example:
KIRIS included standardized tests in grades 4, 8, and 11, featuring multiple‐choice and short‐
essay questions supplemented by performance tasks in mathematics, which required students
to solve applied problems, and writing portfolios, which collected specific samples of
classroom work over time. (Parsi/Darling‐Hammond, Page 7)
Technical Problem: Grades and subjects actually tested were different
The quote from Parsi and Darling‐Hammond above inaccurately describes KIRIS testing. During its
troubled lifetime between the initial 1992 and the final 1998 administrations, KIRIS actually experienced
considerable instability, some of which included a number of changes in grades where subjects were
tested.
For example, the “KIRIS Accountability Cycle I Technical Manual”5 shows in Tables 3‐31 to 3‐33 that
when KIRIS began in 1992, the actual accountability assessments were only administered in Grades 4, 8
and 12 (not Grade 11). This would later change, but testing was never conducted solely in Grades 4, 8
and 11.
As discussed in greater detail later, “Performance Events” (not called “Performance Tasks” in Kentucky’s
KIRIS) tested more than math, as well (Cycle I Technical Manual, Page 42). The Performance Events were
separate from yet another KIRIS element, the Mathematics Portfolios.
What/how did KIRIS assess?
There were fairly traditional tests in a number of subjects including reading, math, science, social
studies, writing, Arts/Humanities and Practical Living/Vocational Studies. KIRIS used both multiple‐
choice (Cycle I Technical Manual, Tables 3‐14 to 3‐16) and open‐response (written answer) question
formats (Cycle I Technical Manual, Table 3‐2).
There were other assessment items called “Performance Events” – not “Performance Tasks” (Cycle I
Technical Manual, Page 42). These were given in a variety of subjects such as math, science and social
studies. They often were interdisciplinary and not limited to only math.
In addition, KIRIS included “Writing Portfolio” and, for a time, “Math Portfolio” elements (Cycle I
Technical Manual, Page 41), which all Grade 4, 8 and 12 students were required to complete.
DISCUSSION PAPER
Bluegrass Institute for Public Policy Solutions, P.O. Box 11706, Lexington, KY 40577 Page 3
Thus, in the early years of KIRIS, no assessment activity occurred in Grade 11. This remained true
through the 1993‐94 school term. The shift of most high‐school testing to Grade 11 didn’t occur until the
1994‐95 term, according to the KIRIS Accountability Cycle II Technical Manual.6 However, writing
portfolios remained a Grade 12 event even after the other testing moved to Grade 11.7
By 1998 – the last year of KIRIS – various parts of the overall assessment program were being
administered to students in grades 4, 5, 7, 8, 11 and 12. If the 2007‐08 Technical Manual cited by Parsi
and Darling‐Hammond says testing was only conducted in Grades 4, 8 and 11, it’s incorrect.
A note on multiple‐choice questions
While administered in the first three years of KIRIS, the multiple‐choice questions never were counted in
actual KIRIS scoring. In fact, at one point the Kentucky Board of Education voted to remove multiple‐
choice questions completely from later KIRIS assessments (see Cycle I Technical Manual, Page 47). This
mistake was reversed for the 1996‐97 test cycle when multiple‐choice questions were reintroduced as a
developmental item. Multiple‐choice questions didn’t become a scored part of the accountability
program in Kentucky until the Commonwealth Accountability Testing System (CATS) replaced the then‐
failed KIRIS in 1999.
Performance Events need special discussion
Kentucky’s Performance Events were certainly the most radical element in KIRIS. A discussion of their
history is important today because states currently are being encouraged to use similar sorts of
assessment items in their new Common Core tests.
A typical KIRIS Performance Event for fourth‐grade students involved a test facilitator giving teams of
four students an 8‐1/2” by 11” piece of paper with a large number of near‐life‐size lady bug insect
images on it. The students were given various tools such as rulers, compasses and protractors and asked
to determine the number of images on the paper. After the student team worked together to solve the
problem, each student wrote up a separate report that was collected for central grading.
Final grades were not determined by the facilitator’s evaluation of the team’s work. Instead, the event
scoring relied on central grading of the written reports. Thus, this math‐oriented Performance Event
largely became a writing‐skills evaluation conducted by individuals who had not observed the fourth‐
grade team working on the problem.
The lady‐bug exercise provides some insight into one of the problems with the Performance Events: the
severe challenge of repeatedly developing good items that work as anticipated. While the event
developers probably expected students to do something like folding the paper into fourths so they only
had to count a few of the images and then extrapolate to the final answer, it’s likely that many teams
simply carefully counted up all of the images on the entire page, checking off each image as it was
counted. This second approach would develop a more accurate answer than an extrapolation approach
and would not take much more time to accomplish.
Of course, the direct‐counting approach requires nothing more than basic counting skills.
DISCUSSION PAPER
Bluegrass Institute for Public Policy Solutions, P.O. Box 11706, Lexington, KY 40577 Page 4
However, aside from possibly not stimulating the sort of higher‐order thinking this Performance Event
likely intended, there is a more serious problem with these assessment elements, discussed below,
which led to the complete failure of these assessment items in 1996.
The first KIRIS performance elements to fail
The KIRIS Mathematics Portfolios and Performance Events proved highly problematic.
In 1996, reacting to tremendous criticism from both professionals and parents, the legislature voted to
remove Math Portfolios completely from accountability.8 The Math Portfolio program entered an
experimental phase that never proved successful. Nearly two decades later, Math Portfolios are not
being considered as a possible addition to Kentucky’s current statewide assessment program.
Major problems with the Performance Events also surfaced in 1996. These most‐advanced of all the
Kentucky assessment items also were ended in that year.9
Today’s policymakers need to be aware of these problems because they point to long‐term, unresolved
sustainability issues for all performance‐based assessment items.
As the lady bug Performance Event mentioned earlier shows, Performance Events were usually quite
vivid and easy to remember. As a consequence, to prevent teaching to the test, the Performance Event
problems had to be changed. However, it proved highly problematic to replace these assessment
elements with new ones that continued to measure the same content to an equivalent level of difficulty.
Maintaining such consistency is essential if valid assessment trend lines are going to be maintained over
time.
Within four years, the contractor for Kentucky’s Performance Events proved unequal to this
sustainability challenge. An eighth‐grade Performance Event on the 1996 KIRIS assessment was so
poorly crafted that even the best psychometric adjustment of the raw‐score results was considered
invalid. In addition, a reliability analysis of changed Performance Events items showed results were “all
over the place” and unreliable.10
In a 1998 report commissioned by the Kentucky Office of Education Accountability to review problems
with KIRIS testing, Dr. James Catterall et al. write:
“A very unusual relationship between educational policy and technical procedures is illustrated
in the KIRIS experience with performance events. The policy decision to include performance
events was made for educational reasons in the absence of any technical procedures that could
be used to equate or link scores across performance events. Performance events were
administered and plans to use them in the accountability index were made. Only after the fact
was the absence of adequate technical support recognized, confronted, and resolved by the
decision not to use the performance events.”(Catterall et al., Page 42)11
DISCUSSION PAPER
Bluegrass Institute for Public Policy Solutions, P.O. Box 11706, Lexington, KY 40577 Page 5
Thus, despite a considerable investment, the Performance‐Events‐for‐assessments challenge proved
unsolvable for Kentucky. These items were also permanently removed from the assessment by the
legislature.
The removal for cause of both Mathematics Portfolios and Performance Events provides important
lessons to anyone considering similar items for Common Core State Standards‐related testing. These
items simply didn’t work in practice for statewide assessments in Kentucky. Kentucky’s experience
should not – and cannot – be cited as evidence to support use of similar items on Common Core
assessments.
The math legacy in Kentucky
Since the Parsi/Darling‐Hammond paper implies that Math Portfolios and Performance Events had a
positive history in Kentucky, it seems incumbent to discuss the state’s performance compared to other
states on the National Assessment of Educational Progress (NAEP) Mathematics Assessments.
To compare Kentucky to other states in a meaningful way, it is important to disaggregate the scores – a
recommendation found in recent NAEP report cards. This is because Kentucky’s student demographics
are dramatically different from the rest of the nation. As discussed in some detail in the NAEP 2009
Science Report Card, simplistic consideration of only overall average scores for all students provides an
inflated image of Kentucky’s true performance.12
For example, the NAEP Data Explorer13 shows Kentucky’s public‐school population was 90 percent white
in 1990 when NAEP state testing began in Grade 8 math. Kentucky’s white students still accounted for
83 percent of all students tested in the state in the 2013 Grade 8 NAEP Math Assessment. Only 73
percent of the public‐school students nationwide tested in the NAEP were whites in 1990. The national
public‐school sample dropped to only 53 percent white in the 2013 NAEP Grade 8 Math Assessment.
Because of these demographic differences, and because white students significantly outperform almost
all of the minorities on the NAEP, simply having a lot more whites gives Kentucky an unfair advantage
when only overall average scores are considered.
Furthermore, even in the 2013 NAEP, all states have white scores but not all states have scores for other
races. So, we’ll look at white scores.
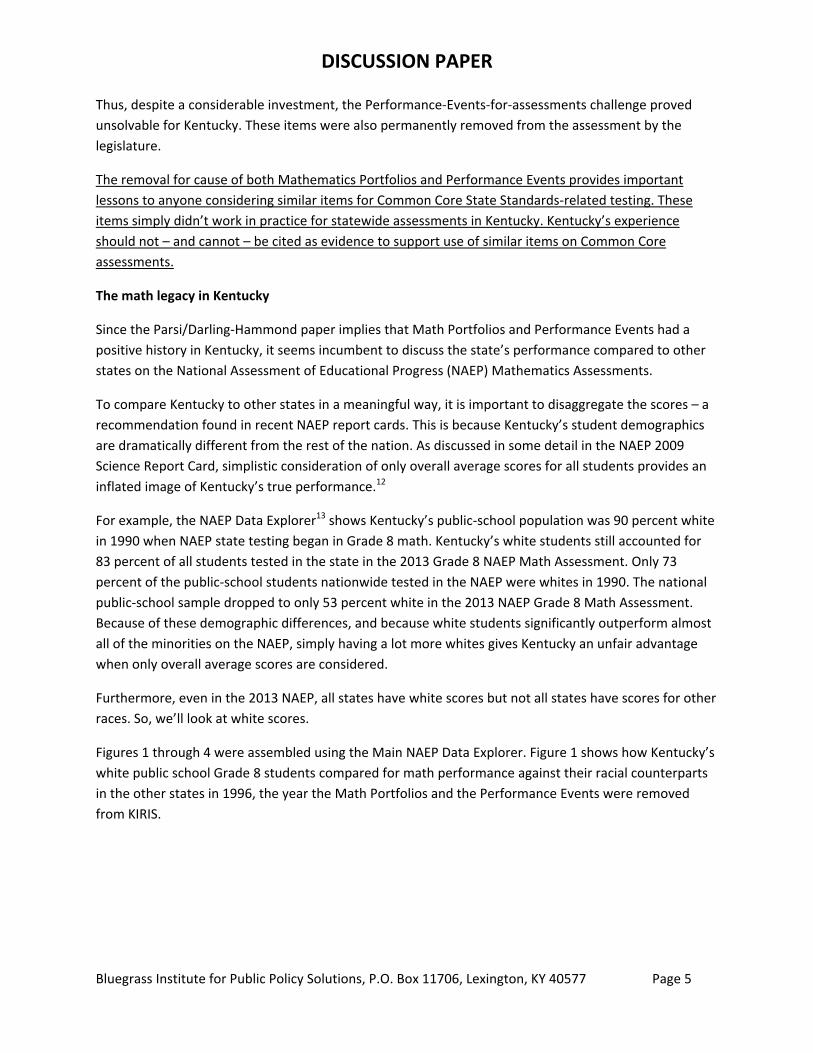
Figures 1 through 4 were assembled using the Main NAEP Data Explorer. Figure 1 shows how Kentucky’s
white public school Grade 8 students compared for math performance against their racial counterparts
in the other states in 1996, the year the Math Portfolios and the Performance Events were removed
from KIRIS.
DISCUSSION PAPER
Bluegrass Institute for Public Policy Solutions, P.O. Box 11706, Lexington, KY 40577 Page 6
Figure 1
Among the 40 states that received scores in the NAEP Grade 8 Math Assessment in 1996, Kentucky’s
white students failed to score statistically significantly higher than whites in any other state. In sharp
contrast, the vast majority of participating states, 33 of them, outscored Kentucky by a statistically
significant amount.
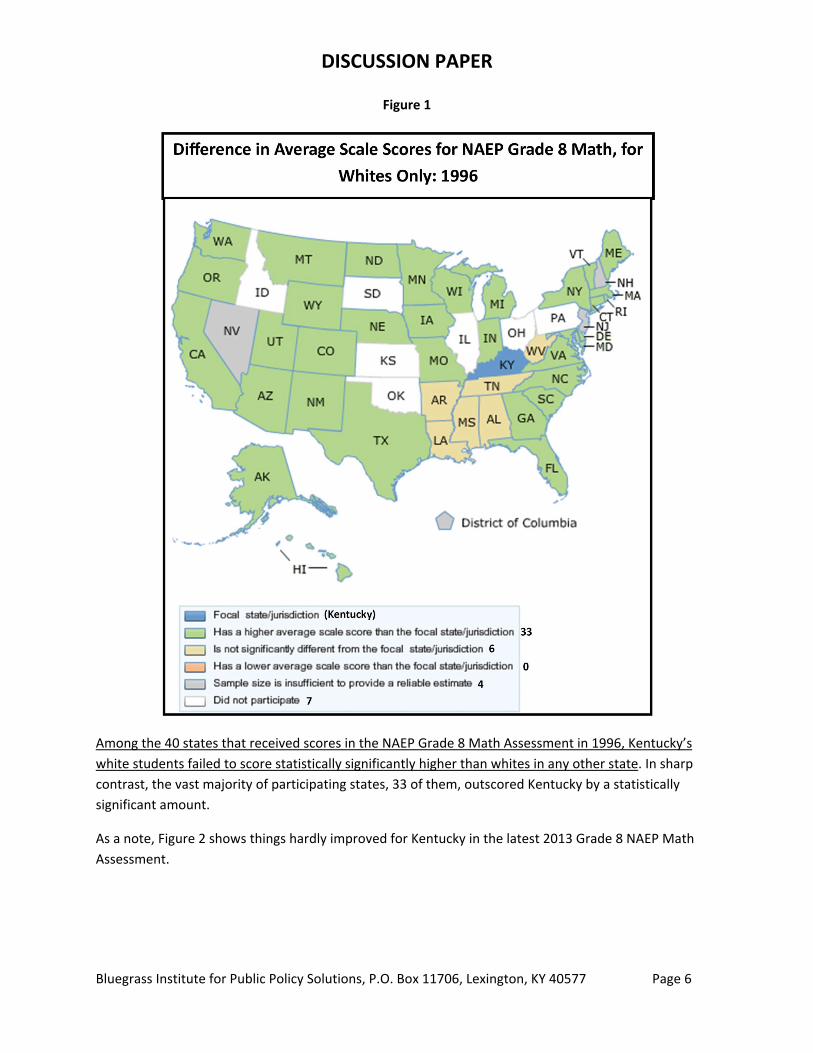
As a note, Figure 2 shows things hardly improved for Kentucky in the latest 2013 Grade 8 NAEP Math
Assessment.
DISCUSSION PAPER
Bluegrass Institute for Public Policy Solutions, P.O. Box 11706, Lexington, KY 40577 Page 7
Figure 2
West Virginia was the only state Kentucky’s whites statistically significantly outscored in 2013. In turn,
the Bluegrass State was outscored by 42 other jurisdictions including Washington, DC.
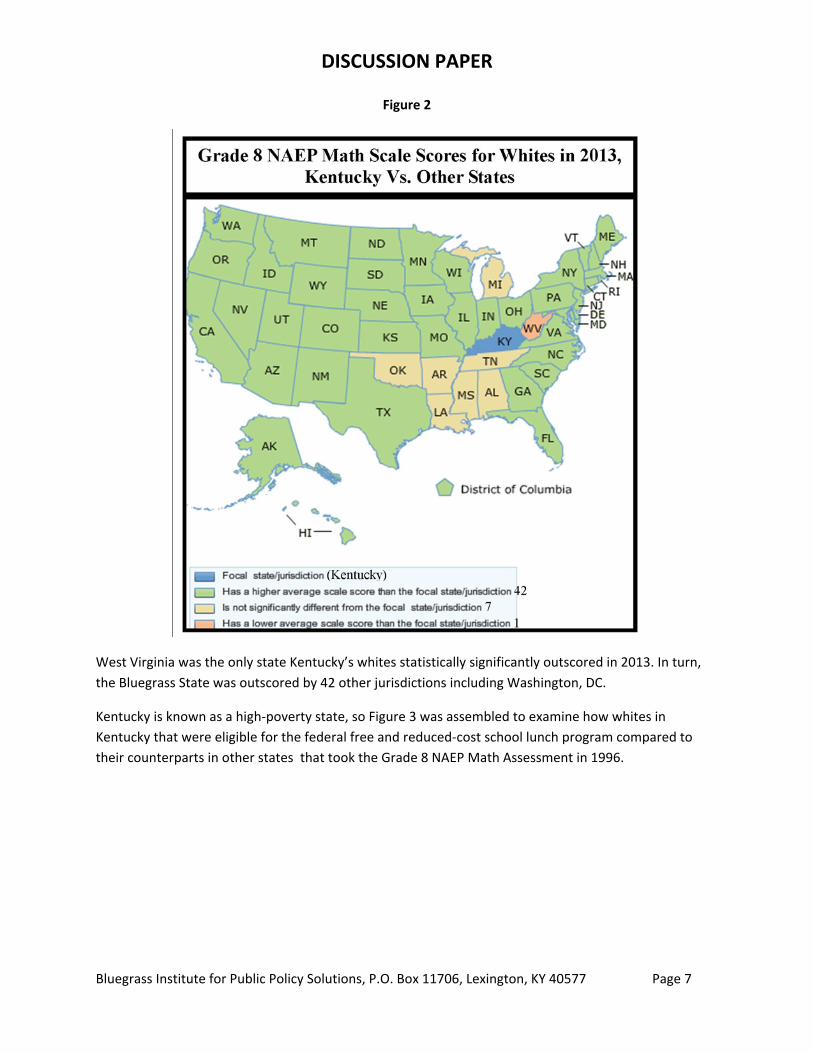
Kentucky is known as a high‐poverty state, so Figure 3 was assembled to examine how whites in
Kentucky that were eligible for the federal free and reduced‐cost school lunch program compared to
their counterparts in other states that took the Grade 8 NAEP Math Assessment in 1996.
DISCUSSION PAPER
Bluegrass Institute for Public Policy Solutions, P.O. Box 11706, Lexington, KY 40577 Page 8
Figure 3
Allowing for poverty clearly does not improve Kentucky’s weak math performance very much. Once
again, no state scored lower when Kentucky’s Math Portfolios and Performance Events ended in 1996
and poor whites in a strong majority of other states outscored Kentucky’s poor whites.
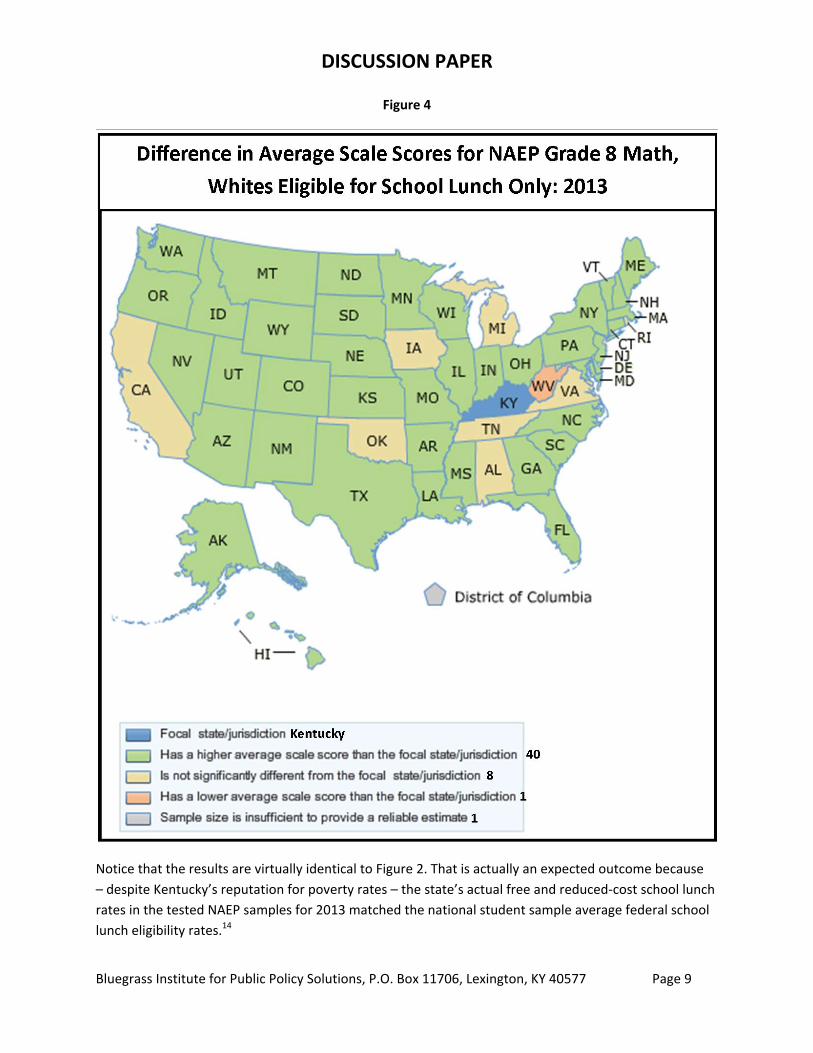
Finally, Figure 4 shows the 2013 math performance for whites eligible for free and reduced‐cost lunches
in the 50 states (Washington, DC. had sampling issues and didn’t receive a score).
DISCUSSION PAPER
Bluegrass Institute for Public Policy Solutions, P.O. Box 11706, Lexington, KY 40577 Page 9
Figure 4
Notice that the results are virtually identical to Figure 2. That is actually an expected outcome because
– despite Kentucky’s reputation for poverty rates – the state’s actual free and reduced‐cost school lunch
rates in the tested NAEP samples for 2013 matched the national student sample average federal school
lunch eligibility rates.14
DISCUSSION PAPER
Bluegrass Institute for Public Policy Solutions, P.O. Box 11706, Lexington, KY 40577 Page 10
Certainly, NAEP math performance in Kentucky at the end of the Math Portfolio and Performance Events
period and in following years raises strong concerns about the performance of math programs in the
state.
Performance‐based testing is costly
One item of particular importance to education policymakers is that the “performance” assessment
items used in KIRIS were very costly. Education Week’s Debra Viadero reported in 1994 that the first,
$29.5 million contract for KIRIS testing was “the largest of its kind in the nation’s history.”15
Others such as Dr. Lawrence Picus examined the contract costs of Kentucky’s assessments in greater
detail. His “Estimating the Costs of Student Assessment in North Carolina and Kentucky: A State‐Level
Analysis”16 shows in Table 7 that by 1993‐94 the contractor costs for KIRIS testing had risen to
$7,909,988, or $55.28 per student tested in Kentucky in that year.
That would represent a per‐pupil cost in current dollars of $88.30 for testing in reading, math, science,
social studies, writing and some other areas like arts and humanities and practical living and vocational
studies. However, due to a testing method known as “Matrixing,”17 individual students were only
incompletely tested in each subject in KIRIS; so the $55.28 figure covered only an incomplete
assessment of each student. Matrixing also meant that the actual validity of KIRIS results for individual
students was considered very low, at best.18 An assessment that would have provided high levels of
individual student validity and reliability would have been far more expensive.
Picus also completed another report about per‐pupil testing costs in Kentucky that additionally
considered opportunity cost issues due to extended testing time required and other costs related to
excessive concentration on preparation of students for the KIRIS tests. His astronomical estimate for
those total costs in “Alternative Assessment Programs: What Are the True Costs?” was an astonishing
$1,791.96 per pupil!19
Costs for the performance testing from KIRIS in the early 1990s were obviously much higher than the
$25 to $30 projected costs per pupil that Parsi and Darling‐Hammond cite on Page 10 of their paper for
the pending PARCC and SBAC consortia tests. Furthermore, Parsi and Darling‐Hammond indicate on
Page 4 of their report that the current forms of the PARCC and SBAC assessments include less than the
authors would recommend.
In addition, PARCC and SBAC will only cover math and English Language Arts subjects, so states will
encounter added costs for other testing in areas such as science and social studies.
Slow turnaround and release of performance item results
Another item of importance is the ability of testing firms to promptly turn around results from
“performance” question forms of assessments. Turnaround times with KIRIS were always excessive.
DISCUSSION PAPER
Bluegrass Institute for Public Policy Solutions, P.O. Box 11706, Lexington, KY 40577 Page 11
Results in the early years of the assessment were not available to parents until around Christmas of the
following school year.
Even quite recently, Kentucky has encountered significant problems with the turnaround of open‐
response question scores on its high school end‐of‐course exams from the ACT, Inc. In a development
first reported by the Bluegrass Institute, the ACT, Inc. was unable to provide open‐response scoring in a
reasonable amount of time at a cost Kentucky could bear. 20 “Education Week” later reported that the
open‐response questions had been dropped from the state’s current accountability system and would
only be available for local teacher scoring at each district’s option and expense.21
A key point here is that even if open‐response questions provide superior information (an issue open to
debate), getting such supposedly superior information late is not helpful to revising curriculum and
instruction.
As a note, there are plans to move open‐response question grading into a computer‐based, automatic‐
graded format. However, the research is still out on how successful such plans may prove to be in
practice. ACT, Inc. did not offer such an option to Kentucky when its human‐scored services proved
inadequate to Kentucky’s needs and abilities to pay.
The Parsi and Darling‐Hammond paper contains some other comments that deserve discussion.
The writing portfolio continued until 2012 in grades 4, 7, and 12, while an On‐Demand Writing
Assessment was used in grades 5, 8, and 12. (Parsi/Darling‐Hammond, Page 7)
Actually, use of student scores from writing portfolios as an assessment element only continued until
2008. After that, the follow‐on assessment to KIRIS, the Commonwealth Accountability Testing System
(CATS), also failed and was voted out by the legislature in 2009.22 The legislature finally recognized that
teacher‐scored writing portfolios – if included in the assessment program – would always return inflated
and untrustworthy information.
In fact, there’s evidence that having writing portfolios in the assessment program actually interfered
with the proper teaching of writing. Including Writing Portfolios in the KIRIS and CATS assessments
necessitated awkward rules that teachers had to follow to prevent cheating. For example, teachers were
quite limited as to the types of correction annotations they could use on student papers. At best,
teachers could only circle a problem area in the text and then enter somewhat cryptic comments and
symbols in the margin of the paper.23 Those awkward rules seriously hampered effective writing
instruction.
However, writing portfolios are still very much alive in Kentucky as a classroom instructional tool and
continue in use as of 2015. In fact, a new Kentucky assessment and accountability element now includes
a review of the conduct of the portfolio programs (though no factor for student scoring is included). The
DISCUSSION PAPER
Bluegrass Institute for Public Policy Solutions, P.O. Box 11706, Lexington, KY 40577 Page 12
use of writing portfolios didn’t end in Kentucky in 2012. Kentucky’s Writing Portfolio experience shows
that an assessment element that works well in individual classrooms can become highly problematic
when employed in a statewide assessment and accountability program.
While KIRIS was abandoned for cause after its 1998 administration (among other things, KIRIS results
became badly inflated compared to the National Assessment of Educational Progress), Parsi’s and
Darling‐Hammond’s comments expand into the present period. So, it seems appropriate to mention
here that under the current “Kentucky Performance Rating for Educational Progress” (KPREP)
assessment program, “Language Mechanics” testing is conducted in Grades 4, 6 and 10 while “On‐
Demand Writing” is evaluated in Grades 5, 6, 8, 10 and 11.24 The allegation that On‐Demand Writing is
only evaluated in grades 5, 8 and 12 is also incorrect.
Portfolio scoring never really accurate
Parsi and Darling‐Hammond make some strong statements about the accuracy of scoring in Kentucky’s
Writing Portfolio program.
The state trained teachers to score the portfolios at the school level using analytical rubrics
and processes that assured validity and reliability: two readers, using doubleblind (sic) rubrics,
were charged with scoring each piece in students’ portfolios. The system became so successful
that by 2008 the agreement rate among readers who audited school‐level scores was over 90
percent, and teachers and administrators alike saw the assessment as a valuable tool to
inform meaningful student learning. (Parsi/Darling‐Hammond, Page 7)
The 90 percent agreement comment refers to a special group of teachers who were trained to conduct
audits of a sample of the teacher‐scored writing portfolios. The “Kentucky Commonwealth
Accountability Testing System, 2007‐2008, Writing Portfolio Audit Report”25 indeed does talk about a 90
percent agreement rate for the auditors, but what the report actually says on Page 3 is that this was for
either exact or adjacent‐grade agreement. A major problem with that is the KIRIS writing portfolios only
used four possible grades: “Novice,” “Apprentice,” “Proficient” or “Distinguished.” If a typical “A‐B‐C‐D‐
F” grading system were in place, such an error would exceed a full letter‐grade difference. That’s not a
terribly accurate performance. Furthermore, the errors were even larger for every tenth student.
Equally important, the ability to demonstrate somewhat close score agreement for a small number of
hand‐picked auditors never proved scalable to the large number of scorers needed to service the entire
state’s student population.
Certainly, the same 2008 writing portfolio audit report provides evidence that between the early 1990s
when KIRIS began and 2008, Kentucky never was able to produce high accuracy results with the much‐
larger body of scorers required to score all the writing portfolios in the state.
DISCUSSION PAPER
Bluegrass Institute for Public Policy Solutions, P.O. Box 11706, Lexington, KY 40577 Page 13
In fact, the audits of selected samples of teacher‐graded student portfolios through 2008 always found
significant inflation.
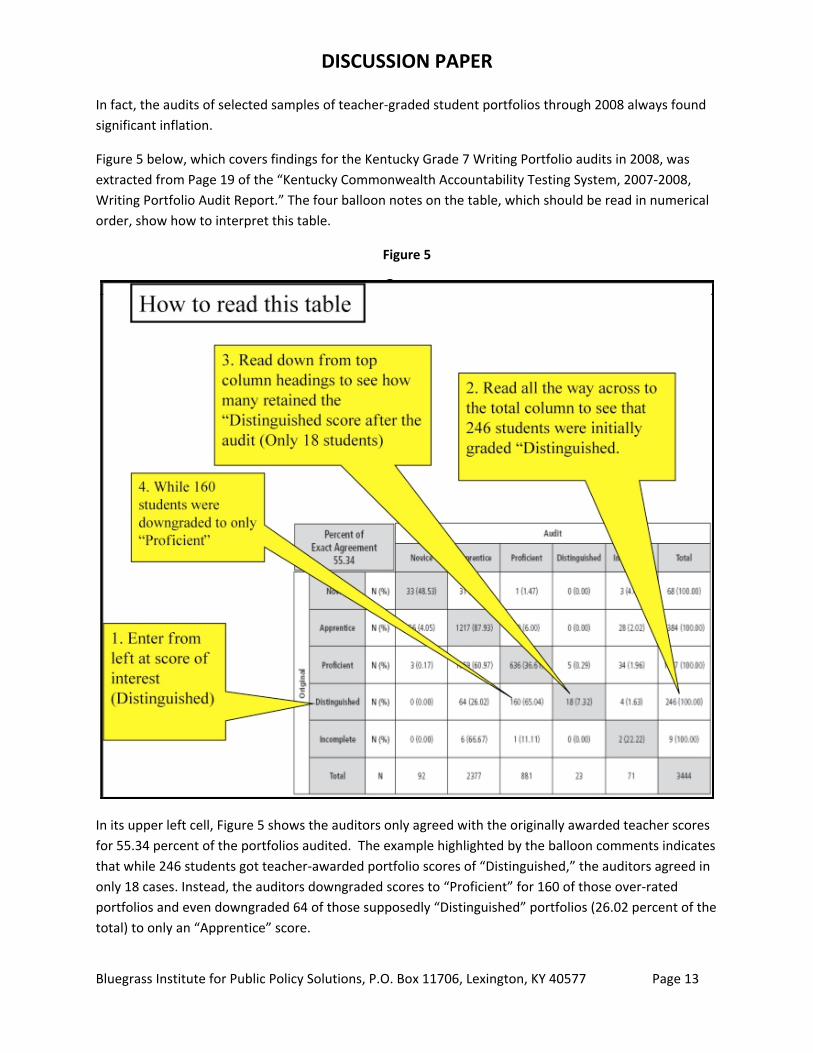
Figure 5 below, which covers findings for the Kentucky Grade 7 Writing Portfolio audits in 2008, was
extracted from Page 19 of the “Kentucky Commonwealth Accountability Testing System, 2007‐2008,
Writing Portfolio Audit Report.” The four balloon notes on the table, which should be read in numerical
order, show how to interpret this table.
Figure 5
In its upper left cell, Figure 5 shows the auditors only agreed with the originally awarded teacher scores
for 55.34 percent of the portfolios audited. The example highlighted by the balloon comments indicates
that while 246 students got teacher‐awarded portfolio scores of “Distinguished,” the auditors agreed in
only 18 cases. Instead, the auditors downgraded scores to “Proficient” for 160 of those over‐rated
portfolios and even downgraded 64 of those supposedly “Distinguished” portfolios (26.02 percent of the
total) to only an “Apprentice” score.
DISCUSSION PAPER
Bluegrass Institute for Public Policy Solutions, P.O. Box 11706, Lexington, KY 40577 Page 14
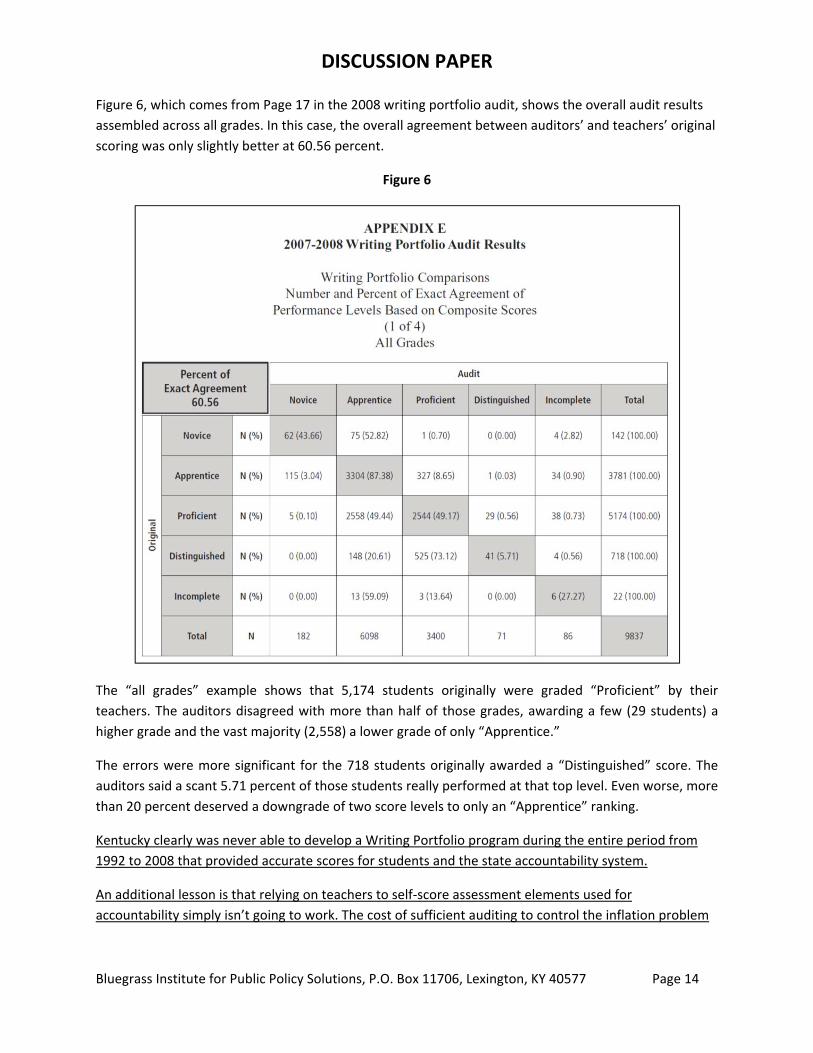
Figure 6, which comes from Page 17 in the 2008 writing portfolio audit, shows the overall audit results
assembled across all grades. In this case, the overall agreement between auditors’ and teachers’ original
scoring was only slightly better at 60.56 percent.
Figure 6
The “all grades” example shows that 5,174 students originally were graded “Proficient” by their
teachers. The auditors disagreed with more than half of those grades, awarding a few (29 students) a
higher grade and the vast majority (2,558) a lower grade of only “Apprentice.”
The errors were more significant for the 718 students originally awarded a “Distinguished” score. The
auditors said a scant 5.71 percent of those students really performed at that top level. Even worse, more
than 20 percent deserved a downgrade of two score levels to only an “Apprentice” ranking.
Kentucky clearly was never able to develop a Writing Portfolio program during the entire period from
1992 to 2008 that provided accurate scores for students and the state accountability system.
An additional lesson is that relying on teachers to self‐score assessment elements used for
accountability simply isn’t going to work. The cost of sufficient auditing to control the inflation problem
DISCUSSION PAPER
Bluegrass Institute for Public Policy Solutions, P.O. Box 11706, Lexington, KY 40577 Page 15
would likely be excessive. Otherwise, given the keen interest in writing in Kentucky, the state certainly
would have expanded its existing audit program to try and preserve the portfolio program.
As a note, the current‐day scoring of the new Writing Portfolio Program Reviews in Kentucky proved
inflated from the outset. In fact, evidence of the failure of the concept of teacher self‐scoring in
Kentucky was recently discussed at the January 13, 2015 meeting of the state School Curriculum
Assessment and Accountability Committee. A solution has yet to be developed.
Overall, Kentucky never achieved success with multiple efforts to use teacher self‐scoring in assessment.
Good questions that didn’t get asked in Kentucky before implementing current assessment program
At the close of their paper, Parsi and Darling‐Hammond offer suggestions about a number of good
questions that states should be asking before embarking on high‐level performance‐based testing
programs. Valid and useful questions such as:
What is being assessed and to what end?
Sustainability: How can the state pay for it?
Reliability: How can a state know assessment results can be trusted?
do need asking. Had Kentucky honestly asked such questions before launching its KIRIS and CATS
assessments, perhaps the state’s history with “performance” assessment items would have been less
disappointing, or at least far less expensive.
Summary
During the nearly 25 years since Kentucky’s education reforms were implemented, the state has seen
the rise and demise of two performance‐based assessment systems. Along the way, the state
completely abandoned Mathematics Portfolios and Performance Events – assessment items similar to
those Parsi and Darling‐Hammond now recommend.
The state also has finally come to grips with the realities of Writing Portfolios and has dropped student
scores from Writing Portfolios as an accountable assessment item. In addition, the Bluegrass State has
currently dropped open‐response questions from high school end‐of‐course test accountability due to
turnaround time and cost issues.
The commonwealth also now recognizes it went down the wrong road by abandoning multiple‐choice
questions in its state assessments. Kentucky learned the hard way why these are also referred to as
objective test questions. In notable contrast, the Bluegrass State discovered that open‐response
questions always present validity and reliability issues and notably delay the return of results. Those
issues can impact the overall accountability system in fairly serious ways if such types of “performance”
question form a dominant part of the assessment question set.
Kentuckians also are extremely familiar with the high cost of “performance”‐question‐based testing.
DISCUSSION PAPER
Bluegrass Institute for Public Policy Solutions, P.O. Box 11706, Lexington, KY 40577 Page 16
It’s unfortunate that the Parsi/Darling‐Hammond paper clearly pushes Kentucky‐like “performance”
type assessment models without discussing significant problems that surfaced with those question types
or offering any remedies. Nevertheless, given the known failures and high costs of many of the most
aggressive “performance” assessment elements in Kentucky’s old KIRIS and CATS assessments, it should
be obvious to policymakers that states contemplating use of such assessment items in the future must
exercise extreme caution.
Going forward, if states choose to use “performance” items in their assessments, it’s incumbent on
them to first locate solid research that shows problems encountered in Kentucky’s statewide
implementation of such assessment items have been corrected. Unless such well‐researched solutions
can be found – remedies not offered by Parsi and Darling‐Hammond and unknown to this author – other
states likely will just demonstrate the Bluegrass State’s very expensive assessment failures all over again.
States should also be aware that some items that work well for classroom instruction – such as Writing
Portfolios – may prove problematic for statewide assessments. Indeed, states should keep a wary eye
out for possible unintended consequences that may arise from new and under‐researched assessment
items.
As a final suggestion, anyone considering the KIRIS era in Kentucky and the types of assessments used in
that period should review two papers that discuss the issues in considerable detail. The first is “Review
of the Measurement Quality of the Kentucky Instructional Results Information System, 1991‐1994” by
Ronald K. Hambleton, et al.26 The second is “Kentucky Instructional Results Information System: A
Technical Review” by James S. Catterall, et al.27
The Parsi/Darling‐Hammond paper appears to be uninformed by those two papers, but state
policymakers should not be.
Endnotes
1 Online at: http://www.nasbe.org/wp‐content/uploads/Parsi‐LDH‐Performance‐Assessment_Jan2015.pdf. 2 http://www.nasbe.org/about‐us/our‐structure/leadership‐staff/. 3 https://ed.stanford.edu/faculty/ldh. 4 http://www.smarterbalanced.org/about/smarter‐balanced‐staff/. 5 Kentucky Department of Education, “KIRIS Accountability Cycle I Technical Manual,” Frankfort, KY, July 10, 1995.Not online.
6 Kentucky Department of Education, “KIRIS Accountability Cycle II Technical Manual,” (DRAFT), Frankfort, KY, April 1997. Not online.
7 Kentucky Department of Education, “Kentucky School and District Accountability Results, Accountability Cycle 3 Midpoint Report (1994‐95 to 1996‐97), Section 4, Background Information” Frankfort, KY, December 4, 1997, Page 22.
8 Education Week, “States Turn to a Mix of Tests in Hopes of a Clearer Picture,” January 22, 1997. Online at: http://www.edweek.org/ew/articles/1997/01/22/17assess.h16.html?qs=Kentucky+math+portfolio.
9 Education Week, “States Turn to a Mix of Tests in Hopes of a Clearer Picture,” January 22, 1997. Online at: http://www.edweek.org/ew/articles/1997/01/22/17assess.h16.html?qs=Kentucky+math+portfolio.
10 Education Week, “Dispute Over Ky. Test Section Sparks Broader Debate,” May 28, 1997. Online at: http://www.edweek.org/ew/articles/1997/05/28/35ky.h16.html?qs=Kentucky+Performance+Events.
DISCUSSION PAPER
Bluegrass Institute for Public Policy Solutions, P.O. Box 11706, Lexington, KY 40577 Page 17
11 Catterall, James S. et al., “Kentucky Instructional Results Information System: A Technical Review,” Kentucky Office of Education Accountability, Kentucky General Assembly, Frankfort, Kentucky, January 1998. Online at: http://www.lrc.ky.gov/oea/reports/KY%20INS.%20RESULTS%20INFO.pdf.
12 See the discussion beginning on Page 32 in National Center for Education Statistics (2011), “The Nation’s Report Card: Science 2009,” (NCES 2011–451), Institute of Education Sciences, U.S. Department of Education, Washington, D.C. Online at: http://nces.ed.gov/nationsreportcard/pdf/main2009/2011451.pdf. This discussion shows how Kentucky actually scored above the national average for Grade 8 NAEP Science in 2009 when only overall scores are considered but actually had white student scores below the national average.
13 The NAEP Data Explorer is online here: http://nces.ed.gov/nationsreportcard/naepdata/. 14 See: http://www.bipps.org/kentucky‐educators‐lost‐poverty‐excuse/#more‐13186. 15 Viadero, Debra, “The Little Firm That Could,” Education Week, June 8, 1994. Online at: http://www.edweek.org/ew/articles/1994/06/08/37test.h13.html?qs=The+Little+Firm+that+Could.
16 Picus, Lawrence O., “Estimating the Costs of Student Assessment in North Carolina and Kentucky: A State‐Level Analysis,” CSE Technical Report 408, CRESST/University of Southern California, February 1996. Online at: http://cse.ucla.edu/products/reports/TECH408.pdf.
17 For more on matrixing, see the section titled “The matrixing mistake” beginning on Page 19, in Innes, Richard G., “KERA (1990 to 2010, What Have We Learned?” Bluegrass Institute for Public Policy Solutions. Online here: http://www.freedomkentucky.org/images/d/d4/KERAReport.pdf.
18 See the section titled “Truth on individual student scores comes out” beginning on Page 32, in Innes, Richard G., “KERA (1990 to 2010, What Have We Learned?” Bluegrass Institute for Public Policy Solutions. Online here: http://www.freedomkentucky.org/images/d/d4/KERAReport.pdf.
19 Picus, Lawrence O. and Tralli, Alisha, Alternative Assessment Programs: What Are the True Costs? An Analysis of the Total Costs of Assessment in Kentucky and Vermont,” CSE Technical Report 441, CRESST/University of Southern California, April 1997. See Table 13. Online at: http://www.cse.ucla.edu/products/Reports/TECH441new.pdf.
20 Morford, Logan, “News Release: Kentucky’s common‐core testing program hits major snag,” Bluegrass Policy Blog, May 3, 2013. Online at: http://www.bipps.org/news‐release‐kentuckys‐common‐core‐testing‐program‐hits‐major‐snag/.
21 Ujifusa, Andrew, “Kentucky Common‐Core Testing Snafus Upset Lawmakers,” Education Week, May 6, 2013. Online here: http://blogs.edweek.org/edweek/state_edwatch/2013/05/kentucky_common_core_test_scoring_altered_lawmakers_upset.html?qs=Kentucky+end+of+course+tests.
22 CATS was ended with the passage of Senate Bill 1 from the Kentucky 2009 Regular Legislative Session. The bill is online here: http://www.lrc.ky.gov/record/09rs/SB1/bill.doc.
23 The Bluegrass Institute prepared a video with examples of the very restrictive rules Kentucky teachers were forced to follow when Writing Portfolios were included in the accountability system. “CATS WRITING PORTFOLIOS Tying Teachers Hands” is online here: https://www.youtube.com/watch?v=R7maF1AhyiM.
24 Scores for various writing elements are reported for the listed grades in the Kentucky Department of Education’s Excel spreadsheets available in the “Data Sets” section, by clicking on the “Assessments,” “KPREP,” “Grade” link in the Kentucky School Report Card web site. Online here: http://applications.education.ky.gov/SRC/.
25 Kentucky Department of Education, “Kentucky Commonwealth Accountability Testing System, 2007‐2008, Writing Portfolio Audit Report,” Frankfort, KY.
26 Hambleton, Ronald K., et al., “Review of the Measurement Quality of the Kentucky Instructional Results Information System, 1991‐1994,” Kentucky Office of Education Accountability, Kentucky General Assembly, Frankfort, Kentucky, June 20, 1995. Online at: http://www.lrc.ky.gov/oea/reports/MEASUREMENT%20QUALITY%20FINAL%20REPORT%2091‐94.pdf.
27 Catterall, James S. et al., “Kentucky Instructional Results Information System: A Technical Review,” Kentucky Office of Education Accountability, Kentucky General Assembly, Frankfort, Kentucky, January 1998. Online at: http://www.lrc.ky.gov/oea/reports/KY%20INS.%20RESULTS%20INFO.pdf.