Sell Side School Ties
61
Sell Side School Ties LAUREN COHEN, ANDREA FRAZZINI, and CHRISTOPHER MALLOY* ABSTRACT We study the impact of social networks on agents’ ability to gather superior information about firms. Exploiting novel data on the educational backgrounds of sell side analysts and senior corporate officers, we find that analysts outperform by up to 6.60% per year on their stock recommendations when they have an educational link to the company. Pre-Reg FD, this school-tie return premium is 9.36% per year, while post-Reg FD the return premium is nearly zero. In contrast, in an environment that did not change selective disclosure regulation (the UK), the school-tie premium is large and significant over the entire sample period. * Cohen is at the Harvard Business School and NBER; Frazzini is at the University of Chicago Graduate School of Business and NBER; Malloy is at the Harvard Business School. We would like to thank Joseph Chen, Josh Coval, Eugene Fama, Cam Harvey, Owen Lamont, an anonymous referee, an associate editor, and seminar participants at the Harvard Business School, Stanford University, Northwestern University, Ohio State University, University of Chicago, University of Maryland, University of Florida, London Business School, London School of Economics, SIFR, Bentley College, Barclays Global Investors, the Society of Quantitative Analysts, and the AFA Meetings in Chicago for helpful comments. We also thank Nick Kennedy, Stephen Wilson, Laura Dutson, Matthew Healey, Meng Ning, Courtney Stone, and Bennett Surajat for excellent research assistance. In addition, we are grateful to BoardEx and Linda Cechova for providing firm board data, and to Devin Shanthikumar and Alexander Ljungqvist for sharing data with us. We gratefully acknowledge funding from the National Science Foundation.
Transcript of Sell Side School Ties

Sell Side School Ties
LAUREN COHEN, ANDREA FRAZZINI, and CHRISTOPHER MALLOY*
ABSTRACT
We study the impact of social networks on agents’ ability to gather superior information
about firms. Exploiting novel data on the educational backgrounds of sell side analysts
and senior corporate officers, we find that analysts outperform by up to 6.60% per year
on their stock recommendations when they have an educational link to the company.
Pre-Reg FD, this school-tie return premium is 9.36% per year, while post-Reg FD the
return premium is nearly zero. In contrast, in an environment that did not change
selective disclosure regulation (the UK), the school-tie premium is large and significant
over the entire sample period.
* Cohen is at the Harvard Business School and NBER; Frazzini is at the University of Chicago Graduate School of Business and NBER; Malloy is at the Harvard Business School. We would like to thank Joseph Chen, Josh Coval, Eugene Fama, Cam Harvey, Owen Lamont, an anonymous referee, an associate editor, and seminar participants at the Harvard Business School, Stanford University, Northwestern University, Ohio State University, University of Chicago, University of Maryland, University of Florida, London Business School, London School of Economics, SIFR, Bentley College, Barclays Global Investors, the Society of Quantitative Analysts, and the AFA Meetings in Chicago for helpful comments. We also thank Nick Kennedy, Stephen Wilson, Laura Dutson, Matthew Healey, Meng Ning, Courtney Stone, and Bennett Surajat for excellent research assistance. In addition, we are grateful to BoardEx and Linda Cechova for providing firm board data, and to Devin Shanthikumar and Alexander Ljungqvist for sharing data with us. We gratefully acknowledge funding from the National Science Foundation.

Certain agents play key roles in revealing information into securities markets. In
the equities market, security analysts are among the most important. A large part
of an analyst’s job is to research, produce, and disclose reports forecasting aspects
of companies’ future prospects, and to translate their forecasts into stock
recommendations. Therefore, isolating how, or from whom, analysts obtain the
information they use to produce their recommendations is critical.
In this paper we investigate ties between sell-side analysts and management
of public firms, and the subsequent performance of analysts’ stock
recommendations. We exploit common past experiences, namely attendance at
identical educational institutions, to identify firms where analysts are more likely
to gain direct access to senior management. An advantageous aspect of our
network ties is that they are formed far before the information likely being
transferred across them, and that the underlying tie (e.g., alumni link) is not
directly related to the type of information likely being transmitted years later (e.g.,
company related information).
Our main goal is to test the hypothesis that analysts gain comparative
information advantages through their social networks; specifically, through
educational ties with senior officers and board members of firms that they cover.1
We test this hypothesis by building portfolios that replicate sell-side analysts’
recommendations and by comparing how analysts perform on firms to which they
have ties, relative to firms to which they do not. Our analysis focuses on the
universe of sell-side analysts and publicly traded domestic firms for which we are
able to collect data on the educational background of both the analyst and senior
officers of the firm she covers.
To better understand our approach, consider the following example. In 1992,
two sell-side analysts covered XYZ Corp.2 One analyst, Mr. Smith, shares a
connection with the firm, defined as having attended the same academic institution
as a member of the board of directors or a senior officer. Among the other stocks
he covers, Mr. Smith is also linked to CFM Corp., another large cap stock in the
same industry. The second analyst, Mr. Jones, shares no educational link to either
firm. As of December 1992, both analysts’ rating on the stock (and the IBES

consensus (median) rating) was a "HOLD."3
On February 10th, 1993, prior to market opening, Mr. Smith deviated from
the consensus and upgraded XYZ to a BUY rating. He held the BUY rating until
the stock delisted in December 1993. Mr. Jones maintained (and later reiterated) a
HOLD rating, reflecting the consensus recommendation. Mr. Jones eventually
dropped the stock from coverage, while the consensus recommendation remained a
HOLD until the delisting date.
Following Mr. Smith’s upgrade of XYZ (to which he shared a school tie),
two major events pushed up XYZ’s stock price. Immediately after the upgrade, on
February 11, 1993, XYZ reported higher fourth-quarter and full-year earnings,
beating the consensus expectation. Then, in October 1993, CFM Corp. announced
its intention to acquire XYZ. XYZ’s stock price rose 15.7% on the news. The
merger was completed in December 1993. Figure 1 illustrates this timeline of
events.
[Insert Figure 1 here]
Between February 10th, 1993 and December 1993, XYZ’s stock price rose
by 78.6%. An investor who purchased the stock after Mr. Smith’s bullish call
would have outperformed a characteristic-adjusted benchmark by 52.9% over an
11-month period.
More generally, XYZ and CFM are not the only securities where Mr. Smith
had an educational connection to management. Between 1993 and 2006, Mr. Smith
covered a variety of stocks. Looking at his recommendations over time reveals his
tendency of producing superior advice on stocks where he shares a school link to
the firm. Between 1993 and 2006 a calendar time portfolio replicating his BUY
recommendations (with a 1 day lag) in stocks to which he shares a link
outperformed a characteristic-adjusted benchmark portfolio by 1.17% per month;
the corresponding abnormal returns on his non-linked calls was only 0.01%.
The results in this example represent a much more systematic pattern
across the universe of sell-side equity analysts. Consistent with the hypothesis that

educational ties facilitate the transmission of private information, we find that
analysts produce significantly better recommendations on firms to which they have
an educational tie, relative to firms to which they do not.
Analysts’ buy recommendations on school-tied stocks outperform buy
recommendations on non-tied stocks by an average of 45 to 55 basis points per
month, using 12-month calendar time portfolios following the recommendations.
Therefore, a calendar time portfolio strategy exploiting only this school-tie
informational advantage on buys, translates into average outperformance of 5.40%
to 6.60% per year. This return differential is largely unaffected after controlling for
other determinants of returns such as size, book-to-market, and momentum.
Importantly, our results are not simply an artifact of a selected sample of "smart"
or skilled analysts: the school tie premium is large even after removing analysts
from the most connected schools and the highest quality schools (e.g., Ivy League)
from our sample, and even after including analyst fixed effects in our regressions.
We do not find a similar return differential on analysts’ sell
recommendations. Analysts’ school-tied sells perform roughly the same as their
non-tied sell recommendation stocks following the recommendations. One
explanation consistent with this finding is that managers are willing to reveal
positive (but not negative) information about their firms. Alternatively, this would
be consistent with analysts obtaining both good and bad news from their school-
tied firms, but perhaps as part of a tacit agreement, acting only on the positive
news.
There could be a number of mechanisms that allow information to be
transferred along the networks. It may be that alumni networks allow analysts
cheaper access to firm-level material information, which then allows them to form
superior recommendations. For example, the analyst may have access to explicitly
private conference calls with firm officials, or the network may simply reduce the
cost to the analyst of obtaining or analyzing information about the firm (e.g., the
analyst can obtain information about upcoming earnings with fewer calls to the
firm). Alternatively, the education network may simply allow analysts to better
assess managerial quality. Under this mechanism, there is not a constant flow of

information in the network from the firm to the analyst, but instead some inherent
information within the network about managerial quality (ex. all members of the
Dartmouth network know that the Dartmouth CEO of firm ABC is quite good,
while the Dartmouth CEO of XYZ is not).
In order to distinguish between these two alternatives, we exploit a
regulation introduced during our sample period explicitly aimed at blocking the
former mechanism of selective information transfer: Regulation FD, instated by the
SEC in October of 2000. The regulation quite openly gave as its aim the ending of
selective disclosure by firms to a subset of market participants. For instance, in the
SEC release regarding Regulation FD, the aim was given to stop the occurrence
that: "a privileged few gain an informational edge -- and the ability to use that
edge to profit -- from their superior access to corporate insiders, rather than from
their skill, acumen, or diligence." The SEC went on to caution that it was these
selective disclosure relationships that allowed agents to: "exploit `unerodable
informational advantages´ derived not from hard work or insights, but from their
access to corporate insiders."4 Our educational social networks may represent
exactly this type of `unerodable informational advantage´ that the SEC targeted
with Regulation FD. Specifically, if the channel that allows analysts to produce
superior recommendations on school-tied stocks is selective disclosure, we may
expect this superior ability to be attenuated post-Regulation FD. However, if the
education network simply measures analysts’ increased ability to assess managerial
quality for CEOs they attended school with, it is not clear this would be affected
at all by Regulation FD.
We test this hypothesis by splitting our sample to observe analysts’ ability
on school-tied stocks pre- and post-Regulation FD. All of our evidence points to
selective disclosure being the main mechanism of information transfer along the
network. All of our effects are positive, large, and significant pre-Regulation FD,
and small and insignificant post-Regulation FD. Specifically, when we run panel
regressions of returns on buy recommendations on a school tie dummy variable, a
post-Reg FD dummy variable, an interaction term (linked*post-Reg FD), and a
host of firm, brokerage, and analyst-level control variables, we find that the
coefficient on the interaction term is strongly negative, while the combined effect
(interaction term + linked) is small (9bp) and insignificant (F-statistic of 1.18),
indicating that the school-tie premium is largely absent in the post-Reg FD period.
Similarly, the monthly returns of a long-short calendar time portfolio on the
differences between school-tied and non-school-tied stocks pre-Regulation FD
ranges between 68 to 78 basis points per month, or 8.16% (t=4.35) to 9.36%
(t=3.50) per year. Post-Regulation FD, this difference is only 14 to 26 basis points
per month, and is statistically indistinguishable from zero.
We construct an out-of-sample test of the impact of Reg FD by replicating
our results in the United Kingdom, where there was no such law enacted at this
time.5 Over the entire sample period, we again find a large school-tie return
premium on buy recommendations for UK-listed stocks: a long-short portfolio that
purchases linked buy recommendations and shorts non-linked buy
recommendations earns 187 basis points per month (t=2.79) in raw returns, and
167 basis points per month (t=2.20) in abnormal returns. However, unlike in the
US, we see no significant difference in this premium between the pre- and post-Reg
FD time periods.
We also show that the number of school ties an analyst possesses with her
covered stocks strongly increases the likelihood of becoming an "All-Star" analyst
(a one standard deviation increase in connections increases the probability by
nearly 50%, from 9.2% to 13.6%), but only in the pre-Reg FD period; this result
further highlights the value of social networks in precisely those times when
selective disclosure is least inhibited.
Lastly we perform a number of robustness checks. We also find that the
school-tie outperformance is present in both large and small cap stocks, and for
stocks with both high and low analyst coverage. In addition, the effect is robust
when splitting our school-link universe across different dimensions: Ivy League and
non-Ivy League, Top 40 (as defined by US News ranking) and non-Top 40, most
linked and non-most linked schools, and controlling for school-level returns at the
stock level. Finally, we show that other measures of social networks (namely same

school conference) also form important information networks for analysts.
The remainder of the paper is organized as follows. Section I of the paper
provides a brief background and literature review, while Section II describes the
data on both firms and analysts. Section III provides the main results on analyst
ability and sell-side school ties. Section IV explores the mechanism for information
transfer across the network, while Section V concludes.
I. The setting
The opinions of sell-side equity analysts are among the most widely
solicited, anticipated, and dissected news items in the stock market each day.
Further, since analyst data is available in large quantities and in relatively
standardized formats, the sell-side analyst industry offers an ideal testing ground
for a number of theories of economic behavior. In this paper we use this testing
ground to investigate the idea that agents’ educational ties facilitate the
transmission of private information into security markets.
A large literature on analyst performance supports the idea that analysts
bring valuable information to the market, and have incentives to do so. Numerous
studies document the potential profitability of trading on analyst recommendations
(see, for example, Womack (1996), Barber et al. (2001, 2003), Jegadeesh et al.
(2004)) and earnings forecast revisions (see Stickel (1991) and Gleason and Lee
(2003), among others).6 Of course, sell-side analysts have an incentive to produce
unbiased forecasts and recommendations for investors only if they are compensated
for such behavior. Due to a lack of data on direct compensation, the literature
generally tests this idea by linking analyst behavior to measures of implicit
incentives or career concerns. Stickel (1992) finds that highly rated “All-American”
analysts (who are typically better compensated than other analysts) are more
accurate earnings forecasters than other analysts, suggesting that accuracy is
rewarded. Similarly, Mikhail, Walther, and Willis (1999) document that poor
relative performance leads to job turnover.
An important strand of the literature, however, suggests that analysts’
career concerns and the conflicts of interest inherent in equity research create an
agency problem, potentially at the expense of investors who trust analyst research
to be unbiased. Hong, Kubik, and Solomon (2000), find that younger analysts
deviate less from the consensus than their older counterparts, consistent with the
predictions of reputation-based herding models.7 Hong and Kubik (2003) report
that controlling for accuracy, analysts who are optimistic relative to the consensus
are more likely to experience favorable job separations. They also find that
analysts are judged less on accuracy than optimism when it comes to stocks
underwritten by their employers, supporting allegations that analysts suffer from a
conflict of interest when covering stocks affiliated with their brokerage houses.8
Since we can control for investment banking affiliations, we can distinguish
information effects from these agency effects throughout the paper.
Our paper is unique in that we try to isolate a channel through which
analysts acquire valuable information. As such, our work is related to the recent
passage of Regulation FD. Effective October 23, 2000, companies must reveal any
material information to all investors and analysts simultaneously in the case of
intentional disclosures, or within 24 hours in the case of unintentional disclosures.
According to SEC Proposed Rule S7-31-99, regulators believe that allowing
selective disclosure is "not in the best interests of investors or the securities
markets generally." Several recent papers examining the impact of Regulation FD
on the behavior of equity analysts conclude that the law has in fact been effective
in curtailing selective disclosure to analysts (see, for example, Mohanram and
Sunder (2006), Agrawal, Chadha, and Chen (2006), and Gintschel and Markov
(2004)). Since our tests explore a specific possible channel of selective disclosure,
they are relevant to this debate.9
Exploring the role of social networks, connections, and influence in financial
markets is a relatively new development in the finance literature.10 Related to our
work are the findings in Hong, Kubik, and Stein (2005), who document word-of-
mouth effects between same-city mutual fund managers with respect to their
portfolio choices, and Kuhnen (2008), who documents a link between past business
connections between mutual fund directors and advisory firms and future
preferential contracting decisions.11 Also related are the findings in Massa and

Simonov (2005), documenting a relation between the portfolio choices of individual
investors and their past educational backgrounds.12
Our empirical identification is similar to Cohen, Frazzini, and Malloy
(2008), who exploit educational connections between mutual fund managers and
corporate board members to identify information transfer through social networks.
Hwang and Kim (2008) and Butler and Gurun (2008) also use corporate board
data to identify social networks, but focus on the impact of social connections on
executive compensation. The use of corporate board linkages as a measure of
personal networks is common in the network sociology literature (see, for example,
Mizruchi (1982, 1992), Useem (1984)). Board linkages are typically isolated by
looking at direct board interlocks between firms (as in Hallock (1997), "back-door"
links among directors across firms (as in Larcker et al. (2005) and Conyon and
Muldoon (2006)), or direct and indirect links between board members and
government agencies or officials (as in Faccio (2006) and Fisman et al. (2006),
among others), and have shown to be important mechanisms for the sharing of
information and the adoption of common practices across firms.13 Our approach is
different in that we focus on direct links between board members and equity
analysts via shared educational backgrounds.
II. Data
The data in this study is collected from several sources. We search public
filings and other miscellaneous information available over the World Wide Web to
construct a novel database of educational backgrounds of sell-side analysts issuing
recommendations on US domestic stocks.
We start by identifying all sell-side analysts on the I/B/E/S tape who
provide at least one recommendation on a domestic stock between 1993 and 2006.
For each analyst, I/B/E/S provides a numeric identifier, the analyst’s last name,
the initial of his/her first name, and a code corresponding the analyst’s brokerage
firm. We use the broker translation file to reconstruct the name of the brokerage
house.14 Since our data construction methodology involves name searches, we delete
observations with multiple names for a given numeric identifier or multiple

identifiers for a given name. Finally, we discard teams, since I/B/E/S provides
only the team members’ last names but not their first name. This leads to an
initial list of 8,620 analysts issuing recommendations between 1993 and 2006.
We hand-collect analysts’ educational backgrounds from a variety of
sources. Our main data source is Zoominfo.com, a search engine that specializes in
collecting and indexing biographical and employment data from publicly available
documents over the Web. From this site, we obtain each analyst’s full name, job
title, present and past employment history and the stocks covered in order to
correctly identify an analyst in our initial set. We supplement the initial search
with the BrokerCheck search engine available on the Financial Industry Regulatory
Authority website, which contains background information on current and former
FINRA-registered security investment professionals. Finally, if we are unable to
determine the analyst’s educational background using our primary sources, we use
other available sources over the Web on a case-by-case basis to collect additional
information. In building our final sample we use a conservative approach and
discard observations where we are unable to uniquely associate an analyst with a
specific educational background. This occurs either due to disagreement between
multiple sources, or because we are unable to correctly identify the analyst.15 For
each analyst we collect the name of the academic institution attended for either an
undergraduate or a graduate degree.16
Biographical information for senior company officers and board members is
provided by Boardex of Management Diagnostics Limited. The data contain
relational links among board of directors and other corporate officials. Links in the
dataset are constructed by cross-referencing employment history, educational
background and professional qualifications. For each firm, we use the link file to
reconstruct the annual time series of identities and educational background of
senior officers (defined as CEO, CFO or Chairman) and board members. The final
data contain current and past roles of company officials with start-year and end-
year, a board dummy and the academic institution for undergraduate and graduate
degree (where available). We hand match institutions from our analyst data and
Boardex and create a unique numeric identifier.17

We hand collect data on a number of educational institution characteristics.
We collect the rankings from US News and World Report between 1995-2006 and
match it back to our sample. US News and World annually ranks the Top 100
universities in the United States. We also collect data on the location of and
conference of all universities in our sample from the universities’ websites.
Finally, we match the firms associated with all company officials and sell-
side analysts to accounting and stock return data from CRSP/COMPUSTAT. Our
final sample includes educational background data on 1,820 analysts issuing a total
of 56,994 recommendations over 5,132 CRSP stocks between October 30th, 1993
and December 20th, 2006.
Table I reports summary statistics for the matched samples of firms-boards-
analysts. From Panel A, we average 604 analysts and 5,746 recommendations per
year, which comprise 23% of the universe of sell-side analysts and 23% of the total
number of recommendations per year.18 Our sample of firms averages 1,705 per
year, which comprise 74% of total market value of CRSP stocks covered by sell-
side analysts.
[Insert Table I here]
In Panel B we report summary statistics by firm-year. The mean coverage
per firm is around 5 analysts. The average size percentile is 0.78 while the average
book-to-market percentile in 0.37, reflecting the known fact that analyst coverage
tends to be skewed towards larger cap growth stocks.
Table II reports summary statistics on our sample of school ties, broken
down by academic institution. Panel A reports the average number of analyst ties
to senior corporate officials, while Panel B reports the average number of analyst
ties to firm boards of directors. Harvard University accounts for 18.53% of analyst
ties to senior officials in our sample, and 18.2% of analyst ties to corporate boards;
Ivy League schools in general account for 43.7% of analyst ties to senior officials,
and 48.5% of analyst ties to corporate boards.19

[Insert Table II here]
Additional summary statistics on the percentage of linked stocks, the
number of linked stocks, and the number of stocks covered for different categories
of analysts is reported in Table A1 in the Internet Appendix.20
III. Results: Returns to sell-side recommendations
In this section we examine the stock return performance of recommendations
by sell-side analysts on securities to which they have school ties. We test the
hypothesis that recommendations issued on stocks with school ties outperform
recommendations issued on stocks without ties.
To assess the relative performance of sell-side recommendations we use a
standard calendar time portfolio approach.21 We classify a firm as having
educational ties to an analyst if that analyst attended the same academic
institution as a senior officer (or, in alternate specifications, if he/she attended the
same school as a senior officer or a member of the board). We use the I/B/E/S
numeric recommendation code to assign each recommendation to one of two
portfolios: (1) a BUY portfolio consisting of all stocks upgraded relative to the
previous recommendation, or initiated, resumed or reiterated coverage with a buy
or strong buy rating, and (2) a SELL portfolio, consisting of all stocks downgraded
relative to the previous recommendation, initiated, resumed or reiterated coverage
with a hold, sell or strong sell rating, or dropped from coverage by the analyst. We
also consider a version of both portfolios using only upgrades or downgrades. If the
brokerage house does not report a stock as dropped from coverage and a
recommendation is not revised or reiterated within twelve months, we let it expire.
Our portfolios are constructed as follows. For the BUY portfolio, we begin by
identifying each BUY recommendation as described above. For each buy
recommendation, we skip a trading day between the recommendation date t and
investment, and purchase the recommended stock at the close of day t+1. By
waiting a trading day we exclude the recommendation-date returns and ensure
that the portfolios are based on available information. Each recommended stock

remains in the portfolio until it is either downgraded, dropped from coverage, or
the underlying recommendation expires. Again, we skip a day between an event
that causes a stock to be unloaded and the actual disinvestment: e.g. if a stock is
downgraded at date t, we unwind the position at the close of date t+1. If more
than one analyst recommends a particular stock on a given date, then the stock
will appear multiple times in the portfolio, once for each recommendation.
Finally, we compute value weighted calendar time portfolios by averaging
across analysts, weighting individual recommendations by the analyst’s
recommendation code. For the BUY portfolio, we reverse-score the
recommendation codes so that a Strong Buy is set equal to 5 (instead of 1, as it is
in the raw data) and a Strong Sell is set equal to 1, so that a higher weight
indicates a relatively more bullish recommendation. We use the same method for
the SELL portfolio, with the exception that in the final step we use the actual
recommendation codes as portfolio weights; i.e., a Strong Buy is set equal to 1 and
a Strong Sell is set equal to 5, so that a higher weight indicates a relatively more
bearish recommendation.
This approach yields a time series of returns for each portfolio and has the
advantage of corresponding to a simple investment strategy of following sell-side
recommendations, mimicking both the directional advice and the holding period
implied by the timing of the revisions.
For each stock, we compute risk-adjusted ("DGTW") returns as in Daniel et
al. (1997) by subtracting the return on a value weighted portfolio of all CRSP
firms in the same size, (industry-adjusted) market-to-book ratio, and one year
momentum quintile, from the stock’s raw return. We update the 125 characteristic
portfolios at the end of June of each year using conditional sorts, and adjust the
market-to-book ratios using the 48-industry classifications from Ken French’s
website.22
Table III presents calendar time portfolio returns for our sample of BUY
recommendations, and illustrates one of our main results. BUY recommendations
with school ties earn 1.59% per month in raw returns, while BUY
recommendations without school ties earn 1.04%. A long/short portfolio which

purchases stocks after BUY recommendations by school-tied analysts and shorts
stocks after BUY recommendations by non-school-tied analysts earns 55 basis
points per month (t=3.75), which translates into an annual premium of 6.60%.
This long/short portfolio has the advantage that it conditions on the signal of the
recommendation (BUY in both cases), and so isolates solely the school-tie premium
portion of the analysts’ recommendations. If we extend the sample to examine ties
between analysts to either senior management or the board of directors, the return
on this long-short portfolio is slightly smaller at 45 basis points per month, or
5.40% percent per year (t=3.87). The risk-adjusted abnormal returns are given in
the third and fourth columns of Table IV. The buy recommendations on stocks
without school ties earn basically a zero abnormal return. In contrast, the buy
recommendations on stocks where the analyst has school ties precede large
abnormal returns; thus the school-tie premium is largely unaffected by other return
determinants (47 basis points, (t=3.96)). In later tests we also show that this
school tie premium is not driven by analysts from the most connected schools or
from a certain group of schools (e.g., Ivy League).
[Insert Table III here]
The last two columns of Panel A report portfolio returns for the subset of
upgrades only (i.e., upgrades to buy or strong buy only, excluding initiations and
reiterations). The long-short portfolio of tied minus untied upgrades again earns
large returns, ranging from 29 to 35 basis points per month over the full sample
period.
Panel B of Table III presents results for the sample of SELL
recommendations. Column 2 of Panel B indicates that we are unable to reject the
hypothesis of no difference between the raw returns of sell recommendations by
analysts with school ties and those without. The next two columns extend these
findings to DGTW-adjusted returns. For the sample of analysts with links to either
senior management or the board of directors, the returns on sell recommendations

by analysts with school ties are actually significantly higher than those by analysts
without ties. However, when we explore this result more carefully in a regression
context below in order to control for other determinants of returns, we find that
there is no difference between the abnormal returns following linked and non-linked
sell recommendations.
Overall, our calendar time portfolio tests on the buy recommendations of
linked analysts reveal an economically and statistically significant channel through
which analysts produced superior recommendations. Our results on sell
recommendations suggest that either this information advantage does not extend
to negative information, or that incentives not to reveal such negative information
are strong.
To ensure that our results are not driven by something specific about linked
analysts or firms, we also employ panel regressions of the returns to buy/sell
recommendations on two school tie dummy variables (one indicating a link to
senior management, and the other indicating a link to senior management or a
member of the board), and a host of firm, broker, and analyst-level control
variables. The dependent variable is daily returns (Ret), and control variables
include: a dummy equal to one if the analyst attended a school in the Top 10 in
terms of number of links to firms; a dummy equal to one if the analyst attended an
Ivy League university; a dummy equal to one if the analyst attended a university
ranked in the Top 40 by US News and World Report; lagged marked capitalization
of the stock (Size); book-to-market (BM); past one-year momentum (Past
Returns); a measure of analyst experience, equal to the number of years an analyst
has been making recommendations on I/B/E/S; an affiliation dummy, equal to one
if the analyst is employed by a bank that has an under-writing relationship with
the covered firm23; an All-Star dummy variable, equal to one if the analyst is listed
as an "All-Star" in the October issue of Institutional Investor magazine in that
year24; a measure of brokerage size, equal to the total number of analysts that work
for a given analyst’s brokerage house; and fixed effects for recommendation month,
industry, and analyst where indicated. Regressions are run daily, but the
coefficients reported in Table IV are converted to represent monthly returns (in

percent); all standard errors are adjusted for clustering at the recommendation
month level.
[Insert Table IV here]
Table IV reports the regression results for BUY recommendations. Columns
1-2 show that the coefficients on the school tie dummies are positive, significant,
and of the same order of magnitude as the return results from the portfolios
(between 37-48 basis points per month), again indicating that buy
recommendations by analysts with school ties earn significantly higher returns than
those by analysts without such ties. Columns 3-5 report similar results even after
controlling for whether or not the analyst attended a highly connected school (Top
10 Most Linked), or two measures of high "quality" schools (Ivy League and Top
40 US News). Columns 3-5 also show that the school tie premium is nearly
unchanged after including industry fixed effects, and firm- and analyst-level
controls. Columns 6 and 7 then show that the school tie premium remains large
and significant even when including the stricter analyst fixed effects. Since
including analyst fixed effects explicitly isolates variation within an analyst’s
portfolio (i.e., performance on tied versus non-tied stocks for the same analyst),
this result indicates that our main school tie affect is unlikely to be an artifact of a
selected sample of "smart" of skilled analysts.25
Table V presents the analogous regression results for the sample of SELL
recommendations. In every column, the impact of school ties is small and
insignificant. In the strictest specification in column 7, which includes analyst and
month fixed effects and the full set of controls, the coefficient on the school tie
dummy is negative, but small and insignificant. In the analogous specification for
downgrades (unreported), we also find a negative coefficient on the school tie
dummy, but again this coefficient is modest (-0.16) and insignificant (t=1.05).26
[Insert Table V here]

IV. Mechanism
Our results on the outperformance of buy recommendations by analysts
with school ties suggest a statistically and economically important channel for the
transfer of private information. In this section we explore possible hypotheses
regarding the manner in which this information might be conveyed, the impact of
school ties on analyst status, and the types of information being transferred across
these networks.
A. Regulation on Selective Disclosure to Analysts
As noted above, our main test to distinguish between direct information
transfer as the driver of our findings versus superior assessments of managerial
quality is to split the sample pre- and post-Reg FD. The pre-Reg FD period was
allegedly a time period plagued with problems of selective disclosure between firms
and equity analysts, and the law put in place was expressly designed to curb these
practices. The motivation expressed by the SEC in their release27 on Regulation
FD suggests that the school ties we identify in our tests are exactly the sort of
private information channel between firms and analysts that the regulation was
designed to address. The fact that our results are significantly weaker in the post-
Reg FD period suggests that the regulation was effective in curbing the apparent
information advantage that analysts gain through their school networks.
To test this idea formally, we employ panel regressions on buy
recommendations as in Table IV, except that we now also include a Post-Reg FD
dummy variable, and an interaction term (Link Mgmt*Post-Reg FD), in addition
to the school tie dummy variable and control variables mentioned earlier. Column
2 of Table VI presents the key test of the impact of Reg FD on the school-tie
return premium. The coefficient on Link Mgmt measures the impact of school ties
pre-Reg FD, and its magnitude of 0.72 (t=3.61) implies an annual return premium
of 8.64% per year. The interaction term (Link Mgmt*Post-Reg FD) is designed to
capture the effect of school ties in the post-Reg FD time period.28 We find that the
coefficient on the interaction term is strongly negative and significant, while the

combined effect (i.e., [Link Mgmt*Post-Reg]+[Linked to Mgmt]) is small (9bp=-
63bp+72bp) and insignificant (F-statistic of 0.46, p>0.50), indicating that the
school-tie premium is largely absent in the post-Reg FD period. Column 3 reports
results from the same test, but only for the subset of analysts that are in the
sample both pre- and post-Reg FD. This is to control for a possibility that
connected analysts may for some reason leave the sample post-Reg FD. From
Column 3, the results are virtually identical on this sample of analysts.29
[Insert Table VI here]
We also report calendar time portfolio results for the pre- and post-Reg FD
time periods in Panel A of Table VII. Panel A indicates that the large returns to
school ties for buy recommendations are concentrated in the pre-Reg FD period.
Specifically, the school tie premium in the pre-Reg FD period ranges between 68 to
78 basis points per month, or 8.16% (t=4.35) to 9.36% (t=3.50) per year.30 Post-
Regulation FD, this difference is only 14 to 26 basis points per month, and is
statistically indistinguishable from zero. Panel A also reports results for sell
recommendations, splitting the sample in the same way; not surprisingly given our
earlier results on sells, we find no significant differences between the two periods
for sell recommendations.
We also construct an out-of-sample test of the impact of Reg FD by
replicating our results in the United Kingdom, where there was no such regulation
enacted at this time. Again we form buy-sell portfolios of linked and non-linked
recommendations, but we now restrict our analysis to UK-listed stocks for which
we have analyst recommendations on I/B/E/S and available educational
background information on both the analyst and the senior officers of the firm.31
Panel B of Table VII shows that over the entire sample period, we again find a
large school-tie return premium on buy recommendations for UK-listed stocks: a
long-short portfolio that purchases linked buy recommendations and shorts non-
linked buy recommendations earns 187 basis points per month (t=2.79) in raw
returns, and 167 basis points per month (t=2.20) in abnormal returns. Again we

find no significant school-tie premium on sell recommendations. However, unlike
in the US, we see no significant difference in the school-tie premium on buy
recommendations between the pre- and post-Reg FD time periods.32 The point
estimates of the school-tie premium are actually slightly higher (although not
significantly) in the post-Reg FD time period. This gives confirming evidence that
the Reg FD effect we find in the main (US) sample is in fact driven completely by
this new regulation against selective disclosure. In the absence of regulatory
change, school ties continue to confer significant benefits to analysts.
[Insert Table VII here]
In summary, all of our findings indicate that Regulation FD had a large
impact on the school-tie premium that we identify in this paper, suggesting that
the most likely mechanism driving the superior performance of analysts on their
school-tied recommendations is direct information transfer.33
Our results on the impact of Regulation FD are also consistent with several
recent papers that examine the impact of the law on the behavior of equity
analysts and conclude that the law has in fact been effective in curtailing selective
disclosure to analysts (see, for example, Mohanram and Sunder (2006), Agrawal,
Chadha, and Chen (2006), and Gintschel and Markov (2004)). For example,
Mohanram and Sunder (2004) find that analysts who may have had preferential
links with firms they covered, such as analysts from large brokerage houses, tended
to have greater forecast accuracy pre-Reg FD, but were unable to maintain their
forecasting superiority post-Reg FD. Coupled with our findings, these results
suggest that Regulation FD has been successful in leveling the information playing
field for sell-side research, and likely signals a shift towards greater independence
from senior management on the part of financial analysts.
B. Strength of School Ties, All-Star Value, and Robustness Checks
In this section we explore some additional implications of our results. First,
if school ties are driving the results we find, then stronger ties should result in an

increased strength of school tie premium for these analysts. Columns 4 and 5 in
Table VI test this using a variable (Frac Link to Analyst) equal to the percentage
of top firm management (board members + senior management) to whom the
analyst has a link. From Table VI, this proxy for the strength of the school tie link
is positively and significantly related to the school tie premium. This holds even
after controlling for the effect of having school ties in general (Column 5). The
coefficient in Column 5 implies that a one standard deviation increase in the
strength of school ties to management increases the school tie premium by nearly
1% per year.
In addition to this link-strength measure, we also create a new measure of
social ties. If social networks are an important source of information advantage for
analysts, then other types of social networks may provide the same advantage. We
attempt to show one alternative measure in Table VI. The measure we use is
common athletic conference (for example, Big 10). Attending the same athletic
conference could be an impetus for information sharing (or could reduce the cost of
information gathering) in much the same way as school alumni relationships. We
thus create a new categorical variable Linked by Conf, equal to one if the analyst
attended a school that competes in the same athletic conference as a senior
manager’s, and zero otherwise. From Columns 6 and 7, in addition to having an
alumni connection, attending schools in the same athletic conference does afford
the analyst a significant advantage in collecting information on the firm.34
Specifically, from Column 7, including all controls, the analyst’s recommendations
on these conference-linked stocks outperform by 15 bp per month (t=1.98), nearly
half the magnitude of the alumni result, but still significant.35
Another way to quantify the value of the social networks we isolate in this
paper is to test the extent to which school ties predict the probability of that
analyst becoming an All-Star. We run OLS and probit regressions forecasting All-
Star status and find that the number of school ties is a strong positive predictor of
the likelihood of being an All-Star. A one standard deviation increase in number of
connections increases the probability of being an All-Star by nearly 50% (from
9.2% to 13.6%). These results are reported in Table A4 in the Internet Appendix.

In order to better understand the type of information being transferred
across the networks, we also examine the relative forecast accuracy of analysts with
school ties, under the hypothesis that the information advantage gained by linked
analysts is specifically related to information that would allow an analyst to better
predict earnings per share numbers reported by firms. We find no significant
differences in relative forecast accuracy (or relative forecast optimism) between the
forecasts of analysts with school ties and those without.36 These results suggest
that the school-tie return premium we document in Section III is unlikely to relate
to information obtained about future earnings per share numbers. In unreported
tests we also look at the propensity of buys among school tied and non tied firms
that later announce a merger, as well as merger-related-news return
decompositions, and find little difference, suggesting that the passing of merger-
related information is unlikely to fully explain our findings.
We also run a number of robustness checks on our results. These include
splitting our sample by a series of stock-, analyst- and school-characteristics. We
report these results in Tables A5 and A6 in the Internet Appendix.
V. Conclusion
In this paper we investigate information dissemination in security markets.
We use the recommendations of sell-side equity analysts as a laboratory to study
the impact of social networks on agents’ ability to gather superior information
about firms. In particular, we test the hypothesis that analysts’ school ties to
senior corporate officers impart comparative information advantages in the
production of analyst research. Our main result is that equity analysts outperform
on their stock recommendations when they have an educational link to that
company. A simple portfolio strategy of going long the buy recommendations of
analysts with school ties and going short the buy recommendations of analysts
without ties earns returns of 6.60% per year in the full sample.
This result suggests that analysts’ social networks facilitate the direct
transfer of information, or alternatively that these networks simply allow analysts
to better assess managerial quality. In order to distinguish between these two

hypotheses, we exploit a regulation introduced during our sample period explicitly
aimed at blocking the former mechanism of selective information transfer:
Regulation FD, instated by the SEC in October of 2000. We find a large effect of
the law: pre-Reg FD the return premium from school ties is 9.36% per year, while
post-Reg FD the return premium is nearly zero and insignificant. A similar test in
the UK, which did not experience a change in the disclosure environment at this
time, reveals a large and significant school-tie premium for buy recommendations
over the entire sample period, both pre- and post-2000.
Taken together, our findings suggest that agents in financial markets can
gain informational advantages through their social networks. In addition, laws
designed to block these types of information pathways can be effective in curbing
selective disclosure. The magnitude of our results indicates that informal
information networks are an important, yet under-emphasized channel through
which private information gets revealed into prices. Identifying the types of
information transferred across social networks and the extent to which social
networks are important in other information environments can provide us with a
richer understanding of information flow, and price evolution, in security markets.

References
Agrawal, Anup, Sahiba Chadha and Mark A. Chen, 2006, Who is afraid of Reg FD? The behavior and performance of sell-side analysts following the SEC’s Fair Disclosure Rules, Journal of Business 79, 2811-2834.
Barber, Brad, Reuven Lehavy, and Brett Trueman, 2005, Comparing the stock
recommendation performance of investment banks and independent research firms, Journal of Financial Economics 85, 490-517.
Barber, Brad, Reuven Lehavy, Maureen McNichols, and Brett Trueman, 2001, Can investors profit from the prophets? Security analyst recommendations and stock returns, Journal of Finance 56, 531-564.
Barber, Brad, Reuven Lehavy, Maureen McNichols, and Brett Trueman, 2003, Reassessing the returns to analysts’ stock recommendations, Financial Analysts Journal 59, 88-96.
Barber, Brad, Reuven Lehavy, Maureen McNichols, and Brett Trueman, 2005, Buys, holds, and sells: The distribution of investment banks’ stock ratings and the implications for the profitability of analysts’ recommendations, Journal of Accounting and Economics 41, 87-117.
Butler, Alexander W., and Umit G. Gurun, 2008, Connected companies’ compensation, Working paper, University of Texas at Dallas.
Chevalier, Judith, and Glenn Ellison, 1999, Career concerns of mutual fund managers, Quarterly Journal of Economics 114, 389-432.
Cohen, Lauren, Andrea Frazzini, and Christopher J. Malloy, 2008, The small world of investing: Board connections and mutual fund returns, Journal of Political Economy 116, 951-979.
Conyon, Martin J., and Mark R. Muldoon, 2006, The small world of corporate boards, Journal of Business Finance and Accounting 33, 1321-1343.
Davis, Gerald F., 1991, Agents without principles? The spread of the poison pill through the inter-corporate network, Administrative Science Quarterly 36, 583-613.
Faccio, Mara, 2006, Politically connected firms, American Economic Review 96, 369-386.
Fisman, David, Ray Fisman, Julia Galef, and Rakesh Khurana, 2006, Estimating the value of connections to Vice-President Cheney, Working paper, Columbia University.
Gintschel, Andreas and Stanimir Markov, 2004, The effectiveness of Regulation

FD, Journal of Accounting and Economics 37, 293-314.
Gleason, Cristi A., and Charles M. C. Lee, 2003, Analyst forecast revisions and market price discovery, The Accounting Review 78, 193-225.
Greene, William, 2003, Fixed effects and bias due to the incidental parameters problem in the tobit model, Working paper, New York University.
Groysberg, Boris, Paul Healy, Craig Chapman, Devin Shanthikumar, and Yang Gui (2007), Do buy-side analysts out-perform the sell-side?, Working paper, Harvard University.
Groysberg, Boris, Paul Healy, and David Maber (2008), What drives (and does not drive) financial analyst compensation?, Working paper, Harvard University.
Hallock, K. F., 1997, Reciprocally interlocking board of directors and executive compensation, Journal of Financial and Quantitative Analysis 32, 331-344.
Haunschild, Pamela R., 1993, Interorganizational imitation: The impact of interlocks on corporate acquisition activity, Administrative Science Quarterly 38, 564-592.
Hochberg, Yael, Alexander Ljungqvist, and Yang Lu, 2007, Whom you know matters: Venture capital networks and investment performance, Journal of Finance 62, 251-301
Holmström, Bengt, 1999, Managerial incentive problems: A dynamic perspective, Review of Economic Studies 66, 169-182.
Hong, Harrison, and Jeffrey D. Kubik, 2003, Analyzing the analysts: Career concerns and biased forecasts, Journal of Finance 58, 313-351.
Hong, Harrison, Jeffrey D. Kubik, and Amit Solomon, 2000, Security analysts’ career concerns and herding of earnings forecasts, RAND Journal of Economics 31, 121-144.
Hong, Harrison, Jeffrey D. Kubik, and Jeremy C. Stein, 2004, Social interaction and stock market participation, Journal of Finance 59, 137-163.
Hong, Harrison, Jeffrey D. Kubik, and Jeremy C. Stein, 2005, Thy neighbor’s portfolio: Word-of-mouth effects in the holdings and trades of money managers, Journal of Finance 60, 2801-2824.
Hwang, Byoung-Hyoun and Seoyoung Kim, 2008, It pays to have friends, Journal of Financial Economics forthcoming.
Jackson, Matthew O., 2005, The economics of social networks, in Richard Blundell, Whitney Newey, and Torsten Persson, (eds.) Proceedings of the 9th World

Congress of the Econometric Society, Oxford University Press.
Jegadeesh, Narasimhan, Joonghyuk Kim, Susan D. Krische, and Charles M. C. Lee, 2004, Analyzing the analysts: When do recommendations add value?, Journal of Finance 59, 1083-1124.
Khurana, Rakesh, 2002, Searching for a corporate savior: The irrational quest for charismatic CEOs, Princeton University Press.
Kuhnen, Camelia M., 2008, Business networks, corporate governance and contracting in the mutual fund industry, Journal of Finance forthcoming.
Lamont, Owen, 2002, Macroeconomic forecasts and microeconomic forecasters, Journal of Economic Behavior and Organization 48, 265-280.
Larcker, David F., Scott A. Richardson, Andrew J. Seary, and Irem Tuna, 2005, Back door links between directors and executive compensation, Working paper, University of Pennsylvania.
Lin, Hsiou-wei and Maureen F. McNichols, 1998, Underwriting relationships, analysts’ earnings forecasts and investment recommendations, Journal of Accounting and Economics 25, 101-127.
Lin, Hsiou-wei, Maureen F. McNichols, and Patricia O’Brien, 2005, Analyst impartiality and investment banking relationships, Journal of Accounting Research 43, 623-650.
Ljungqvist, Alexander, F. Marston and W.J. Wilhelm, 2006, Competing for Securities Underwriting Mandates: Banking Relationships and Analyst Recommendations, Journal of Finance 61, 301-340.
Ljungqvist, Alexander, F. Marston and W.J. Wilhelm, 2007, Scaling the Hierarchy: How and Why Investment Banks Compete for Syndicate Co-Management Appointments, Review of Financial Studies forthcoming.
Malloy, Christopher J., 2005, The geography of equity analysis, Journal of Finance 60, 719-755.
Malloy, Christopher J., Felicia Marston, and Alexander Ljungqvist, 2008, Rewriting history, Journal of Finance forthcoming.
Massa, Massimo, and Simonov, 2005, History versus geography, working paper, Stockholm School of Economics.
Michaely, Roni, and Kent L. Womack, 1999, Conflict of interest and the credibility of underwriter analyst recommendations, Review of Financial Studies 12, 653-686.

Michaely, Roni, and Kent L. Womack, 2007, What are analysts really good at?, Working paper, Cornell University.
Mikhail, Michael B., Beverly R. Walther, and Richard H. Willis, 1999, Does forecast accuracy matter to security analysts?, Accounting Review 74, 185-200.
Mizruchi, Mark S., 1982, The American Corporate Network, 1904-1974, Beverly Hills: Sage Publications.
Mizruchi, Mark S., 1992, The Structure of Corporate Political Action: Inter-firm Relations and Their Consequences, Harvard University Press.
Mohanran, Partha and Shyam V. Sunder, 2006, How has Regulation FD affected the operations of financial analysts?, Contemporary Accounting Research 23, 491-525.
Parkin, Rachel, 2006, Legal careers and school connections, Harvard University working paper.
Scharfstein, David S., and Jeremy C. Stein, 1990, Herd behavior and investment, American Economic Review 80, 465-479.
Stickel, Scott E., 1991, Common stock returns surrounding earnings forecast revisions: more puzzling evidence. The Accounting Review, 66, 402- 416.
Stickel, Scott E., 1992, Reputation and performance among security analysts,
Journal of Finance 47, 1811-1836.
Useem, Michael, 1984, The Inner Circle, Oxford: Oxford University Press.
Womack, Kent, 1996, Do brokerage analysts’ recommendations have investment value?. Journal of Finance 51, 137-167.

1 For much of the paper we focus only on links to senior officers, although we do
present results for links to either senior officers or members of the board as well.
2 This example comes directly from our sample, however we mask the firms’ and
analysts’ names. We also alter the calendar dates.
3 The consensus rating refers to the average across all analysts covering the stock;
we do not have educational information on the remaining analysts.
4 Selective Disclosure and Insider Trading, SEC Release Nos. 33-7881, 34-43154,
IC-24599, 65 Fed. Reg. 51716 (Aug. 24, 2000).
5 Regulations prohibiting the selective disclosure of material information by UK-
listed firms have been a part of UK law for decades since rules on insider dealing
came into force in the 1980s. Conversations with practitioners in the UK indicate
that although clarifications and enhancements to these norms were put into effect
in 2001 (through the Financial Services and Markets Act) and 2005 (via the
Market Abuse Directive), these acts were generally not viewed as structural shifts
in the disclosure environment in the same way that Regulation FD in the US was
designed to be. 6 See also Michaely and Womack (2007), who combine information from
recommendations and earnings forecasts data and show that the subset of
upgraded/downgraded recommendations "supported" by an earnings forecast
revision in the same direction are the most profitable recommendations.
7 Chevalier and Ellison (1999) and Lamont (2002) find similar results for mutual
fund managers and macroeconomic forecasters, respectively. Also see Holmström
(1999) and Scharfstein and Stein (1990) for related work on career concerns.
8 Lin and McNichols (1998), Michaely and Womack (1999), and Lin, McNichols,
and O’Brien (2005) also report evidence in support of this view. 9 See also Malloy (2005), who shows that geographically proximate analysts
produce more accurate forecasts, but do so both before and after the enactment of
Regulation FD; as well as Groysberg, Healy, Chapman, Shanthikumar, and Gui
(2007), who document a decline in the forecast accuracy advantage of sell-side
analysts over buy-side analysts after the enactment of Regulation FD.
10 See Jackson (2005) for a survey on the economics of social networks.

11 See also Hong, Kubik, and Stein (2004) for evidence that measures of sociability
are linked to increased stock market participation, and Hochberg, Ljungqvist, and
Lu (2007) for evidence of a positive impact of venture capital networks on
investment performance.
12 See also Parkin (2006), who identifies school clustering of lawyers at law firms
that cannot be explained by quality or location, and a link between promotion
chances in law firms and the concentration of partners with similar educational
backgrounds.
13 Examples of the latter include the adoption of poison pills (Davis (1991)),
corporate acquisition activity (Haunschild (1993)), CEO compensation (Khurana
(2002)), and the decision to make political contributions (Mizruchi (1992)). 14 See Malloy, Marston, and Ljunqvist (2008) for issues and problems with the
I/B/E/S historical recommendation data. Note that since we use a very recent
snapshot of the data (circa late 2007), after cleanups to the historical data had
already been put into effect, it is likely that future snapshots of the data will
produce similar results over our sample period.
15 For example, if according to I/B/E/S a person named A. Summer covers
technology stocks for Goldman Sachs in 1999, but our web searches uncover an
Alan Summer and an Amy Summer, both of whom were analysts for Goldman
Sachs covering technology stocks in 1999, we would not be able to uniquely match
this analyst.
16 One drawback of our dataset is that graduation years are missing for 70% of the
final sample since most of the data is extracted from company releases or other
public filings, which tend to omit graduation years. Information on degree type is
also missing for about 35% of analysts. We have tried to collect these additional
data items from each academic institution’s alumni network but have been unable
to collect a large enough sample to date, since many universities restrict access to
their alumni network and/or require written consent of the alumnus before
releasing this information. 17 See also Cohen, Frazzini, and Malloy (2008) for additional details on data

construction and matching using the BoardEx data.
18 Note that in unreported tests we have verified that the characteristics of our
sample are very similar to those of the entire database of I/B/E/S
recommendations over this time period (e.g., in terms of the proportion of
buys/sells; average calendar-time portfolio returns of all buy recommendations,
etc.).
19 Note that our results are not driven by a few particular schools (e.g., Ivy
League), as we show later in the paper.
20 The Internet Appendix can be found at http://www.afajof.org/supplements.asp.
21 See also Barber, Lehavy, and Trueman (2005), and Barber, Lehavy, McNichols,
and Trueman (2005). 22 http://mba.tuck.dartmouth.edu/pages/faculty/ken.french/data_library.html
23 The list of affiliated analysts is from Ljungqvist at al. (2006).
24 The list of "all-star" analysts is from Ljungqvist at al. (2007).
25 We've also clustered by analyst in all regressions, and the standard errors (and
resulting t-stats) are nearly identical. We report these in the Internet Appendix in
Table A8.
26 In addition to these tests, and in order to rule out a potential sample selection
bias caused through the measurement of our connectedness measure (e.g., the
sample for whom we can identify any links being correlated with firm performance
and survival), we run all tests on only the sample for which we are able to
definitively identify all potential links from the analyst to senior managers (i.e.,
where we have school information for the analyst, and all three senior managers).
In this subsample, we find that results on buys are nearly identical, while the
results on sells are statistically insignificant, but actually become more negative, so
more supportive of school ties having some impact also on sell recommendations.
In fact, in the analog of Column 1 of Table V for returns following downgrades on
this subsample, linked downgrades significantly underperform non-linked
downgrades (-25 bp per month, (t=2.15)). We thank an anonymous Associate
Editor for suggesting these tests. These results are reported in Table A9 in the
Internet Appendix.

27 Selective Disclosure and Insider Trading, SEC Release Nos. 33-7881, 34-43154,
IC-24599, 65 Fed. Reg. 51716 (Aug. 24, 2000).
28 We exclude month fixed effects in these regressions because the model cannot be
estimated with a post-Reg FD dummy and month fixed effects jointly (as they are
collinear).
29 We have also run these regressions using a firm fixed effect, and a firm-by-time
period (pre- vs. post-Reg FD) fixed effect. After doing so, the school tie premium
remains virtually unchanged, suggesting that this result is not driven by any
special characteristics of linked vs. non-linked stocks, nor by a characteristic of
these linked stocks that changed in the pre- and post-Reg FD time periods.
30 See the Appendix, Table A2, for additional specifications using abnormal
returns, upgrades, etc. These results are very similar to those reported here.
31 Analogous to our US sample, we collect educational data on I/B/E/S analysts
issuing recommendations on stocks traded in the UK, as defined by the I/B/E/S
country exchange code. We hand matched firms from the Boardex sample to
I/B/E/S using company names. Daily returns (in local currency) are from Factset.
Market equity and book equity are from Compustat Global. Note that the
coverage of our sample is sparse for non-US data: By requiring educational
information on I/B/E/S analysts covering UK stocks, we limit our sample to an
average of 26 analysts, 69 stocks, and 131 recommendations per year over the
1993-2006 time period.
32 For brevity we only report results for links to senior management, and for raw
returns (in Panel C). Results are very similar for the full set of specifications used
earlier.
33 Note that Cohen, Frazzini, and Malloy (2008) do not find a large impact of Reg
FD on the return premium that mutual fund managers earn on their school-
connected stocks relative to their non-connected stocks. This could be due to a
different mechanism at work in the case of mutual fund managers. It could also be
due to the fact that equity analysts were under intense scrutiny during this time
period, not only as a result of Reg FD, but also due to alleged conflicts of interest
that led to several new policy measures being enacted by the SEC, NASD, and

NYSE, and which culminated in the Global Settlement of 2003.
34 Note that in both specifications we include Linked to Mgmt, to orthogonalize
against those instances where the analyst and senior manager attended the same
school.
35 We also find similar effects using common state of school attended (e.g., Iowa
and Iowa State), although a bit weaker.
36 Following Malloy (2005) and Clement (1999) and using 1- and 2-year ahead
earnings forecasts drawn from the I/B/E/S Detail File, we run Fama-MacBeth
cross-sectional regressions of de-meaned absolute forecast error (DAFE),
proportional mean absolute forecast error (PMAFE), and relative optimism (OPT)
on a variety of analyst characteristics plus a dummy variable equal to one if the
analyst is linked to the board of directors or a senior officer of the firm being
covered. Although the sign on the dummy variables in the DAFE and PMAFE
regressions is consistently negative (indicating that linked analysts are more
accurate), the coefficients are generally insignificant. These results are available on
request.
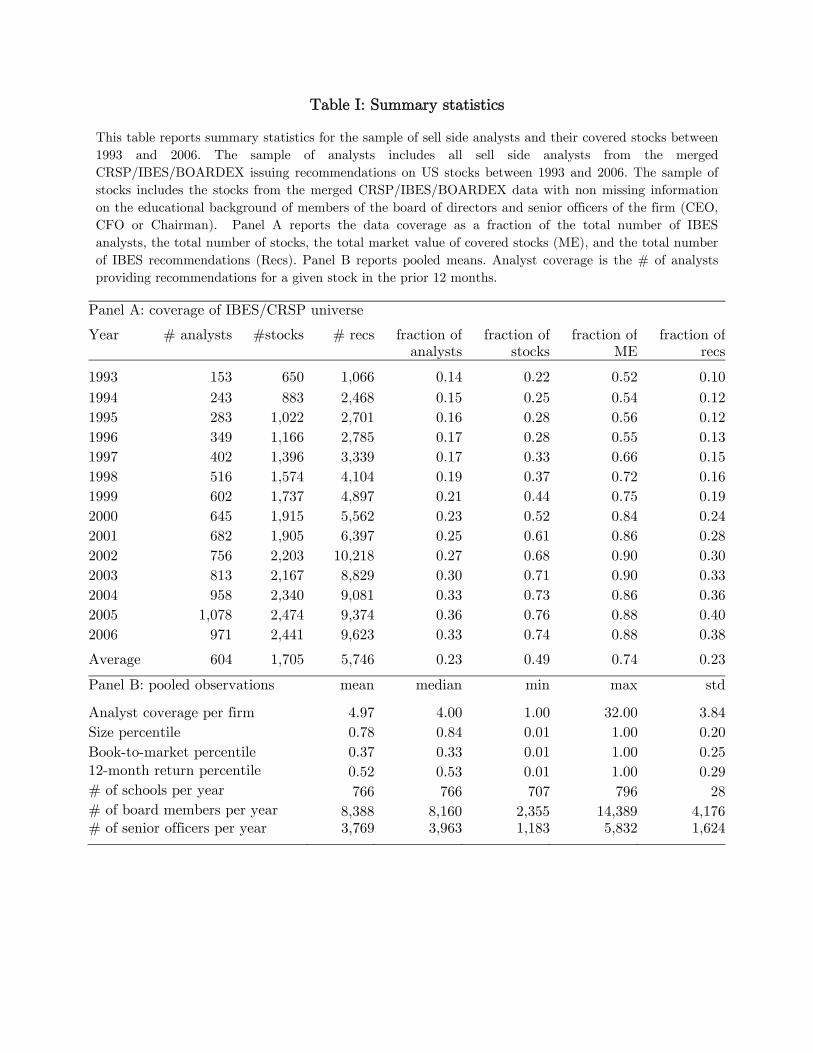
Table I: Summary statistics
This table reports summary statistics for the sample of sell side analysts and their covered stocks between
1993 and 2006. The sample of analysts includes all sell side analysts from the merged
CRSP/IBES/BOARDEX issuing recommendations on US stocks between 1993 and 2006. The sample of
stocks includes the stocks from the merged CRSP/IBES/BOARDEX data with non missing information
on the educational background of members of the board of directors and senior officers of the firm (CEO,
CFO or Chairman). Panel A reports the data coverage as a fraction of the total number of IBES
analysts, the total number of stocks, the total market value of covered stocks (ME), and the total number
of IBES recommendations (Recs). Panel B reports pooled means. Analyst coverage is the # of analysts
providing recommendations for a given stock in the prior 12 months.
Panel A: coverage of IBES/CRSP universe
Year # analysts #stocks # recs fraction of analysts
fraction of stocks
fraction of ME
fraction of recs
1993 153 650 1,066 0.14 0.22 0.52 0.10
1994 243 883 2,468 0.15 0.25 0.54 0.12
1995 283 1,022 2,701 0.16 0.28 0.56 0.12
1996 349 1,166 2,785 0.17 0.28 0.55 0.13
1997 402 1,396 3,339 0.17 0.33 0.66 0.15
1998 516 1,574 4,104 0.19 0.37 0.72 0.16
1999 602 1,737 4,897 0.21 0.44 0.75 0.19
2000 645 1,915 5,562 0.23 0.52 0.84 0.24
2001 682 1,905 6,397 0.25 0.61 0.86 0.28
2002 756 2,203 10,218 0.27 0.68 0.90 0.30
2003 813 2,167 8,829 0.30 0.71 0.90 0.33
2004 958 2,340 9,081 0.33 0.73 0.86 0.36
2005 1,078 2,474 9,374 0.36 0.76 0.88 0.40
2006 971 2,441 9,623 0.33 0.74 0.88 0.38
Average 604 1,705 5,746 0.23 0.49 0.74 0.23
Panel B: pooled observations mean median min max std
Analyst coverage per firm 4.97 4.00 1.00 32.00 3.84
Size percentile 0.78 0.84 0.01 1.00 0.20
Book-to-market percentile 0.37 0.33 0.01 1.00 0.25
12-month return percentile 0.52 0.53 0.01 1.00 0.29
# of schools per year 766 766 707 796 28
# of board members per year 8,388 8,160 2,355 14,389 4,176 # of senior officers per year 3,769 3,963 1,183 5,832 1,624
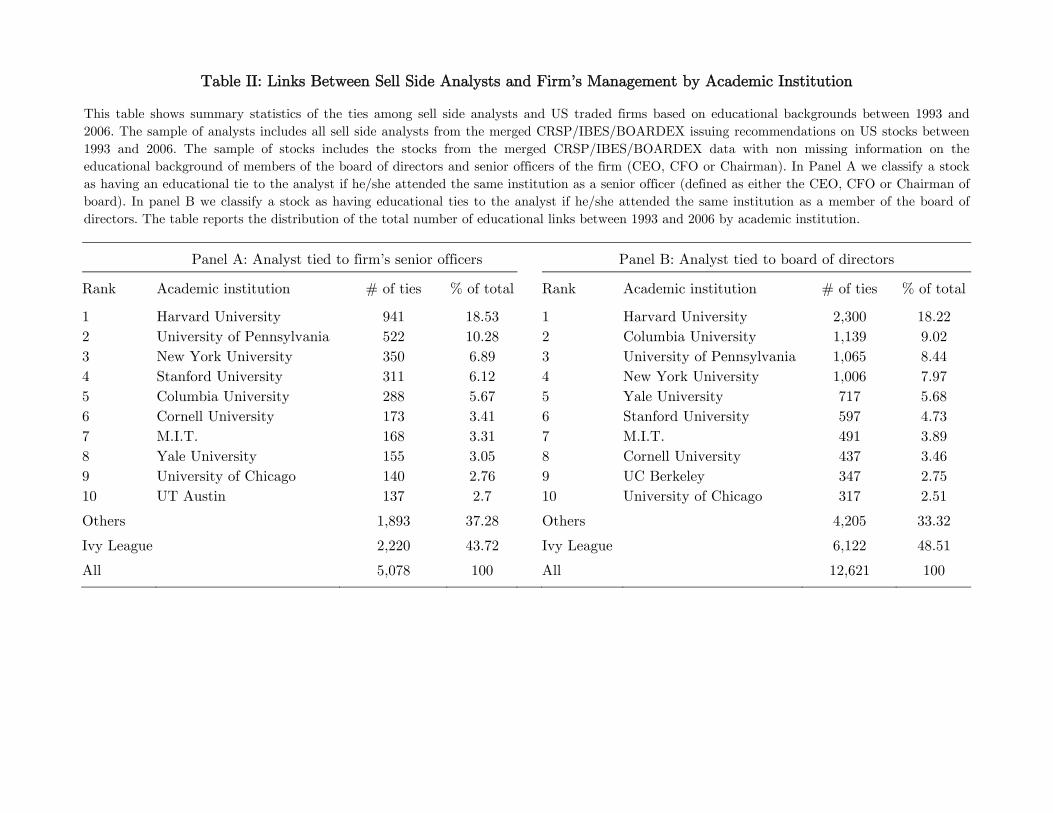
Table II: Links Between Sell Side Analysts and Firm’s Management by Academic Institution
This table shows summary statistics of the ties among sell side analysts and US traded firms based on educational backgrounds between 1993 and
2006. The sample of analysts includes all sell side analysts from the merged CRSP/IBES/BOARDEX issuing recommendations on US stocks between
1993 and 2006. The sample of stocks includes the stocks from the merged CRSP/IBES/BOARDEX data with non missing information on the
educational background of members of the board of directors and senior officers of the firm (CEO, CFO or Chairman). In Panel A we classify a stock
as having an educational tie to the analyst if he/she attended the same institution as a senior officer (defined as either the CEO, CFO or Chairman of
board). In panel B we classify a stock as having educational ties to the analyst if he/she attended the same institution as a member of the board of
directors. The table reports the distribution of the total number of educational links between 1993 and 2006 by academic institution.
Panel A: Analyst tied to firm’s senior officers Panel B: Analyst tied to board of directors
Rank Academic institution # of ties % of total Rank Academic institution # of ties % of total
1 Harvard University 941 18.53 1 Harvard University 2,300 18.22
2 University of Pennsylvania 522 10.28 2 Columbia University 1,139 9.02
3 New York University 350 6.89 3 University of Pennsylvania 1,065 8.44
4 Stanford University 311 6.12 4 New York University 1,006 7.97
5 Columbia University 288 5.67 5 Yale University 717 5.68
6 Cornell University 173 3.41 6 Stanford University 597 4.73
7 M.I.T. 168 3.31 7 M.I.T. 491 3.89
8 Yale University 155 3.05 8 Cornell University 437 3.46
9 University of Chicago 140 2.76 9 UC Berkeley 347 2.75
10 UT Austin 137 2.7 10 University of Chicago 317 2.51
Others 1,893 37.28 Others 4,205 33.32
Ivy League 2,220 43.72 Ivy League 6,122 48.51
All 5,078 100 All 12,621 100
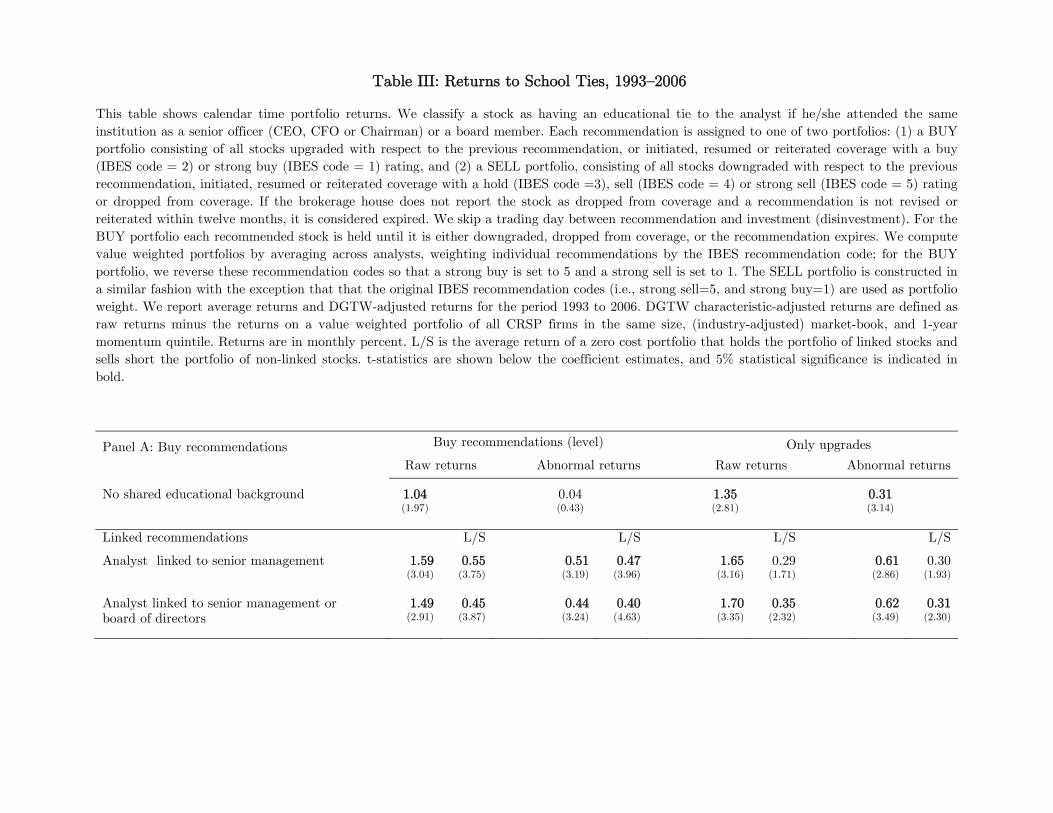
Table III: Returns to School Ties, 1993—2006
This table shows calendar time portfolio returns. We classify a stock as having an educational tie to the analyst if he/she attended the same
institution as a senior officer (CEO, CFO or Chairman) or a board member. Each recommendation is assigned to one of two portfolios: (1) a BUY
portfolio consisting of all stocks upgraded with respect to the previous recommendation, or initiated, resumed or reiterated coverage with a buy
(IBES code = 2) or strong buy (IBES code = 1) rating, and (2) a SELL portfolio, consisting of all stocks downgraded with respect to the previous
recommendation, initiated, resumed or reiterated coverage with a hold (IBES code =3), sell (IBES code = 4) or strong sell (IBES code = 5) rating
or dropped from coverage. If the brokerage house does not report the stock as dropped from coverage and a recommendation is not revised or
reiterated within twelve months, it is considered expired. We skip a trading day between recommendation and investment (disinvestment). For the
BUY portfolio each recommended stock is held until it is either downgraded, dropped from coverage, or the recommendation expires. We compute
value weighted portfolios by averaging across analysts, weighting individual recommendations by the IBES recommendation code; for the BUY
portfolio, we reverse these recommendation codes so that a strong buy is set to 5 and a strong sell is set to 1. The SELL portfolio is constructed in
a similar fashion with the exception that that the original IBES recommendation codes (i.e., strong sell=5, and strong buy=1) are used as portfolio
weight. We report average returns and DGTW-adjusted returns for the period 1993 to 2006. DGTW characteristic-adjusted returns are defined as
raw returns minus the returns on a value weighted portfolio of all CRSP firms in the same size, (industry-adjusted) market-book, and 1-year
momentum quintile. Returns are in monthly percent. L/S is the average return of a zero cost portfolio that holds the portfolio of linked stocks and
sells short the portfolio of non-linked stocks. t-statistics are shown below the coefficient estimates, and 5% statistical significance is indicated in
bold.
Panel A: Buy recommendations Buy recommendations (level) Only upgrades
Raw returns Abnormal returns Raw returns Abnormal returns
No shared educational background 1.04 0.04 1.35 0.31 (1.97) (0.43) (2.81) (3.14)
Linked recommendations L/S L/S L/S L/S
Analyst linked to senior management 1.59 0.55 0.51 0.47 1.65 0.29 0.61 0.30 (3.04) (3.75) (3.19) (3.96) (3.16) (1.71) (2.86) (1.93)
Analyst linked to senior management or 1.49 0.45 0.44 0.40 1.70 0.35 0.62 0.31board of directors (2.91) (3.87) (3.24) (4.63) (3.35) (2.32) (3.49) (2.30)
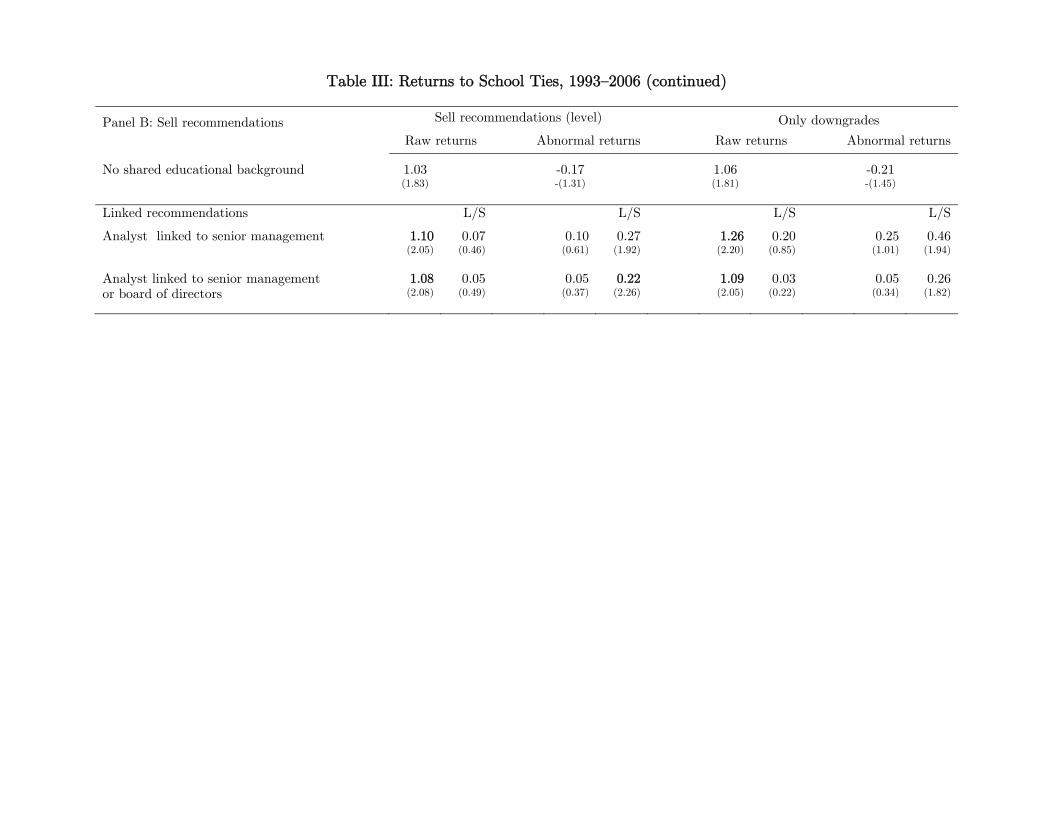
Table III: Returns to School Ties, 1993—2006 (continued)
Panel B: Sell recommendations Sell recommendations (level) Only downgrades
Raw returns Abnormal returns Raw returns Abnormal returns
No shared educational background 1.03 -0.17 1.06 -0.21 (1.83) -(1.31) (1.81) -(1.45)
Linked recommendations L/S L/S L/S L/S
Analyst linked to senior management 1.10 0.07 0.10 0.27 1.26 0.20 0.25 0.46 (2.05) (0.46) (0.61) (1.92) (2.20) (0.85) (1.01) (1.94)
Analyst linked to senior management 1.08 0.05 0.05 0.22 1.09 0.03 0.05 0.26or board of directors (2.08) (0.49) (0.37) (2.26) (2.05) (0.22) (0.34) (1.82)
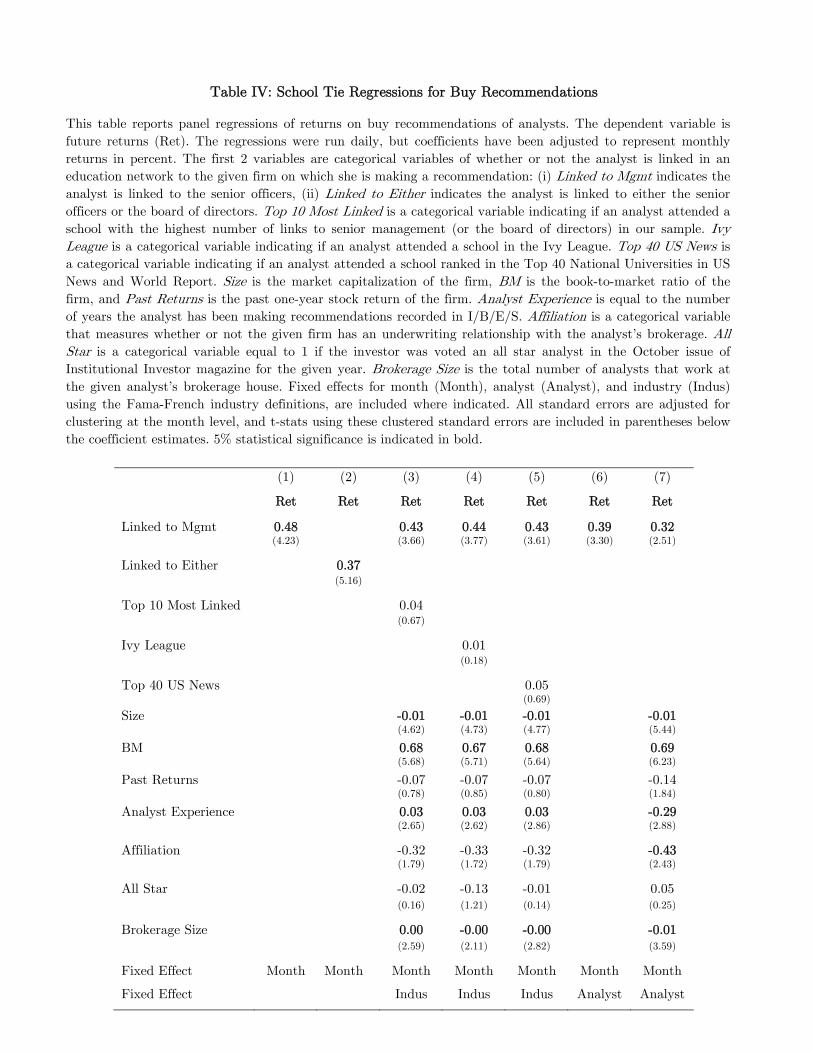
Table IV: School Tie Regressions for Buy Recommendations
This table reports panel regressions of returns on buy recommendations of analysts. The dependent variable is
future returns (Ret). The regressions were run daily, but coefficients have been adjusted to represent monthly
returns in percent. The first 2 variables are categorical variables of whether or not the analyst is linked in an
education network to the given firm on which she is making a recommendation: (i) Linked to Mgmt indicates the
analyst is linked to the senior officers, (ii) Linked to Either indicates the analyst is linked to either the senior
officers or the board of directors. Top 10 Most Linked is a categorical variable indicating if an analyst attended a
school with the highest number of links to senior management (or the board of directors) in our sample. Ivy
League is a categorical variable indicating if an analyst attended a school in the Ivy League. Top 40 US News is
a categorical variable indicating if an analyst attended a school ranked in the Top 40 National Universities in US
News and World Report. Size is the market capitalization of the firm, BM is the book-to-market ratio of the
firm, and Past Returns is the past one-year stock return of the firm. Analyst Experience is equal to the number
of years the analyst has been making recommendations recorded in I/B/E/S. Affiliation is a categorical variable
that measures whether or not the given firm has an underwriting relationship with the analyst’s brokerage. All
Star is a categorical variable equal to 1 if the investor was voted an all star analyst in the October issue of
Institutional Investor magazine for the given year. Brokerage Size is the total number of analysts that work at
the given analyst’s brokerage house. Fixed effects for month (Month), analyst (Analyst), and industry (Indus)
using the Fama-French industry definitions, are included where indicated. All standard errors are adjusted for
clustering at the month level, and t-stats using these clustered standard errors are included in parentheses below
the coefficient estimates. 5% statistical significance is indicated in bold.
(1) (2) (3) (4) (5) (6) (7)
Ret Ret Ret Ret Ret Ret Ret
Linked to Mgmt 0.48 0.43 0.44 0.43 0.39 0.32 (4.23) (3.66) (3.77) (3.61) (3.30) (2.51)
Linked to Either 0.37 (5.16)
Top 10 Most Linked 0.04
(0.67)
Ivy League 0.01
(0.18)
Top 40 US News 0.05 (0.69) Size -0.01 -0.01 -0.01 -0.01 (4.62) (4.73) (4.77) (5.44)
BM 0.68 0.67 0.68 0.69 (5.68) (5.71) (5.64) (6.23)
Past Returns -0.07 -0.07 -0.07 -0.14 (0.78) (0.85) (0.80) (1.84)
Analyst Experience 0.03 0.03 0.03 -0.29 (2.65) (2.62) (2.86) (2.88)
Affiliation -0.32 -0.33 -0.32 -0.43 (1.79) (1.72) (1.79) (2.43)
All Star -0.02 -0.13 -0.01 0.05
(0.16) (1.21) (0.14) (0.25)
Brokerage Size 0.00 -0.00 -0.00 -0.01
(2.59) (2.11) (2.82) (3.59)
Fixed Effect Month Month Month Month Month Month Month
Fixed Effect Indus Indus Indus Analyst Analyst
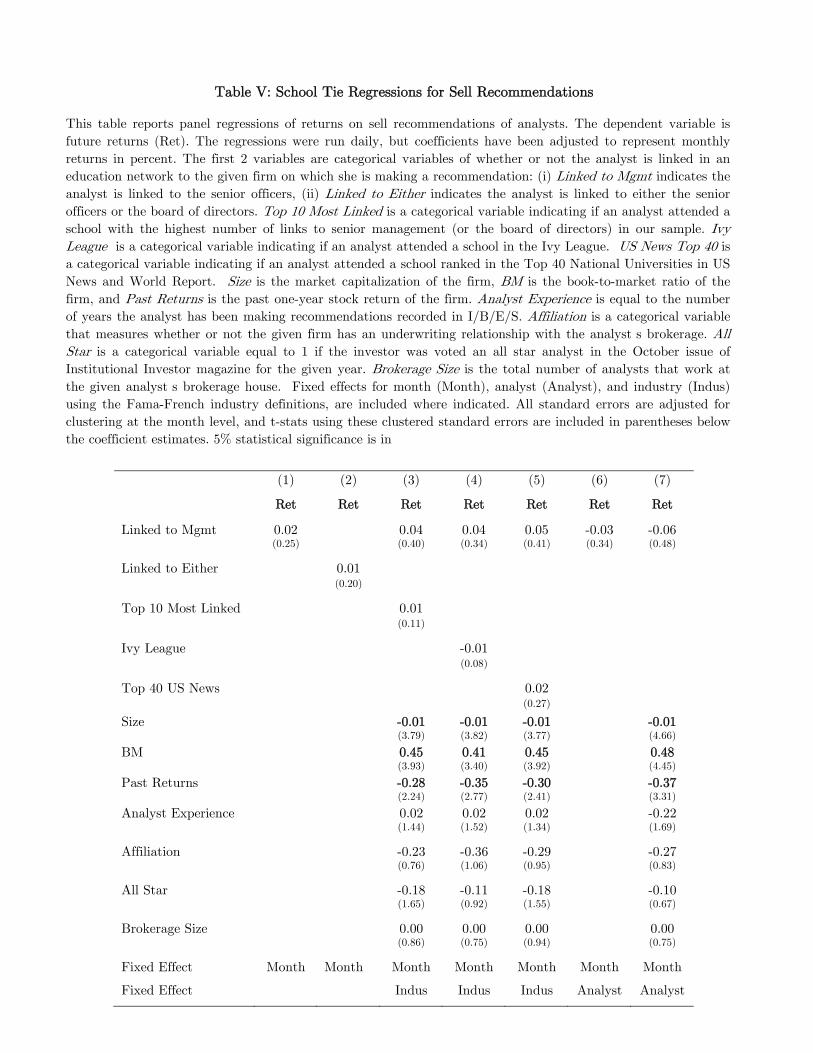
Table V: School Tie Regressions for Sell Recommendations
This table reports panel regressions of returns on sell recommendations of analysts. The dependent variable is
future returns (Ret). The regressions were run daily, but coefficients have been adjusted to represent monthly
returns in percent. The first 2 variables are categorical variables of whether or not the analyst is linked in an
education network to the given firm on which she is making a recommendation: (i) Linked to Mgmt indicates the
analyst is linked to the senior officers, (ii) Linked to Either indicates the analyst is linked to either the senior
officers or the board of directors. Top 10 Most Linked is a categorical variable indicating if an analyst attended a
school with the highest number of links to senior management (or the board of directors) in our sample. Ivy
League is a categorical variable indicating if an analyst attended a school in the Ivy League. US News Top 40 is
a categorical variable indicating if an analyst attended a school ranked in the Top 40 National Universities in US
News and World Report. Size is the market capitalization of the firm, BM is the book-to-market ratio of the
firm, and Past Returns is the past one-year stock return of the firm. Analyst Experience is equal to the number
of years the analyst has been making recommendations recorded in I/B/E/S. Affiliation is a categorical variable
that measures whether or not the given firm has an underwriting relationship with the analyst's brokerage. All
Star is a categorical variable equal to 1 if the investor was voted an all star analyst in the October issue of
Institutional Investor magazine for the given year. Brokerage Size is the total number of analysts that work at
the given analyst's brokerage house. Fixed effects for month (Month), analyst (Analyst), and industry (Indus)
using the Fama-French industry definitions, are included where indicated. All standard errors are adjusted for
clustering at the month level, and t-stats using these clustered standard errors are included in parentheses below
the coefficient estimates. 5% statistical significance is in
(1) (2) (3) (4) (5) (6) (7)
Ret Ret Ret Ret Ret Ret Ret
Linked to Mgmt 0.02 0.04 0.04 0.05 -0.03 -0.06 (0.25) (0.40) (0.34) (0.41) (0.34) (0.48)
Linked to Either 0.01 (0.20)
Top 10 Most Linked 0.01 (0.11)
Ivy League -0.01
(0.08)
Top 40 US News 0.02 (0.27)
Size -0.01 -0.01 -0.01 -0.01 (3.79) (3.82) (3.77) (4.66)
BM 0.45 0.41 0.45 0.48 (3.93) (3.40) (3.92) (4.45)
Past Returns -0.28 -0.35 -0.30 -0.37 (2.24) (2.77) (2.41) (3.31)
Analyst Experience 0.02 0.02 0.02 -0.22 (1.44) (1.52) (1.34) (1.69)
Affiliation -0.23 -0.36 -0.29 -0.27 (0.76) (1.06) (0.95) (0.83)
All Star -0.18 -0.11 -0.18 -0.10 (1.65) (0.92) (1.55) (0.67)
Brokerage Size 0.00 0.00 0.00 0.00 (0.86) (0.75) (0.94) (0.75)
Fixed Effect Month Month Month Month Month Month Month
Fixed Effect Indus Indus Indus Analyst Analyst
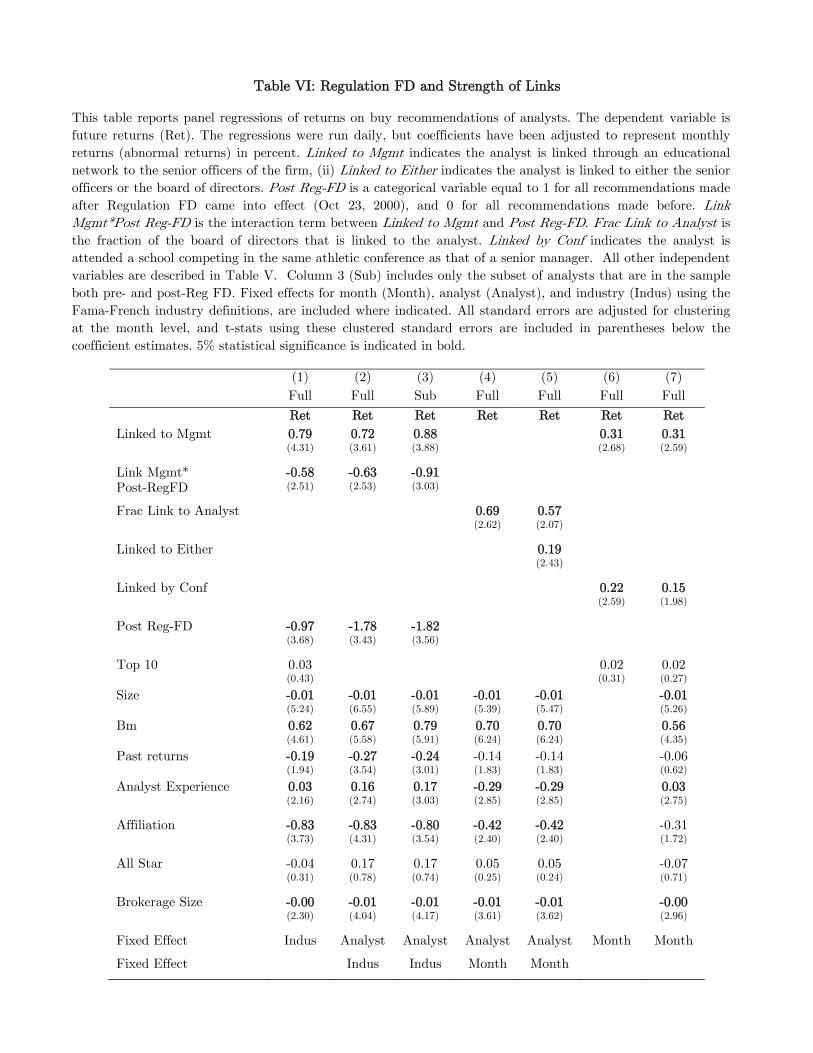
Table VI: Regulation FD and Strength of Links
This table reports panel regressions of returns on buy recommendations of analysts. The dependent variable is
future returns (Ret). The regressions were run daily, but coefficients have been adjusted to represent monthly
returns (abnormal returns) in percent. Linked to Mgmt indicates the analyst is linked through an educational
network to the senior officers of the firm, (ii) Linked to Either indicates the analyst is linked to either the senior
officers or the board of directors. Post Reg-FD is a categorical variable equal to 1 for all recommendations made
after Regulation FD came into effect (Oct 23, 2000), and 0 for all recommendations made before. Link
Mgmt*Post Reg-FD is the interaction term between Linked to Mgmt and Post Reg-FD. Frac Link to Analyst is
the fraction of the board of directors that is linked to the analyst. Linked by Conf indicates the analyst is
attended a school competing in the same athletic conference as that of a senior manager. All other independent
variables are described in Table V. Column 3 (Sub) includes only the subset of analysts that are in the sample
both pre- and post-Reg FD. Fixed effects for month (Month), analyst (Analyst), and industry (Indus) using the
Fama-French industry definitions, are included where indicated. All standard errors are adjusted for clustering
at the month level, and t-stats using these clustered standard errors are included in parentheses below the
coefficient estimates. 5% statistical significance is indicated in bold.
(1) (2) (3) (4) (5) (6) (7)
Full Full Sub Full Full Full Full
Ret Ret Ret Ret Ret Ret Ret
Linked to Mgmt 0.79 0.72 0.88 0.31 0.31 (4.31) (3.61) (3.88) (2.68) (2.59)
Link Mgmt* -0.58 -0.63 -0.91 Post-RegFD (2.51) (2.53) (3.03)
Frac Link to Analyst 0.69 0.57 (2.62) (2.07)
Linked to Either 0.19 (2.43)
Linked by Conf 0.22 0.15 (2.59) (1.98)
Post Reg-FD -0.97 -1.78 -1.82 (3.68) (3.43) (3.56)
Top 10 0.03 0.02 0.02 (0.43) (0.31) (0.27)
Size -0.01 -0.01 -0.01 -0.01 -0.01 -0.01 (5.24) (6.55) (5.89) (5.39) (5.47) (5.26)
Bm 0.62 0.67 0.79 0.70 0.70 0.56 (4.61) (5.58) (5.91) (6.24) (6.24) (4.35)
Past returns -0.19 -0.27 -0.24 -0.14 -0.14 -0.06 (1.94) (3.54) (3.01) (1.83) (1.83) (0.62)
Analyst Experience 0.03 0.16 0.17 -0.29 -0.29 0.03 (2.16) (2.74) (3.03) (2.85) (2.85) (2.75)
Affiliation -0.83 -0.83 -0.80 -0.42 -0.42 -0.31 (3.73) (4.31) (3.54) (2.40) (2.40) (1.72)
All Star -0.04 0.17 0.17 0.05 0.05 -0.07 (0.31) (0.78) (0.74) (0.25) (0.24) (0.71)
Brokerage Size -0.00 -0.01 -0.01 -0.01 -0.01 -0.00 (2.30) (4.04) (4.17) (3.61) (3.62) (2.96)
Fixed Effect Indus Analyst Analyst Analyst Analyst Month Month
Fixed Effect Indus Indus Month Month
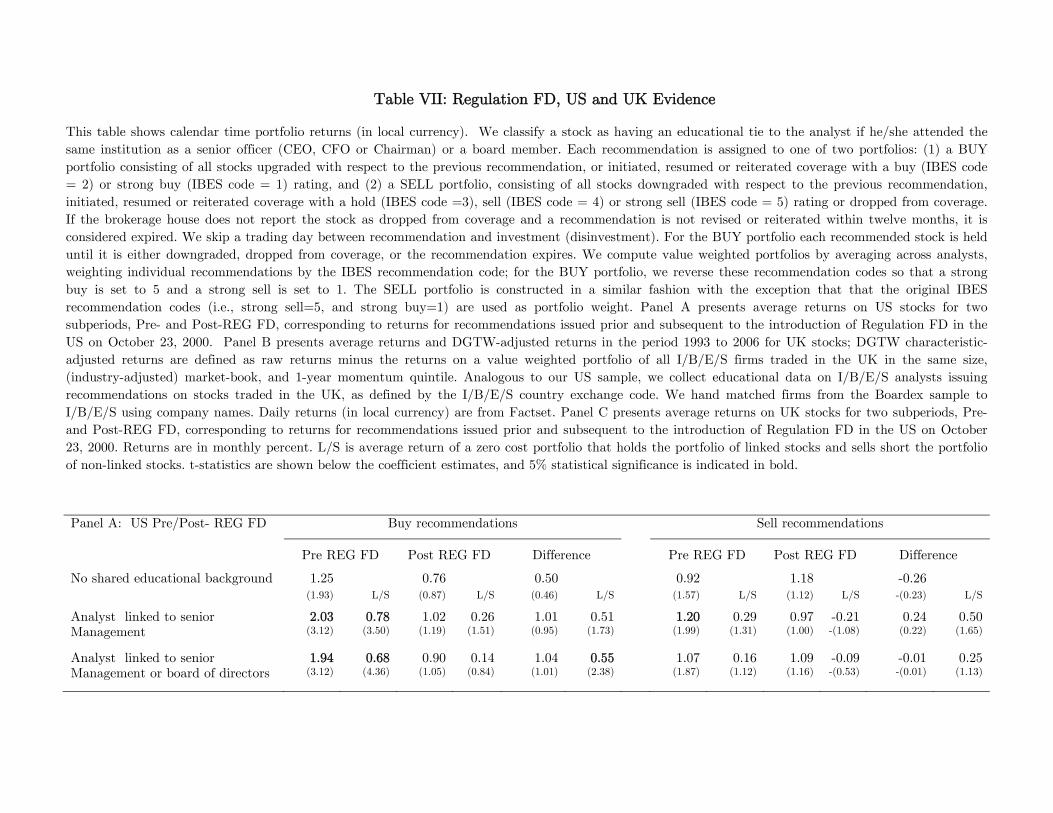
Table VII: Regulation FD, US and UK Evidence
This table shows calendar time portfolio returns (in local currency). We classify a stock as having an educational tie to the analyst if he/she attended the
same institution as a senior officer (CEO, CFO or Chairman) or a board member. Each recommendation is assigned to one of two portfolios: (1) a BUY
portfolio consisting of all stocks upgraded with respect to the previous recommendation, or initiated, resumed or reiterated coverage with a buy (IBES code
= 2) or strong buy (IBES code = 1) rating, and (2) a SELL portfolio, consisting of all stocks downgraded with respect to the previous recommendation,
initiated, resumed or reiterated coverage with a hold (IBES code =3), sell (IBES code = 4) or strong sell (IBES code = 5) rating or dropped from coverage.
If the brokerage house does not report the stock as dropped from coverage and a recommendation is not revised or reiterated within twelve months, it is
considered expired. We skip a trading day between recommendation and investment (disinvestment). For the BUY portfolio each recommended stock is held
until it is either downgraded, dropped from coverage, or the recommendation expires. We compute value weighted portfolios by averaging across analysts,
weighting individual recommendations by the IBES recommendation code; for the BUY portfolio, we reverse these recommendation codes so that a strong
buy is set to 5 and a strong sell is set to 1. The SELL portfolio is constructed in a similar fashion with the exception that that the original IBES
recommendation codes (i.e., strong sell=5, and strong buy=1) are used as portfolio weight. Panel A presents average returns on US stocks for two
subperiods, Pre- and Post-REG FD, corresponding to returns for recommendations issued prior and subsequent to the introduction of Regulation FD in the
US on October 23, 2000. Panel B presents average returns and DGTW-adjusted returns in the period 1993 to 2006 for UK stocks; DGTW characteristic-
adjusted returns are defined as raw returns minus the returns on a value weighted portfolio of all I/B/E/S firms traded in the UK in the same size,
(industry-adjusted) market-book, and 1-year momentum quintile. Analogous to our US sample, we collect educational data on I/B/E/S analysts issuing
recommendations on stocks traded in the UK, as defined by the I/B/E/S country exchange code. We hand matched firms from the Boardex sample to
I/B/E/S using company names. Daily returns (in local currency) are from Factset. Panel C presents average returns on UK stocks for two subperiods, Pre-
and Post-REG FD, corresponding to returns for recommendations issued prior and subsequent to the introduction of Regulation FD in the US on October
23, 2000. Returns are in monthly percent. L/S is average return of a zero cost portfolio that holds the portfolio of linked stocks and sells short the portfolio
of non-linked stocks. t-statistics are shown below the coefficient estimates, and 5% statistical significance is indicated in bold.
Panel A: US Pre/Post- REG FD Buy recommendations Sell recommendations
Pre REG FD Post REG FD Difference Pre REG FD Post REG FD Difference
No shared educational background 1.25 0.76 0.50 0.92 1.18 -0.26 (1.93) L/S (0.87) L/S (0.46) L/S (1.57) L/S (1.12) L/S -(0.23) L/S
Analyst linked to senior 2.03 0.78 1.02 0.26 1.01 0.51 1.20 0.29 0.97 -0.21 0.24 0.50 Management (3.12) (3.50) (1.19) (1.51) (0.95) (1.73) (1.99) (1.31) (1.00) -(1.08) (0.22) (1.65)
Analyst linked to senior 1.94 0.68 0.90 0.14 1.04 0.55 1.07 0.16 1.09 -0.09 -0.01 0.25 Management or board of directors (3.12) (4.36) (1.05) (0.84) (1.01) (2.38) (1.87) (1.12) (1.16) -(0.53) -(0.01) (1.13)
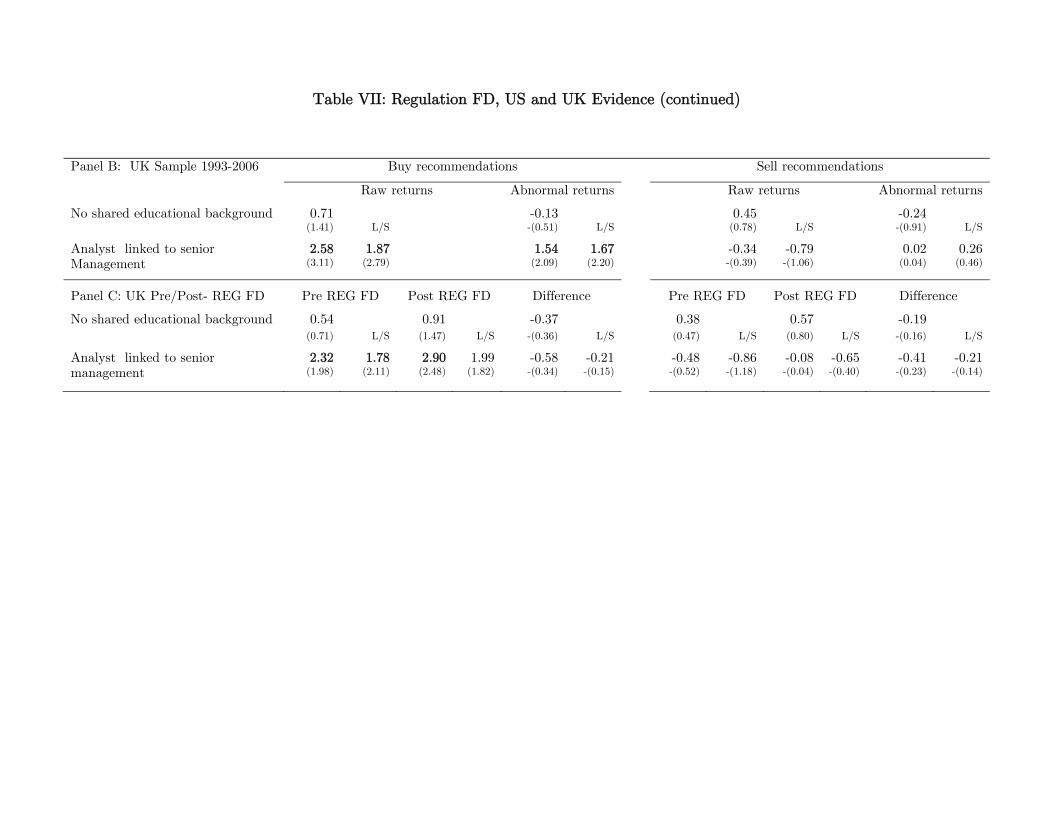
Table VII: Regulation FD, US and UK Evidence (continued)
Panel B: UK Sample 1993-2006 Buy recommendations Sell recommendations
Raw returns Abnormal returns Raw returns Abnormal returns
No shared educational background 0.71 -0.13 0.45 -0.24 (1.41) L/S -(0.51) L/S (0.78) L/S -(0.91) L/S
Analyst linked to senior 2.58 1.87 1.54 1.67 -0.34 -0.79 0.02 0.26 Management (3.11) (2.79) (2.09) (2.20) -(0.39) -(1.06) (0.04) (0.46)
Panel C: UK Pre/Post- REG FD Pre REG FD Post REG FD Difference Pre REG FD Post REG FD Difference
No shared educational background 0.54 0.91 -0.37 0.38 0.57 -0.19 (0.71) L/S (1.47) L/S -(0.36) L/S (0.47) L/S (0.80) L/S -(0.16) L/S
Analyst linked to senior 2.32 1.78 2.90 1.99 -0.58 -0.21 -0.48 -0.86 -0.08 -0.65 -0.41 -0.21 management (1.98) (2.11) (2.48) (1.82) -(0.34) -(0.15) -(0.52) -(1.18) -(0.04) -(0.40) -(0.23) -(0.14)
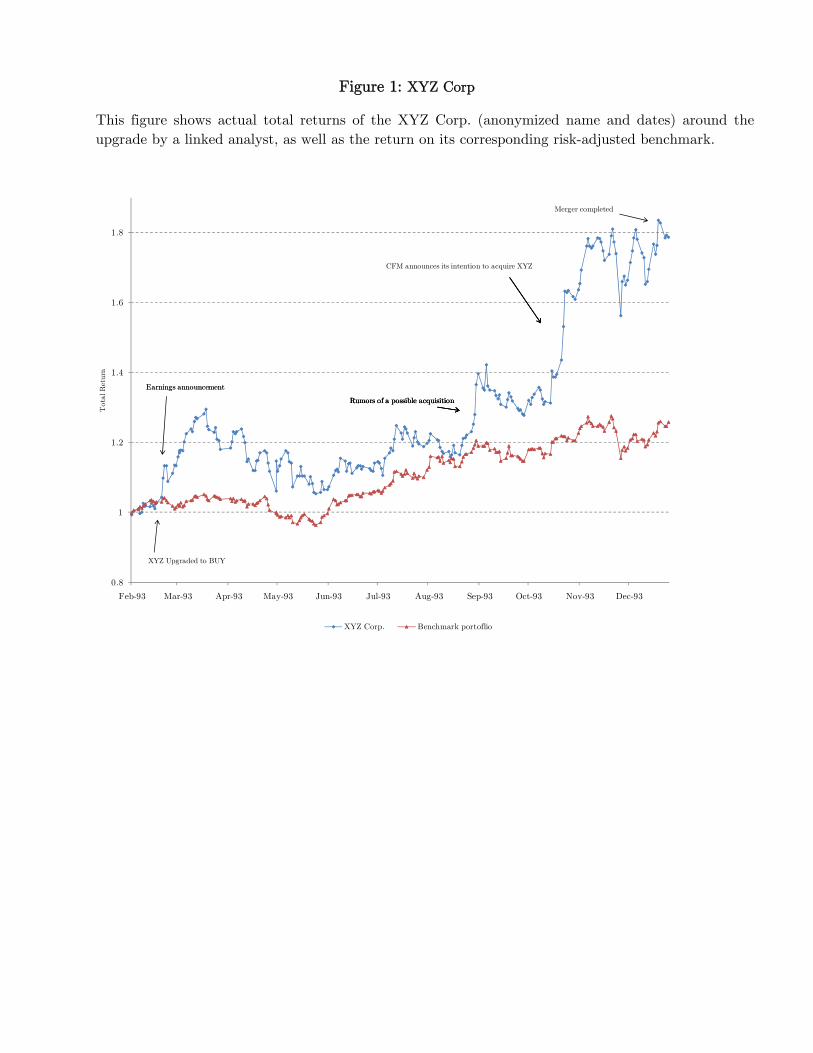
Figure 1: XYZ Corp
This figure shows actual total returns of the XYZ Corp. (anonymized name and dates) around the
upgrade by a linked analyst, as well as the return on its corresponding risk-adjusted benchmark.
0.8
1
1.2
1.4
1.6
1.8
Feb-93 Mar-93 Apr-93 May-93 Jun-93 Jul-93 Aug-93 Sep-93 Oct-93 Nov-93 Dec-93
Tota
l R
eturn
XYZ Corp. Benchmark portoflio
Earnings announcement
CFM announces its intention to acquire XYZ
Rumors of a possible acquisition
XYZ Upgraded to BUY
Earnings announcement
Rumors of a possible acquisition
Merger completed
Rumors of a possible acquisition

Sell Side School Ties:
Internet Appendix*
* Citation format: Cohen, Lauren, Andrea Frazzini and Christopher Malloy, 2010, Internet Appendix to
“Sell Side School Ties,” Journal of Finance [vol #], [pages], http://www.afajof.org/IA/2010.asp. Please
note: Wiley-Blackwell is not responsible for the content or functionality of any supporting information
supplied by the authors. Any queries (other than missing material) should be directed to the authors of the
article.

This appendix contains a number of additional tests, robustness checks, and
summary statistics for Sell Side School Ties. We organize by the accompanying tables
and figures. Thus each subsequent section corresponds to a table (or figure) in the
appendix.
I. Table A1 - Summary Statistics on Links
Table A1 presents the percentage of linked stocks, the number of linked stocks,
and the number of stocks covered for different categories of analysts. Note that we
classify an analyst-stock pair as "linked" if an analyst attended at least one common
school with at least one senior manager (or board member), and "unlinked" if an
analyst did not attend a single common school with any senior manager (or board
member). Also note that we require education data on at least one senior manager in
order to define a valid analyst-stock link or non-link.1 Analysts, as a whole, are linked to
an average of 18% of the stocks they cover; since the average analyst covers 6.2 stocks,
this translates to just over 1 linked stock on average per analyst. Analysts who attended
a school in the top 10 in terms of the number of links to firms are tied to an average of
35% of the stocks they cover, or roughly 2 stocks on average. Similarly, analysts who
attended any university ranked in the top 40 by US News and World Report in the prior
year have ties to 28% of the firms they cover. Meanwhile analysts from Ivy League
schools are actually linked to slightly fewer stocks than the average analyst. Finally,
there are no significant differences across any of the sub-categories in the percentage of
linked stocks Pre- and Post-Regulation FD, suggesting that the population of analysts is
unlikely to have changed over time in a way that is correlated with school ties.
II. Table A2 - Pre- and Post-Reg FD
Table A2 provides evidence of the returns on buy recommendations pre- and post-
Reg FD. Panel A indicates that the large returns to school ties for buy recommendations
1 In Table A9 we run all of our results on the subsample for whom we have valid education data for all three senior managers (rather than just one), and the results are virtually identical to those presented here.

are concentrated in the pre-Reg FD period. Specifically, the school tie premium in the
pre-Reg FD period ranges between 68 to 78 basis points per month, or 8.16% (t=4.35) to
9.36% (t=3.50) per year.2 Post-Regulation FD, this difference is only 14 to 26 basis
points per month, and is statistically indistinguishable from zero. Panel B also reports
results for abnormal returns following buy recommendations, obtaining the identical
pattern of large and significant abnormal returns pre-Reg FD, and small and insignificant
abnormal returns post-Reg FD.
III. Table A3 - Summary Statistics for UK Sample
Table A3 provides summary statistics on the UK sample of firms and analysts
used in Table VII. The table mimics the setup of Table I in the paper, which provides
these same statistics for the main US sample.
IV. Table A4 - School Links and All-Star
Another way to quantify the value of the social networks we isolate in this paper
is to test the extent to which school ties predict the probability of that analyst’s
becoming an All-Star. As in our prior tests, All-Star status is defined as being listed as
an "All-Star" in the October issue of Institutional Investor magazine in a given year. All-
Star status is a sought-after designation among analysts, and is typically associated with
higher-compensation (Stickel (1992)).3 To assess the predictive power of an analyst’s
network, we regress a dummy variable for All-Star status in a given year on the average
number of school ties per analyst per year (Num Link) plus a host of control variables at
the analyst- and stock-level. The dependent variable is a dummy variable equal to one if
the analyst was voted as an All-Star analyst for that year. We employ a similar set of
control variables as in Table IV, with the exception that affiliation status is now
2 See Table A2, for additional specifications using abnormal returns, upgrades, etc. These results are very similar to those described here. 3 Stickel (1992) shows that All-Star analysts also produce more accurate earnings forecasts than other analysts, suggesting a link between reputation and performance. Interestingly, in unreported tests we find that the All-Star analysts in our sample do not outperform other analysts on their buy/sell recommendations; this result is consistent with prior evidence (see Groysberg et al. (2008), footnote 27) that finds no relation between All-Star status and stock returns, except at very short windows surrounding recommendation changes.

measured as the average percentage of stocks (over the year) in an analyst’s portfolio
that have an underwriting relationship with the analyst’s brokerage. We also include a
control variable for covered firm size, equal to the average size of the firms covered by
the analyst in that year. All observations are at the analyst-year level; fixed effects at the
year, analyst, and broker level are included where indicated, and all standard errors are
adjusted for clustering by year. We run these regressions using both an OLS and a
probit framework. We report both in Table A4.
Table A4 reports the coefficient estimates from these predictive regressions.
Columns 1-8 are OLS panel regressions, while Column 9 is a probit regression with
random effects (given the known statistical problems associated with fixed effects in non-
linear panel data estimation models (Greene (2003))). The coefficients on Linked to
Mgmt indicate that the number of school ties is a strong positive predictor of the
likelihood of being an All-Star. The coefficient on connections in Column 1 implies that a
one standard deviation increase in connections increases the probability of being an All-
Star by nearly 50%, from 9.2% to 13.6%. Columns 3-5 show that analysts who attended
Ivy League schools or the most linked schools in our sample are more likely to be All
Star analysts. These school-specific effects, though, have almost no impact on the
magnitude or significance of the effect of the specific links of analysts to the management
of firms that they cover. Columns 7-9 illustrate the effect of Reg FD on this result: we
include a post-Reg FD dummy variable plus an interaction term (Link Mgmt*post-Reg
FD) designed to capture the predictive impact of the number of school ties on All-Star
status in the post-Reg FD time period.4 Once again the interaction term is strongly
negative, and the combined effect ([Link Mgmt*post-Reg FD]+[Linked to Mgmt]) is close
to zero and insignificant, indicating that school ties have no effect on being an All-Star in
the post-Reg FD period. The fact that school ties predict All-Star status only before the
imposition of Reg FD further highlights the value of social networks precisely during
those times when selective disclosure is least inhibited.
V. Table A5 - Robustness Checks
Table A5 presents a series of robustness checks designed to ensure that our results
are not driven by particular types of analyst, firms, or academic institutions. In general,
4 Again we do not include year fixed effects in these specifications, because the regression cannot be estimated with year fixed effects and the post Reg FD dummy variable included together.
our results are robust to a variety of breakdowns; further, our findings are typically
concentrated in precisely those areas where one might expect information asymmetry to
be most pronounced, and hence the return premium associated with school ties to be
largest. For example, Panel A of Table A5 shows that the long-short portfolio return of
linked buy recommendations minus non-linked buy recommendations earns 89 basis
points per month in a subsample of small stocks (below the NYSE median market
capitalization) over the full sample period, and 144 basis points per month in the pre-
Reg FD period.
Panel B presents a series of breakdowns by type of analyst. First we separate
affiliated and unaffiliated analysts. The long-short portfolio return of linked buy
recommendations minus non-linked buy recommendations of non affiliated analysts earns
44 basis points per month over the entire sample, 67 basis points per month in the pre-
Reg FD period and an insignificant 13 basis points post Reg-FD. Returns for affiliated
analysts are similar in magnitude but insignificant. Splitting the sample by the size of
the brokerage house, the connection premium appears concentrated in those analysts at
the larger brokerage houses.
Panel C shows that our results are not driven by a particular type of academic
institution. Although the school-tie premium is larger among Ivy League institutions (57
basis points per month compared to 36 basis points for Non-Ivy League institutions, over
the full sample period), it is large and significant for both sets of schools, indicating that
analysts from high quality schools are not driving our results. This also holds true
splitting the sample between "Top 10 linked" versus "Not Top 10 linked" and "Top 40
US news" versus "Not Top 40 US News." Finally, school-adjusted returns, defined as
the raw return minus the average return of a portfolio of all firms where at least a senior
official (CEO, CFO or Chairman) or a board member received a degree from the same
institution, are similar to our full sample results in Tables IV and V, indicating that
individual school effects do not drive our results.
VI. Table A6 - Robustness Checks for Sell Recommendations
Table A6 reports the same robustness checks as Table A5, but for sell
recommendations. As with our earlier findings, the results for sell recommendations are
mixed, and generally insignificant.
VII. Table A7 - Event Time Returns
We also compute event-time cumulative abnormal returns (CARs) following
upgrades and downgrades, for linked and non-linked stocks. Abnormal returns are
defined as DGTW characteristic-adjusted returns. These event-time CARs are reported
in Panel A of Table A7, and are plotted in Figure A1. These event-time returns are
consistent with the findings from our earlier calendar time portfolio tests. Over the full
sample period, upgrades by analysts with school ties earn a premium of 35 basis points
over other upgrades in the 2 days around the event, and a premium of almost 400 basis
points over the calendar year after the recommendation change.5 Figure A1 shows that
much of the upgrade return premium associated with school ties is concentrated between
60 and 250 days after the recommendation, suggesting that whatever information these
linked analysts obtain does not get revealed into prices until several months after the
recommendation change.
We also calculate these event-time returns (CARs) separately for the pre-Reg FD
(Panel B) and the post-Reg FD (Panel C) sample periods. Figures A2 and A3 then
present the event-time plots for the pre- and post-Reg FD sub-periods, respectively. In
the pre-Reg FD period, Figure A2 shows that the school-tie premium increases to over
700 basis points over the calendar year after recommendation changes, while in the post-
Reg FD period, Figure A3 shows that the school tie premium decreases to less than 150
basis points.
VIII. Table A8 - Clustering by Analyst
Table A8 replicates Table IV in the paper, but adjusting standard errors for
5 See Table A7 for event-time return decompositions over various horizons.

clustering at the analyst (as opposed to the recommendation month) level. Standard
error estimates are quite close to those in Table IV, and significance levels of school ties
are identical across all specifications.
IX. Table A9 - Restricted Sample and DGTW-Adjusted Returns
Table A9 contains regression specifications of Tables IV and V in the paper, for
returns following buy and sell recommendations. The two differences are that: i.) we do
the analysis on a restricted sample for which we are able to definitively identify all
potential links from the analyst to senior managers (i.e., where we have school
information for the analyst, and all three senior managers), and ii.) we do the analysis
for DGTW characteristic-adjusted returns. As seen in the table, we obtain very similar
results, in terms of both magnitude and significance, to Tables IV and V.
X. Figure A1
Figure A1 contains event time returns following linked and non-linked buy
recommendations, and following linked and non-linked sell recommendations over the
entire sample period.
XI. Figure A2
Figure A2 contains event time returns following linked and non-linked buy
recommendations, and following linked and non-linked sell recommendations in the pre-
Reg FD sample period (recommendations issued prior to October 23, 2000).
XII. Figure A3
Figure A3 contains event time returns following linked and non-linked buy
recommendations, and following linked and non-linked sell recommendations in the pre-
Reg FD sample period (recommendations issued subsequent to October 23, 2000).
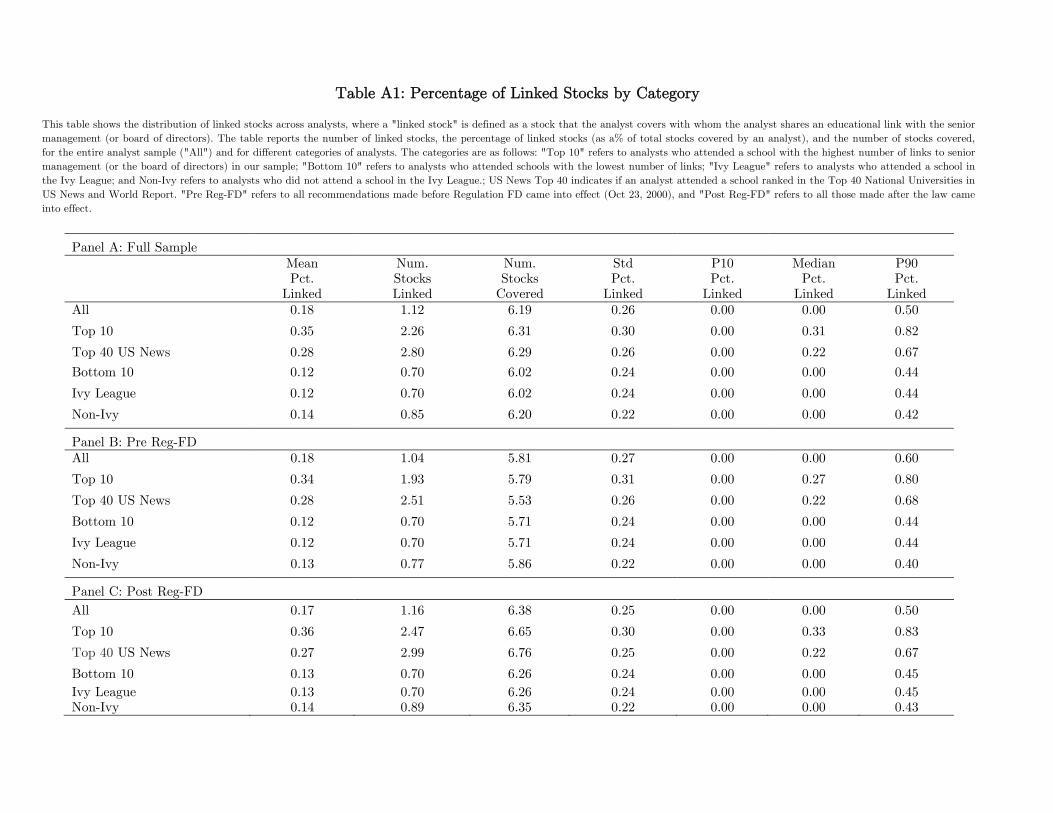
Table A1: Percentage of Linked Stocks by Category
This table shows the distribution of linked stocks across analysts, where a "linked stock" is defined as a stock that the analyst covers with whom the analyst shares an educational link with the senior
management (or board of directors). The table reports the number of linked stocks, the percentage of linked stocks (as a% of total stocks covered by an analyst), and the number of stocks covered,
for the entire analyst sample ("All") and for different categories of analysts. The categories are as follows: "Top 10" refers to analysts who attended a school with the highest number of links to senior
management (or the board of directors) in our sample; "Bottom 10" refers to analysts who attended schools with the lowest number of links; "Ivy League" refers to analysts who attended a school in
the Ivy League; and Non-Ivy refers to analysts who did not attend a school in the Ivy League.; US News Top 40 indicates if an analyst attended a school ranked in the Top 40 National Universities in
US News and World Report. "Pre Reg-FD" refers to all recommendations made before Regulation FD came into effect (Oct 23, 2000), and "Post Reg-FD" refers to all those made after the law came
into effect.
Panel A: Full Sample
Mean Pct.
Linked
Num.Stocks Linked
Num.Stocks
Covered
Std Pct.
Linked
P10Pct.
Linked
MedianPct.
Linked
P90Pct.
Linked
All 0.18 1.12 6.19 0.26 0.00 0.00 0.50
Top 10 0.35 2.26 6.31 0.30 0.00 0.31 0.82
Top 40 US News 0.28 2.80 6.29 0.26 0.00 0.22 0.67
Bottom 10 0.12 0.70 6.02 0.24 0.00 0.00 0.44
Ivy League 0.12 0.70 6.02 0.24 0.00 0.00 0.44
Non-Ivy 0.14 0.85 6.20 0.22 0.00 0.00 0.42
Panel B: Pre Reg-FD
All 0.18 1.04 5.81 0.27 0.00 0.00 0.60
Top 10 0.34 1.93 5.79 0.31 0.00 0.27 0.80
Top 40 US News 0.28 2.51 5.53 0.26 0.00 0.22 0.68
Bottom 10 0.12 0.70 5.71 0.24 0.00 0.00 0.44
Ivy League 0.12 0.70 5.71 0.24 0.00 0.00 0.44
Non-Ivy 0.13 0.77 5.86 0.22 0.00 0.00 0.40
Panel C: Post Reg-FD
All 0.17 1.16 6.38 0.25 0.00 0.00 0.50
Top 10 0.36 2.47 6.65 0.30 0.00 0.33 0.83
Top 40 US News 0.27 2.99 6.76 0.25 0.00 0.22 0.67
Bottom 10 0.13 0.70 6.26 0.24 0.00 0.00 0.45
Ivy League Non-Ivy
0.13 0.14
0.700.89
6.266.35
0.24 0.22
0.000.00
0.000.00
0.450.43
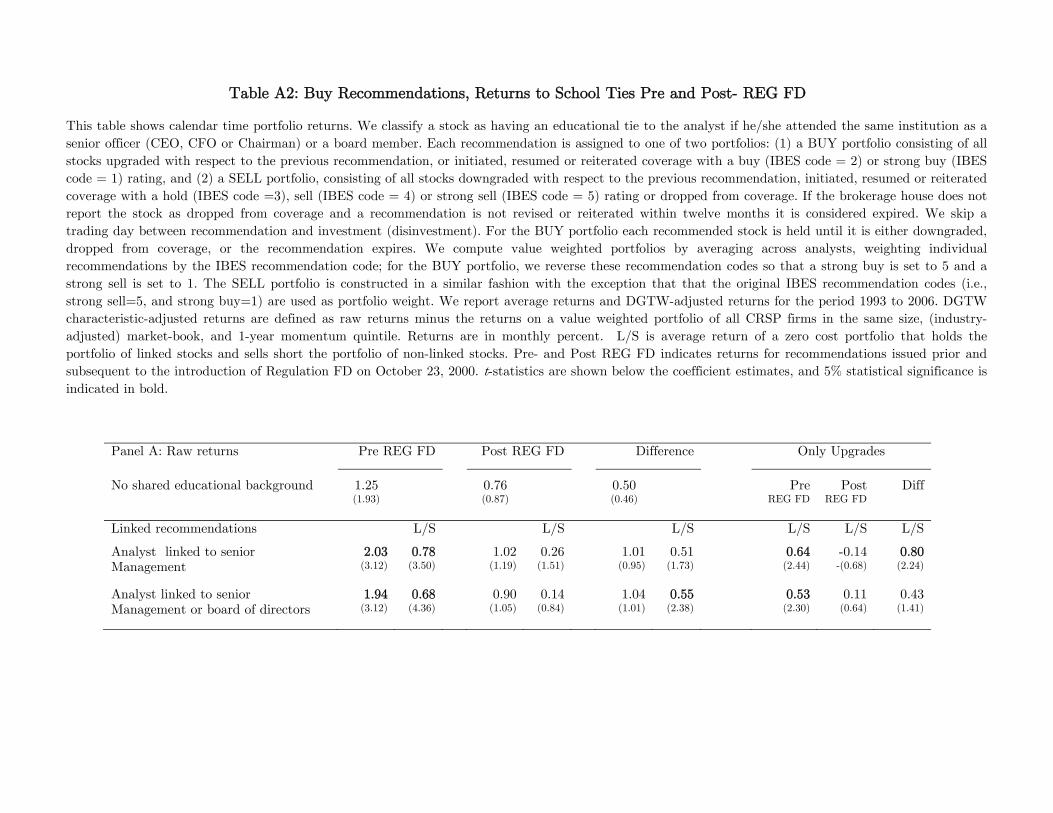
Table A2: Buy Recommendations, Returns to School Ties Pre and Post- REG FD
This table shows calendar time portfolio returns. We classify a stock as having an educational tie to the analyst if he/she attended the same institution as a
senior officer (CEO, CFO or Chairman) or a board member. Each recommendation is assigned to one of two portfolios: (1) a BUY portfolio consisting of all
stocks upgraded with respect to the previous recommendation, or initiated, resumed or reiterated coverage with a buy (IBES code = 2) or strong buy (IBES
code = 1) rating, and (2) a SELL portfolio, consisting of all stocks downgraded with respect to the previous recommendation, initiated, resumed or reiterated
coverage with a hold (IBES code =3), sell (IBES code = 4) or strong sell (IBES code = 5) rating or dropped from coverage. If the brokerage house does not
report the stock as dropped from coverage and a recommendation is not revised or reiterated within twelve months it is considered expired. We skip a
trading day between recommendation and investment (disinvestment). For the BUY portfolio each recommended stock is held until it is either downgraded,
dropped from coverage, or the recommendation expires. We compute value weighted portfolios by averaging across analysts, weighting individual
recommendations by the IBES recommendation code; for the BUY portfolio, we reverse these recommendation codes so that a strong buy is set to 5 and a
strong sell is set to 1. The SELL portfolio is constructed in a similar fashion with the exception that that the original IBES recommendation codes (i.e.,
strong sell=5, and strong buy=1) are used as portfolio weight. We report average returns and DGTW-adjusted returns for the period 1993 to 2006. DGTW
characteristic-adjusted returns are defined as raw returns minus the returns on a value weighted portfolio of all CRSP firms in the same size, (industry-
adjusted) market-book, and 1-year momentum quintile. Returns are in monthly percent. L/S is average return of a zero cost portfolio that holds the
portfolio of linked stocks and sells short the portfolio of non-linked stocks. Pre- and Post REG FD indicates returns for recommendations issued prior and
subsequent to the introduction of Regulation FD on October 23, 2000. t-statistics are shown below the coefficient estimates, and 5% statistical significance is
indicated in bold.
Panel A: Raw returns Pre REG FD Post REG FD Difference Only Upgrades
No shared educational background 1.25 0.76 0.50 Pre Post Diff (1.93) (0.87) (0.46) REG FD REG FD
Linked recommendations L/S L/S L/S L/S L/S L/S
Analyst linked to senior 2.03 0.78 1.02 0.26 1.01 0.51 0.64 -0.14 0.80Management (3.12) (3.50) (1.19) (1.51) (0.95) (1.73) (2.44) -(0.68) (2.24)
Analyst linked to senior 1.94 0.68 0.90 0.14 1.04 0.55 0.53 0.11 0.43Management or board of directors (3.12) (4.36) (1.05) (0.84) (1.01) (2.38) (2.30) (0.64) (1.41)
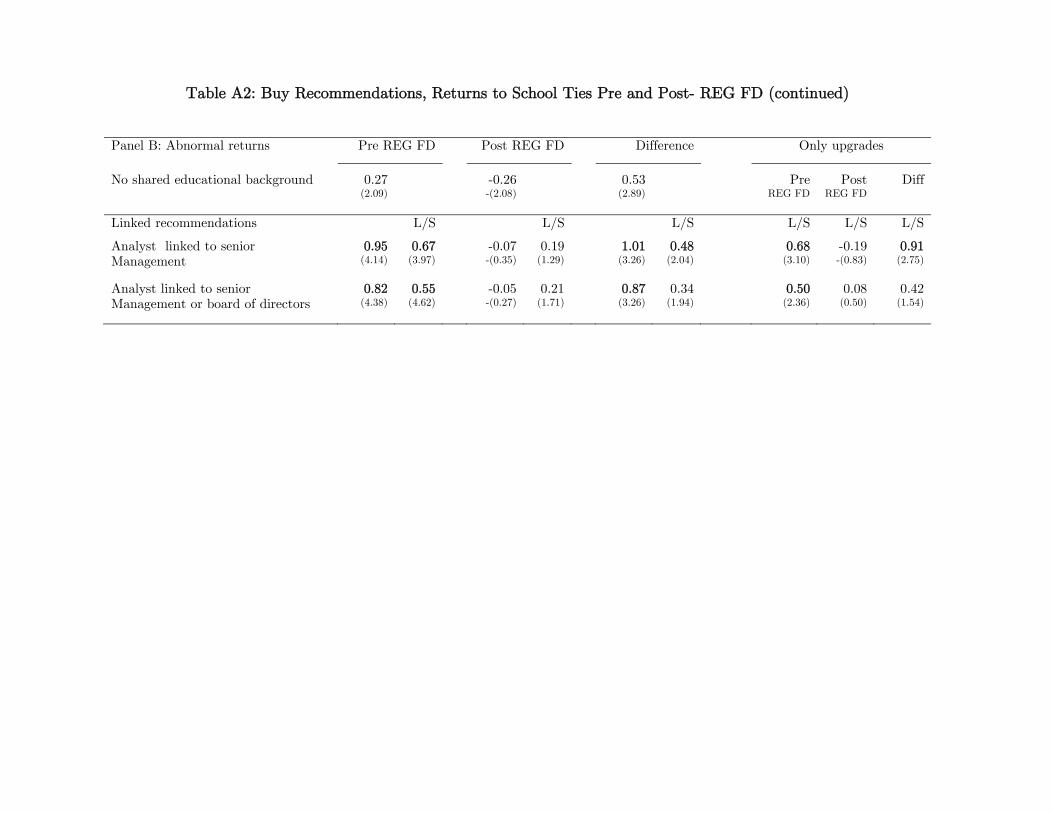
Table A2: Buy Recommendations, Returns to School Ties Pre and Post- REG FD (continued)
Panel B: Abnormal returns Pre REG FD Post REG FD Difference Only upgrades
No shared educational background 0.27 -0.26 0.53 Pre Post Diff (2.09) -(2.08) (2.89) REG FD REG FD
Linked recommendations L/S L/S L/S L/S L/S L/S
Analyst linked to senior 0.95 0.67 -0.07 0.19 1.01 0.48 0.68 -0.19 0.91Management (4.14) (3.97) -(0.35) (1.29) (3.26) (2.04) (3.10) -(0.83) (2.75)
Analyst linked to senior 0.82 0.55 -0.05 0.21 0.87 0.34 0.50 0.08 0.42Management or board of directors (4.38) (4.62) -(0.27) (1.71) (3.26) (1.94) (2.36) (0.50) (1.54)
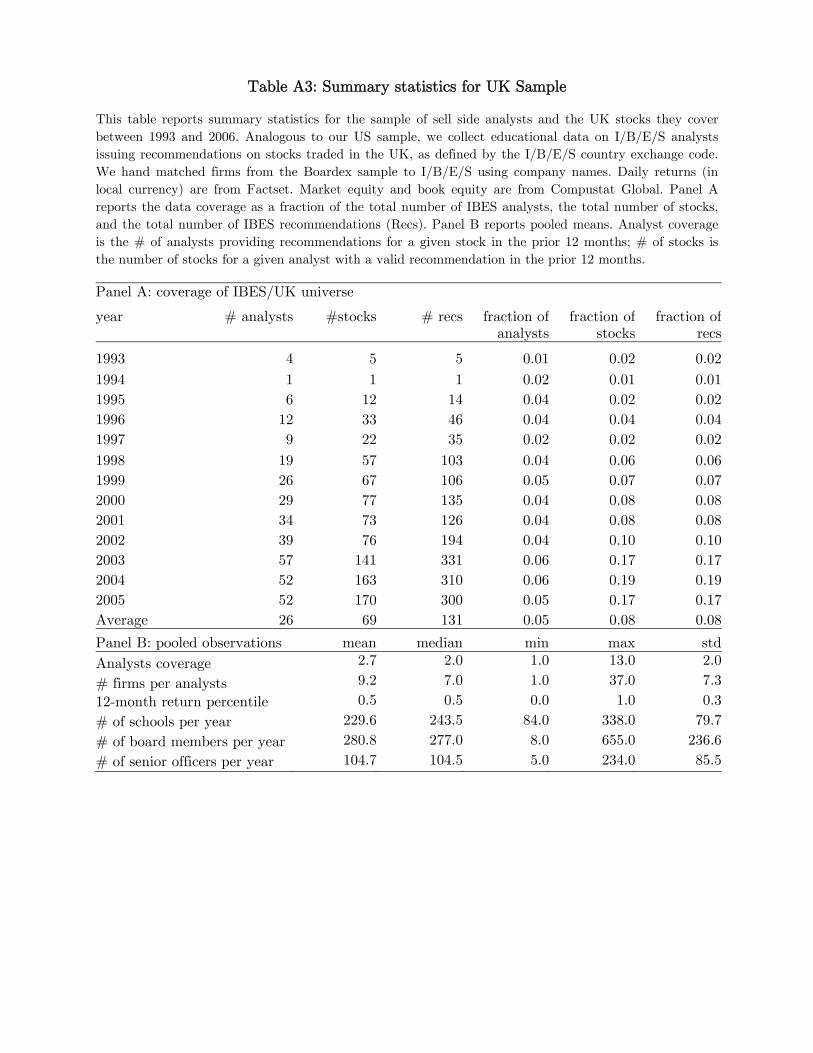
Table A3: Summary statistics for UK Sample
This table reports summary statistics for the sample of sell side analysts and the UK stocks they cover
between 1993 and 2006. Analogous to our US sample, we collect educational data on I/B/E/S analysts
issuing recommendations on stocks traded in the UK, as defined by the I/B/E/S country exchange code.
We hand matched firms from the Boardex sample to I/B/E/S using company names. Daily returns (in
local currency) are from Factset. Market equity and book equity are from Compustat Global. Panel A
reports the data coverage as a fraction of the total number of IBES analysts, the total number of stocks,
and the total number of IBES recommendations (Recs). Panel B reports pooled means. Analyst coverage
is the # of analysts providing recommendations for a given stock in the prior 12 months; # of stocks is
the number of stocks for a given analyst with a valid recommendation in the prior 12 months.
Panel A: coverage of IBES/UK universe
year # analysts #stocks # recs fraction of analysts
fraction of stocks
fraction of recs
1993 4 5 5 0.01 0.02 0.02
1994 1 1 1 0.02 0.01 0.01
1995 6 12 14 0.04 0.02 0.02
1996 12 33 46 0.04 0.04 0.04
1997 9 22 35 0.02 0.02 0.02
1998 19 57 103 0.04 0.06 0.06
1999 26 67 106 0.05 0.07 0.07
2000 29 77 135 0.04 0.08 0.08
2001 34 73 126 0.04 0.08 0.08
2002 39 76 194 0.04 0.10 0.10
2003 57 141 331 0.06 0.17 0.17
2004 52 163 310 0.06 0.19 0.19
2005 52 170 300 0.05 0.17 0.17
Average 26 69 131 0.05 0.08 0.08
Panel B: pooled observations mean median min max std
Analysts coverage 2.7 2.0 1.0 13.0 2.0
# firms per analysts 9.2 7.0 1.0 37.0 7.3
12-month return percentile 0.5 0.5 0.0 1.0 0.3
# of schools per year 229.6 243.5 84.0 338.0 79.7
# of board members per year 280.8 277.0 8.0 655.0 236.6
# of senior officers per year 104.7 104.5 5.0 234.0 85.5
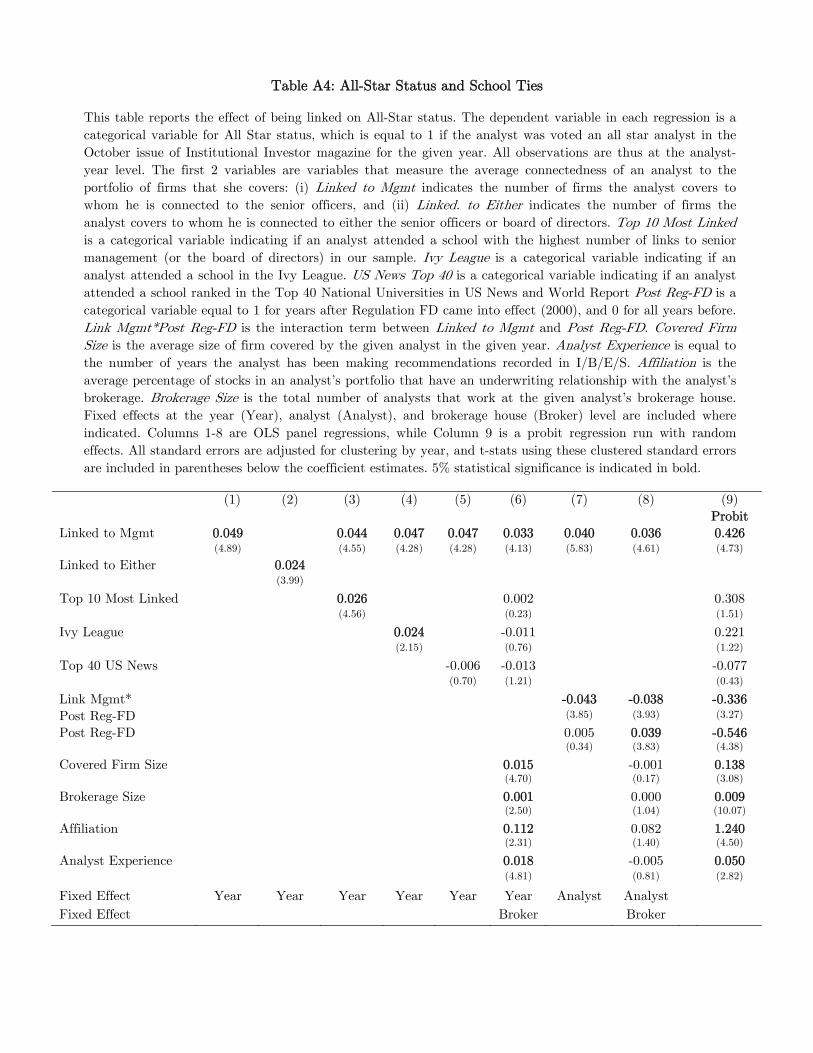
Table A4: All-Star Status and School Ties
This table reports the effect of being linked on All-Star status. The dependent variable in each regression is a
categorical variable for All Star status, which is equal to 1 if the analyst was voted an all star analyst in the
October issue of Institutional Investor magazine for the given year. All observations are thus at the analyst-
year level. The first 2 variables are variables that measure the average connectedness of an analyst to the
portfolio of firms that she covers: (i) Linked to Mgmt indicates the number of firms the analyst covers to
whom he is connected to the senior officers, and (ii) Linked. to Either indicates the number of firms the
analyst covers to whom he is connected to either the senior officers or board of directors. Top 10 Most Linked
is a categorical variable indicating if an analyst attended a school with the highest number of links to senior
management (or the board of directors) in our sample. Ivy League is a categorical variable indicating if an
analyst attended a school in the Ivy League. US News Top 40 is a categorical variable indicating if an analyst
attended a school ranked in the Top 40 National Universities in US News and World Report Post Reg-FD is a
categorical variable equal to 1 for years after Regulation FD came into effect (2000), and 0 for all years before.
Link Mgmt*Post Reg-FD is the interaction term between Linked to Mgmt and Post Reg-FD. Covered Firm
Size is the average size of firm covered by the given analyst in the given year. Analyst Experience is equal to
the number of years the analyst has been making recommendations recorded in I/B/E/S. Affiliation is the
average percentage of stocks in an analyst’s portfolio that have an underwriting relationship with the analyst’s
brokerage. Brokerage Size is the total number of analysts that work at the given analyst’s brokerage house.
Fixed effects at the year (Year), analyst (Analyst), and brokerage house (Broker) level are included where
indicated. Columns 1-8 are OLS panel regressions, while Column 9 is a probit regression run with random
effects. All standard errors are adjusted for clustering by year, and t-stats using these clustered standard errors
are included in parentheses below the coefficient estimates. 5% statistical significance is indicated in bold.
(1) (2) (3) (4) (5) (6) (7) (8) (9)
Probit
Linked to Mgmt 0.049 0.044 0.047 0.047 0.033 0.040 0.036 0.426
(4.89) (4.55) (4.28) (4.28) (4.13) (5.83) (4.61) (4.73)
Linked to Either 0.024 (3.99)
Top 10 Most Linked 0.026 0.002 0.308
(4.56) (0.23) (1.51)
Ivy League 0.024 -0.011 0.221
(2.15) (0.76) (1.22)
Top 40 US News -0.006 -0.013 -0.077
(0.70) (1.21) (0.43)
Link Mgmt* -0.043 -0.038 -0.336
Post Reg-FD (3.85) (3.93) (3.27)
Post Reg-FD 0.005 0.039 -0.546 (0.34) (3.83) (4.38)
Covered Firm Size 0.015 -0.001 0.138 (4.70) (0.17) (3.08)
Brokerage Size 0.001 0.000 0.009 (2.50) (1.04) (10.07)
Affiliation 0.112 0.082 1.240 (2.31) (1.40) (4.50)
Analyst Experience 0.018 -0.005 0.050
(4.81) (0.81) (2.82)
Fixed Effect Year Year Year Year Year Year Analyst Analyst
Fixed Effect Broker Broker
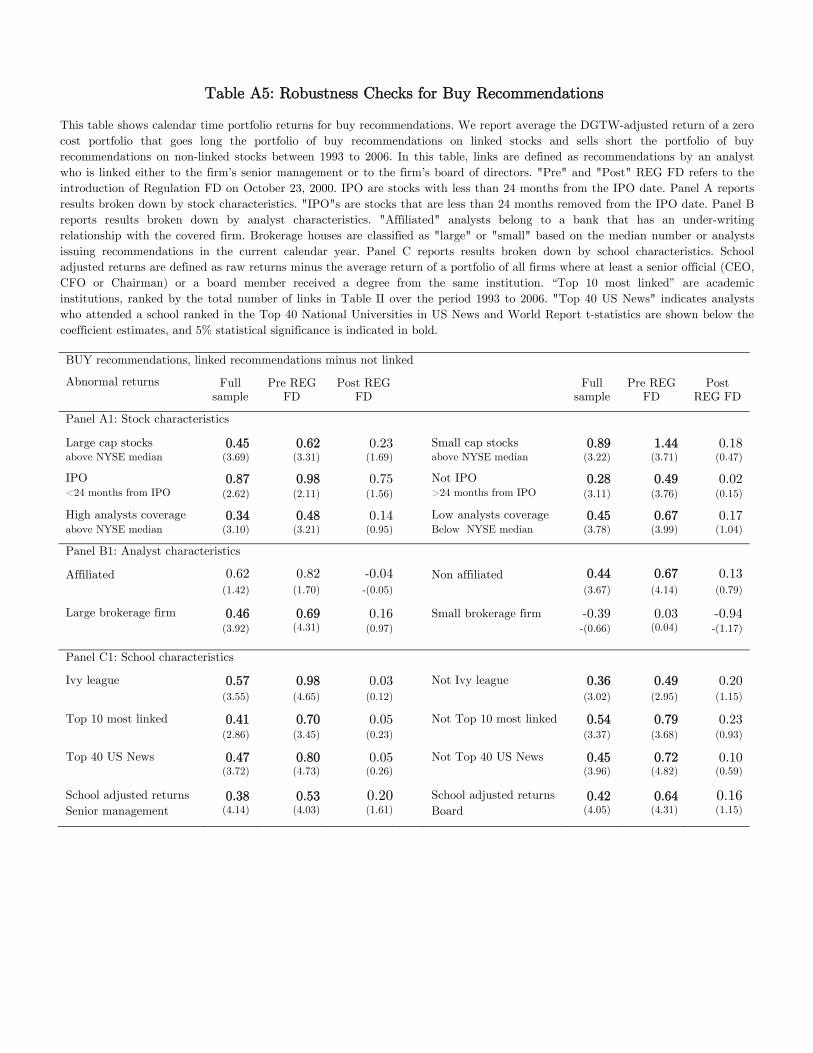
Table A5: Robustness Checks for Buy Recommendations
This table shows calendar time portfolio returns for buy recommendations. We report average the DGTW-adjusted return of a zero
cost portfolio that goes long the portfolio of buy recommendations on linked stocks and sells short the portfolio of buy
recommendations on non-linked stocks between 1993 to 2006. In this table, links are defined as recommendations by an analyst
who is linked either to the firm’s senior management or to the firm’s board of directors. "Pre" and "Post" REG FD refers to the
introduction of Regulation FD on October 23, 2000. IPO are stocks with less than 24 months from the IPO date. Panel A reports
results broken down by stock characteristics. "IPO"s are stocks that are less than 24 months removed from the IPO date. Panel B
reports results broken down by analyst characteristics. "Affiliated" analysts belong to a bank that has an under-writing
relationship with the covered firm. Brokerage houses are classified as "large" or "small" based on the median number or analysts
issuing recommendations in the current calendar year. Panel C reports results broken down by school characteristics. School
adjusted returns are defined as raw returns minus the average return of a portfolio of all firms where at least a senior official (CEO,
CFO or Chairman) or a board member received a degree from the same institution. “Top 10 most linked” are academic
institutions, ranked by the total number of links in Table II over the period 1993 to 2006. "Top 40 US News" indicates analysts
who attended a school ranked in the Top 40 National Universities in US News and World Report t-statistics are shown below the
coefficient estimates, and 5% statistical significance is indicated in bold.
BUY recommendations, linked recommendations minus not linked
Abnormal returns Full sample
Pre REG FD
Post REG FD
Full sample
Pre REG FD
Post REG FD
Panel A1: Stock characteristics
Large cap stocks 0.45 0.62 0.23 Small cap stocks 0.89 1.44 0.18above NYSE median (3.69) (3.31) (1.69) above NYSE median (3.22) (3.71) (0.47)
IPO 0.87 0.98 0.75 Not IPO 0.28 0.49 0.02<24 months from IPO (2.62) (2.11) (1.56) >24 months from IPO (3.11) (3.76) (0.15)
High analysts coverage 0.34 0.48 0.14 Low analysts coverage 0.45 0.67 0.17above NYSE median (3.10) (3.21) (0.95) Below NYSE median (3.78) (3.99) (1.04)
Panel B1: Analyst characteristics
Affiliated 0.62 0.82 -0.04 Non affiliated 0.44 0.67 0.13
(1.42) (1.70) -(0.05) (3.67) (4.14) (0.79)
Large brokerage firm 0.46 0.69 0.16 Small brokerage firm -0.39 0.03 -0.94 (3.92) (4.31) (0.97) -(0.66) (0.04) -(1.17)
Panel C1: School characteristics
Ivy league 0.57 0.98 0.03 Not Ivy league 0.36 0.49 0.20 (3.55) (4.65) (0.12) (3.02) (2.95) (1.15)
Top 10 most linked 0.41 0.70 0.05 Not Top 10 most linked 0.54 0.79 0.23 (2.86) (3.45) (0.23) (3.37) (3.68) (0.93)
Top 40 US News 0.47 0.80 0.05 Not Top 40 US News 0.45 0.72 0.10 (3.72) (4.73) (0.26) (3.96) (4.82) (0.59)
School adjusted returns 0.38 0.53 0.20 School adjusted returns 0.42 0.64 0.16Senior management (4.14) (4.03) (1.61) Board (4.05) (4.31) (1.15)
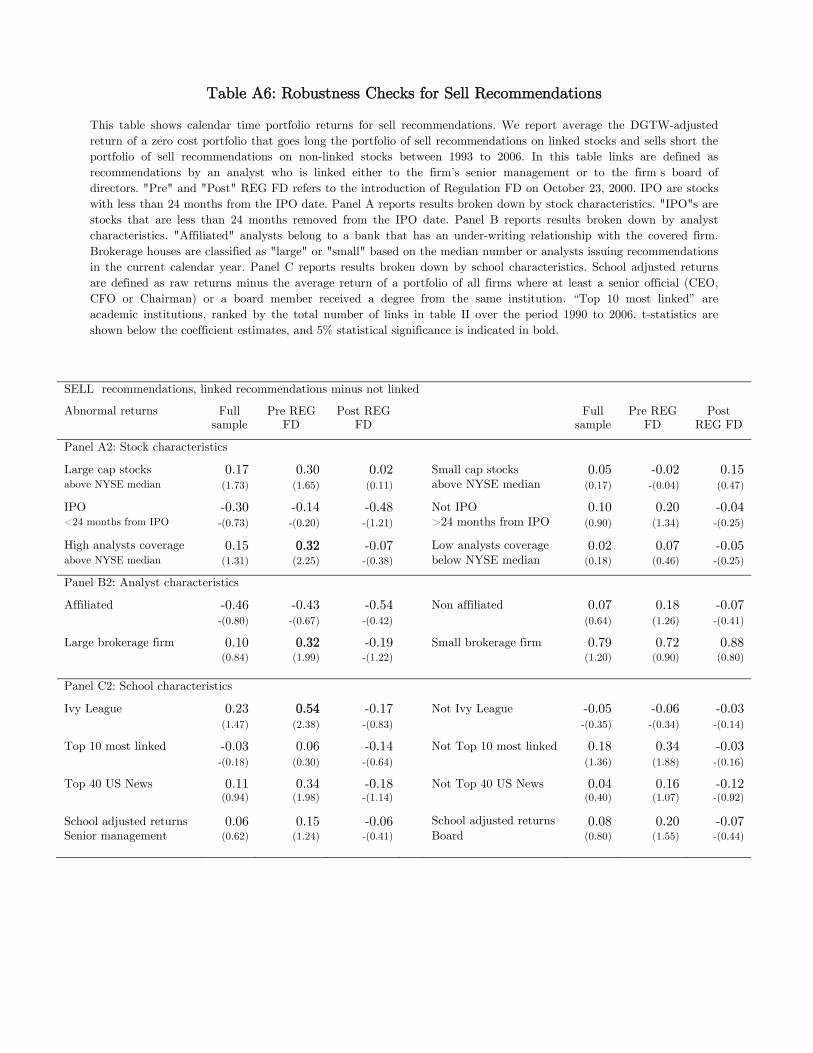
Table A6: Robustness Checks for Sell Recommendations
This table shows calendar time portfolio returns for sell recommendations. We report average the DGTW-adjusted
return of a zero cost portfolio that goes long the portfolio of sell recommendations on linked stocks and sells short the
portfolio of sell recommendations on non-linked stocks between 1993 to 2006. In this table links are defined as
recommendations by an analyst who is linked either to the firm’s senior management or to the firm's board of
directors. "Pre" and "Post" REG FD refers to the introduction of Regulation FD on October 23, 2000. IPO are stocks
with less than 24 months from the IPO date. Panel A reports results broken down by stock characteristics. "IPO"s are
stocks that are less than 24 months removed from the IPO date. Panel B reports results broken down by analyst
characteristics. "Affiliated" analysts belong to a bank that has an under-writing relationship with the covered firm.
Brokerage houses are classified as "large" or "small" based on the median number or analysts issuing recommendations
in the current calendar year. Panel C reports results broken down by school characteristics. School adjusted returns
are defined as raw returns minus the average return of a portfolio of all firms where at least a senior official (CEO,
CFO or Chairman) or a board member received a degree from the same institution. “Top 10 most linked” are
academic institutions, ranked by the total number of links in table II over the period 1990 to 2006. t-statistics are
shown below the coefficient estimates, and 5% statistical significance is indicated in bold.
SELL recommendations, linked recommendations minus not linked
Abnormal returns Full sample
Pre REG FD
Post REG FD
Full sample
Pre REG FD
Post REG FD
Panel A2: Stock characteristics
Large cap stocks 0.17 0.30 0.02 Small cap stocks 0.05 -0.02 0.15above NYSE median (1.73) (1.65) (0.11) above NYSE median (0.17) -(0.04) (0.47)
IPO -0.30 -0.14 -0.48 Not IPO 0.10 0.20 -0.04<24 months from IPO -(0.73) -(0.20) -(1.21) >24 months from IPO (0.90) (1.34) -(0.25)
High analysts coverage 0.15 0.32 -0.07 Low analysts coverage 0.02 0.07 -0.05above NYSE median (1.31) (2.25) -(0.38) below NYSE median (0.18) (0.46) -(0.25)
Panel B2: Analyst characteristics
Affiliated -0.46 -0.43 -0.54 Non affiliated 0.07 0.18 -0.07 -(0.80) -(0.67) -(0.42) (0.64) (1.26) -(0.41)
Large brokerage firm 0.10 0.32 -0.19 Small brokerage firm 0.79 0.72 0.88
(0.84) (1.99) -(1.22) (1.20) (0.90) (0.80)
Panel C2: School characteristics
Ivy League 0.23 0.54 -0.17 Not Ivy League -0.05 -0.06 -0.03 (1.47) (2.38) -(0.83) -(0.35) -(0.34) -(0.14)
Top 10 most linked -0.03 0.06 -0.14 Not Top 10 most linked 0.18 0.34 -0.03 -(0.18) (0.30) -(0.64) (1.36) (1.88) -(0.16)
Top 40 US News 0.11 0.34 -0.18 Not Top 40 US News 0.04 0.16 -0.12 (0.94) (1.98) -(1.14) (0.40) (1.07) -(0.92)
School adjusted returns 0.06 0.15 -0.06 School adjusted returns 0.08 0.20 -0.07Senior management (0.62) (1.24) -(0.41) Board (0.80) (1.55) -(0.44)
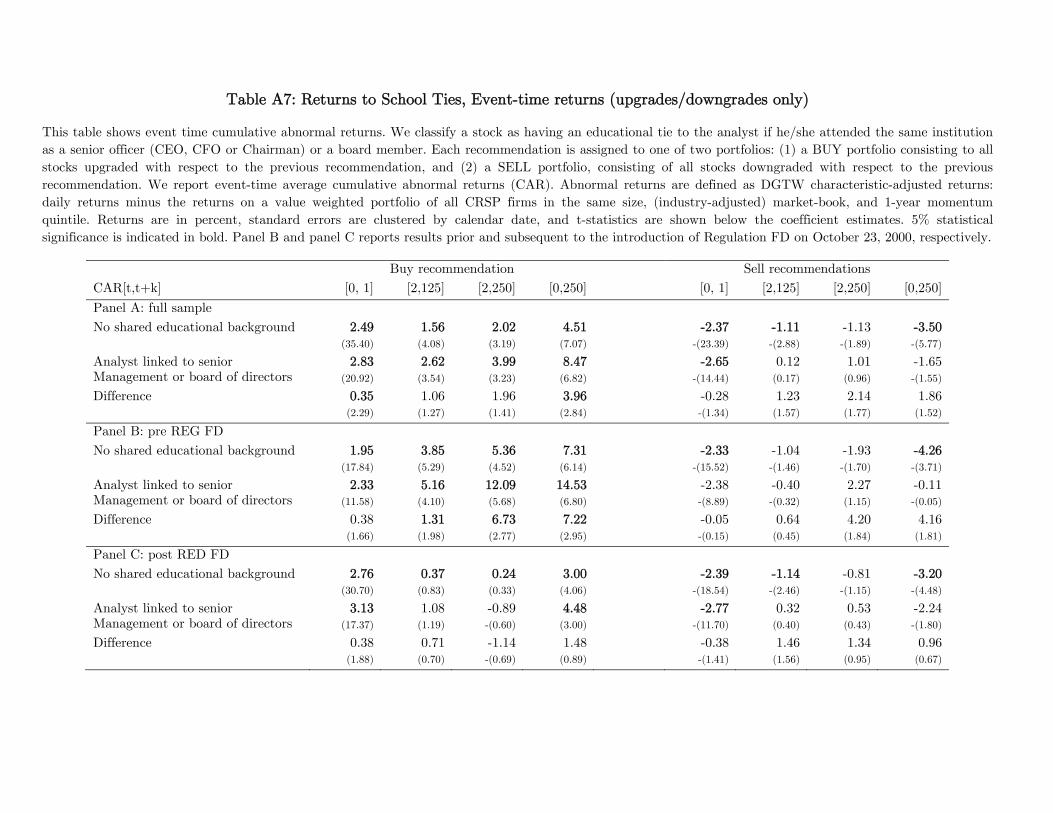
Table A7: Returns to School Ties, Event-time returns (upgrades/downgrades only)
This table shows event time cumulative abnormal returns. We classify a stock as having an educational tie to the analyst if he/she attended the same institution
as a senior officer (CEO, CFO or Chairman) or a board member. Each recommendation is assigned to one of two portfolios: (1) a BUY portfolio consisting to all
stocks upgraded with respect to the previous recommendation, and (2) a SELL portfolio, consisting of all stocks downgraded with respect to the previous
recommendation. We report event-time average cumulative abnormal returns (CAR). Abnormal returns are defined as DGTW characteristic-adjusted returns:
daily returns minus the returns on a value weighted portfolio of all CRSP firms in the same size, (industry-adjusted) market-book, and 1-year momentum
quintile. Returns are in percent, standard errors are clustered by calendar date, and t-statistics are shown below the coefficient estimates. 5% statistical
significance is indicated in bold. Panel B and panel C reports results prior and subsequent to the introduction of Regulation FD on October 23, 2000, respectively.
Buy recommendation Sell recommendations
CAR[t,t+k] [0, 1] [2,125] [2,250] [0,250] [0, 1] [2,125] [2,250] [0,250]
Panel A: full sample
No shared educational background 2.49 1.56 2.02 4.51 -2.37 -1.11 -1.13 -3.50 (35.40) (4.08) (3.19) (7.07) -(23.39) -(2.88) -(1.89) -(5.77)
Analyst linked to senior 2.83 2.62 3.99 8.47 -2.65 0.12 1.01 -1.65Management or board of directors (20.92) (3.54) (3.23) (6.82) -(14.44) (0.17) (0.96) -(1.55)
Difference 0.35 1.06 1.96 3.96 -0.28 1.23 2.14 1.86 (2.29) (1.27) (1.41) (2.84) -(1.34) (1.57) (1.77) (1.52)
Panel B: pre REG FD
No shared educational background 1.95 3.85 5.36 7.31 -2.33 -1.04 -1.93 -4.26 (17.84) (5.29) (4.52) (6.14) -(15.52) -(1.46) -(1.70) -(3.71)
Analyst linked to senior 2.33 5.16 12.09 14.53 -2.38 -0.40 2.27 -0.11Management or board of directors (11.58) (4.10) (5.68) (6.80) -(8.89) -(0.32) (1.15) -(0.05)
Difference 0.38 1.31 6.73 7.22 -0.05 0.64 4.20 4.16 (1.66) (1.98) (2.77) (2.95) -(0.15) (0.45) (1.84) (1.81)
Panel C: post RED FD
No shared educational background 2.76 0.37 0.24 3.00 -2.39 -1.14 -0.81 -3.20 (30.70) (0.83) (0.33) (4.06) -(18.54) -(2.46) -(1.15) -(4.48)
Analyst linked to senior 3.13 1.08 -0.89 4.48 -2.77 0.32 0.53 -2.24Management or board of directors (17.37) (1.19) -(0.60) (3.00) -(11.70) (0.40) (0.43) -(1.80)
Difference 0.38 0.71 -1.14 1.48 -0.38 1.46 1.34 0.96 (1.88) (0.70) -(0.69) (0.89) -(1.41) (1.56) (0.95) (0.67)
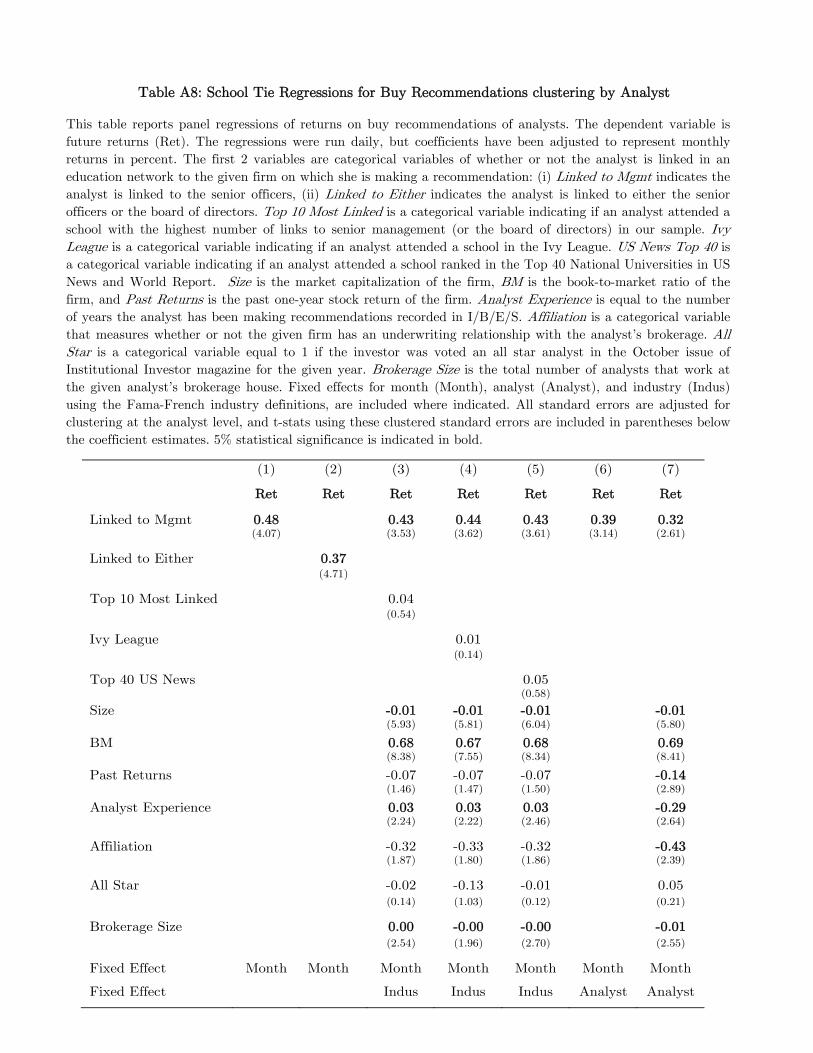
Table A8: School Tie Regressions for Buy Recommendations clustering by Analyst
This table reports panel regressions of returns on buy recommendations of analysts. The dependent variable is
future returns (Ret). The regressions were run daily, but coefficients have been adjusted to represent monthly
returns in percent. The first 2 variables are categorical variables of whether or not the analyst is linked in an
education network to the given firm on which she is making a recommendation: (i) Linked to Mgmt indicates the
analyst is linked to the senior officers, (ii) Linked to Either indicates the analyst is linked to either the senior
officers or the board of directors. Top 10 Most Linked is a categorical variable indicating if an analyst attended a
school with the highest number of links to senior management (or the board of directors) in our sample. Ivy
League is a categorical variable indicating if an analyst attended a school in the Ivy League. US News Top 40 is
a categorical variable indicating if an analyst attended a school ranked in the Top 40 National Universities in US
News and World Report. Size is the market capitalization of the firm, BM is the book-to-market ratio of the
firm, and Past Returns is the past one-year stock return of the firm. Analyst Experience is equal to the number
of years the analyst has been making recommendations recorded in I/B/E/S. Affiliation is a categorical variable
that measures whether or not the given firm has an underwriting relationship with the analyst’s brokerage. All
Star is a categorical variable equal to 1 if the investor was voted an all star analyst in the October issue of
Institutional Investor magazine for the given year. Brokerage Size is the total number of analysts that work at
the given analyst’s brokerage house. Fixed effects for month (Month), analyst (Analyst), and industry (Indus)
using the Fama-French industry definitions, are included where indicated. All standard errors are adjusted for
clustering at the analyst level, and t-stats using these clustered standard errors are included in parentheses below
the coefficient estimates. 5% statistical significance is indicated in bold.
(1) (2) (3) (4) (5) (6) (7)
Ret Ret Ret Ret Ret Ret Ret
Linked to Mgmt 0.48 0.43 0.44 0.43 0.39 0.32 (4.07) (3.53) (3.62) (3.61) (3.14) (2.61)
Linked to Either 0.37 (4.71)
Top 10 Most Linked 0.04
(0.54)
Ivy League 0.01
(0.14)
Top 40 US News 0.05
(0.58) Size -0.01 -0.01 -0.01 -0.01
(5.93) (5.81) (6.04) (5.80)
BM 0.68 0.67 0.68 0.69 (8.38) (7.55) (8.34) (8.41)
Past Returns -0.07 -0.07 -0.07 -0.14
(1.46) (1.47) (1.50) (2.89)
Analyst Experience 0.03 0.03 0.03 -0.29 (2.24) (2.22) (2.46) (2.64)
Affiliation -0.32 -0.33 -0.32 -0.43 (1.87) (1.80) (1.86) (2.39)
All Star -0.02 -0.13 -0.01 0.05
(0.14) (1.03) (0.12) (0.21)
Brokerage Size 0.00 -0.00 -0.00 -0.01
(2.54) (1.96) (2.70) (2.55)
Fixed Effect Month Month Month Month Month Month Month
Fixed Effect Indus Indus Indus Analyst Analyst
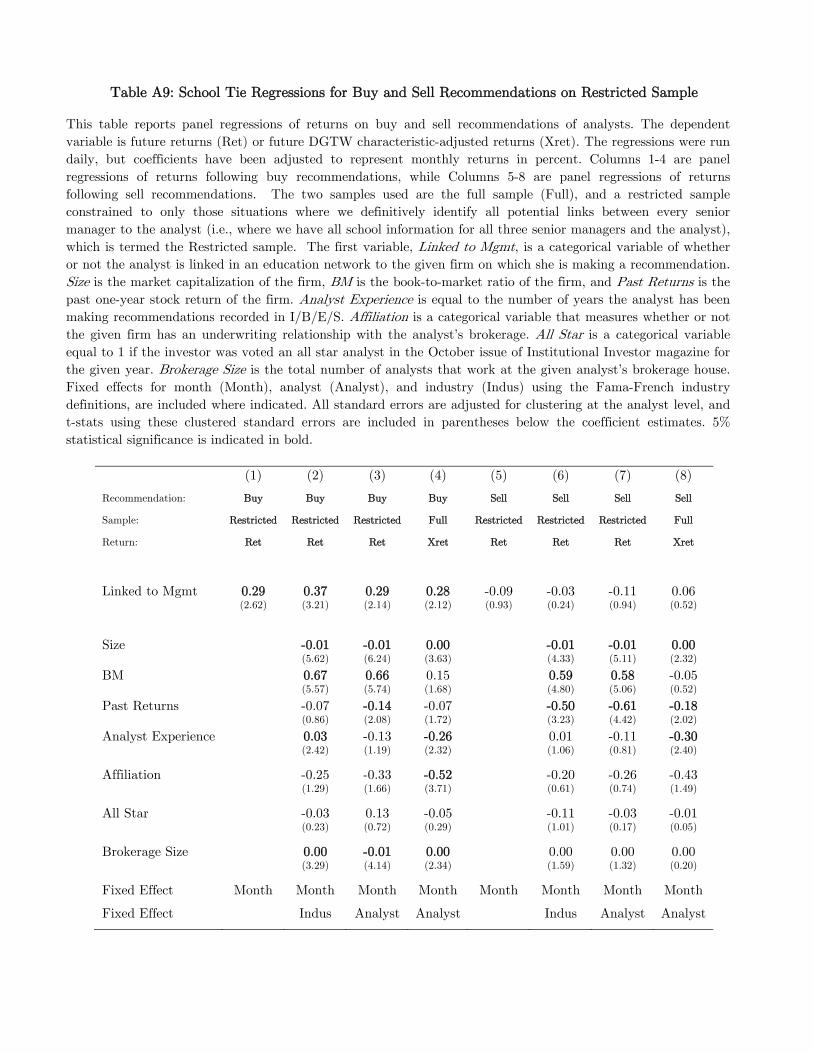
Table A9: School Tie Regressions for Buy and Sell Recommendations on Restricted Sample
This table reports panel regressions of returns on buy and sell recommendations of analysts. The dependent
variable is future returns (Ret) or future DGTW characteristic-adjusted returns (Xret). The regressions were run
daily, but coefficients have been adjusted to represent monthly returns in percent. Columns 1-4 are panel
regressions of returns following buy recommendations, while Columns 5-8 are panel regressions of returns
following sell recommendations. The two samples used are the full sample (Full), and a restricted sample
constrained to only those situations where we definitively identify all potential links between every senior
manager to the analyst (i.e., where we have all school information for all three senior managers and the analyst),
which is termed the Restricted sample. The first variable, Linked to Mgmt, is a categorical variable of whether
or not the analyst is linked in an education network to the given firm on which she is making a recommendation.
Size is the market capitalization of the firm, BM is the book-to-market ratio of the firm, and Past Returns is the
past one-year stock return of the firm. Analyst Experience is equal to the number of years the analyst has been
making recommendations recorded in I/B/E/S. Affiliation is a categorical variable that measures whether or not
the given firm has an underwriting relationship with the analyst’s brokerage. All Star is a categorical variable
equal to 1 if the investor was voted an all star analyst in the October issue of Institutional Investor magazine for
the given year. Brokerage Size is the total number of analysts that work at the given analyst’s brokerage house.
Fixed effects for month (Month), analyst (Analyst), and industry (Indus) using the Fama-French industry
definitions, are included where indicated. All standard errors are adjusted for clustering at the analyst level, and
t-stats using these clustered standard errors are included in parentheses below the coefficient estimates. 5%
statistical significance is indicated in bold.
(1) (2) (3) (4) (5) (6) (7) (8)
Recommendation: Buy Buy Buy Buy Sell Sell Sell Sell
Sample: Restricted Restricted Restricted Full Restricted Restricted Restricted Full
Return: Ret Ret Ret Xret Ret Ret Ret Xret
Linked to Mgmt 0.29 0.37 0.29 0.28 -0.09 -0.03 -0.11 0.06 (2.62) (3.21) (2.14) (2.12) (0.93) (0.24) (0.94) (0.52)
Size -0.01 -0.01 0.00 -0.01 -0.01 0.00 (5.62) (6.24) (3.63) (4.33) (5.11) (2.32)
BM 0.67 0.66 0.15 0.59 0.58 -0.05 (5.57) (5.74) (1.68) (4.80) (5.06) (0.52)
Past Returns -0.07 -0.14 -0.07 -0.50 -0.61 -0.18 (0.86) (2.08) (1.72) (3.23) (4.42) (2.02)
Analyst Experience 0.03 -0.13 -0.26 0.01 -0.11 -0.30 (2.42) (1.19) (2.32) (1.06) (0.81) (2.40)
Affiliation -0.25 -0.33 -0.52 -0.20 -0.26 -0.43 (1.29) (1.66) (3.71) (0.61) (0.74) (1.49)
All Star -0.03 0.13 -0.05 -0.11 -0.03 -0.01 (0.23) (0.72) (0.29) (1.01) (0.17) (0.05)
Brokerage Size 0.00 -0.01 0.00 0.00 0.00 0.00 (3.29) (4.14) (2.34) (1.59) (1.32) (0.20)
Fixed Effect Month Month Month Month Month Month Month Month
Fixed Effect Indus Analyst Analyst Indus Analyst Analyst
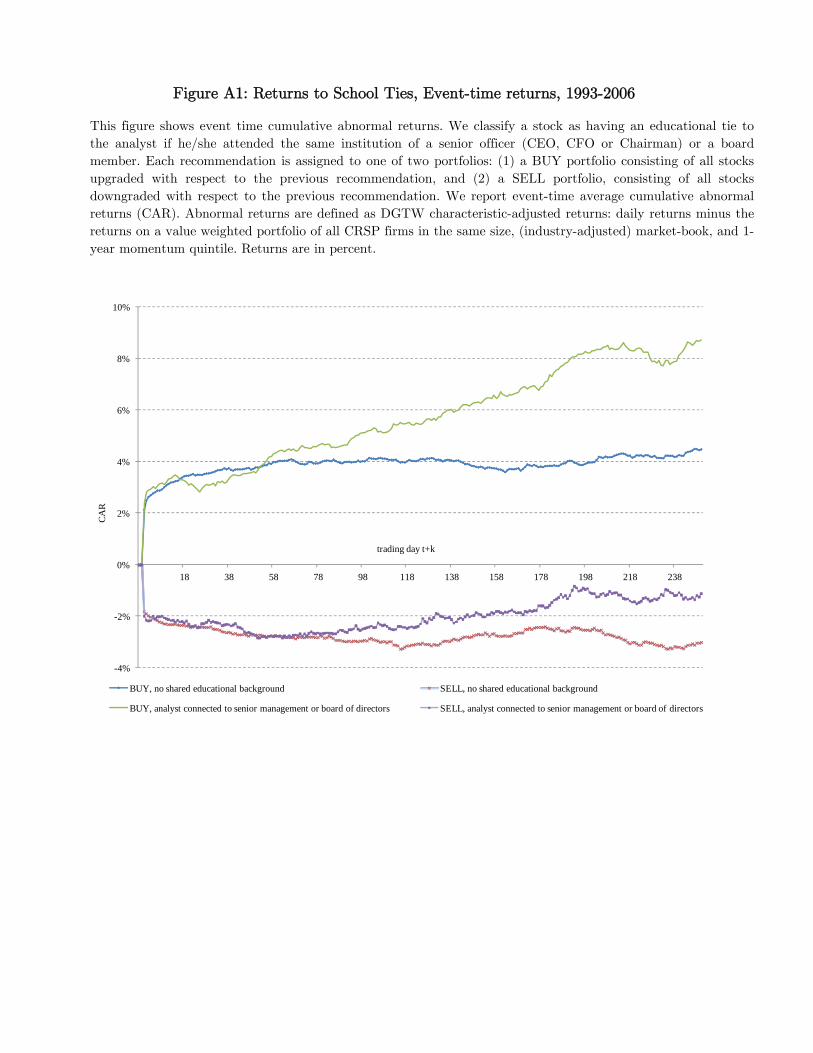
Figure A1: Returns to School Ties, Event-time returns, 1993-2006
This figure shows event time cumulative abnormal returns. We classify a stock as having an educational tie to
the analyst if he/she attended the same institution of a senior officer (CEO, CFO or Chairman) or a board
member. Each recommendation is assigned to one of two portfolios: (1) a BUY portfolio consisting of all stocks
upgraded with respect to the previous recommendation, and (2) a SELL portfolio, consisting of all stocks
downgraded with respect to the previous recommendation. We report event-time average cumulative abnormal
returns (CAR). Abnormal returns are defined as DGTW characteristic-adjusted returns: daily returns minus the
returns on a value weighted portfolio of all CRSP firms in the same size, (industry-adjusted) market-book, and 1-
year momentum quintile. Returns are in percent.
-4%
-2%
0%
2%
4%
6%
8%
10%
18 38 58 78 98 118 138 158 178 198 218 238
CA
R
trading day t+k
BUY, no shared educational background SELL, no shared educational background
BUY, analyst connected to senior management or board of directors SELL, analyst connected to senior management or board of directors
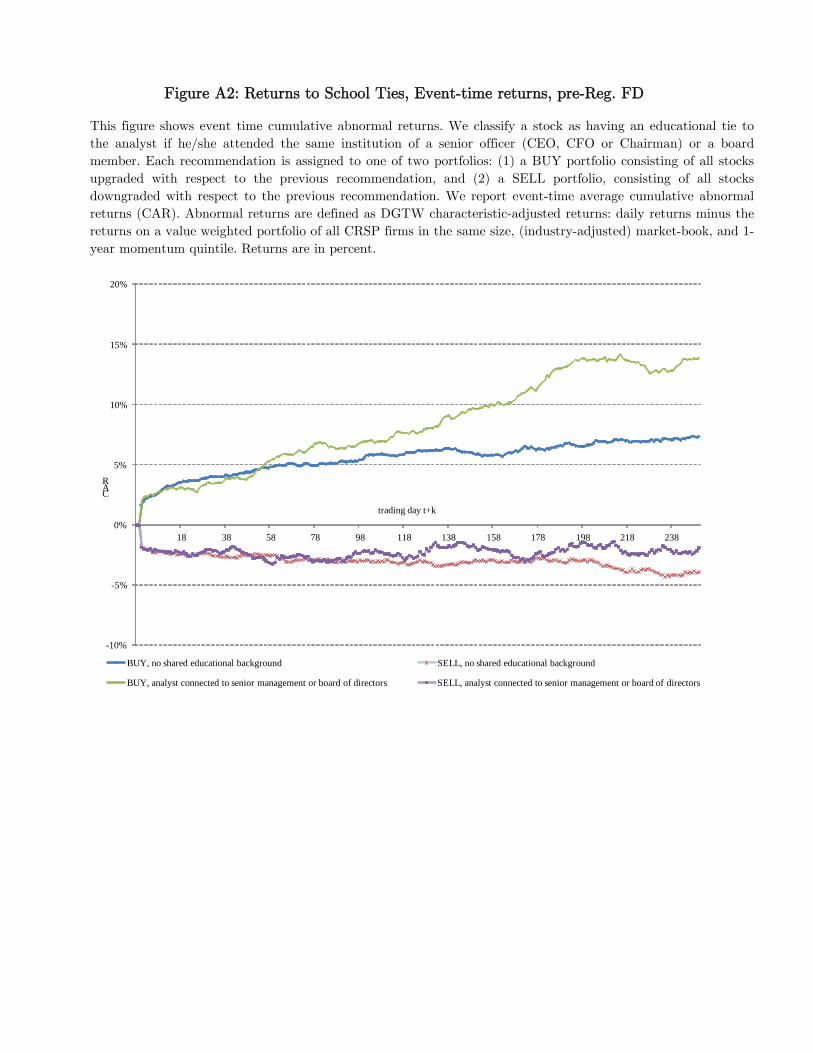
Figure A2: Returns to School Ties, Event-time returns, pre-Reg. FD
This figure shows event time cumulative abnormal returns. We classify a stock as having an educational tie to
the analyst if he/she attended the same institution of a senior officer (CEO, CFO or Chairman) or a board
member. Each recommendation is assigned to one of two portfolios: (1) a BUY portfolio consisting of all stocks
upgraded with respect to the previous recommendation, and (2) a SELL portfolio, consisting of all stocks
downgraded with respect to the previous recommendation. We report event-time average cumulative abnormal
returns (CAR). Abnormal returns are defined as DGTW characteristic-adjusted returns: daily returns minus the
returns on a value weighted portfolio of all CRSP firms in the same size, (industry-adjusted) market-book, and 1-
year momentum quintile. Returns are in percent.
-10%
-5%
0%
5%
10%
15%
20%
18 38 58 78 98 118 138 158 178 198 218 238
CAR
trading day t+k
BUY, no shared educational background SELL, no shared educational background
BUY, analyst connected to senior management or board of directors SELL, analyst connected to senior management or board of directors
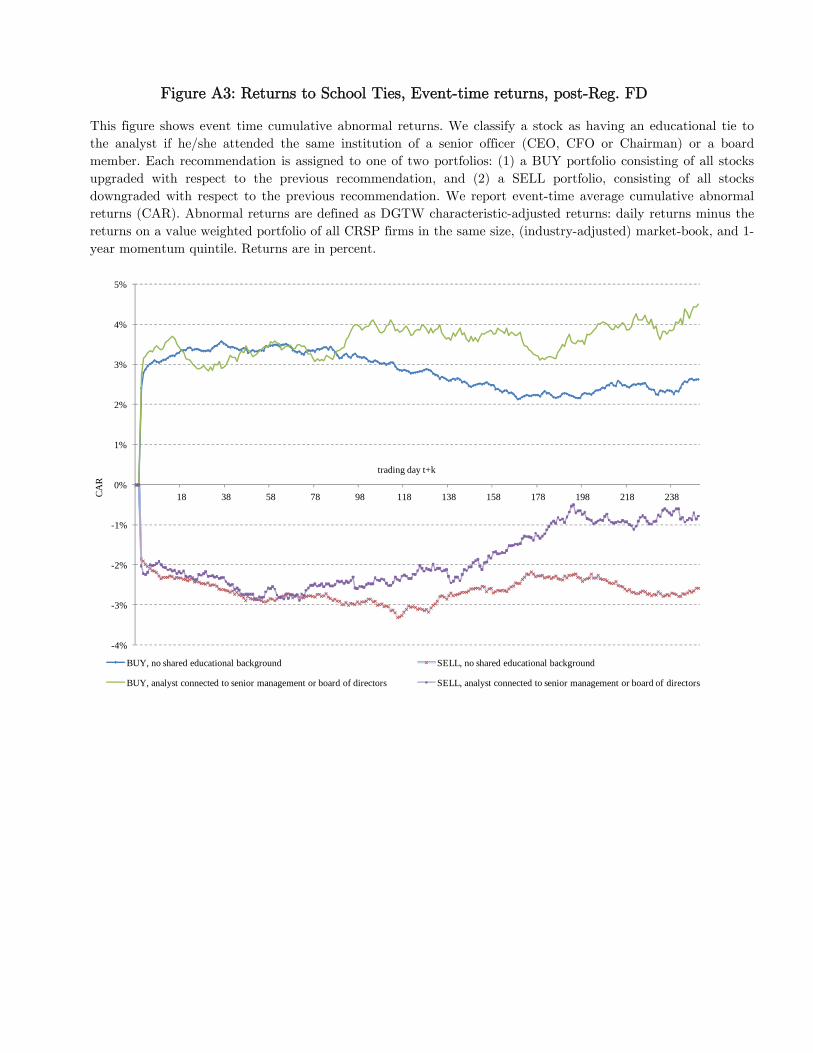
Figure A3: Returns to School Ties, Event-time returns, post-Reg. FD
This figure shows event time cumulative abnormal returns. We classify a stock as having an educational tie to
the analyst if he/she attended the same institution of a senior officer (CEO, CFO or Chairman) or a board
member. Each recommendation is assigned to one of two portfolios: (1) a BUY portfolio consisting of all stocks
upgraded with respect to the previous recommendation, and (2) a SELL portfolio, consisting of all stocks
downgraded with respect to the previous recommendation. We report event-time average cumulative abnormal
returns (CAR). Abnormal returns are defined as DGTW characteristic-adjusted returns: daily returns minus the
returns on a value weighted portfolio of all CRSP firms in the same size, (industry-adjusted) market-book, and 1-
year momentum quintile. Returns are in percent.
-4%
-3%
-2%
-1%
0%
1%
2%
3%
4%
5%
18 38 58 78 98 118 138 158 178 198 218 238CA
R
trading day t+k
BUY, no shared educational background SELL, no shared educational background
BUY, analyst connected to senior management or board of directors SELL, analyst connected to senior management or board of directors