Self-Sufficiency of Former Foster Youth in Wisconsin ... · Self-Sufficiency of Former Foster Youth...
61
Institute for Research on Poverty Special Report no. 81 Self-Sufficiency of Former Foster Youth in Wisconsin: Analysis of Unemployment Insurance Wage Data and Public Assistance Data Amy Dworsky Institute for Research on Poverty University of Wisconsin–Madison E-mail: [email protected] Mark E. Courtney Institute for Research on Poverty University of Wisconsin–Madison August 2001 This report was prepared for the Office of the Assistant Secretary for Planning and Evaluation, U.S. Department of Health and Human Services. IRP publications (discussion papers, special reports, and the newsletter Focus) are available on the Internet. The IRP Web site can be accessed at the following address: http://www.ssc.wisc.edu/irp/
Transcript of Self-Sufficiency of Former Foster Youth in Wisconsin ... · Self-Sufficiency of Former Foster Youth...
Institute for Research on Poverty Special Report no. 81
Self-Sufficiency of Former Foster Youth in Wisconsin: Analysis of Unemployment Insurance Wage Data and Public Assistance Data
Amy Dworsky Institute for Research on Poverty
University of Wisconsin–Madison E-mail: [email protected]
Mark E. Courtney
Institute for Research on Poverty University of Wisconsin–Madison
August 2001 This report was prepared for the Office of the Assistant Secretary for Planning and Evaluation, U.S. Department of Health and Human Services. IRP publications (discussion papers, special reports, and the newsletter Focus) are available on the Internet. The IRP Web site can be accessed at the following address: http://www.ssc.wisc.edu/irp/
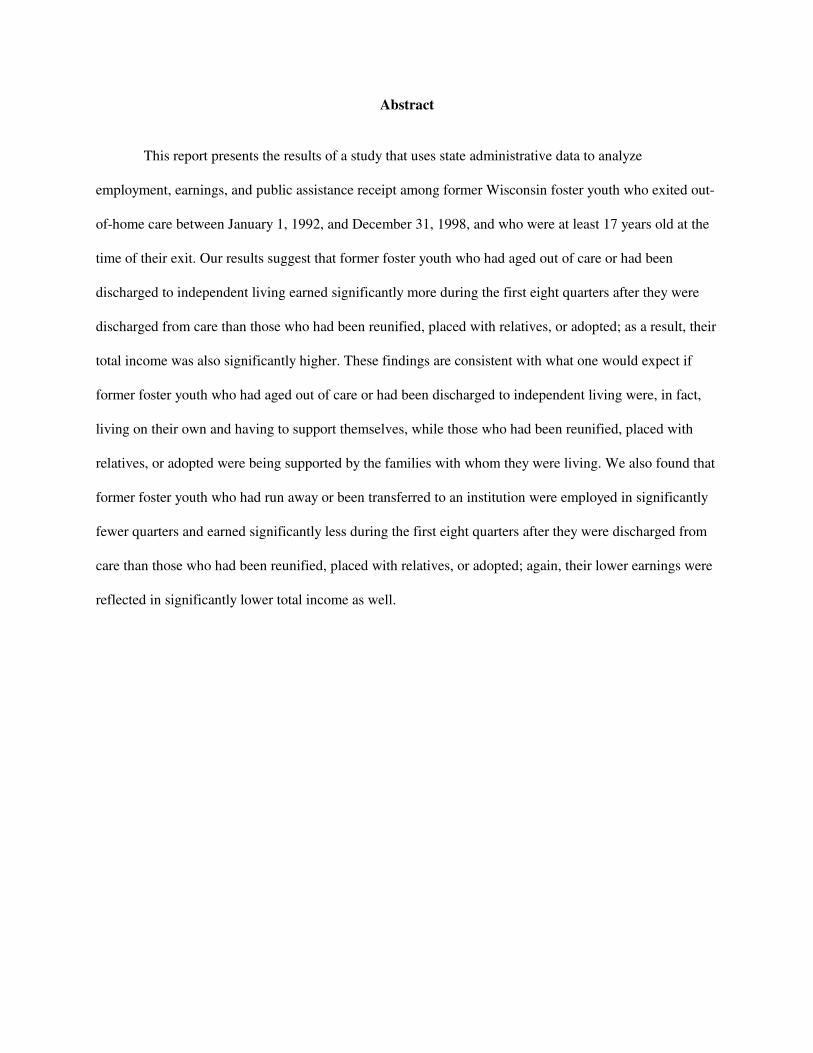
Abstract
This report presents the results of a study that uses state administrative data to analyze
employment, earnings, and public assistance receipt among former Wisconsin foster youth who exited out-
of-home care between January 1, 1992, and December 31, 1998, and who were at least 17 years old at the
time of their exit. Our results suggest that former foster youth who had aged out of care or had been
discharged to independent living earned significantly more during the first eight quarters after they were
discharged from care than those who had been reunified, placed with relatives, or adopted; as a result, their
total income was also significantly higher. These findings are consistent with what one would expect if
former foster youth who had aged out of care or had been discharged to independent living were, in fact,
living on their own and having to support themselves, while those who had been reunified, placed with
relatives, or adopted were being supported by the families with whom they were living. We also found that
former foster youth who had run away or been transferred to an institution were employed in significantly
fewer quarters and earned significantly less during the first eight quarters after they were discharged from
care than those who had been reunified, placed with relatives, or adopted; again, their lower earnings were
reflected in significantly lower total income as well.
Self-Sufficiency of Former Foster Youth in Wisconsin: Analysis of Unemployment Insurance Wage Data and Public Assistance Data
INTRODUCTION
Previous research has raised concerns about the self-sufficiency of former foster youth who age out
of care (e.g., Barth, 1990; Cook, Fleishman and Grimes, 1991; Courtney et al., 1998; Festinger, 1983;
Jones and Moses, 1984; Pettiford, 1981). In particular, several studies have shown that it is difficult for
many former foster youth to maintain stable employment, and that the earnings of those who are employed
are low. These studies have also found that a significant percentage of former foster youth received means-
tested cash assistance or in-kind benefits such as Food Stamps at some point after their discharge from
care.
With the exception of Pettiford (1981), all of the previous research has relied on interviews with
former foster youth. These former foster youth were asked, among other things, about their employment,
earnings, and public assistance utilization since they were discharged from care. Although such studies can
provide valuable information, that approach is very costly and sample attrition can be substantial.
More recently, researchers have begun to examine the self-sufficiency of former foster youth using
state administrative data.1 This report presents the results of one such study that analyzes employment,
earnings, and public assistance receipt among former Wisconsin foster youth who exited out-of-home care
between January 1, 1992, and December 31, 1998, and who were at least 17 years old at the time of their
exit. The former foster youth were identified using the Substitute Care Module of the state’s Human
Services Reporting System (HSRS).2
1The analysis of administrative data has its own limitations. We discuss the limitations most relevant to our analysis in the concluding section of this report.
2HSRS is a state-wide data collection system that includes both client-specific and summary information about the social and mental health services provided by state and/or county agencies.

2
Section 1 describes the characteristics of these youth, including information about their
experiences in out-home-care. Section 2 examines the employment and earnings of these former foster
youth during the first eight quarters after they exited out-of-home care. Section 3 examines their public
assistance utilization during that same period. Section 4 examines total income when earnings from
employment and public assistance benefits are combined. Section 5 discusses the results and their
implications.
1. DEMOGRAPHIC CHARACTERISTICS AND OUT-OF-HOME CARE EXPERIENCES OF FORMER FOSTER YOUTH
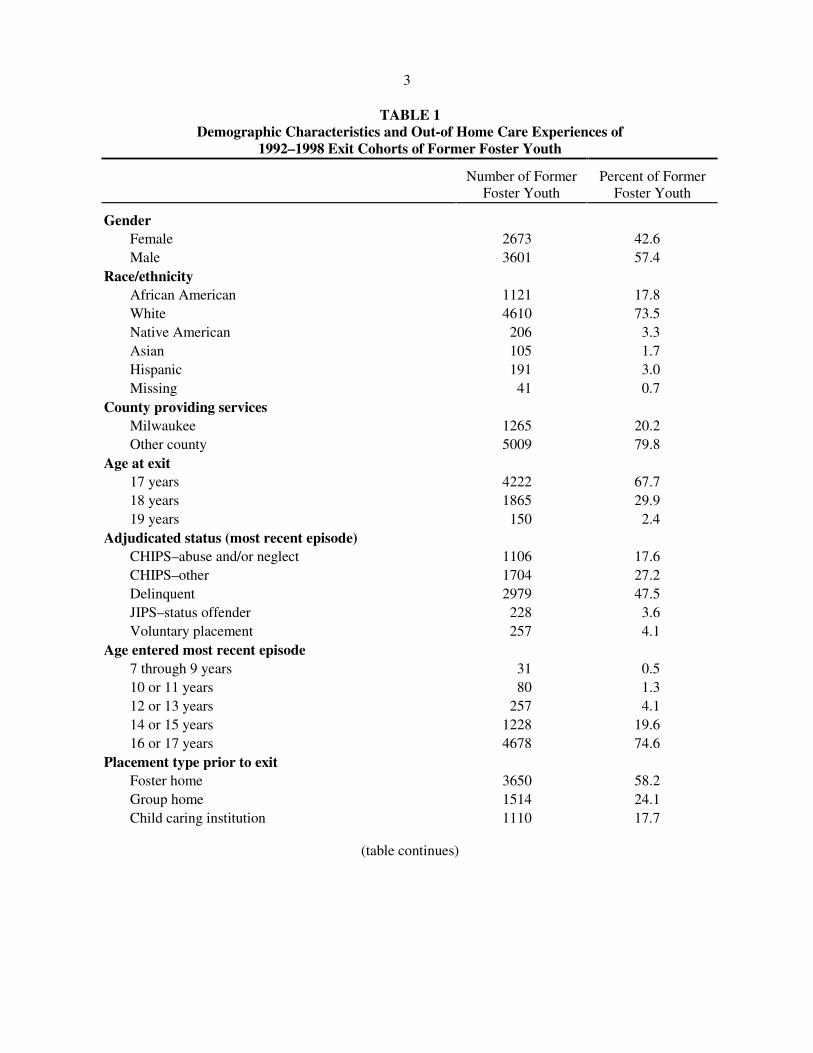
Between January 1, 1992, and December 31, 1998, 6,274 foster youth aged 17 and older exited
out-of-home care in Wisconsin.3 The data in Table 1 describe the demographic characteristics and out-of
home cares experiences of these former foster youth. They are disproportionately male, nearly three-
quarters are white, two-thirds were 17 years old when they were discharged, and one of five was receiving
services from Milwaukee County prior to exiting.4
Although almost 45 percent of these former foster youth had been adjudicated children in need of
protective services (CHIPS), an even higher percentage had been adjudicated delinquent. This is consistent
with two additional findings. First, three-quarters of these former foster youth entered their most recent
episode of out-of-home care at 16 or 17. Second, the majority had remained in care less than 12 months
during their most recent episode, and fewer than 5 percent had remained in care 5 years or more.
3This does not include the 21 youth aged 17 or older who were transferred to a private child welfare agency, or the seven youth aged 17 or older who died while in out-of-home care.
4The racial/ethnic makeup of former foster youth who had received services from Milwaukee County was very different from that of former youth who received services from the state’s other counties. Of former foster youth who received services from Milwaukee County, 60 percent were African American and 34 percent were white. Conversely, of former foster youth who received services from other counties, only 7 percent were African American and 83 percent were white.
3
TABLE 1 Demographic Characteristics and Out-of Home Care Experiences of
1992–1998 Exit Cohorts of Former Foster Youth
Number of Former
Foster Youth Percent of Former
Foster Youth
Gender Female 2673 42.6 Male 3601 57.4 Race/ethnicity African American 1121 17.8 White 4610 73.5 Native American 206 3.3 Asian 105 1.7 Hispanic 191 3.0 Missing 41 0.7 County providing services Milwaukee 1265 20.2 Other county 5009 79.8 Age at exit 17 years 4222 67.7 18 years 1865 29.9 19 years 150 2.4 Adjudicated status (most recent episode) CHIPS–abuse and/or neglect 1106 17.6 CHIPS–other 1704 27.2 Delinquent 2979 47.5 JIPS–status offender 228 3.6 Voluntary placement 257 4.1 Age entered most recent episode 7 through 9 years 31 0.5 10 or 11 years 80 1.3 12 or 13 years 257 4.1 14 or 15 years 1228 19.6 16 or 17 years 4678 74.6 Placement type prior to exit Foster home 3650 58.2 Group home 1514 24.1 Child caring institution 1110 17.7
(table continues)
4
TABLE 1, continued
Number of Former
Foster Youth Percent of Former
Foster Youth
Total number of episodes 1 3652 58.2 2 1477 23.5 3 619 9.9 4 291 4.6 5 115 1.8 6 or more 120 1.9 Number of placements (most recent episode) 1 4667 74.4 2 1084 17.3 3 321 5.1 4 107 1.7 5 or more 95 1.5 Total number of placements (all episodes) 1 2731 43.5 2 1439 22.9 3 832 13.3 4 496 7.9 5 304 4.9 6 165 2.6 7 112 1.8 8 or more 195 3.1 Months in out-of-home care (most recent episode) Less than 12 3410 54.4 12 to 23 1397 22.3 24 to 35 690 11.0 36 to 47 378 6.0 48 to 59 196 3.1 60 to 71 85 1.4 72 to 83 51 0.8 84 or more 67 1.1
(table continues)
5
TABLE 1, continued
Number of Former
Foster Youth Percent of Former
Foster Youth
Cumulative months in out-of-home care (all episodes) Less than 12 2471 39.2 12 to 23 1573 25.1 24 to 35 925 14.7 36 to 47 545 8.7 48 to 59 304 4.9 60 to 71 166 2.7 72 to 83 95 1.5 84 or more 195 3.1 Discharge outcome Reunified 3062 48.8 Placed with relatives 258 4.1 Adopted 45 0.7 Reached age of majority or completed education 1770 28.2 Discharged to independent living 365 5.8 Ran away 382 6.1 Transferred to state institution or other facility 392 6.3 Note: N = 6247.
6
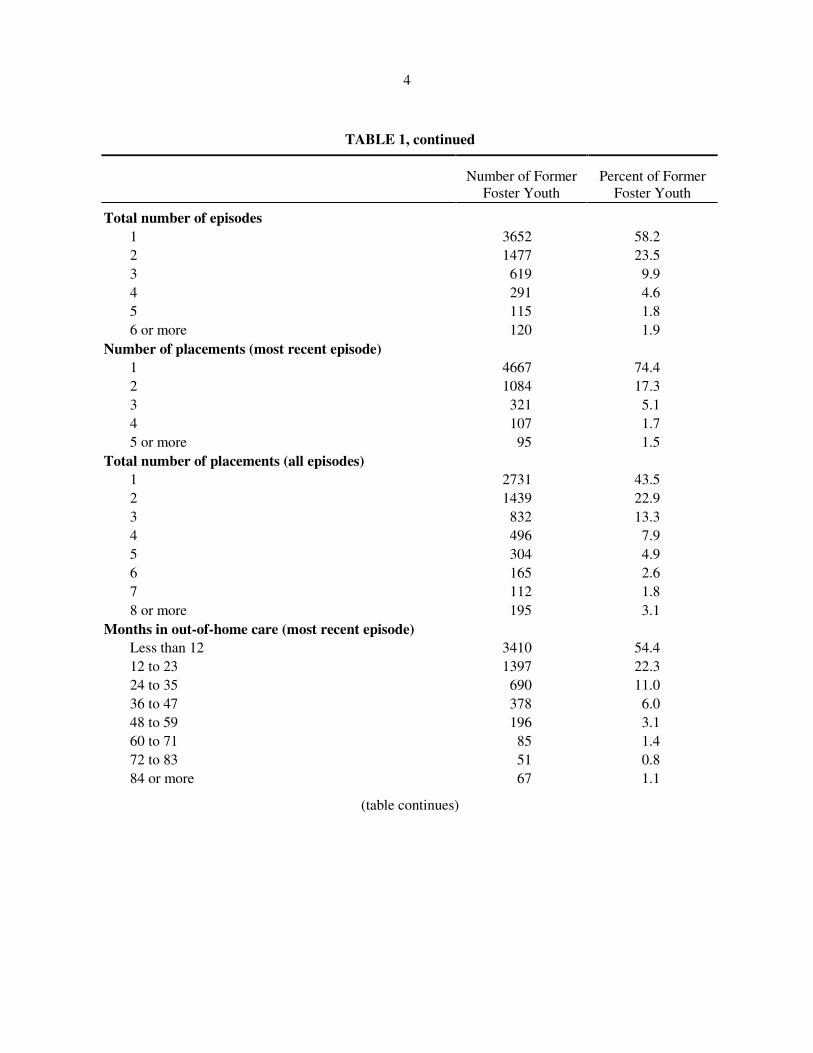
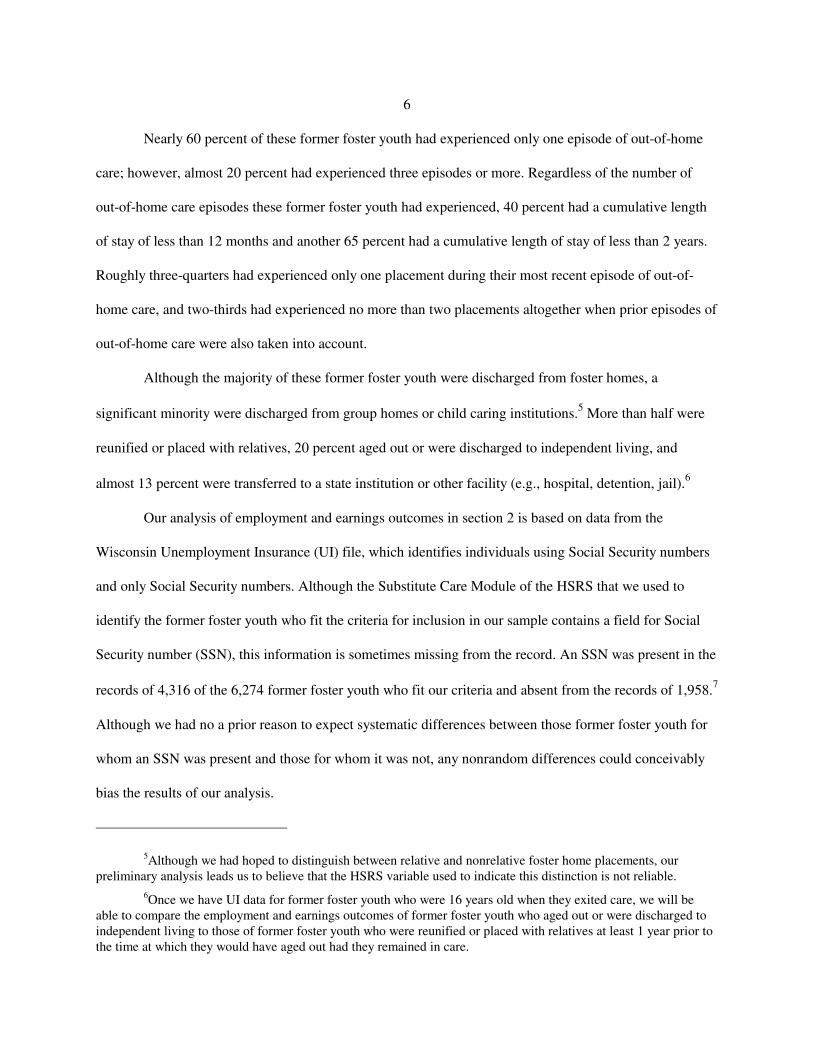
Nearly 60 percent of these former foster youth had experienced only one episode of out-of-home
care; however, almost 20 percent had experienced three episodes or more. Regardless of the number of
out-of-home care episodes these former foster youth had experienced, 40 percent had a cumulative length
of stay of less than 12 months and another 65 percent had a cumulative length of stay of less than 2 years.
Roughly three-quarters had experienced only one placement during their most recent episode of out-of-
home care, and two-thirds had experienced no more than two placements altogether when prior episodes of
out-of-home care were also taken into account.
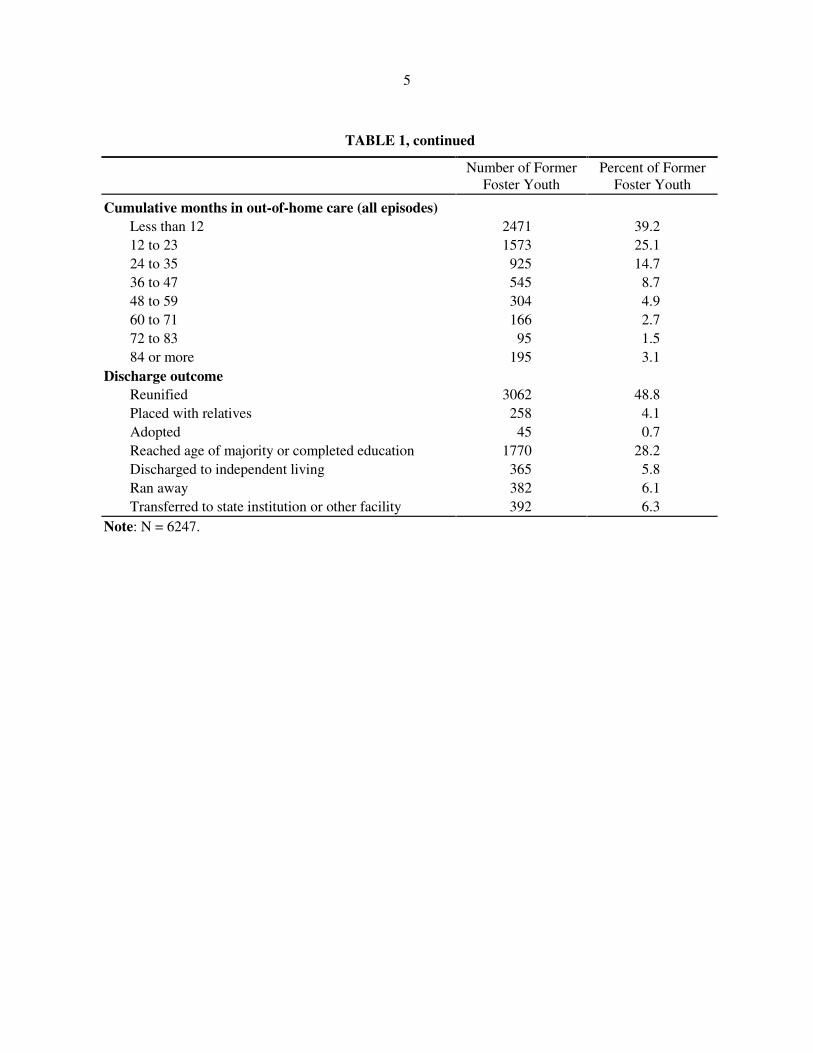
Although the majority of these former foster youth were discharged from foster homes, a
significant minority were discharged from group homes or child caring institutions.5 More than half were
reunified or placed with relatives, 20 percent aged out or were discharged to independent living, and
almost 13 percent were transferred to a state institution or other facility (e.g., hospital, detention, jail).6
Our analysis of employment and earnings outcomes in section 2 is based on data from the
Wisconsin Unemployment Insurance (UI) file, which identifies individuals using Social Security numbers
and only Social Security numbers. Although the Substitute Care Module of the HSRS that we used to
identify the former foster youth who fit the criteria for inclusion in our sample contains a field for Social
Security number (SSN), this information is sometimes missing from the record. An SSN was present in the
records of 4,316 of the 6,274 former foster youth who fit our criteria and absent from the records of 1,958.7
Although we had no a prior reason to expect systematic differences between those former foster youth for
whom an SSN was present and those for whom it was not, any nonrandom differences could conceivably
bias the results of our analysis.
5Although we had hoped to distinguish between relative and nonrelative foster home placements, our preliminary analysis leads us to believe that the HSRS variable used to indicate this distinction is not reliable.
6Once we have UI data for former foster youth who were 16 years old when they exited care, we will be able to compare the employment and earnings outcomes of former foster youth who aged out or were discharged to independent living to those of former foster youth who were reunified or placed with relatives at least 1 year prior to the time at which they would have aged out had they remained in care.
7
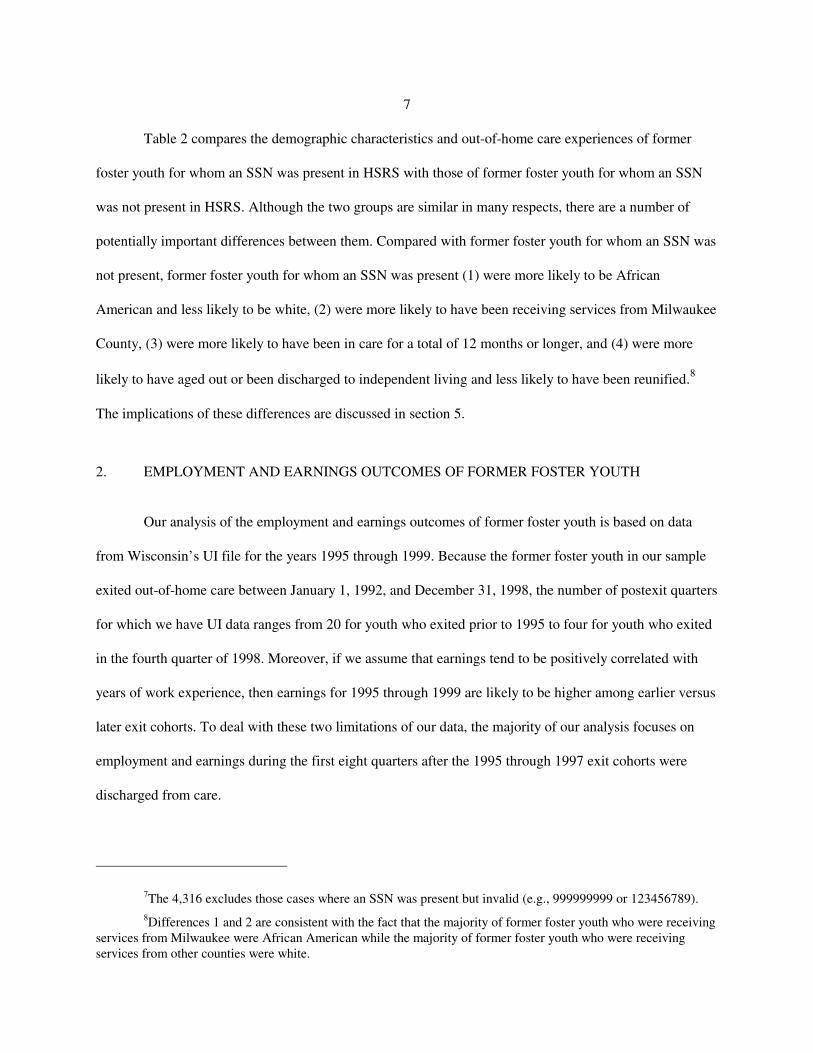
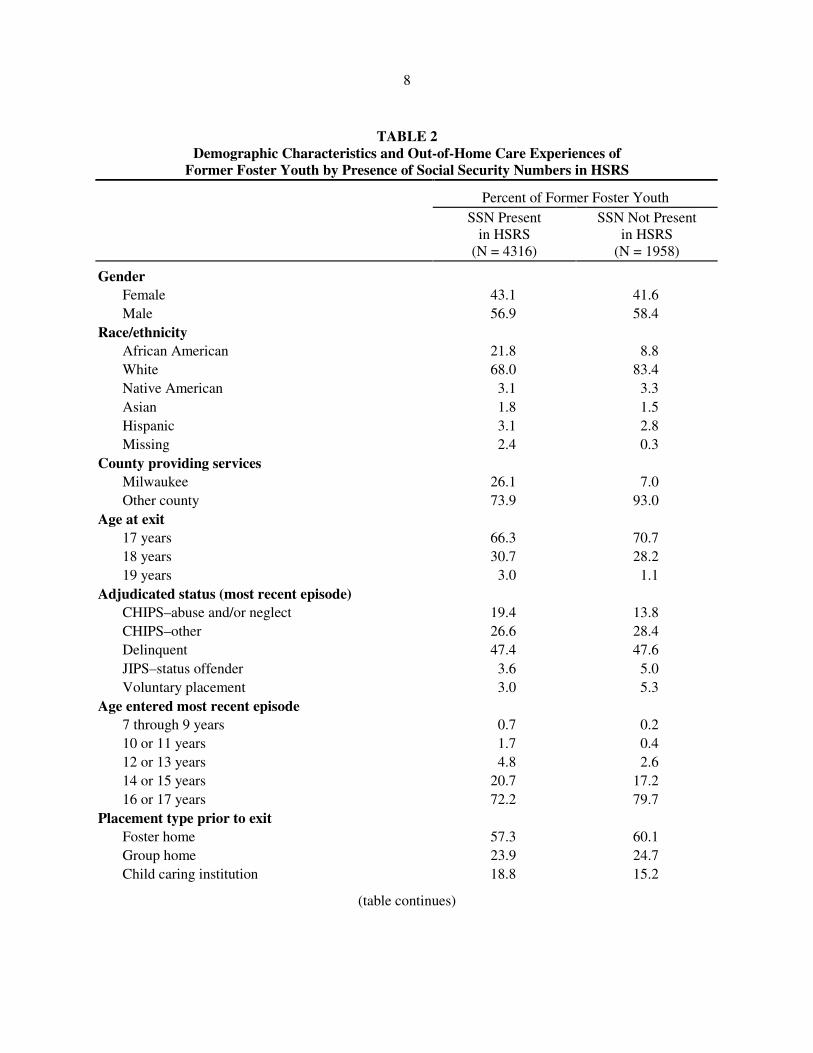
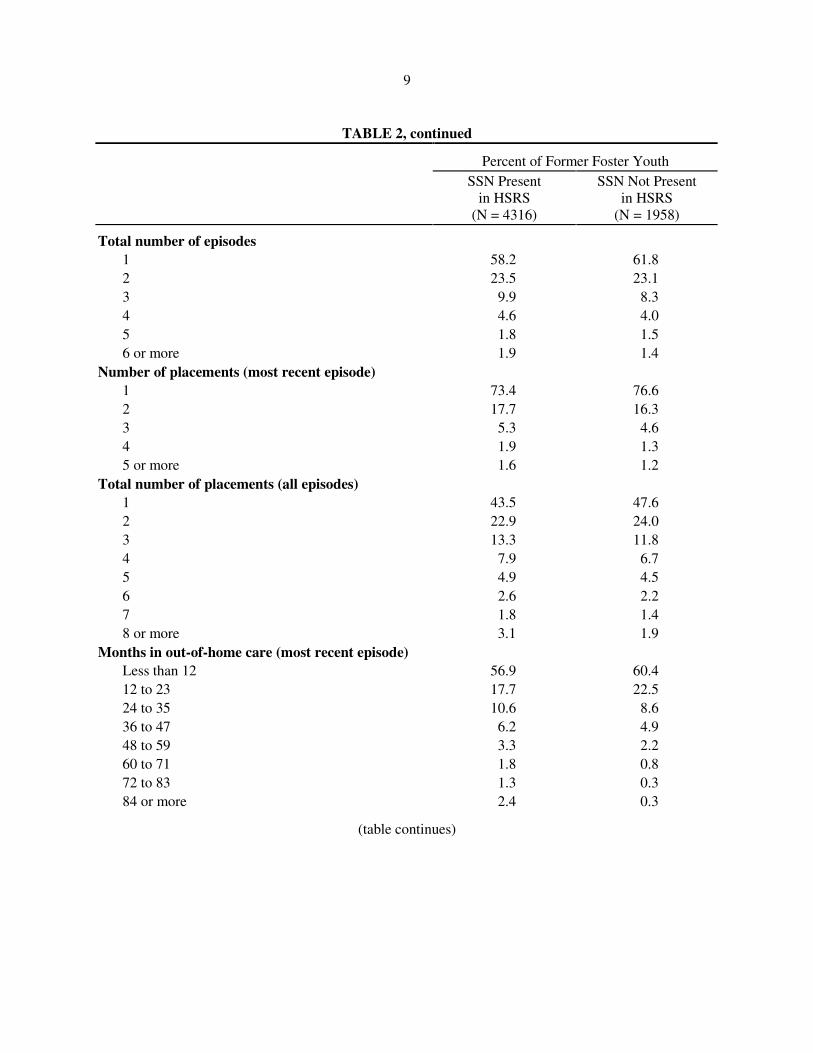
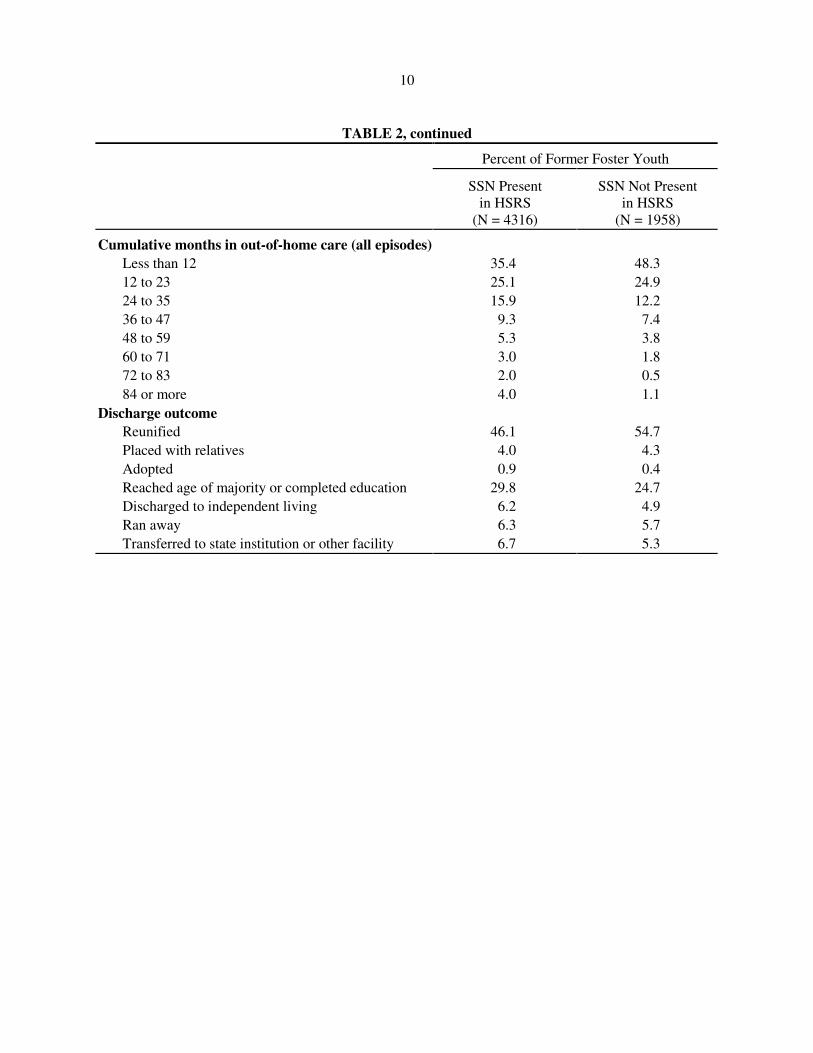
Table 2 compares the demographic characteristics and out-of-home care experiences of former
foster youth for whom an SSN was present in HSRS with those of former foster youth for whom an SSN
was not present in HSRS. Although the two groups are similar in many respects, there are a number of
potentially important differences between them. Compared with former foster youth for whom an SSN was
not present, former foster youth for whom an SSN was present (1) were more likely to be African
American and less likely to be white, (2) were more likely to have been receiving services from Milwaukee
County, (3) were more likely to have been in care for a total of 12 months or longer, and (4) were more
likely to have aged out or been discharged to independent living and less likely to have been reunified.8
The implications of these differences are discussed in section 5.
2. EMPLOYMENT AND EARNINGS OUTCOMES OF FORMER FOSTER YOUTH
Our analysis of the employment and earnings outcomes of former foster youth is based on data
from Wisconsin’s UI file for the years 1995 through 1999. Because the former foster youth in our sample
exited out-of-home care between January 1, 1992, and December 31, 1998, the number of postexit quarters
for which we have UI data ranges from 20 for youth who exited prior to 1995 to four for youth who exited
in the fourth quarter of 1998. Moreover, if we assume that earnings tend to be positively correlated with
years of work experience, then earnings for 1995 through 1999 are likely to be higher among earlier versus
later exit cohorts. To deal with these two limitations of our data, the majority of our analysis focuses on
employment and earnings during the first eight quarters after the 1995 through 1997 exit cohorts were
discharged from care.
7The 4,316 excludes those cases where an SSN was present but invalid (e.g., 999999999 or 123456789). 8Differences 1 and 2 are consistent with the fact that the majority of former foster youth who were receiving
services from Milwaukee were African American while the majority of former foster youth who were receiving services from other counties were white.
8
TABLE 2 Demographic Characteristics and Out-of-Home Care Experiences of
Former Foster Youth by Presence of Social Security Numbers in HSRS
Percent of Former Foster Youth
SSN Present in HSRS
(N = 4316)
SSN Not Present in HSRS
(N = 1958)
Gender Female 43.1 41.6 Male 56.9 58.4 Race/ethnicity African American 21.8 8.8 White 68.0 83.4 Native American 3.1 3.3 Asian 1.8 1.5 Hispanic 3.1 2.8 Missing 2.4 0.3 County providing services Milwaukee 26.1 7.0 Other county 73.9 93.0 Age at exit 17 years 66.3 70.7 18 years 30.7 28.2 19 years 3.0 1.1 Adjudicated status (most recent episode) CHIPS–abuse and/or neglect 19.4 13.8 CHIPS–other 26.6 28.4 Delinquent 47.4 47.6 JIPS–status offender 3.6 5.0 Voluntary placement 3.0 5.3 Age entered most recent episode 7 through 9 years 0.7 0.2 10 or 11 years 1.7 0.4 12 or 13 years 4.8 2.6 14 or 15 years 20.7 17.2 16 or 17 years 72.2 79.7 Placement type prior to exit Foster home 57.3 60.1 Group home 23.9 24.7 Child caring institution 18.8 15.2
(table continues)
9
TABLE 2, continued
Percent of Former Foster Youth
SSN Present in HSRS
(N = 4316)
SSN Not Present in HSRS
(N = 1958)
Total number of episodes 1 58.2 61.8 2 23.5 23.1 3 9.9 8.3 4 4.6 4.0 5 1.8 1.5 6 or more 1.9 1.4 Number of placements (most recent episode) 1 73.4 76.6 2 17.7 16.3 3 5.3 4.6 4 1.9 1.3 5 or more 1.6 1.2 Total number of placements (all episodes) 1 43.5 47.6 2 22.9 24.0 3 13.3 11.8 4 7.9 6.7 5 4.9 4.5 6 2.6 2.2 7 1.8 1.4 8 or more 3.1 1.9 Months in out-of-home care (most recent episode) Less than 12 56.9 60.4 12 to 23 17.7 22.5 24 to 35 10.6 8.6 36 to 47 6.2 4.9 48 to 59 3.3 2.2 60 to 71 1.8 0.8 72 to 83 1.3 0.3 84 or more 2.4 0.3
(table continues)
10
TABLE 2, continued
Percent of Former Foster Youth
SSN Present in HSRS
(N = 4316)
SSN Not Present in HSRS
(N = 1958)
Cumulative months in out-of-home care (all episodes) Less than 12 35.4 48.3 12 to 23 25.1 24.9 24 to 35 15.9 12.2 36 to 47 9.3 7.4 48 to 59 5.3 3.8 60 to 71 3.0 1.8 72 to 83 2.0 0.5 84 or more 4.0 1.1 Discharge outcome Reunified 46.1 54.7 Placed with relatives 4.0 4.3 Adopted 0.9 0.4 Reached age of majority or completed education 29.8 24.7 Discharged to independent living 6.2 4.9 Ran away 6.3 5.7 Transferred to state institution or other facility 6.7 5.3
11
We use two outcome measures in our analysis of these data. The first is the percentage of the first
eight postexit quarters during which former foster youth were employed. We compute this measure based
on the number of quarters for which the UI data show nonzero earnings.9 The second measure is total
earnings for those eight quarters. We compute this by summing quarterly earnings from all employers
across the first eight postexit quarters.
Before presenting the results of our analyses, we first discuss a major limitation of this approach,
namely, our exclusive reliance on data from Wisconsin’s UI file. Relying exclusively on UI data has
several important implications for our analyses. On the one hand, this approach will underestimate
employment and earnings among this population to the extent that former foster youth are working in jobs
not covered under the state’s UI regulations.10 Although state tax records might alleviate some of this
problem, we would still have no information on unreported earnings from employment in the so-called
“underground economy.”11 We will also underestimate employment and earnings to the extent that former
foster youth have left Wisconsin and are working in another state. On the other hand, this approach will
overestimate employment (but not earnings) to the extent that former foster youth work for only a few days
or weeks out of an entire quarter. We could deal with this problem, at least in part, by imposing more
stringent criteria than simply any nonzero earnings. For example, we could require that earnings be above
some threshold in order for a quarter to count, and then examine how our findings vary depending on
where the threshold is set.12
9If former foster youth exited in first half of the quarter (i.e., the 1st of month 1 through the 15th of month 2), that quarter is treated as the first postexit quarter. If former foster youth exited in second half of the quarter (i.e., the 16th of month 2 through the 30th/31st of month 3), the following quarter is treated as the first postexit quarter.
10Approximately 91 percent of Wisconsin workers are employed in jobs covered under the state’s UI program.
11Yet another important limitation of our approach is that the UI data provide no information about hourly wages or number of hours worked.
12One of the authors will pursue this approach in subsequent analyses of these data.
12
Employment: Descriptive Statistics
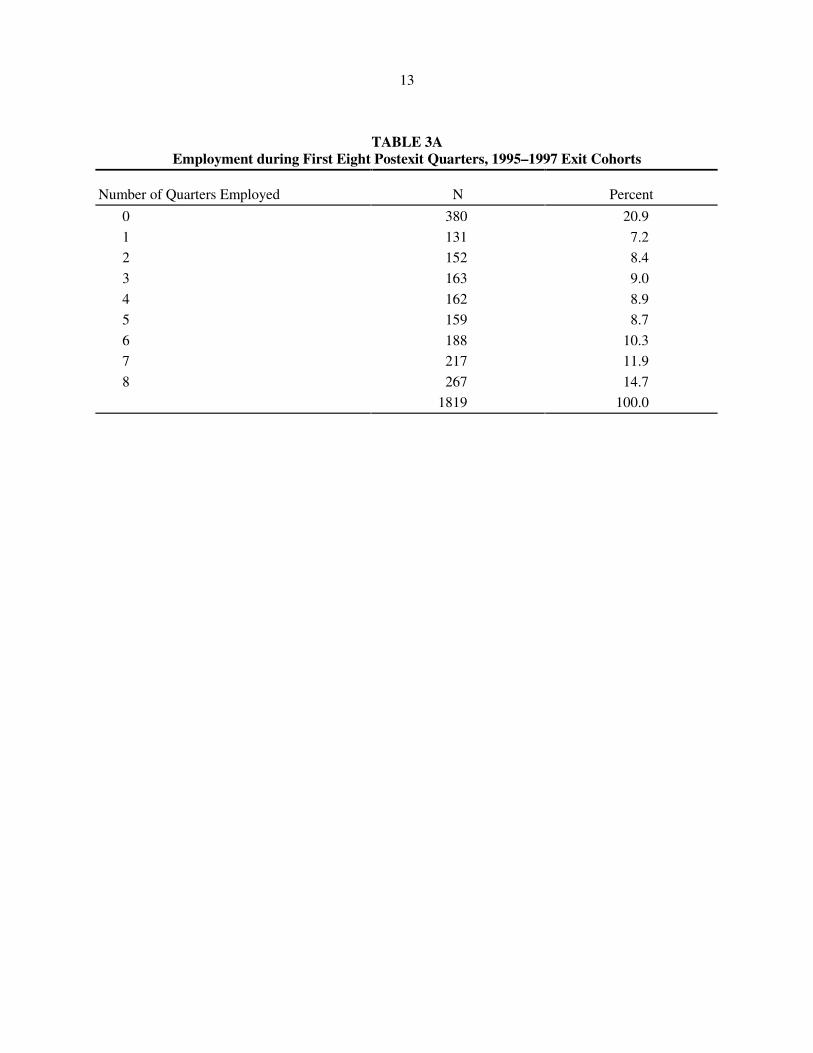
We begin with some descriptive statistics on the postexit employment of former foster youth.
Table 3A shows the number of quarters in which the 1995 through 1997 exit cohorts of former foster
youth were employed, as indicated by nonzero earnings, during the first eight quarters after they were
discharged from care. These former foster youth were fairly evenly divided between those who were
employed in at least half of the eight quarters and those who were not. Though one in five was never
employed, and one in four was employed in more than zero but fewer than three quarters, 55 percent were
employed in four quarters or more, including 15 percent who were employed in all eight.
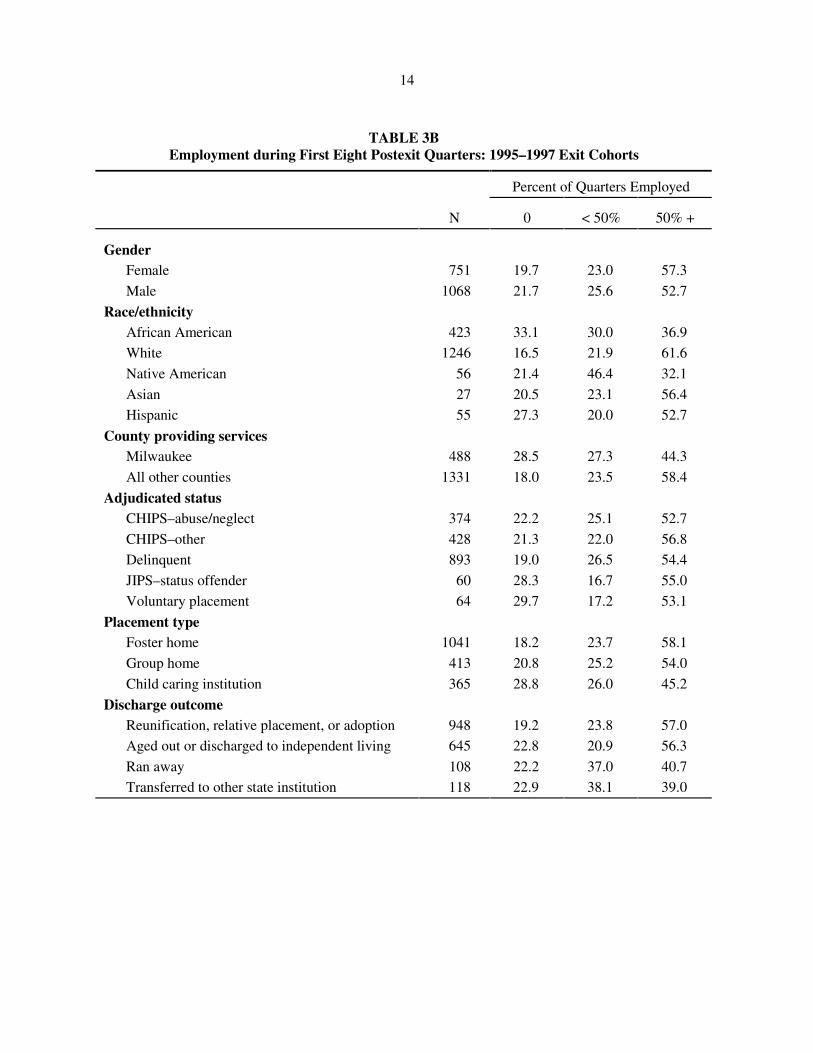
Table 3B shows the percentage of former foster youth employed in 0 percent, less than 50 percent,
and 50 percent or more of the first eight postexit quarters broken down by gender, race/ethnicity, county
(i.e., Milwaukee versus non-Milwaukee), adjudication status, placement type, and discharge outcome. The
percentage of quarters employed was generally higher (1) among female former foster youth than among
male former foster youth, (2) among white former foster than among nonwhite former foster youth
(especially African Americans and Native Americans), (3) among former foster youth receiving services
from non-Milwaukee counties than among those receiving services from Milwaukee County, (4) among
former foster youth who were discharged from foster homes or group homes than among former foster
youth discharged from child caring institutions, and (5) among former foster youth who had been
reunified, placed with relatives, or adopted, or who had aged out or been discharged to independent living
than among former foster youth who had run away from care or who had been transferred to a state
institution. In addition, although the percentage employed in at least four quarters does not vary much by
adjudication status, former foster youth who were adjudicated status offenders (JIPS) or placed voluntarily
were more likely to have been employed in zero quarters than former foster youth who were adjudicated
delinquents or children in need of protection (CHIPS).
13
TABLE 3A Employment during First Eight Postexit Quarters, 1995–1997 Exit Cohorts
Number of Quarters Employed N Percent
0 380 20.9
1 131 7.2
2 152 8.4
3 163 9.0
4 162 8.9
5 159 8.7
6 188 10.3
7 217 11.9
8 267 14.7
1819 100.0
14
TABLE 3B
Employment during First Eight Postexit Quarters: 1995–1997 Exit Cohorts
Percent of Quarters Employed
N 0 < 50% 50% +
Gender
Female 751 19.7 23.0 57.3
Male 1068 21.7 25.6 52.7
Race/ethnicity
African American 423 33.1 30.0 36.9
White 1246 16.5 21.9 61.6
Native American 56 21.4 46.4 32.1
Asian 27 20.5 23.1 56.4
Hispanic 55 27.3 20.0 52.7
County providing services
Milwaukee 488 28.5 27.3 44.3
All other counties 1331 18.0 23.5 58.4
Adjudicated status
CHIPS–abuse/neglect 374 22.2 25.1 52.7
CHIPS–other 428 21.3 22.0 56.8
Delinquent 893 19.0 26.5 54.4
JIPS–status offender 60 28.3 16.7 55.0
Voluntary placement 64 29.7 17.2 53.1
Placement type
Foster home 1041 18.2 23.7 58.1
Group home 413 20.8 25.2 54.0
Child caring institution 365 28.8 26.0 45.2
Discharge outcome
Reunification, relative placement, or adoption 948 19.2 23.8 57.0
Aged out or discharged to independent living 645 22.8 20.9 56.3
Ran away 108 22.2 37.0 40.7
Transferred to other state institution 118 22.9 38.1 39.0
15
Earnings: Descriptive Statistics
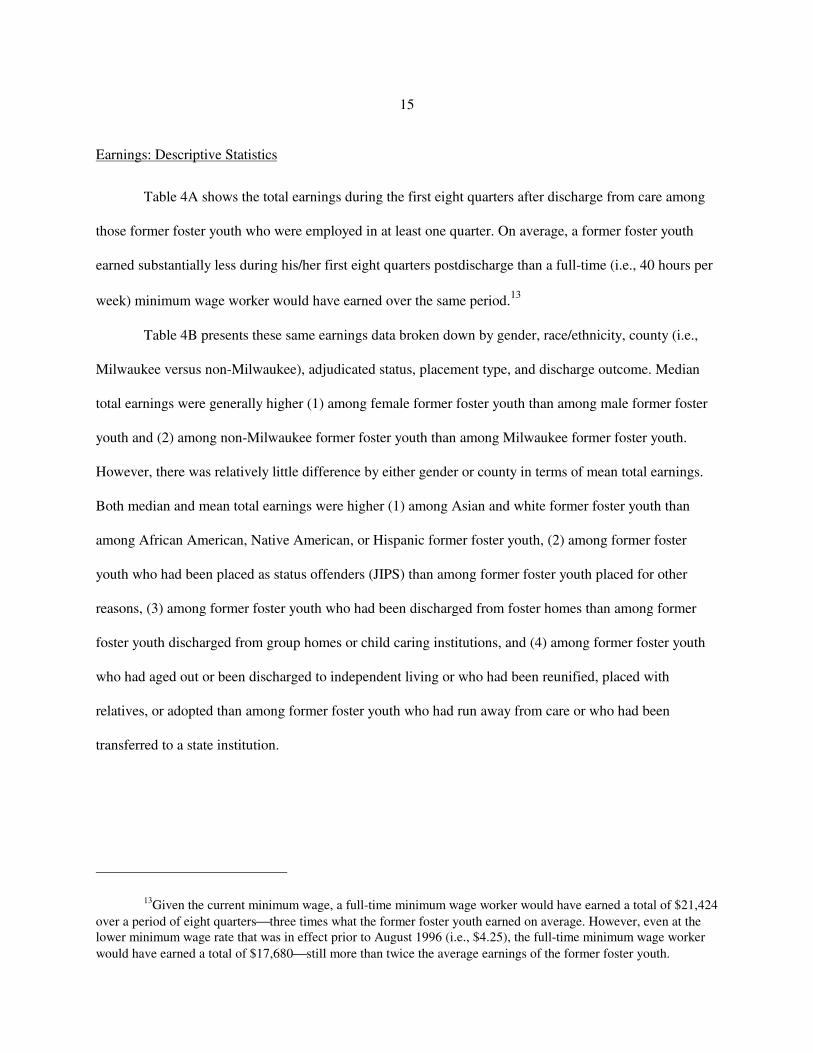
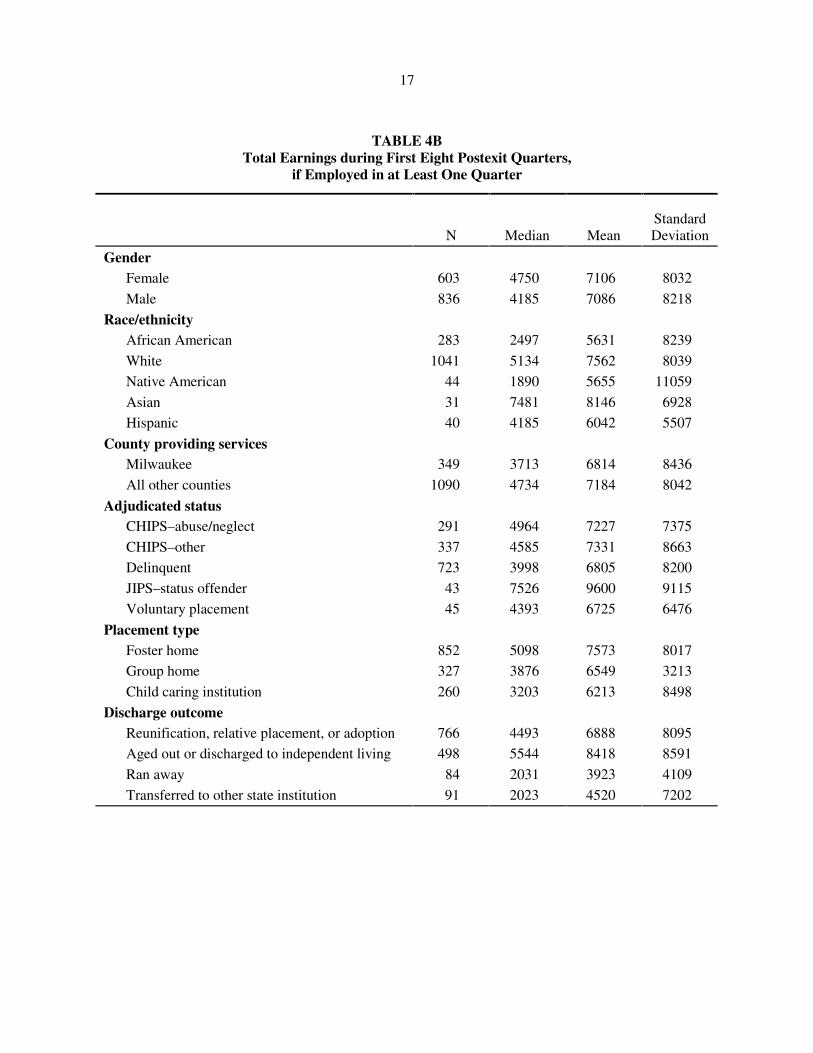
Table 4A shows the total earnings during the first eight quarters after discharge from care among
those former foster youth who were employed in at least one quarter. On average, a former foster youth
earned substantially less during his/her first eight quarters postdischarge than a full-time (i.e., 40 hours per
week) minimum wage worker would have earned over the same period.13
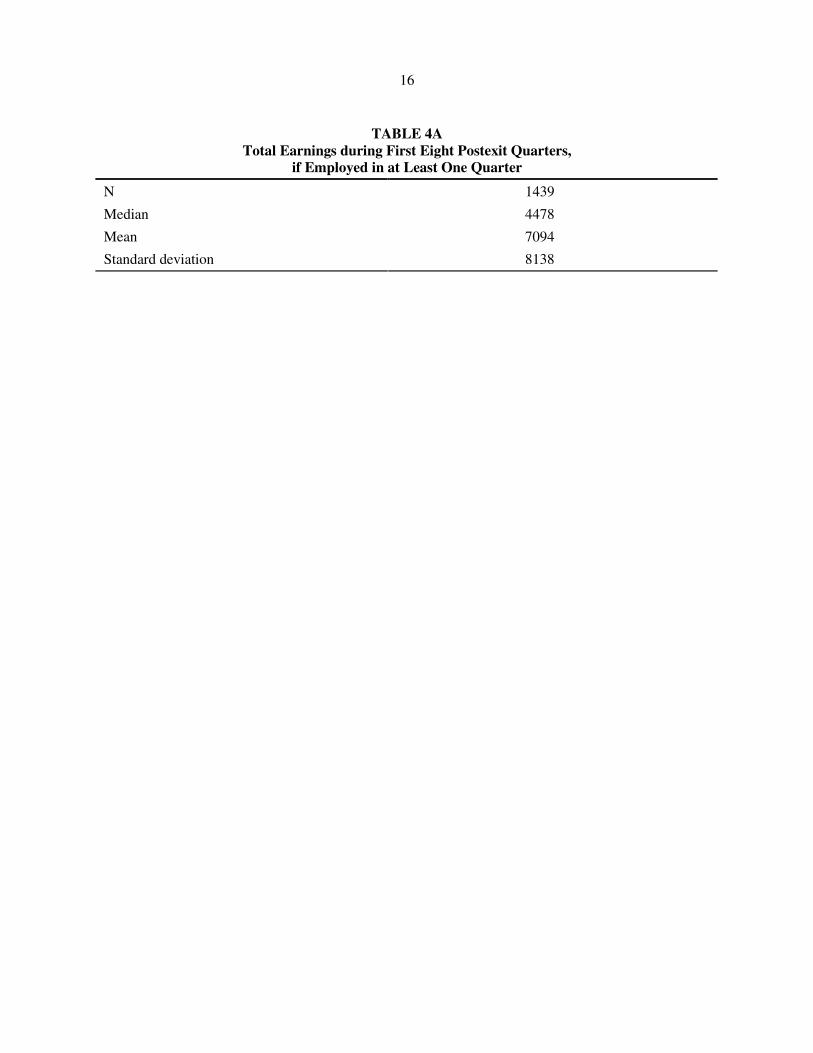
Table 4B presents these same earnings data broken down by gender, race/ethnicity, county (i.e.,
Milwaukee versus non-Milwaukee), adjudicated status, placement type, and discharge outcome. Median
total earnings were generally higher (1) among female former foster youth than among male former foster
youth and (2) among non-Milwaukee former foster youth than among Milwaukee former foster youth.
However, there was relatively little difference by either gender or county in terms of mean total earnings.
Both median and mean total earnings were higher (1) among Asian and white former foster youth than
among African American, Native American, or Hispanic former foster youth, (2) among former foster
youth who had been placed as status offenders (JIPS) than among former foster youth placed for other
reasons, (3) among former foster youth who had been discharged from foster homes than among former
foster youth discharged from group homes or child caring institutions, and (4) among former foster youth
who had aged out or been discharged to independent living or who had been reunified, placed with
relatives, or adopted than among former foster youth who had run away from care or who had been
transferred to a state institution.
13Given the current minimum wage, a full-time minimum wage worker would have earned a total of $21,424 over a period of eight quartersthree times what the former foster youth earned on average. However, even at the lower minimum wage rate that was in effect prior to August 1996 (i.e., $4.25), the full-time minimum wage worker would have earned a total of $17,680still more than twice the average earnings of the former foster youth.
16
TABLE 4A
Total Earnings during First Eight Postexit Quarters, if Employed in at Least One Quarter
N 1439
Median 4478
Mean 7094
Standard deviation 8138
17
TABLE 4B Total Earnings during First Eight Postexit Quarters,
if Employed in at Least One Quarter
N Median Mean Standard Deviation
Gender
Female 603 4750 7106 8032
Male 836 4185 7086 8218
Race/ethnicity
African American 283 2497 5631 8239
White 1041 5134 7562 8039
Native American 44 1890 5655 11059
Asian 31 7481 8146 6928
Hispanic 40 4185 6042 5507
County providing services
Milwaukee 349 3713 6814 8436
All other counties 1090 4734 7184 8042
Adjudicated status
CHIPS–abuse/neglect 291 4964 7227 7375
CHIPS–other 337 4585 7331 8663
Delinquent 723 3998 6805 8200
JIPS–status offender 43 7526 9600 9115
Voluntary placement 45 4393 6725 6476
Placement type
Foster home 852 5098 7573 8017
Group home 327 3876 6549 3213
Child caring institution 260 3203 6213 8498
Discharge outcome
Reunification, relative placement, or adoption 766 4493 6888 8095
Aged out or discharged to independent living 498 5544 8418 8591
Ran away 84 2031 3923 4109
Transferred to other state institution 91 2023 4520 7202
18
Employment and Earnings: Multivariate Analysis
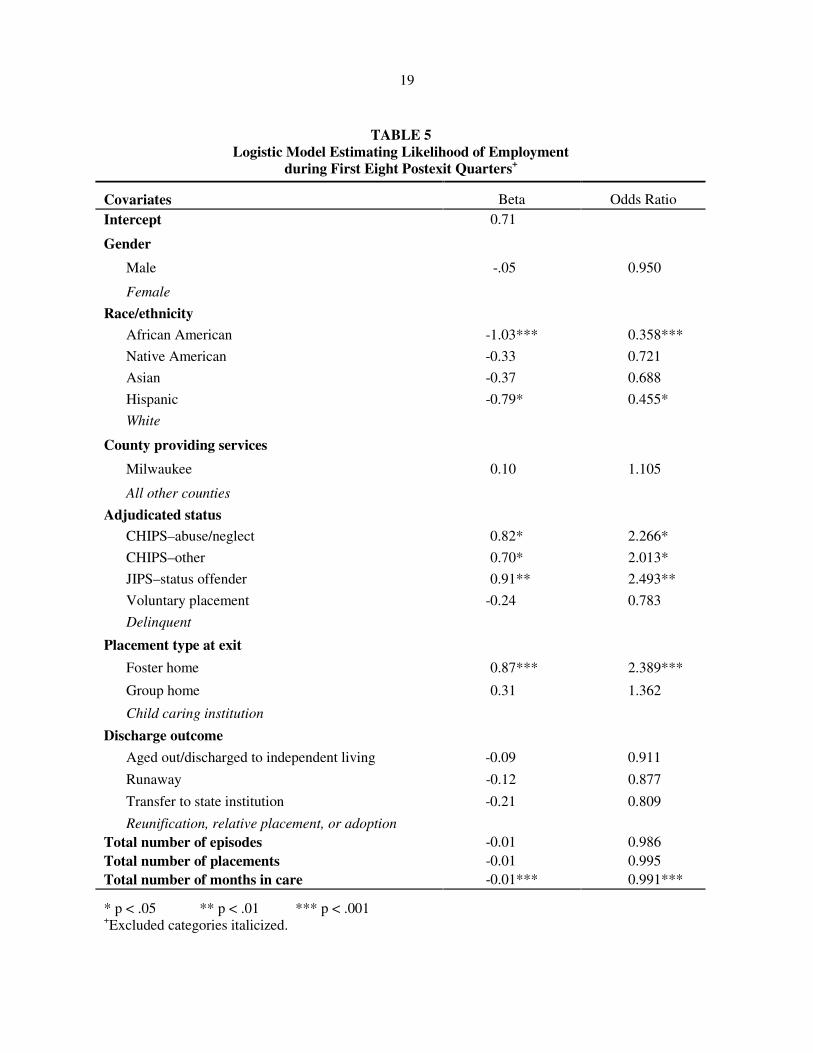
Employment. We estimated a logistic regression model in which employment during the first
eight quarters after discharge from out-of-home care was regressed on a set of covariates that included
both demographic characteristics of the former foster youth (e.g., gender, race/ethnicity) and measures
related to their experiences in out-of-home care (e.g., placement type, number of placements, length of
stay in care).14 Table 5 shows the parameter estimates and odds ratios for this model based on the 1995
through 1997 exit cohorts of former foster youth. An odds ratio greater than 1 means that, controlling
for all other covariates in the model, the group with that characteristic is more likely to have been
employed than the comparison group, whereas an odds ratio less than 1 means that the group with that
characteristic is less likely to have been employed than the comparison group. Former foster youth who
were African American or Hispanic were significantly less likely to have been employed than those
who were white. Former foster youth who had been placed as either children or juveniles in need of
protection were significantly more likely to have been employed than those who had been adjudicated
delinquent. Former foster youth who had been discharged from foster homes were more likely to have
been employed than those who had been discharged from child caring institutions. And finally, for
every additional month former foster youth had been in care, their odds of having been employed
decreased by slightly less than 1 percent.
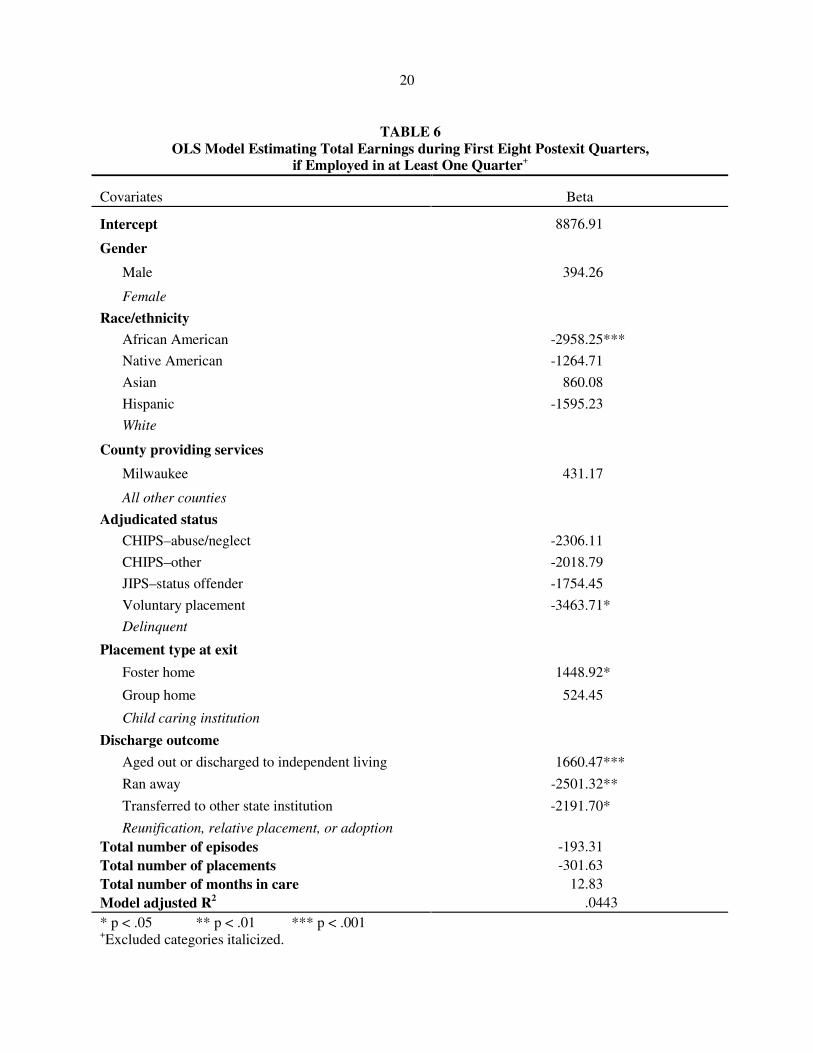
Earnings. We estimated an OLS regression model in which total earnings during the first eight
quarters after discharge from out-of-home care were regressed on the same set of covariates used in the
employment model. Table 6 shows the parameter estimates for this model based on the 1995 through
1997 exit cohorts of former foster youth who had been employed in at least one of the first eight
postexit quarters. Former foster youth who were African American had significantly lower average
14The dependent variable is coded as 1 if former foster youth were employed in at least one of the first eight postexit quarters and 0 if they were not.
19
TABLE 5 Logistic Model Estimating Likelihood of Employment
during First Eight Postexit Quarters+
Covariates Beta Odds Ratio Intercept 0.71
Gender
Male -.05 0.950
Female
Race/ethnicity
African American -1.03*** 0.358***
Native American -0.33 0.721
Asian -0.37 0.688
Hispanic -0.79* 0.455*
White
County providing services
Milwaukee 0.10 1.105
All other counties
Adjudicated status
CHIPS–abuse/neglect 0.82* 2.266*
CHIPS–other 0.70* 2.013*
JIPS–status offender 0.91** 2.493**
Voluntary placement -0.24 0.783
Delinquent
Placement type at exit
Foster home 0.87*** 2.389***
Group home 0.31 1.362
Child caring institution
Discharge outcome
Aged out/discharged to independent living -0.09 0.911
Runaway -0.12 0.877
Transfer to state institution -0.21 0.809
Reunification, relative placement, or adoption Total number of episodes -0.01 0.986 Total number of placements -0.01 0.995 Total number of months in care -0.01*** 0.991***
* p < .05 ** p < .01 *** p < .001 +Excluded categories italicized.
20
TABLE 6
OLS Model Estimating Total Earnings during First Eight Postexit Quarters, if Employed in at Least One Quarter+
Covariates Beta
Intercept 8876.91
Gender
Male 394.26
Female
Race/ethnicity
African American -2958.25***
Native American -1264.71
Asian 860.08
Hispanic -1595.23
White
County providing services
Milwaukee 431.17
All other counties
Adjudicated status
CHIPS–abuse/neglect -2306.11
CHIPS–other -2018.79
JIPS–status offender -1754.45
Voluntary placement -3463.71*
Delinquent
Placement type at exit
Foster home 1448.92*
Group home 524.45
Child caring institution
Discharge outcome
Aged out or discharged to independent living 1660.47***
Ran away -2501.32**
Transferred to other state institution -2191.70*
Reunification, relative placement, or adoption Total number of episodes -193.31 Total number of placements -301.63 Total number of months in care 12.83 Model adjusted R2 .0443 * p < .05 ** p < .01 *** p < .001 +Excluded categories italicized.
21
total earnings than those who were white. Former foster youth who had been placed voluntarily had
significantly lower average total earnings than those who had been adjudicated delinquent. Former
foster youth discharged from foster homes had significantly higher average total earnings than those
discharged from child caring institutions. And finally, former foster youth who had aged out of care or
been discharged to independent living had significantly higher average total earnings than those
discharged to family, whereas former foster youth who either ran away or were transferred to another
state institution had significantly lower average total earnings.
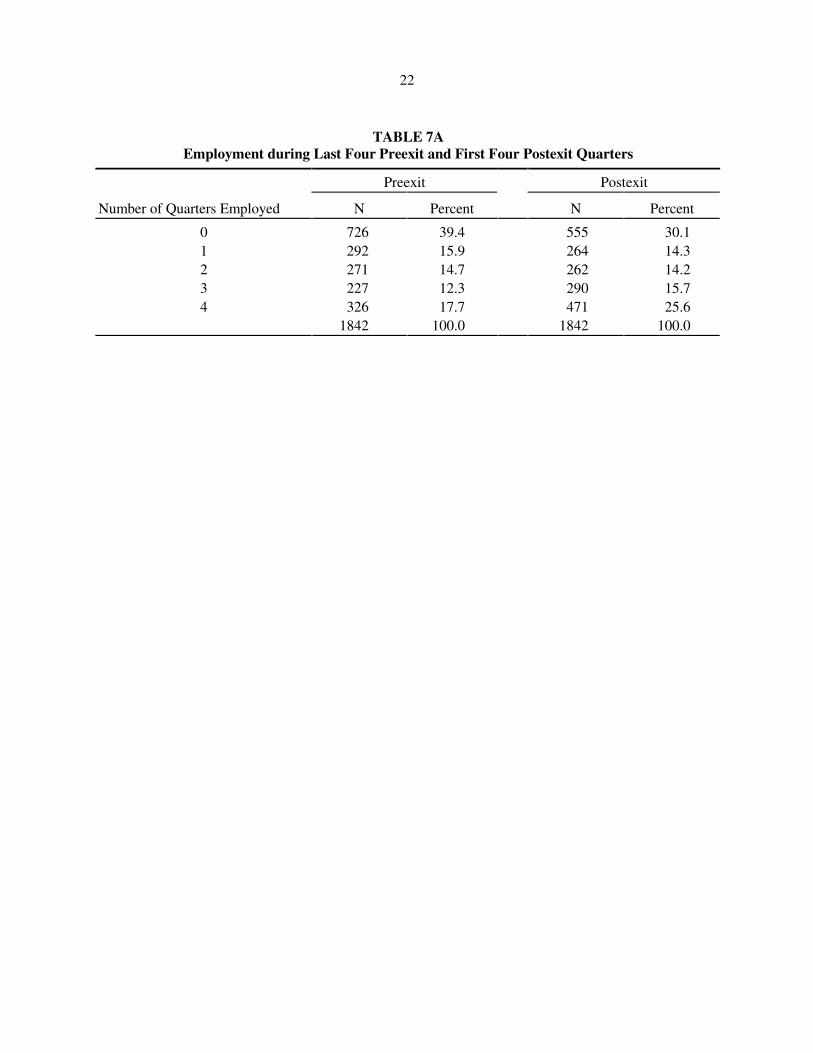
As noted above, this report is based on UI data for 1995 through 1999. Although our analysis thus
far has focused on employment and earnings for the first eight quarters postexit, these data also allow us to
examine whether earnings prior to discharge might account for a substantial proportion of the variance in
postdischarge earnings, controlling for the demographic characteristics and out-of-home care experiences
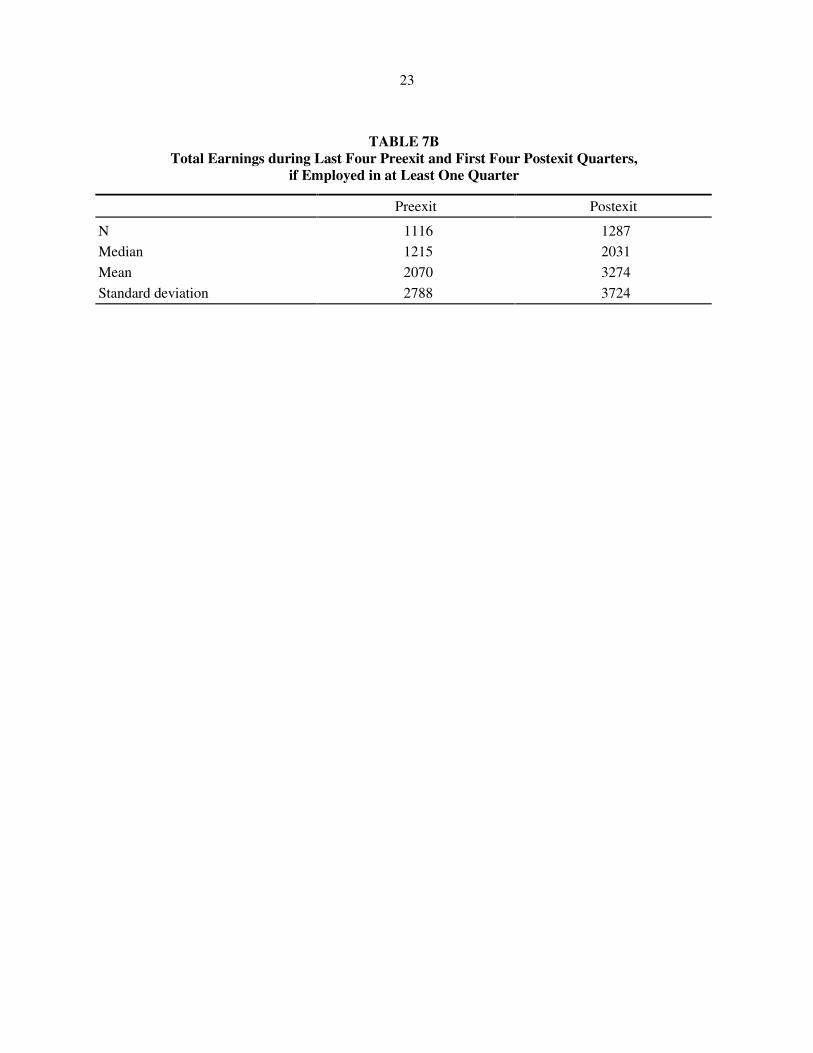
of former foster youth. We examined this possibility using data for the 1996 through 1998 exit cohorts.
Table 7A shows pre- and postdischarge employment and Table 7B shows total earnings for these former
foster youth.
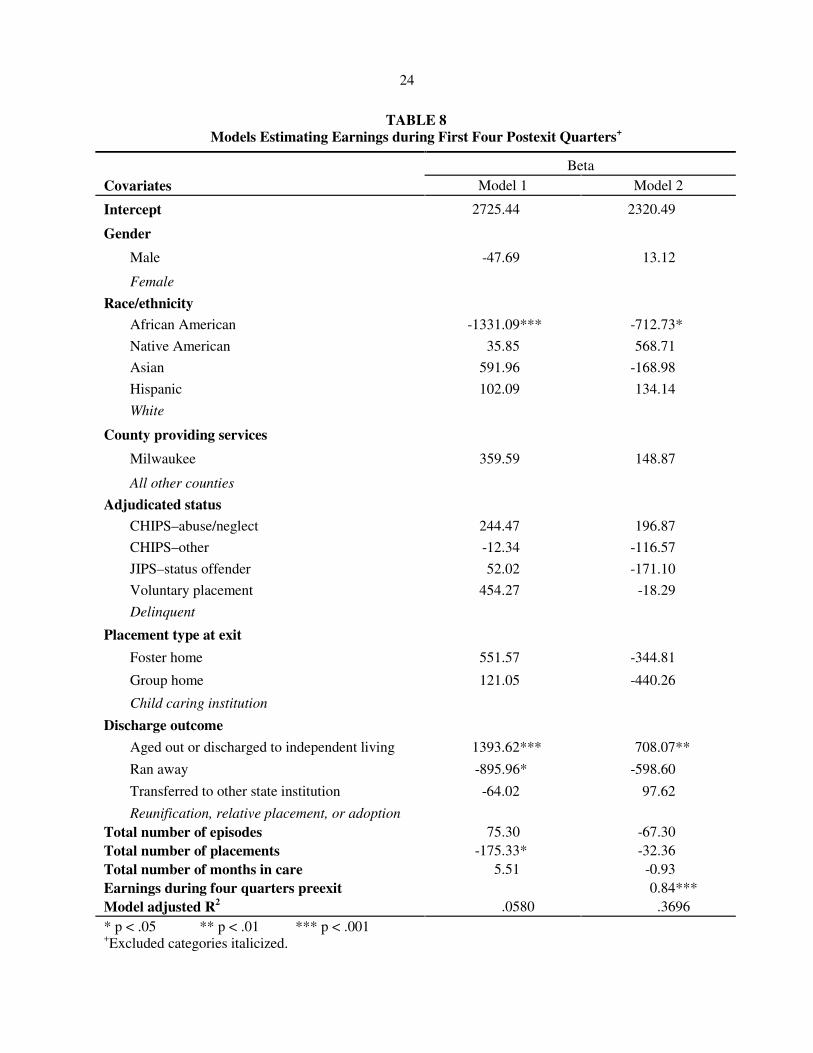
We estimated two OLS models in which total earnings for the first four quarters postdischarge
were regressed on the same set of covariates used in the previous models. However, the second model also
included total earnings for the four quarters immediately prior to discharge from care. Table 8 shows the
parameter estimates for these two models based on the 1996 through 1998 exit cohorts. The parameter
estimates for model 1 indicate (1) that African American former foster youth had significantly lower total
earnings than white former foster youth, (2) that former foster youth who had been reunified, placed with
relatives, or adopted had significantly lower total earnings than former foster youth who had aged out of
care or been discharged to independent living, but significantly higher total earnings than former foster
youth who had run away from care, and (3) that for every additional placement former foster youth
experienced, total earnings decreased by $175. Despite the statistical significance of these covariates, this
model explained little of the variance in total earnings.
22
TABLE 7A Employment during Last Four Preexit and First Four Postexit Quarters
Preexit Postexit
Number of Quarters Employed N Percent N Percent
0 726 39.4 555 30.1 1 292 15.9 264 14.3 2 271 14.7 262 14.2 3 227 12.3 290 15.7 4 326 17.7 471 25.6 1842 100.0 1842 100.0
23
TABLE 7B Total Earnings during Last Four Preexit and First Four Postexit Quarters,
if Employed in at Least One Quarter
Preexit Postexit
N 1116 1287
Median 1215 2031
Mean 2070 3274
Standard deviation 2788 3724
24
TABLE 8 Models Estimating Earnings during First Four Postexit Quarters+
Beta Covariates Model 1 Model 2
Intercept 2725.44 2320.49
Gender
Male -47.69 13.12
Female
Race/ethnicity
African American -1331.09*** -712.73*
Native American 35.85 568.71
Asian 591.96 -168.98
Hispanic 102.09 134.14
White
County providing services
Milwaukee 359.59 148.87
All other counties
Adjudicated status
CHIPS–abuse/neglect 244.47 196.87
CHIPS–other -12.34 -116.57
JIPS–status offender 52.02 -171.10
Voluntary placement 454.27 -18.29
Delinquent
Placement type at exit
Foster home 551.57 -344.81
Group home 121.05 -440.26
Child caring institution
Discharge outcome
Aged out or discharged to independent living 1393.62*** 708.07**
Ran away -895.96* -598.60
Transferred to other state institution -64.02 97.62
Reunification, relative placement, or adoption Total number of episodes 75.30 -67.30 Total number of placements -175.33* -32.36 Total number of months in care 5.51 -0.93 Earnings during four quarters preexit 0.84*** Model adjusted R2 .0580 .3696 * p < .05 ** p < .01 *** p < .001 +Excluded categories italicized.
25
The parameter estimates for model 2 indicate (1) that every dollar in preexit earnings was
associated with a statistically significant increase of 0.84 dollars in postexit earnings and (2) that even after
controlling for preexit earnings, African American former foster youth had significantly lower total
earnings than white former foster youth, and former foster youth who had been reunified, placed with
relatives, or adopted had significantly lower total earnings than former foster youth who had aged out of
care or been discharged to independent living. Moreover, addition of preexit earnings markedly improved
the model’s explanatory power.
3. PUBLIC ASSISTANCE UTILIZATION
Our analysis of public assistance utilization by former foster youth is based on state administrative
data from the Client Assistance for Re-employment and Economic Support (CARES) data collection
system for the period January 1995 through June 2000. CARES contains monthly, client-specific
information about participation in public assistance programs, including AFDC/TANF and Food Stamps.15
To be consistent with our analysis of the employment and earnings data, we focus on public assistance
utilization during the first eight quarters postexit for the 1995 through 1997 exit cohorts of former foster
youth.
We use two sets of outcome measures in our analysis of these CARES data. The first set contains
three dichotomous variables indicating whether former foster youth received (1) AFDC/TANF cash
assistance, (2) Food Stamps, and (3) AFDC/TANF cash assistance and/or Food Stamps during their first
eight quarters after discharge from care.16 Former foster youth were counted as public assistance recipients
15Wisconsin’s TANF program is Wisconsin Works, or W-2. It was first implemented in September 1997. AFDC was not completely phased out until March 1998.
16If former foster youth exited in the first half of the quarter (i.e., the 1st of month 1 through the 15th of month 2), that quarter is treated as the first postexit quarter. If former foster youth exited in the second half of the quarter (i.e., the 16th of month 2 through the 30th/31st of month 3), the following quarter is treated as the first postexit quarter.
26
if and only if two conditions were met. First, the former foster youth received a nonzero AFDC/TANF cash
grant and/or Food Stamps in at least 1 month during the first eight postexit quarters.17 Second, the former
foster youth was coded as the “primary person” or case head. In other words, the former foster youth could
not be a dependent on the AFDC/TANF or Food Stamp case of a parent or other individual.18
The second set of outcome measures also contains three variables: (1) the total amount of
AFDC/TANF cash assistance former foster youth received during the first eight postexit quarters, (2) the
total amount of Food Stamps former foster youth received during the first eight postexit quarters, and
(3) the total amount of AFDC/TANF cash assistance and/or Food Stamps former foster youth received
during the first eight postexit quarters. We computed the first two measures by summing monthly
AFDC/TANF cash assistance and/or Food Stamp benefits, and the third measure by summing the first two.
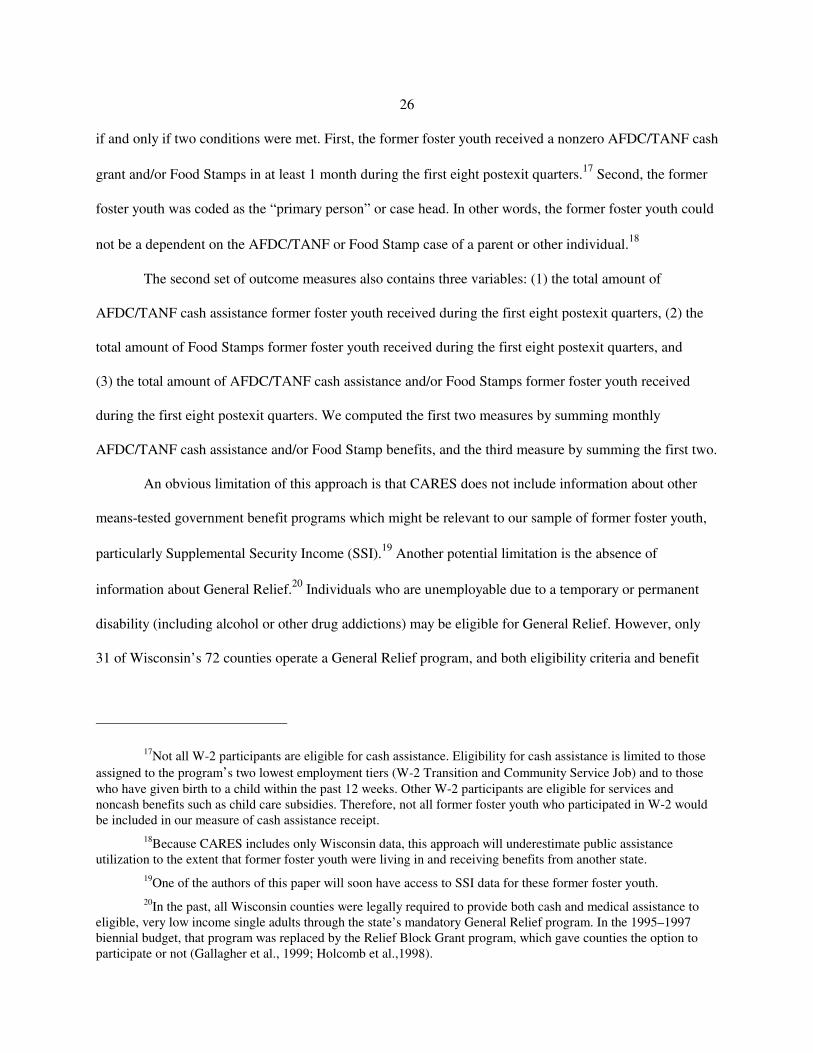
An obvious limitation of this approach is that CARES does not include information about other
means-tested government benefit programs which might be relevant to our sample of former foster youth,
particularly Supplemental Security Income (SSI).19 Another potential limitation is the absence of
information about General Relief.20 Individuals who are unemployable due to a temporary or permanent
disability (including alcohol or other drug addictions) may be eligible for General Relief. However, only
31 of Wisconsin’s 72 counties operate a General Relief program, and both eligibility criteria and benefit
17Not all W-2 participants are eligible for cash assistance. Eligibility for cash assistance is limited to those assigned to the program’s two lowest employment tiers (W-2 Transition and Community Service Job) and to those who have given birth to a child within the past 12 weeks. Other W-2 participants are eligible for services and noncash benefits such as child care subsidies. Therefore, not all former foster youth who participated in W-2 would be included in our measure of cash assistance receipt.
18Because CARES includes only Wisconsin data, this approach will underestimate public assistance utilization to the extent that former foster youth were living in and receiving benefits from another state.
19One of the authors of this paper will soon have access to SSI data for these former foster youth. 20In the past, all Wisconsin counties were legally required to provide both cash and medical assistance to
eligible, very low income single adults through the state’s mandatory General Relief program. In the 1995–1997 biennial budget, that program was replaced by the Relief Block Grant program, which gave counties the option to participate or not (Gallagher et al., 1999; Holcomb et al.,1998).
27
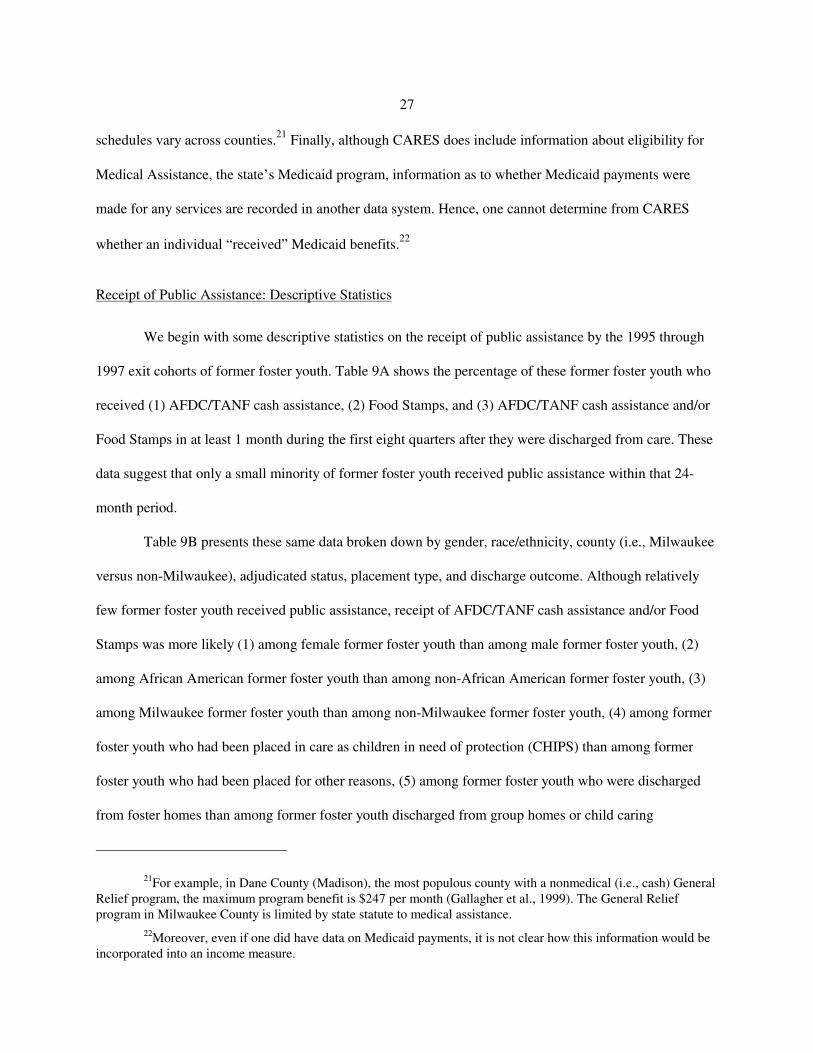
schedules vary across counties.21 Finally, although CARES does include information about eligibility for
Medical Assistance, the state’s Medicaid program, information as to whether Medicaid payments were
made for any services are recorded in another data system. Hence, one cannot determine from CARES
whether an individual “received” Medicaid benefits.22
Receipt of Public Assistance: Descriptive Statistics
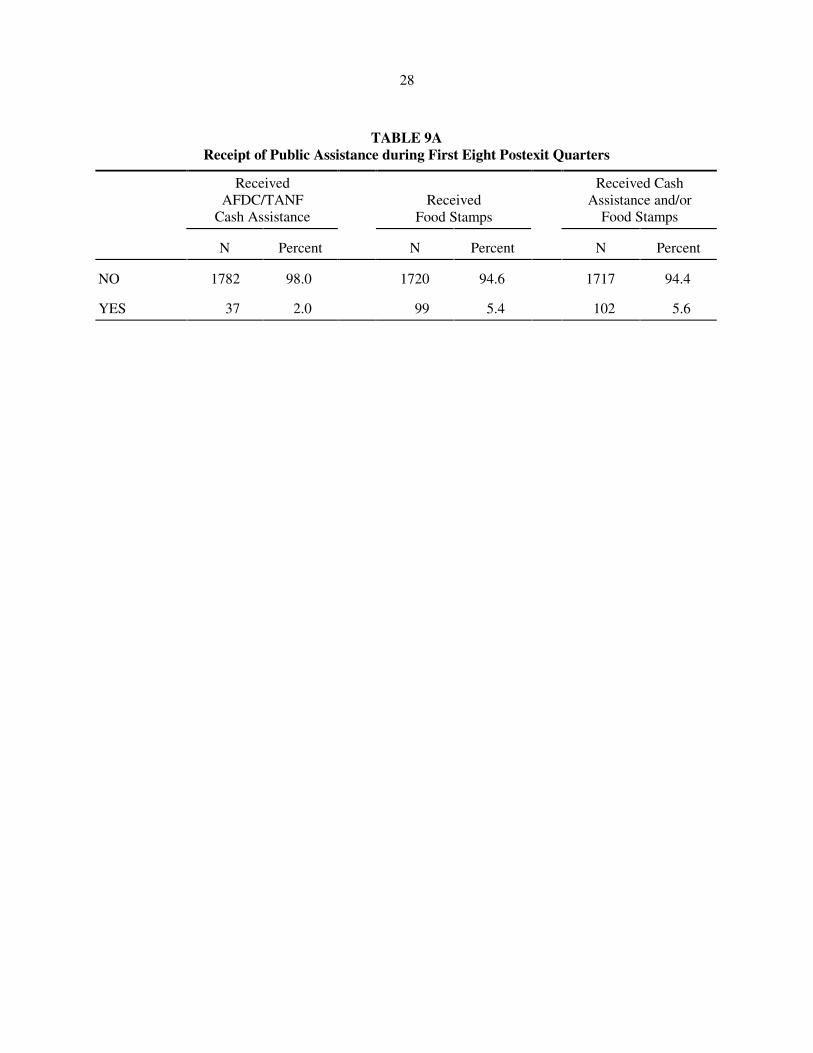
We begin with some descriptive statistics on the receipt of public assistance by the 1995 through
1997 exit cohorts of former foster youth. Table 9A shows the percentage of these former foster youth who
received (1) AFDC/TANF cash assistance, (2) Food Stamps, and (3) AFDC/TANF cash assistance and/or
Food Stamps in at least 1 month during the first eight quarters after they were discharged from care. These
data suggest that only a small minority of former foster youth received public assistance within that 24-
month period.
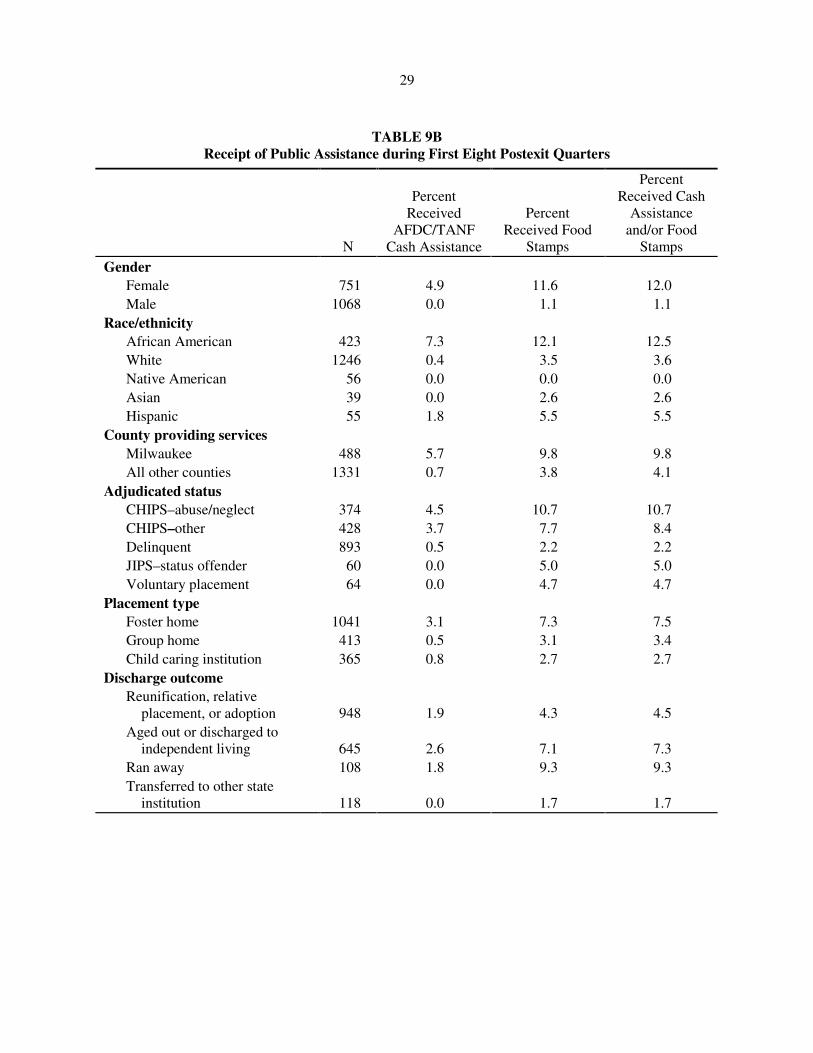
Table 9B presents these same data broken down by gender, race/ethnicity, county (i.e., Milwaukee
versus non-Milwaukee), adjudicated status, placement type, and discharge outcome. Although relatively
few former foster youth received public assistance, receipt of AFDC/TANF cash assistance and/or Food
Stamps was more likely (1) among female former foster youth than among male former foster youth, (2)
among African American former foster youth than among non-African American former foster youth, (3)
among Milwaukee former foster youth than among non-Milwaukee former foster youth, (4) among former
foster youth who had been placed in care as children in need of protection (CHIPS) than among former
foster youth who had been placed for other reasons, (5) among former foster youth who were discharged
from foster homes than among former foster youth discharged from group homes or child caring
21For example, in Dane County (Madison), the most populous county with a nonmedical (i.e., cash) General Relief program, the maximum program benefit is $247 per month (Gallagher et al., 1999). The General Relief program in Milwaukee County is limited by state statute to medical assistance.
22Moreover, even if one did have data on Medicaid payments, it is not clear how this information would be incorporated into an income measure.
28
TABLE 9A Receipt of Public Assistance during First Eight Postexit Quarters
Received AFDC/TANF
Cash Assistance Received
Food Stamps
Received Cash Assistance and/or
Food Stamps
N Percent N Percent N Percent
NO 1782 98.0 1720 94.6 1717 94.4
YES 37 2.0 99 5.4 102 5.6
29
TABLE 9B Receipt of Public Assistance during First Eight Postexit Quarters
N
Percent Received
AFDC/TANF Cash Assistance
Percent Received Food
Stamps
Percent Received Cash
Assistance and/or Food
Stamps Gender Female 751 4.9 11.6 12.0 Male 1068 0.0 1.1 1.1 Race/ethnicity African American 423 7.3 12.1 12.5 White 1246 0.4 3.5 3.6 Native American 56 0.0 0.0 0.0 Asian 39 0.0 2.6 2.6 Hispanic 55 1.8 5.5 5.5 County providing services Milwaukee 488 5.7 9.8 9.8 All other counties 1331 0.7 3.8 4.1 Adjudicated status CHIPS–abuse/neglect 374 4.5 10.7 10.7 CHIPS–other 428 3.7 7.7 8.4 Delinquent 893 0.5 2.2 2.2 JIPS–status offender 60 0.0 5.0 5.0 Voluntary placement 64 0.0 4.7 4.7 Placement type Foster home 1041 3.1 7.3 7.5 Group home 413 0.5 3.1 3.4 Child caring institution 365 0.8 2.7 2.7 Discharge outcome
Reunification, relative placement, or adoption 948 1.9 4.3 4.5
Aged out or discharged to independent living 645 2.6 7.1 7.3
Ran away 108 1.8 9.3 9.3 Transferred to other state
institution 118 0.0 1.7 1.7
30
institutions, and (6) among former foster youth who ran away from care or who aged out or who were
discharged to independent living than among former foster youth who were reunified, placed with
relatives, or adopted, or who were transferred to a state institution.23
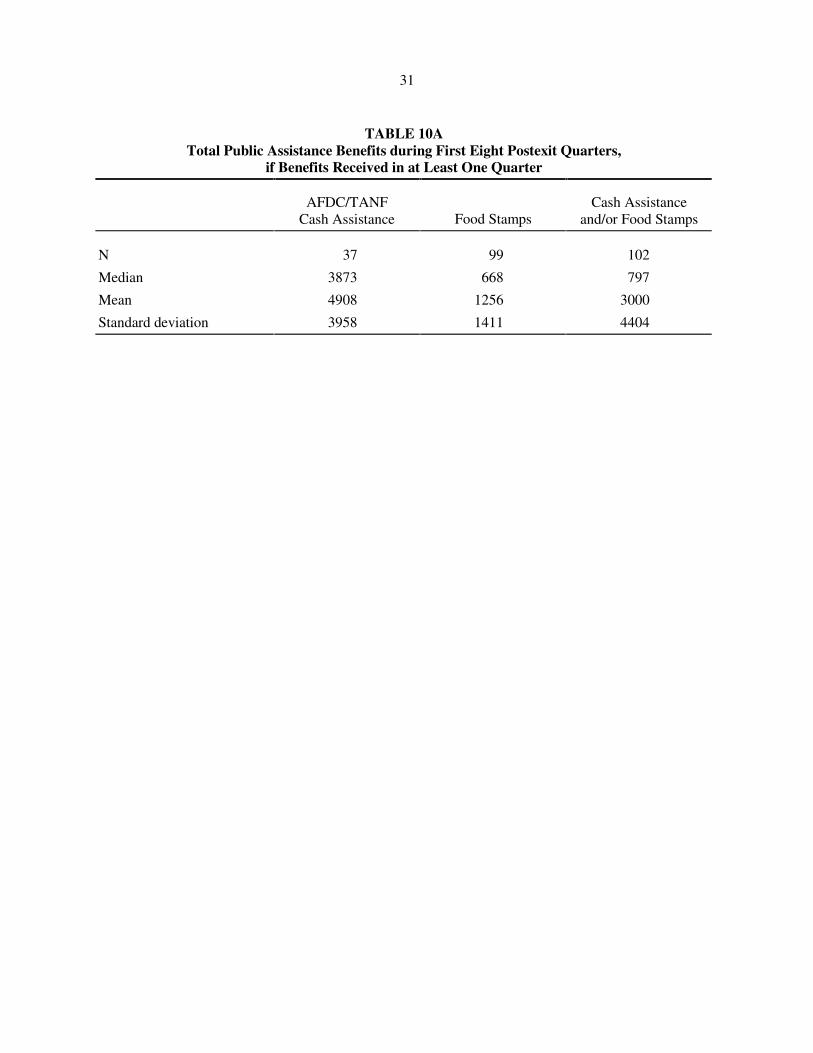
Table 10A shows the total amount of (1) AFDC/TANF cash assistance, (2) Food Stamps, and (3)
AFDC/TANF cash assistance and/or Food Stamps that former foster youth received during the first eight
quarters after they were discharged from care among those former foster youth who received AFDC/TANF
cash assistance and/or Food Stamps in at least 1 month during those eight quarters.
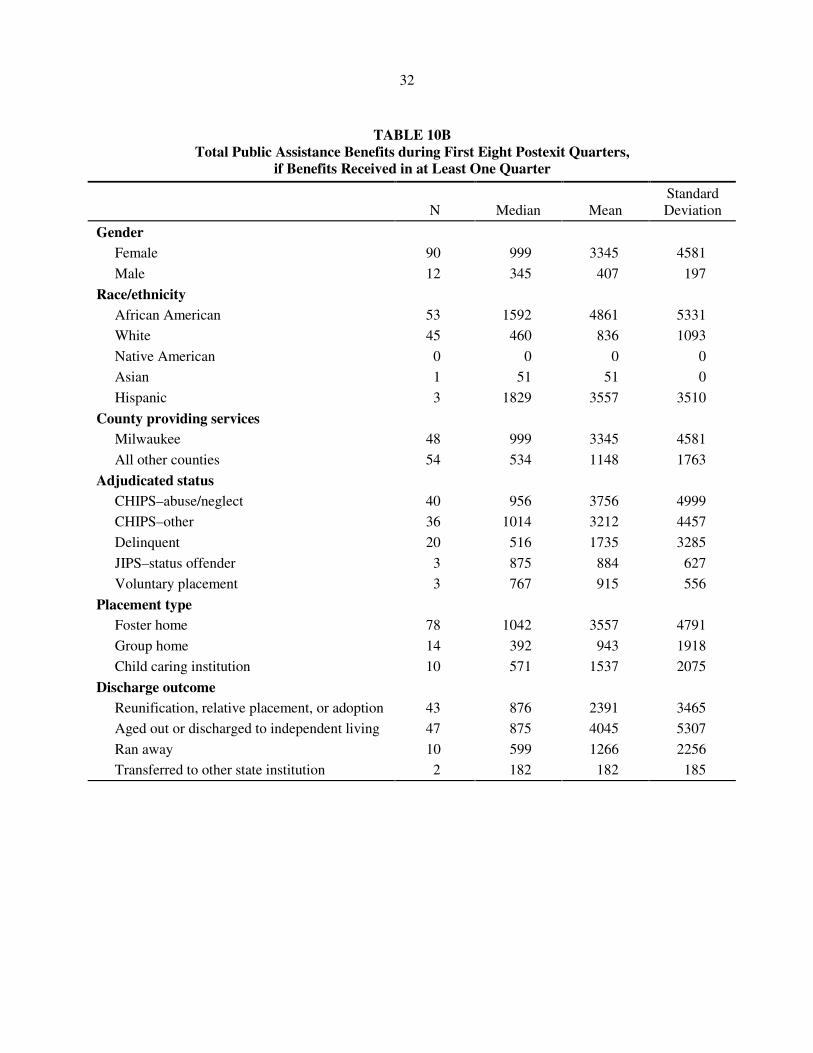
Table 10B shows the total amount of AFDC/TANF cash assistance and/or Food Stamps former
foster youth received during the first eight quarters after they were discharged from care broken down by
gender, race/ethnicity, county (i.e., Milwaukee versus non-Milwaukee), adjudicated status, placement type,
and discharge outcome. Conditional upon receiving AFDC/TANF cash assistance and/or Food Stamps,
there was considerable variation across different groups of former foster youth in terms of the total amount
of AFDC/TANF cash assistance and/or Food Stamps that they received.24 AFDC/TANF cash assistance
and/or Food Stamps totals tended to be higher among female former foster youth than among male former
foster youth, among African-American former foster youth than among white former foster youth, among
Milwaukee former foster youth than among non-Milwaukee former foster youth, among former foster
youth placed as children in need of protection (CHIPS) than among former foster youth who had been
adjudicated delinquent, and among former foster youth who had been discharged from foster homes than
23The gender difference in AFDC/TANF receipt is not surprising given that only former foster youth who were caring for dependent children (or were pregnant, in the case of AFDC) would have been eligible for cash assistance. The gender difference in Food Stamp receipt is smaller, but still substantial. Although Food Stamp eligibility is not limited to families with dependent children, able-bodied adults without dependents are only eligible for 3 months of Food Stamp benefits in any 36-month period unless certain work requirements are met under the 1996 Personal Responsibility and Work Opportunity Reconcilation Act.
24It is possible that differences in the total amount of AFDC/TANF cash assistance and/or Food Stamps that former foster youth received are the result of differences in the number of quarters for which AFDC/TANF cash assistance and/or Food Stamps were nonzero. However, one finds similar differences when amount of AFDC/TANF cash assistance and/or Food Stamps per quarter is used.
31
TABLE 10A
Total Public Assistance Benefits during First Eight Postexit Quarters, if Benefits Received in at Least One Quarter
AFDC/TANF
Cash Assistance Food Stamps Cash Assistance
and/or Food Stamps
N 37 99 102
Median 3873 668 797
Mean 4908 1256 3000
Standard deviation 3958 1411 4404
32
TABLE 10B Total Public Assistance Benefits during First Eight Postexit Quarters,
if Benefits Received in at Least One Quarter
N Median Mean Standard Deviation
Gender
Female 90 999 3345 4581
Male 12 345 407 197
Race/ethnicity
African American 53 1592 4861 5331
White 45 460 836 1093
Native American 0 0 0 0
Asian 1 51 51 0
Hispanic 3 1829 3557 3510
County providing services
Milwaukee 48 999 3345 4581
All other counties 54 534 1148 1763
Adjudicated status
CHIPS–abuse/neglect 40 956 3756 4999
CHIPS–other 36 1014 3212 4457
Delinquent 20 516 1735 3285
JIPS–status offender 3 875 884 627
Voluntary placement 3 767 915 556
Placement type
Foster home 78 1042 3557 4791
Group home 14 392 943 1918
Child caring institution 10 571 1537 2075
Discharge outcome
Reunification, relative placement, or adoption 43 876 2391 3465
Aged out or discharged to independent living 47 875 4045 5307
Ran away 10 599 1266 2256
Transferred to other state institution 2 182 182 185
33
among former foster youth discharged from either group homes or child caring institutions. Although there
was little difference in median total AFDC/TANF cash assistance and/or Food Stamps between former
foster youth who had been discharged to live with family and former foster youth who had aged out of care
or been discharged to independent living, the mean total was substantially higher among the latter, and
both groups tended to have received higher amounts of AFDC/TANF cash assistance and/or Food Stamps
than former foster youth who exited care by running away.
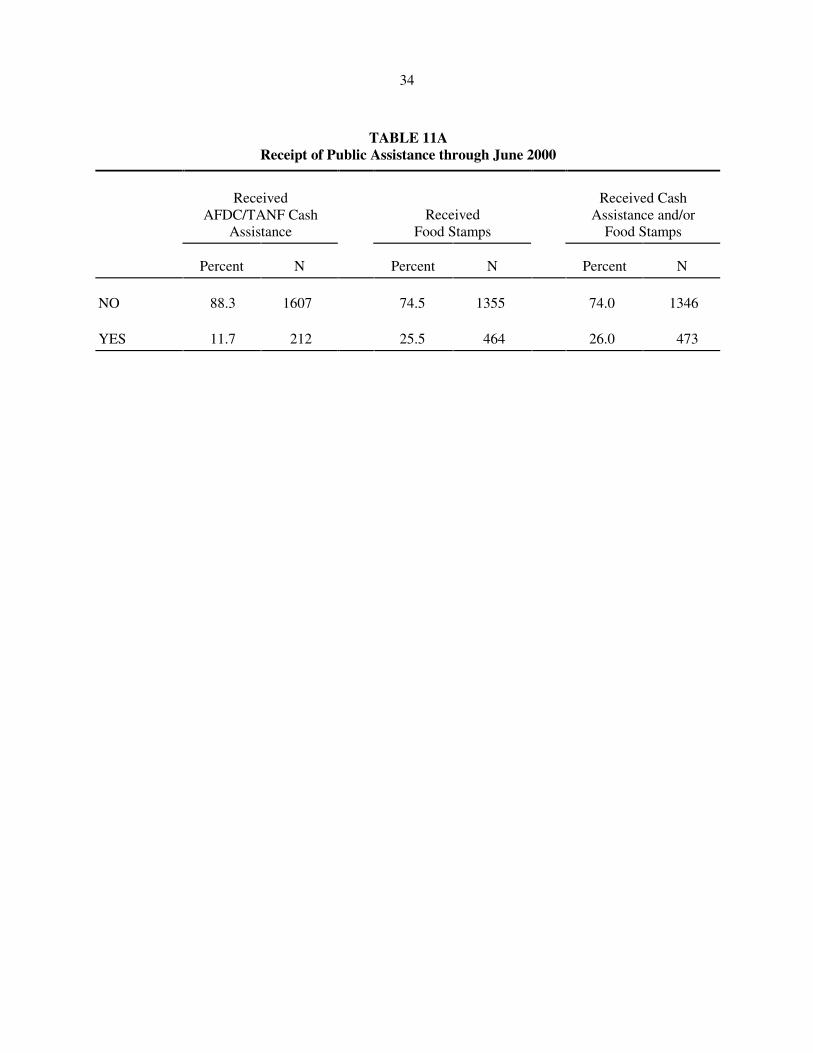
Thus far, our analysis has been limited to public assistance utilization during the first eight
quarters after former foster youth had been discharged from care. Table 11A shows what happens when the
observation period for the 1995 to 1997 exit cohorts is extended beyond the first eight quarters through
June 2000. Perhaps not surprisingly, extending the observation period increases the percentage of former
foster youth who received AFDC/TANF cash assistance and/or Food Stamps after exiting out-of-home
care.
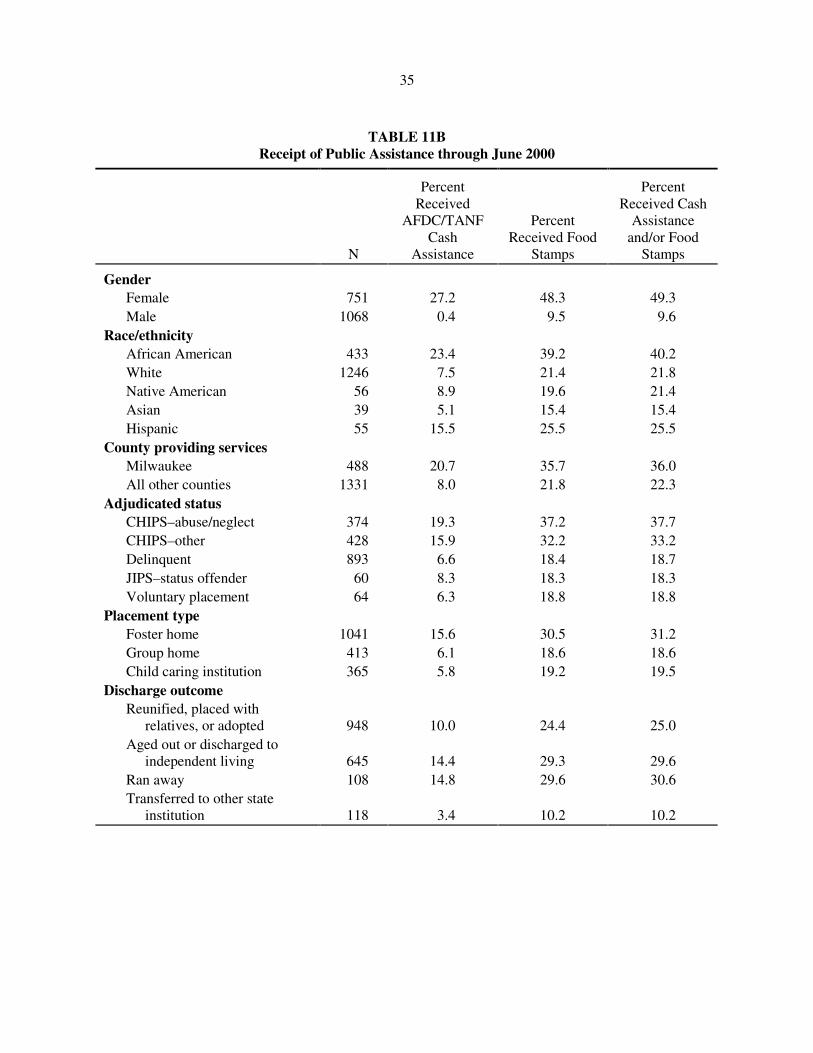
Table 11B shows the same data broken down by gender, race/ethnicity, county (i.e., Milwaukee
versus non-Milwaukee), adjudicated status, placement type, and discharge outcome. The between-group
differences are similar to those found in Table 10B, suggesting that differences in the likelihood of using
public assistance tend to be maintained over time.25
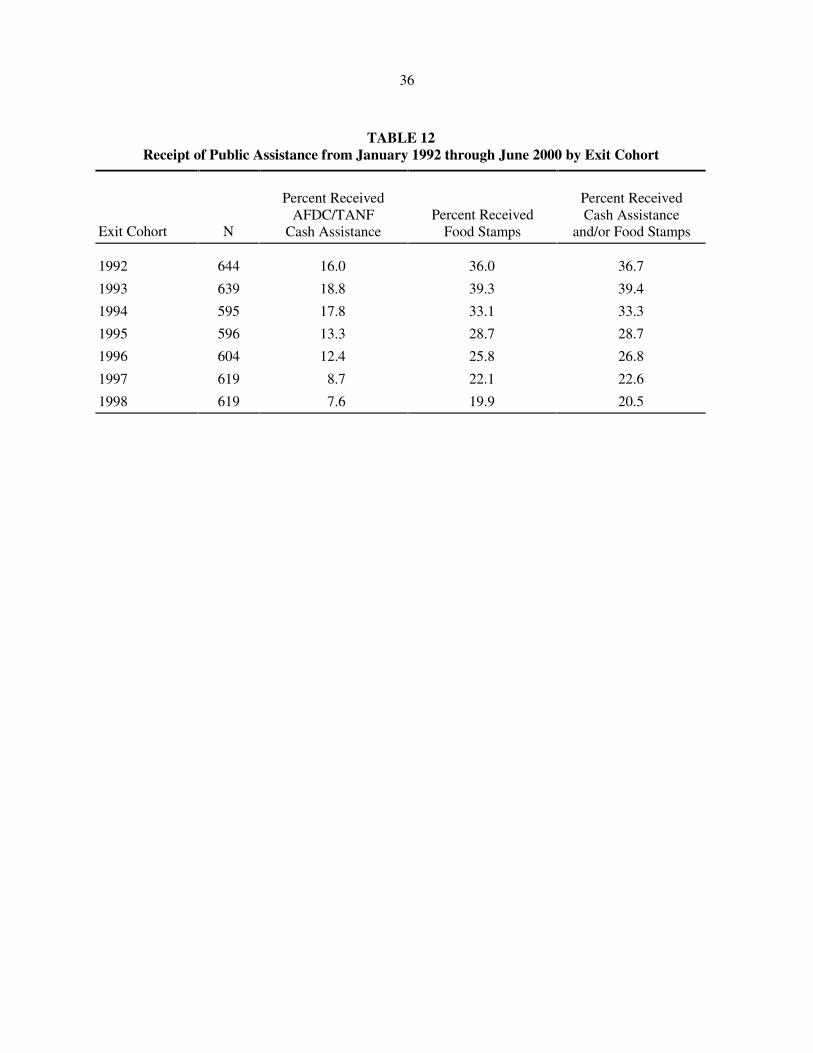
Finally, although we do not yet have UI data for the early exit cohorts in our larger sample (i.e.,
those former youth who exited care in 1992, 1993, and 1994), we do have CARES data for these early
cohorts. Table 12 shows the percentage of former foster youth in each of those exit cohorts who received
AFDC/TANF cash assistance and/or Food Stamps at any time through June 2000. In general, as years
since discharge increases, so too does the likelihood of ever having received AFDC/TANF cash assistance
and/or Food Stamps. Although this relationship between years since discharge and the likelihood of public
25The one dissimilarity between Table 11B and Table 10B is that former foster youth who had aged out or been discharged to independent living were no longer the most likely to have received AFDC/TANF cash assistance once the observation period was extended.
34
TABLE 11A Receipt of Public Assistance through June 2000
Received AFDC/TANF Cash
Assistance Received
Food Stamps
Received Cash Assistance and/or
Food Stamps
Percent N Percent N Percent N
NO 88.3 1607 74.5 1355 74.0 1346
YES 11.7 212 25.5 464 26.0 473
35
TABLE 11B Receipt of Public Assistance through June 2000
N
Percent Received
AFDC/TANF Cash
Assistance
Percent Received Food
Stamps
Percent Received Cash
Assistance and/or Food
Stamps
Gender Female 751 27.2 48.3 49.3 Male 1068 0.4 9.5 9.6 Race/ethnicity African American 433 23.4 39.2 40.2 White 1246 7.5 21.4 21.8 Native American 56 8.9 19.6 21.4 Asian 39 5.1 15.4 15.4 Hispanic 55 15.5 25.5 25.5 County providing services Milwaukee 488 20.7 35.7 36.0 All other counties 1331 8.0 21.8 22.3 Adjudicated status CHIPS–abuse/neglect 374 19.3 37.2 37.7 CHIPS–other 428 15.9 32.2 33.2 Delinquent 893 6.6 18.4 18.7 JIPS–status offender 60 8.3 18.3 18.3 Voluntary placement 64 6.3 18.8 18.8 Placement type Foster home 1041 15.6 30.5 31.2 Group home 413 6.1 18.6 18.6 Child caring institution 365 5.8 19.2 19.5 Discharge outcome Reunified, placed with
relatives, or adopted 948 10.0 24.4 25.0 Aged out or discharged to
independent living 645 14.4 29.3 29.6 Ran away 108 14.8 29.6 30.6 Transferred to other state
institution 118 3.4 10.2 10.2
36
TABLE 12 Receipt of Public Assistance from January 1992 through June 2000 by Exit Cohort
Exit Cohort N
Percent Received AFDC/TANF
Cash Assistance Percent Received
Food Stamps
Percent Received Cash Assistance
and/or Food Stamps
1992 644 16.0 36.0 36.7
1993 639 18.8 39.3 39.4
1994 595 17.8 33.1 33.3
1995 596 13.3 28.7 28.7
1996 604 12.4 25.8 26.8
1997 619 8.7 22.1 22.6
1998 619 7.6 19.9 20.5
37
assistance utilization might have been expected, the implications of these data are disconcerting. In
particular, they suggest that 6 to 8 years after being discharged from care, a third or more of former foster
youth will have received AFDC/TANF cash assistance and/or Food Stamps.
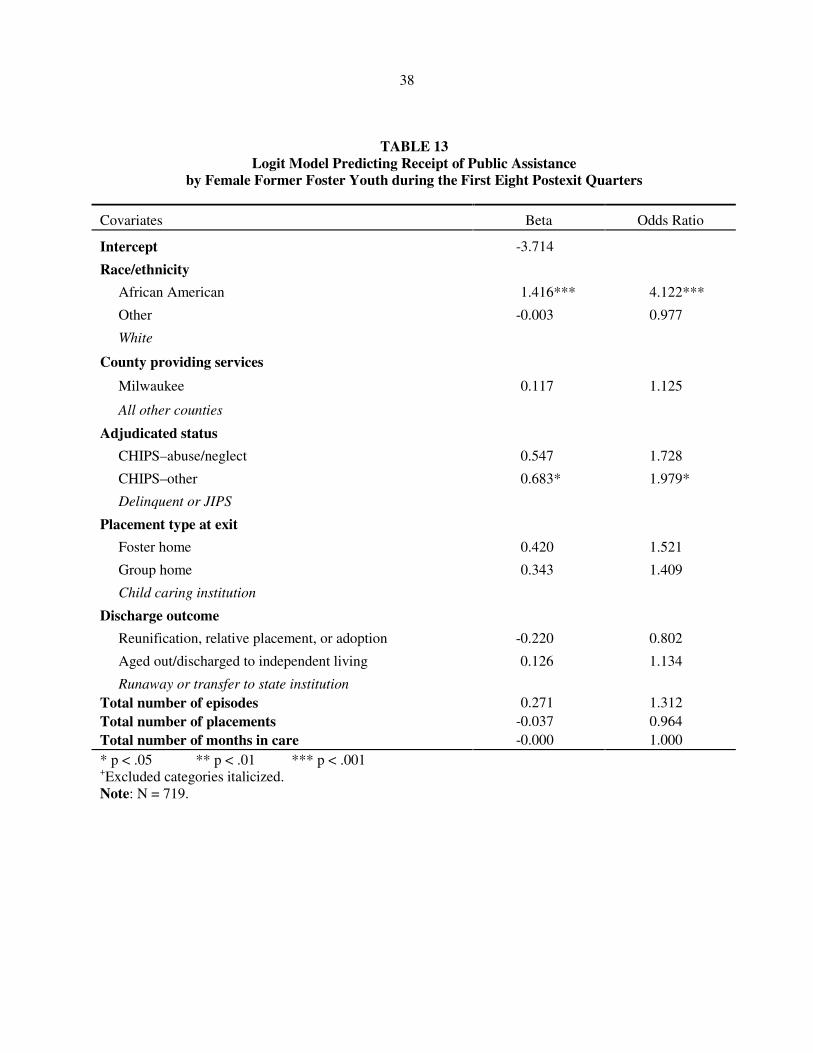
Receipt of Public Assistance: Multivariate Analysis
We estimated a logistic regression model in which receipt of AFDC/TANF cash assistance and/or
Food Stamps during the first eight quarters after discharge from out-of-home care was regressed on a set of
covariates representing the demographic characteristics (e.g., gender, race/ethnicity) and out-of-home care
experiences (e.g., placement type, number of placements, length of stay in care) of the former foster
youth.26 We limited the analysis to female former foster youth because so few male former foster youth
were AFDC/TANF cash assistance and/or Food Stamp recipients. We also excluded the relatively small
number of former foster youth who had been placed voluntarily. Table 13 shows the parameter estimates
and odds ratios for this model. An odds ratio greater than 1 means that, controlling for all other covariates
in the model, the group with that characteristic is more likely to have received AFDC/TANF cash
assistance and/or Food Stamps than the comparison group, whereas an odds ratio less than 1 means that the
group with that characteristic is less likely to have received AFDC/TANF cash assistance and/or Food
Stamps than the comparison group. Former foster youth who were African American were significantly
more likely to have received AFDC/TANF cash assistance and/or Food Stamps than former foster youth
who were white, and former foster youth who were placed in care as children in need of protection
(CHIPS) for reasons other than abuse or neglect were significantly more likely to have received
AFDC/TANF cash assistance and/or Food Stamps than former foster youth who were adjudicated
delinquents or status offenders.
26The dependent variable is coded as 1 if the youth received AFDC/TANF cash assistance and/or Food Stamps in at least one of the first eight postexit quarters and 0 if the youth did not.
38
TABLE 13 Logit Model Predicting Receipt of Public Assistance
by Female Former Foster Youth during the First Eight Postexit Quarters
Covariates Beta Odds Ratio
Intercept -3.714
Race/ethnicity
African American 1.416*** 4.122***
Other -0.003 0.977
White
County providing services
Milwaukee 0.117 1.125
All other counties
Adjudicated status
CHIPS–abuse/neglect 0.547 1.728
CHIPS–other 0.683* 1.979*
Delinquent or JIPS
Placement type at exit
Foster home 0.420 1.521
Group home 0.343 1.409
Child caring institution
Discharge outcome
Reunification, relative placement, or adoption -0.220 0.802
Aged out/discharged to independent living 0.126 1.134
Runaway or transfer to state institution Total number of episodes 0.271 1.312 Total number of placements -0.037 0.964 Total number of months in care -0.000 1.000 * p < .05 ** p < .01 *** p < .001 +Excluded categories italicized. Note: N = 719.
39
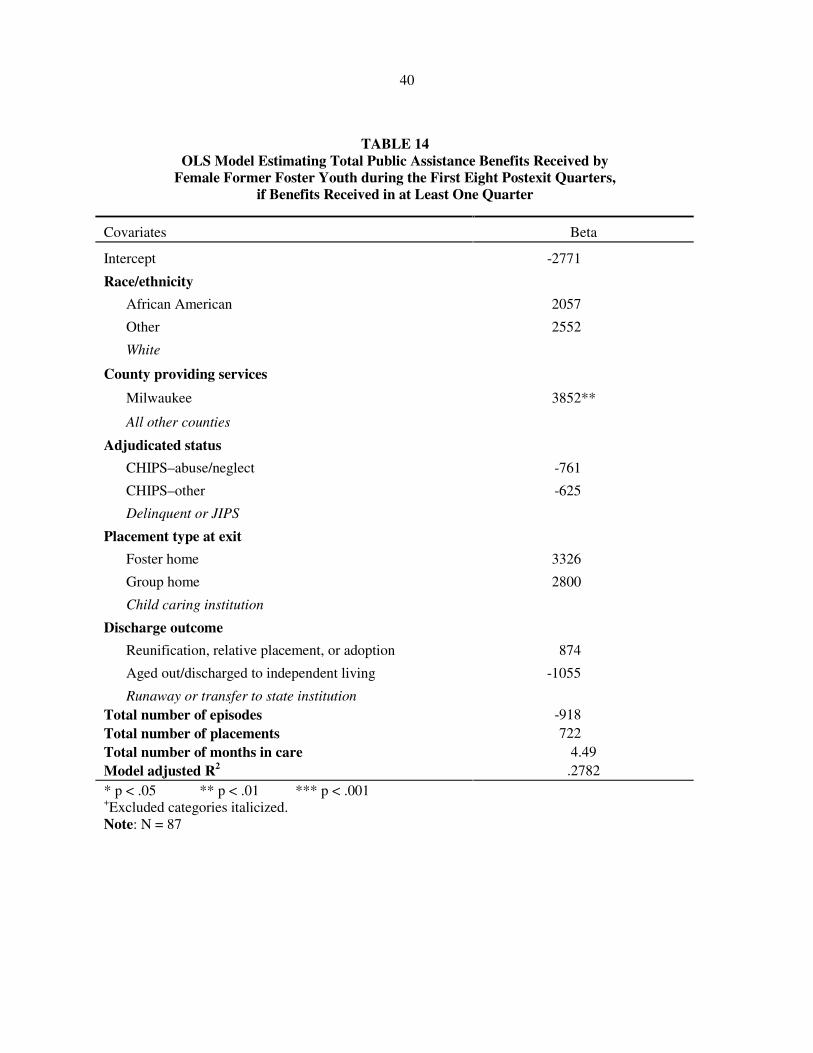
We also estimated an OLS regression model in which the total amount of AFDC/TANF cash
assistance and/or Food Stamps received during the first eight quarters after discharge from out-of-home
care was regressed on the same set of covariates used in the preceding model. This analysis is limited to the
87 female former foster youth who had been AFDC/TANF cash assistance and/or Food Stamp recipients
(and had not been placed in care voluntarily). Table 14 shows the parameter estimates for this model. The
total amount of AFDC/TANF cash assistance and/or Food Stamps received by Milwaukee former foster
youth was significantly higher than the total amount received by non-Milwaukee former foster youth. And
while the total amount of AFDC/TANF cash assistance and/or Food Stamps received by African American
former foster youth was higher than the total amount received by white former foster youth, the coefficient
was only marginally significant, perhaps because of the small sample size.
4. TOTAL INCOME FROM EARNINGS AND PUBLIC ASSISTANCE
Thus far, we have examined both total earnings from "covered" employment and total
AFDC/TANF cash assistance and/or Food Stamps during the first eight quarters after former foster youth
were discharged from care. In this section, we include both of these sources of income in our analysis.
We use three outcome measures in our analysis of these data. The first measure is total income
from earnings and public assistance during the first eight postexit quarters. We compute this measure by
summing the total earnings and total AFDC/TANF cash assistance and/or Food Stamps from the earlier
analyses. Although we refer to this measure below as “total income,” it actually should be thought of as a
lower bound because there are several potential sources of income that it does not take into account,
including benefits from other government programs (e.g., SSI), earnings from employment that is not
“covered,” or money from family and friends. The second measure is the percentage of total income from
earnings and the third is the percentage of total income from AFDC/TANF cash assistance and/or Food
40
TABLE 14 OLS Model Estimating Total Public Assistance Benefits Received by
Female Former Foster Youth during the First Eight Postexit Quarters, if Benefits Received in at Least One Quarter
Covariates Beta
Intercept -2771
Race/ethnicity
African American 2057
Other 2552
White
County providing services
Milwaukee 3852**
All other counties
Adjudicated status
CHIPS–abuse/neglect -761
CHIPS–other -625
Delinquent or JIPS
Placement type at exit
Foster home 3326
Group home 2800
Child caring institution
Discharge outcome
Reunification, relative placement, or adoption 874
Aged out/discharged to independent living -1055
Runaway or transfer to state institution Total number of episodes -918 Total number of placements 722 Total number of months in care 4.49 Model adjusted R2 .2782 * p < .05 ** p < .01 *** p < .001 +Excluded categories italicized. Note: N = 87
41
Stamps. We compute the second measure by dividing earnings by total income and the third measure by
dividing AFDC/TANF cash assistance and/or Food Stamps by total income.
Total Income: Descriptive Statistics
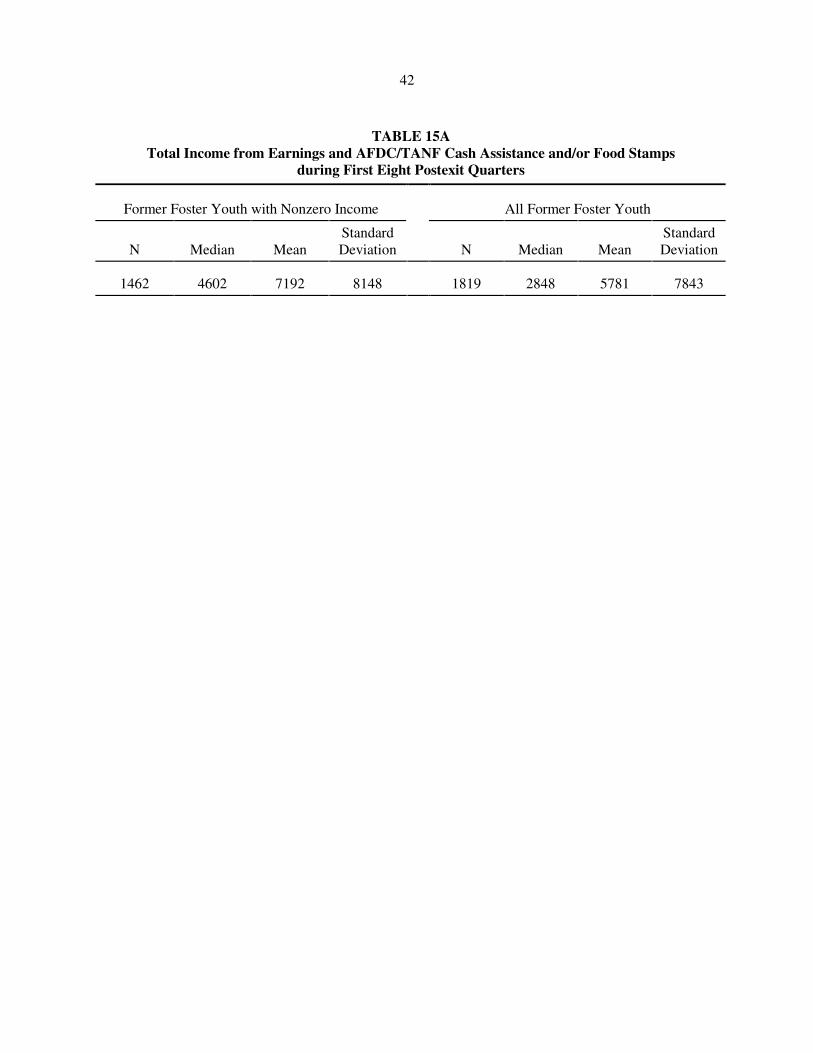
Table 15A shows the total income from earnings and AFDC/TANF cash assistance and/or Food
Stamps during the first eight quarters after discharge among the 1995 through 1997 exit cohorts of former
foster youth for (1) only those former foster youth whose total income was nonzero and (2) all former
foster youth, including those whose total income was zero. Not surprisingly, both median and mean total
income are considerably higher when the analysis is limited to those with nonzero income.
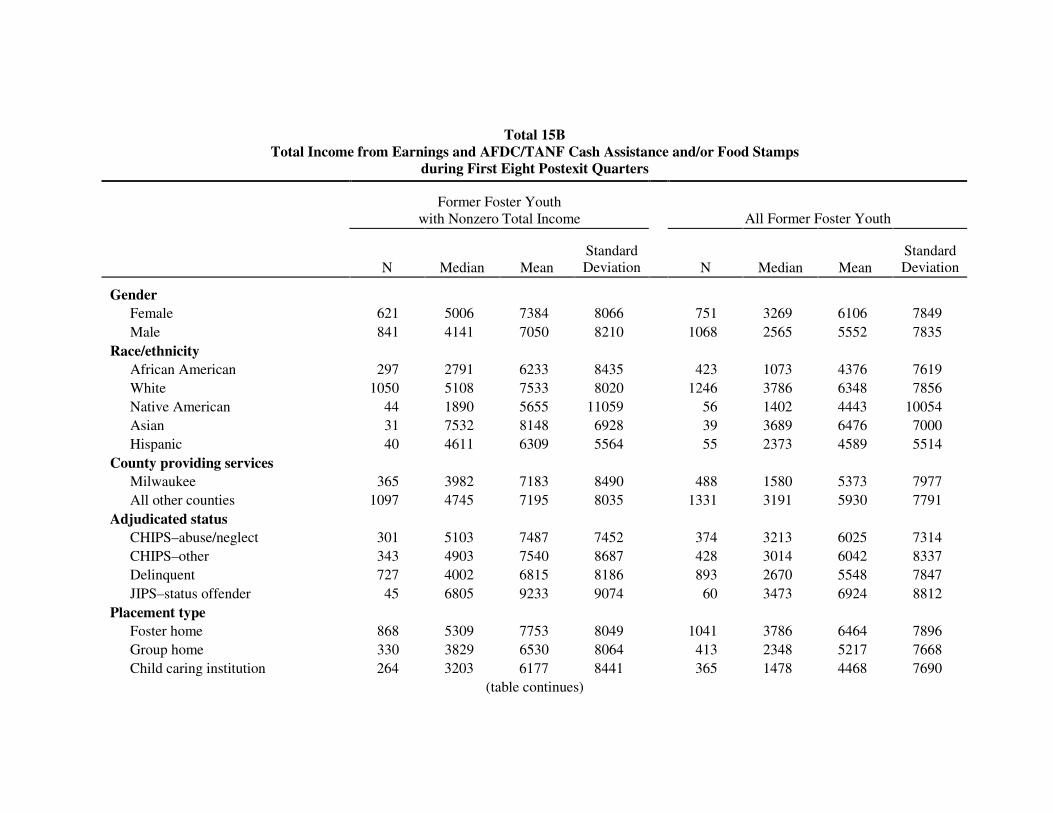
Table 15B shows the same data broken down by gender, race/ethnicity, county (i.e., Milwaukee
versus non-Milwaukee), adjudicated status, placement type, and discharge outcome. When the analysis is
limited to former foster youth with nonzero total income, total income tends to be higher (1) among female
than among male former foster youth, (2) among white or Asian than among African American, Native
American, or Hispanic former foster youth, (3) among non-Milwaukee than among Milwaukee former
foster youth, (4) among former foster youth who had been adjudicated status offenders (JIPS) or children
in need of protection (CHIPS) than among former foster youth who had been adjudicated delinquent or
placed voluntarily, (5) among former foster youth who had been discharged from foster homes than among
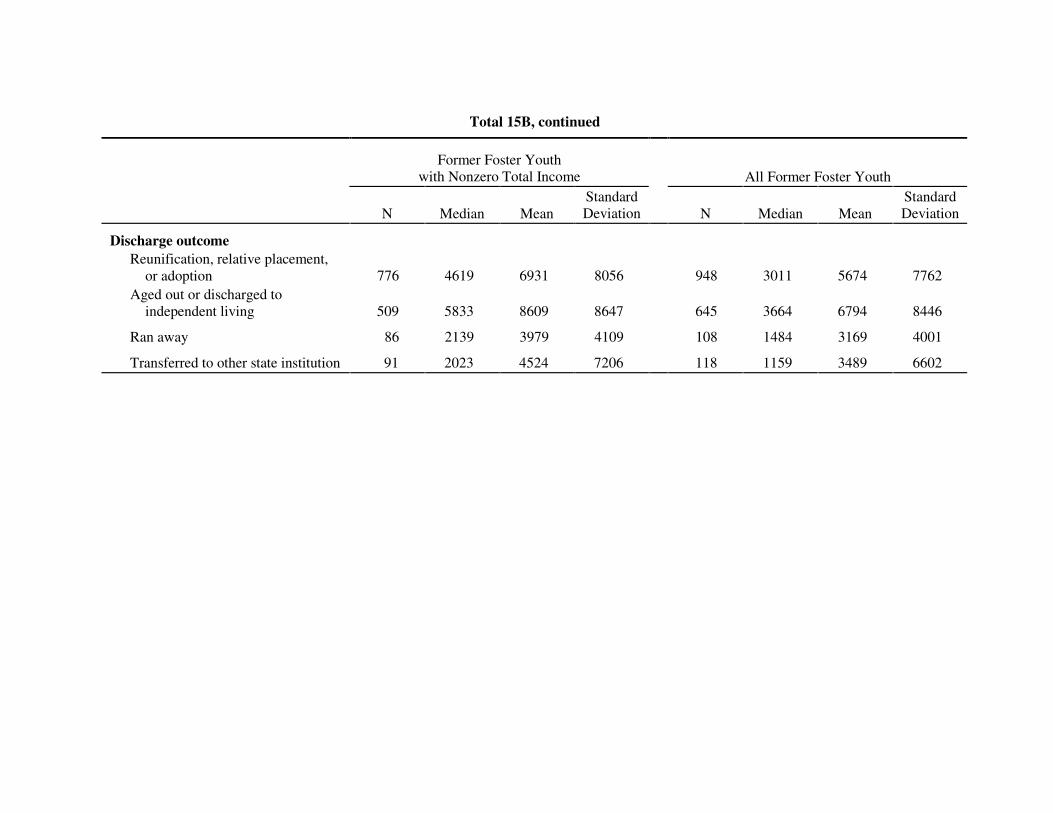
former foster youth discharged from group homes or institutions, and (6) among former foster youth who
aged out or were discharged to independent living or former foster youth who were reunified, placed with
relatives, or adopted than among former foster youth who ran away from care or who were transferred to a
state institution. When the analysis is extended to include former foster youth with zero total income, the
relative differences in total income are essentially the same.27
27The one exception is that median total income among former foster youth who had been placed voluntarily is no longer lower than median total income among former foster youth who had been adjudicated children in need of protection (CHIPS).
42
TABLE 15A Total Income from Earnings and AFDC/TANF Cash Assistance and/or Food Stamps
during First Eight Postexit Quarters
Former Foster Youth with Nonzero Income All Former Foster Youth
N Median Mean Standard Deviation N Median Mean
Standard Deviation
1462 4602 7192 8148 1819 2848 5781 7843
Total 15B Total Income from Earnings and AFDC/TANF Cash Assistance and/or Food Stamps
during First Eight Postexit Quarters
Former Foster Youth
with Nonzero Total Income All Former Foster Youth
N Median Mean Standard Deviation N Median Mean
Standard Deviation
Gender Female 621 5006 7384 8066 751 3269 6106 7849 Male 841 4141 7050 8210 1068 2565 5552 7835 Race/ethnicity African American 297 2791 6233 8435 423 1073 4376 7619 White 1050 5108 7533 8020 1246 3786 6348 7856 Native American 44 1890 5655 11059 56 1402 4443 10054 Asian 31 7532 8148 6928 39 3689 6476 7000 Hispanic 40 4611 6309 5564 55 2373 4589 5514 County providing services Milwaukee 365 3982 7183 8490 488 1580 5373 7977 All other counties 1097 4745 7195 8035 1331 3191 5930 7791 Adjudicated status CHIPS–abuse/neglect 301 5103 7487 7452 374 3213 6025 7314 CHIPS–other 343 4903 7540 8687 428 3014 6042 8337 Delinquent 727 4002 6815 8186 893 2670 5548 7847 JIPS–status offender 45 6805 9233 9074 60 3473 6924 8812 Placement type Foster home 868 5309 7753 8049 1041 3786 6464 7896 Group home 330 3829 6530 8064 413 2348 5217 7668 Child caring institution 264 3203 6177 8441 365 1478 4468 7690
(table continues)
Total 15B, continued
Former Foster Youth
with Nonzero Total Income All Former Foster Youth
N Median Mean Standard Deviation N Median Mean
Standard Deviation
Discharge outcome Reunification, relative placement,
or adoption 776 4619 6931 8056 948 3011 5674 7762 Aged out or discharged to
independent living 509 5833 8609 8647 645 3664 6794 8446
Ran away 86 2139 3979 4109 108 1484 3169 4001
Transferred to other state institution 91 2023 4524 7206 118 1159 3489 6602
45
Total Income: Multivariate Analysis
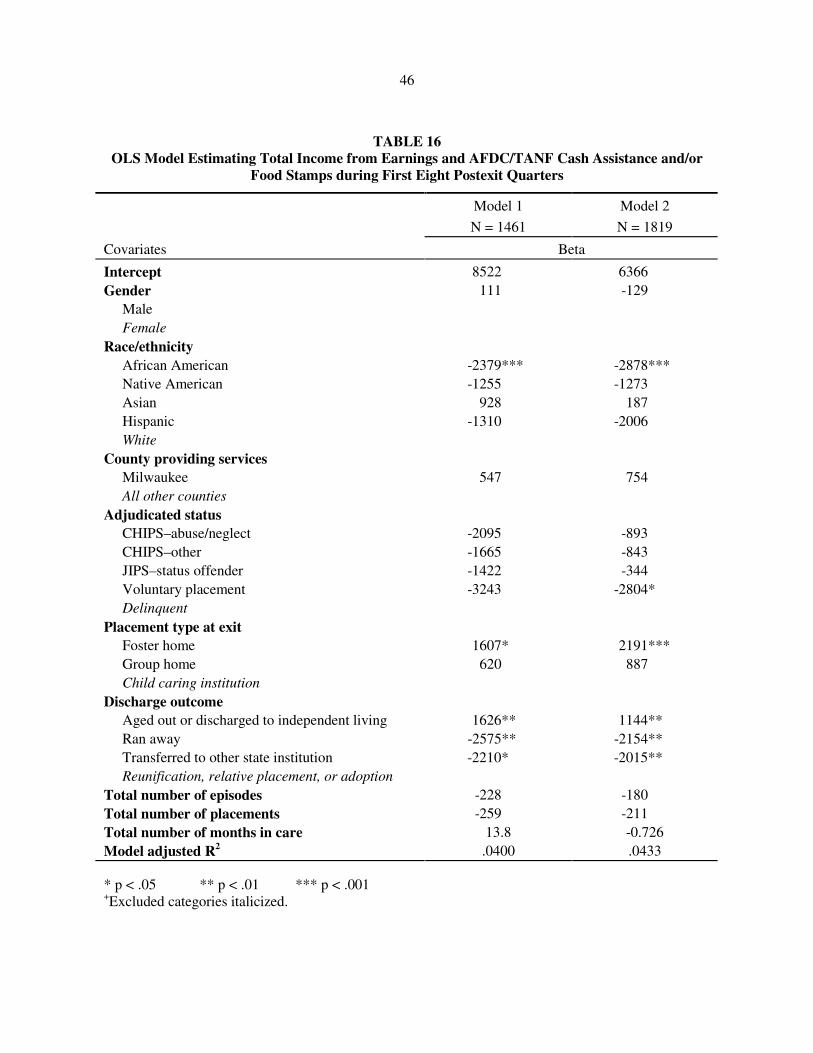
We estimated two OLS regression models in which total income from earnings and AFDC/TANF
cash assistance and/or Food Stamps during the first eight quarters after discharge from care was regressed
on the same set of covariates used in the earnings regression models. The only difference between the two
models is that the first is estimated for the 1,462 former foster youth whose total income was nonzero
while the second is estimated for all 1,819 former foster youth, including those whose total income was
zero. Table 16 shows the parameter estimates for these models. Looking first at the model estimated for the
1,462 former foster youth with nonzero total income, total income was significantly lower among former
foster youth who (1) were African American than those who were white, (2) had been placed voluntarily
than those who had been adjudicated delinquent, and (3) had run away from care or been transferred to a
state institution than those who had been reunified, placed with relatives, or adopted. Conversely, total
income was significantly higher among former foster youth who (1) were discharged from foster homes
than those who had been discharged from child caring institutions and (2) had aged out of care or been
discharged to independent living than those who had been reunified, placed with relatives, or adopted. The
results are similar when the model is estimated for all 1,819 former foster youth, with the exception that
the coefficient for voluntary placement is only marginally significant.
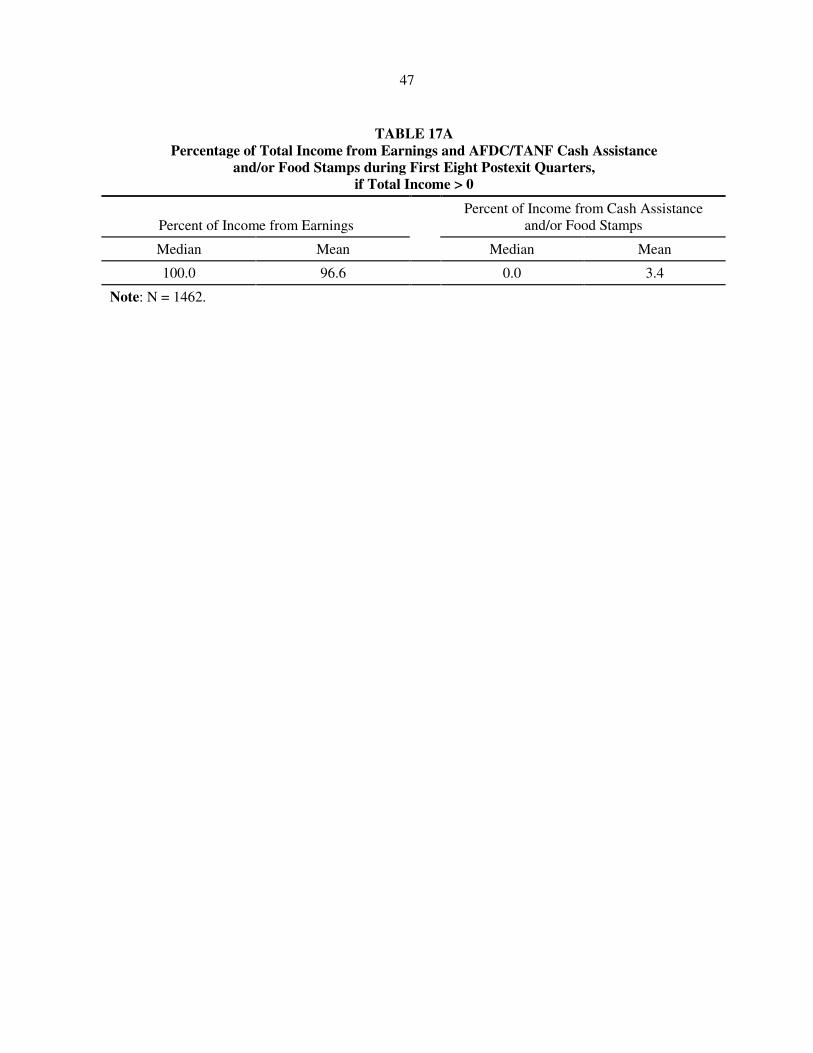
Table 17A shows the percentage of total income from earnings and the percentage of total income
from AFDC/TANF cash assistance and/or Food Stamps during the first eight quarters after discharge
among those former foster youth whose total income was nonzero. The most notable finding is that the
median percentage of total income from earnings is 100 percent and the median percentage of total income
from AFDC/TANF cash assistance and/or Food Stamps is 0 percent. This reflects the fact that while 79.1
percent of the former foster had at least some earnings from employment, only 5.6 percent received
AFDC/TANF cash assistance and/or Food Stamps.
46
TABLE 16 OLS Model Estimating Total Income from Earnings and AFDC/TANF Cash Assistance and/or
Food Stamps during First Eight Postexit Quarters
Model 1 Model 2
N = 1461 N = 1819
Covariates Beta
Intercept 8522 6366 Gender 111 -129 Male Female Race/ethnicity African American -2379*** -2878*** Native American -1255 -1273 Asian 928 187 Hispanic -1310 -2006 White County providing services Milwaukee 547 754 All other counties Adjudicated status CHIPS–abuse/neglect -2095 -893 CHIPS–other -1665 -843 JIPS–status offender -1422 -344 Voluntary placement -3243 -2804* Delinquent Placement type at exit Foster home 1607* 2191*** Group home 620 887 Child caring institution Discharge outcome Aged out or discharged to independent living 1626** 1144** Ran away -2575** -2154** Transferred to other state institution -2210* -2015** Reunification, relative placement, or adoption Total number of episodes -228 -180 Total number of placements -259 -211 Total number of months in care 13.8 -0.726 Model adjusted R2 .0400 .0433
* p < .05 ** p < .01 *** p < .001 +Excluded categories italicized.
47
TABLE 17A
Percentage of Total Income from Earnings and AFDC/TANF Cash Assistance and/or Food Stamps during First Eight Postexit Quarters,
if Total Income > 0
Percent of Income from Earnings Percent of Income from Cash Assistance
and/or Food Stamps
Median Mean Median Mean
100.0 96.6 0.0 3.4
Note: N = 1462.
48
TABLE 17B Percentage of Total Income from Earnings and AFDC/TANF Cash Assistance
and/or Food Stamps during First Eight Postexit Quarters, if Total Income > 0
Percent of Total
Income from Earnings
Percent of Total Income from
Cash Assistance and/or Food Stamps
N Median Mean Median Mean
Gender
Female 621 100.0 93.0 0.0 7.0
Male 841 100.0 99.3 0.0 0.7
Race/ethnicity
African American 297 100.0 89.1 0.0 10.9
White 1050 100.0 98.5 0.0 1.5
Native American 44 100.0 100.0 0.0 0.0
Asian 31 100.0 99.9 0.0 0.02
Hispanic 40 100.0 97.3 0.0 2.8
County providing services
Milwaukee 365 100.0 91.4 0.0 8.6
All other counties 1050 100.0 98.3 0.0 1.7
Adjudicated status
CHIPS–abuse/neglect 301 100.0 93.2 0.0 6.8
CHIPS–other 343 100.0 95.3 0.0 4.7
Delinquent 727 100.0 98.7 0.0 1.3
JIPS–status offender 45 100.0 97.1 0.0 4.6
Voluntary placement 46 100.0 95.4 0.0 2.9
Placement type
Foster home 868 100.0 95.7 0.0 4.3
Group home 330 100.0 98.4 0.0 1.6
Child caring institution 264 100.0 92.3 0.0 0.8
Discharge outcome
Reunification, relative placement, or adoption 776 100.0 97.1 0.0 3.0
Aged out or discharged to independent living 509 100.0 95.6 0.0 4.4
Ran away 86 100.0 95.0 0.0 2.0
Transferred to other state institution 91 100.0 99.9 0.0 0.04
49
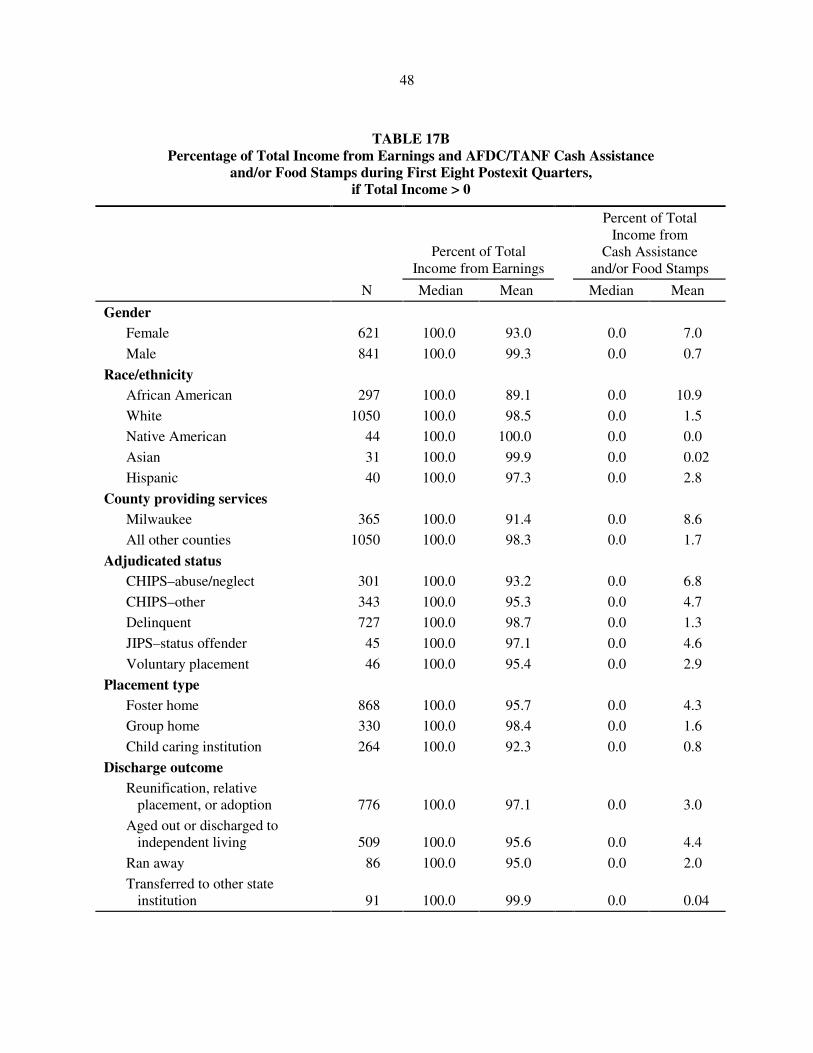
Table 17B shows the same data broken down by gender, race/ethnicity, county (i.e., Milwaukee
versus non-Milwaukee), adjudicated status, placement type, and discharge outcome. For all groups, the
median percentage of total income from earnings is 100 percent and the median percentage of total income
from AFDC/TANF cash assistance and/or Food Stamps is 0 percent. The mean percentage of total income
from cash assistance and/or Food Stamps tends to be higher (1) among female than among male former
foster youth, (2) among African American than among white, Asian, Native American, or Hispanic former
foster youth, (3) among Milwaukee than among non-Milwaukee former foster youth, (4) among former
foster youth who had been adjudicated children in need of protection (CHIPS) or status offenders (JIPS)
than among former foster youth who had been adjudicated delinquent or placed voluntarily, (5) among
former foster youth who had been discharged from foster homes than among former foster youth
discharged from group homes or institutions, and (6) among former foster youth who aged out or were
discharged to independent living or former foster youth who were reunified, placed with relatives, or
adopted than among former foster youth who ran away from care or who were transferred to a state
institution.
5. DISCUSSION AND IMPLICATIONS
The results presented above are based on an analysis of employment, earnings, and public
assistance data from state administrative records for a sample of former foster youth who were at least 17
years old when they were discharged from care. Consistent with earlier studies, our findings indicate that a
significant percentage of the 1995 through 1997 exit cohorts of former foster youth were either not
employed at all (21 percent) or only sporadically employed (24 percent) during the first 2 years (eight
quarters) after they were discharged from Wisconsin’s out-of-home care system. Finding and/or
maintaining stable employment may not be as much of a problem for former foster youth as these results
suggest. In particular, former foster youth are counted as not employed if they were employed in jobs that
50
are not “covered” or if they were employed but living in another state. However, finding and/or
maintaining stable employment may also be more difficult for former foster youth than these results seem
to imply because former foster youth were counted as employed in any quarter for which earnings were
reported, regardless of the number of hours that they worked.
We found a number of factors that seem to be related to employment among our sample of former
foster youth. Both our univariate and multivariate analyses suggest that nonwhite former foster youth were
significantly less likely to have been employed than those who were white, and that former foster youth
who had been discharged from foster homes were more likely to have been employed than those who had
been discharged from child caring institutions. Although our univariate analysis seems to indicate that
former foster youth who were adjudicated status offenders (JIPS) were less likely to have been employed
than former foster youth who were adjudicated delinquents or children in need of protection (CHIPS), our
multivariate analysis shows that, controlling for other factors, former foster youth who had been
adjudicated status offenders (or children in need of protection) were more likely to have been employed
than those who had been adjudicated delinquent.
Again, consistent with what previous research has found, the earnings of former foster youth were
low. In particular, during the first eight quarters after they were discharged from care, total earnings among
the former foster youth in our sample were, on average, substantially lower than what a full-time minimum
wage worker would have earned over the same period.
Total earnings were related to several factors. Both our univariate and multivariate analyses
indicate that African American former foster youth earned significantly less than white former foster youth,
that former foster youth who had been discharged from foster homes earned significantly more than those
discharged from child caring institutions, and that former foster youth who had run away or been
transferred to a state institution earned significantly less than those who had been reunified, placed with
relatives, or adopted. Although our univariate analysis showed little differences between the total earnings
of former foster youth who had aged out or been discharged to independent living and those who had been
51
reunified, placed with relatives, or adopted, the results of our multivariate analysis suggest that former
foster youth who had aged out of care or been discharged to independent living earned significantly more
than those had been reunified, placed with relatives, or adopted. Finally, although our univariate analysis
indicates that former foster youth who had been placed as status offenders tended to earn more than those
who had been placed for other reasons, there was no significant difference between the total earnings of
former foster youth who had been adjudicated status offenders and those who had been adjudicated
delinquent, once other factors were controlled for.
Although we identified several factors related to postdischarge earnings, very little of the variance
in total earnings was explained by the model that we estimated. However, the results of our analysis of
total earnings among the 1996 through 1998 exit cohorts of former foster youth suggests that adding
predischarge earnings to the model improves the model’s explanatory power substantially. In other words,
employment while in foster care appears to be by far the best predictor of postdischarge employment.
Our initial analysis of the public assistance data seemed to indicate that only a small minority of
former foster youth had received AFDC/TANF cash assistance and/or Food Stamps at any time during the
first eight quarters after they were discharged from care. Nevertheless, both our univariate and multivariate
analyses suggest that African American former foster youth were more likely to have been AFDC/TANF
cash assistance and/or Food Stamp recipients than white former foster youth, and that former foster youth
who were placed in care as children in need of protection (CHIPS) for reasons other than abuse or neglect
were more likely to have been AFDC/TANF cash assistance and/or Food Stamp recipients than former
foster youth who were adjudicated delinquents or status offenders.
Both our univariate and multivariate analyses suggest that among the relatively small percentage of
former foster youth who had been recipients of AFDC/TANF cash assistance and/or Food Stamps,
Milwaukee former foster youth received larger amounts of AFDC/TANF cash assistance and/or Food
Stamps during the first eight quarters after they were discharged from care than did non-Milwaukee former
foster youth. Although our univariate analysis suggests that AFDC/TANF cash assistance and/or Food
52
Stamp totals tended to be higher among African American former foster youth than among white former
foster youth, the difference was not statistically significant in the multivariate analysis.
Although less than 6 percent of the 1995 through 1997 exit cohorts of former foster youth had
received AFDC/TANF cash assistance and/or Food Stamps at some point during the first eight quarters
after they were discharged from care, 26 percent had received AFDC/TANF cash assistance and/or Food
Stamps as of June 2000. However, despite this increase in the percentage of former foster youth who had
received AFDC/TANF cash assistance and/or Food Stamps, differences in the likelihood of having been a
recipient tend to be maintained over time. That is, the former foster youth who were most likely to have
received AFDC/TANF cash assistance and/or Food Stamps at some point during the first eight quarters
after they were discharged from care were also the most likely to have received AFDC/TANF cash
assistance and/or Food Stamps at some point between the time they were discharged from care and June
2000.
This increase in the likelihood of having received AFDC/TANF cash assistance and/or Food
Stamps is further illustrated by the percentage of former foster youth in each exit cohort from 1992 through
1998 who had received AFDC/TANF cash assistance and/or Food Stamps at some point between the time
they exited care and June 2000. With the exception of former foster youth in the 1992 exit cohortwho
were less likely to have been AFDC/TANF cash assistance and/or Food Stamp recipients than former
foster youth in the 1993 exit cohort (but more likely to have been AFDC/TANF cash assistance and/or
Food Stamp recipients than former foster youth in the 1994 exit cohort)the percentage of former foster
youth who had received AFDC/TANF cash assistance and/or Food Stamps by June 2000 increased with
each additional postdischarge year.
Should this trend continue, at least one-third of all the former foster youth in the 1995 through
1997 exit cohorts will have received AFDC/TANF cash assistance and/or Food Stamps within 6 to 8 years
after being discharged from care. Clearly, the data necessary to evaluate this possibility are not yet
53
available. Nonetheless, it will be interesting to see whether the percentage of the former foster youth in
these exit cohorts continues to increase as time since discharge increases. This question is especially
intriguing given the dramatic reduction in both cash assistance and Food Stamp caseloads that Wisconsin
has experienced in recent years.
By almost any standard, total income from earnings, AFDC/TANF cash assistance, and Food
Stamps for the first eight quarters after discharge from care was very low among our sample of 1,819
former foster youth. Median total income and mean total income for this 2-year period were $2,848 and
$5,781, respectivelywell below the poverty line for a one-person family in 1995, which is the earliest
year in which the former foster youth were discharged from care.28 Even when the analysis is limited to the
1,416 former foster youth who were employed and/or recipients of public assistance at some point during
their first eight postdischarge quarters, both median total income ($4,602) and mean total income ($7,192)
for this 2-year period were still below the 1995 federal poverty line for a one-person family.29
Both our univariate and multivariate analyses seem to indicate that total income was lower (1)
among African American former foster youth than among white former foster youth and (2) among former
foster youth who had run away from care or who had been transferred to a state institution than among
those who had been reunified, placed with relatives, or adopted. Conversely, total income was higher (1)
among former foster youth who had been discharged from foster homes than among those who had been
discharged from child caring institutions and (2) among former foster youth who had aged out of care or
had been discharged to independent living than among those who had been reunified, placed with relatives,
or adopted. These differences exist regardless of whether or not former foster youth who were never
28The federal poverty line for a single individual was $7,470 in 1995, $7,740 in 1996, $7,890 in 1997, $8,050 in 1998, $8,240 in 1999, and $8,350 in 2000.
29As noted above, our measure of total income for the first eight postexit quarters, which includes only earnings and AFDC/TANF cash assistance, is incomplete in that it does not take several potentially important sources of income into account. Nevertheless, it is the best indicator of self-sufficiency that our data allow us to compute.
54
employed and who were never recipients of public assistance during their first eight quarters after they
were discharged from care are included in the analysis.
Earnings from employment were the primary source of income among the 1,462 former foster
youth in our sample for whom our measure of total income was greater than zero; on average, earnings
from employment constituted 96.6 percent of total income whereas public assistance constituted only 3.4
percent. This reflects the fact that 1,439 of these former foster youth had a least some earnings from
employment while only 102 had received AFDC/TANF cash assistance and/or Food Stamps. These two
groups were not mutually exclusive, but only a small minority (N = 79) of the former foster youth in our
sample had income from both earnings and public assistance during the first eight quarters after they were
discharged from care.
As alluded to above, our measure of total income suffers from at least two important limitations.
First, it only includes earnings from “covered” employment, AFDC/TANF cash assistance, and Food
Stamps. The former foster youth in our sample may have had other sources of income during the first eight
quarters after they were discharged from care, such as earnings from “uncovered” employment, other
government programs such as SSI, or family and friends. Second, it is based on state administrative data.
The former foster youth in our sample may have moved outside of Wisconsin during the first eight quarters
after they were discharged from care. This might explain why our measure of total income was zero for
nearly 20 percent (N = 357) of the former foster youth in our sample. It is also possible that some of these
former foster youth were being supported by a parent, other relative, spouse, or partner with whom they
were living.
Perhaps the most serious limitation of our analysis is the fact that we restricted our sample to
former foster youth for whom HSRS provided a valid Social Security number. As a result of this
restriction, 31.2 percent of the 1992 through 1998 exit cohorts of former foster youth who were at least 17
years old when they were discharged from care were excluded from our sample. The exclusion of these
former foster youth would not be a problem if it could be ascertained that there were no systematic
55
differences between those former foster youth whose SSN was present and those whose SSN was missing.
However, as our comparison made evident, the two groups were different in a number of respects; SSNs
were more likely to be missing among former foster youth who were white, who were receiving services
from non-Milwaukee counties, who were in care for a total of less than 12 months, and who were reunified
than among former foster youth who were African American, who were receiving services from
Milwaukee County, who were in care for 12 months or longer, and who aged out or were discharged to
independent living.
The implications of these differences for the results of our analysis are difficult to discern, but
there is some indication that the former foster youth with missing SSNs were a somewhat more
“advantaged” group. For example, white former foster youth were more likely to be have been employed
and, if employed, to have had significantly higher earnings than African American former foster youth.
They were also less likely to have received AFDC/TANF cash assistance and/or Food Stamps and, if they
were recipients, to have received a significantly smaller amount of public assistance than African
American former foster youth. A similar pattern of differences exists between former foster youth
receiving services from non-Milwaukee counties and those receiving services from Milwaukee County,
although only the earnings coefficient was statistically significant. However, the implications associated
with differences in discharge outcome and length of stay in care are less clear.30
Much of our analysis has focused on the variation in employment, earnings, and public assistance
receipt among former foster youth with different demographic characteristics and/or foster care
experiences. The result of this analysis suggests that some of these demographic characteristics and/or
foster care experiences are related to subsequent outcomes. Although we had initially planned to examine
30There are statistical techniques for dealing with this problem of sample selection bias. One of the authors will be using these techniques in future analyses of these data.
56
the outcomes of former foster youth during the pre- and post-TANF periods, it was not possible to do this
given the limited number of pre-TANF years for which we had UI data.31
Rather than limiting our analysis to former foster youth who aged out of care or who were
discharged to independent living, we broadened our sample to include all former foster youth who exited
care between 1992 and 1998 and were at least 17 years old at the time they exited. We then compared the
employment, earnings, and public assistance receipt among former foster youth with different discharge
outcomes.32
Our results suggest that former foster youth who had aged out of care or had been discharged to
independent living earned significantly more during the first eight quarters after they were discharged from
care than those who had been reunified, placed with relatives, or adopted; as a result, their total income
was also significantly higher. These findings are consistent with what one would expect if former foster
youth who had aged out of care or had been discharged to independent living were, in fact, living on their
own and having to support themselves, while those who had been reunified, placed with relatives, or
adopted were being supported by the families with whom they were living. We also found that former
foster youth who had run away or been transferred to an institution were employed in significantly fewer
quarters and earned significantly less during the first eight quarters after they were discharged from care
than those who had been reunified, placed with relatives, or adopted; again, their lower earnings were
reflected in significantly lower total income as well.
Because the discharge outcomes of these former foster youth were not randomly assigned, our
findings cannot be interpreted as evidence that the differences in employment, earnings, and public
31We expect to have UI data for the years 1992 through 1994 in the near future. 32This is somewhat different than the analysis we had initially proposed, which was to compare the
outcomes of former foster youth who would have aged out between 1992 and 1998 had they not been returned home to those of former foster youth who did age out of care during this same period. However, because we included former foster youth who had been reunified, placed with relatives or adopted in our sample, we were able to make a very similar comparison.

57
assistance receipt that we observed were caused by the different discharge outcomes they experienced.
Rather, a more likely explanation is that the discharge outcomes experienced by former foster youth were
endogenous to a combination of observable and unobservable individual, family, worker, and agency
characteristics.

59
References
Barth, R. P. 1990. “On Their Own: The Experiences of Youth after Foster Care.” Child and Adolescent Social Work Journal 7: 419–440.
Cook, R., E. Fleishman, and V. Grimes. 1991. “A National Evaluation of Title IV-E Foster Care Independent Living Programs for Youth: Phase 2.” Final Report, vol. 1. Rockville, MD: Westat, Inc.
Courtney, M. E., I. Piliavin, A. Grogan-Kaylor, and A. Nesmith. 1998. “Foster Youth Transitions to Adulthood: Outcomes 12 to 18 Months after Leaving Out-of-Home Care.” Institute for Research on Poverty, University of Wisconsin–Madison.
Festinger, T. 1983. No One Ever Asked Us: A Postscript to Foster Care. New York: Columbia University Press.
Gallagher, L., C. Uccello, A. Pierce, and E. Reidy. 1999. “State General Assistance Programs: 1998.” Washington, DC: Urban Institute.
Holcomb, P., K. Flores, C. Herbig, K. Tumlin, C. Botsko, L. Kaye, and K. Seefeldt. 1998. “Income Support and Social Services for Low-Income People in Wisconsin.” Washington, DC: Urban Institute.
Jones, M., and B. Moses. 1984. “West Virginia’s Former Foster Children: Their Experiences in Care and Their Lives as Young Adults.” New York: Child Welfare League of America.
Pettiford, P. 1981. “Foster Care and Welfare Dependency: A Research Note.” New York: Human Resource Administration, Office of Policy and Program Development.