Self-sufficiency, Comparative Advantages, and … Self-Sufficiency, Comparative Advantage, and...
25
Food Self-Sufficiency, Comparative Advantage, and Agricultural Trade: A Policy Analysis Matrix for Chinese Agriculture Cheng Fang and John C. Beghin Working Paper 99-WP 223 October 2000 (Revised)
Transcript of Self-sufficiency, Comparative Advantages, and … Self-Sufficiency, Comparative Advantage, and...
Food Self-Sufficiency, Comparative Advantage, and Agricultural Trade: A Policy Analysis Matrix for Chinese Agriculture Cheng Fang and John C. Beghin Working Paper 99-WP 223 October 2000 (Revised)
Food Self-Sufficiency, Comparative Advantage, and Agricultural Trade:
A Policy Analysis Matrix for Chinese Agriculture
Cheng Fang and John C. Beghin
Working Paper 99-WP 223 October 2000 (Revised)
Center for Agricultural and Rural Development and Department of Economics
Iowa State University Ames, Iowa 50011-1070
www.card.iastate.edu
Cheng Fang is an assistant scientist in the Food and Agricultural Policy Research Institute (FAPRI). John C. Beghin is a professor, Department of Economics, and head of the Trade and Agricultural Policy Division, Center for Agricultural and Rural Development, Iowa State University. This publication is available online at the CARD website www.card.iastate.edu. Permission is granted to reproduce this information with appropriate attribution to the authors and the Center for Agricultural and Rural Development, Iowa State University, Ames, Iowa 50011-1070. For questions or comments about the contents of this paper, please contact, John C. Beghin, Iowa State University, 568E Heady Hall, Ames, IA 50011-1070; email [email protected]; phone: 515-294-5811; Fax: 515-294-6336. Iowa State University does not discriminate on the basis of race, color, age, religion, national origin, sexual orientation, sex, marital status, disability, or status as a U.S. Vietnam Era Veteran. Any persons having inquiries concerning this may contact the Director of Affirmative Action, 318 Beardshear Hall, 515-294-7612.
Abstract
We assess the comparative advantage and protection of China’s major agricultural
crops using a modified Policy Analysis Matrix (PAM) and 1996 to 1998 data. We
consider the following commodities: early indica rice, late indica rice, japonica rice,
south wheat, north wheat, south corn, north corn, sorghum, soybean, rapeseed, cotton,
tobacco, sugarcane, and a subset of fruits and vegetables. Consistent with the intuition of
the simple Heckscher-Ohlin model, the results strongly suggest that China has a
comparative advantage in labor-intensive crops, and a disadvantage in land-intensive
crops. Specifically, land-intensive grain and oilseed crops are less socially profitable than
fruits and vegetables. Within the grain sector, high quality rice and high quality north
wheat have a more comparative advantage than early indica rice and south wheat,
respectively. The findings suggest that China’s current grain self-sufficiency policy
incurs efficiency losses. Our results shed light on likely changes in agricultural trade
patterns in China, if accession to the World Trade Organization (WTO) takes place. We
also stress the need for greater input productivity in grain production to improve its
competitiveness if China keeps its food security policy.
Key Words: China, agriculture, comparative advantage, protection, DRC, EPC,
agricultural trade.
FOOD SELF-SUFFICIENCY, COMPARATIVE ADVANTAGE, AND AGRICULTURAL TRADE:
A POLICY ANALYSIS MATRIX FOR CHINESE AGRICULTURE
Our paper is an empirical contribution to the debate on China’s integration into the
world economy. We assess the comparative advantage and protection of China’s major
agricultural crops using a modified Policy Analysis Matrix (PAM) and 1996 to 1998 data.
We consider the following commodities: early indica rice, late indica rice, japonica rice,
south wheat, north wheat, south corn, north corn, sorghum, soybeans, rapeseed, cotton,
tobacco, sugarcane, and a subset of fruits and vegetables. Consistent with the intuition of
the simple Heckscher-Ohlin model, the results strongly suggest that China has a
comparative advantage in labor-intensive crops, and a disadvantage in land-intensive
crops. Specifically, land-intensive oilseed crops (soybeans and rapeseed) and grains
(wheat, corn, and sorghum) are less socially profitable than are labor-intensive fruits and
vegetables, tobacco, cotton, and japonica rice. These findings suggest that China’s grain
self-sufficiency policy induces major efficiency losses and that significant gains in factor
productivity will have to take place to improve the competitiveness of these crops, if food
security objectives remain unchanged after accession to the World Trade Organization
(WTO).
We find that agricultural protection in China is still reminiscent of the import-
substitution era and reveals systematic patterns of input subsidization and output taxation
through foreign exchange rate rationing (Krueger et al. 1991; Huang 2000). Effective
protection patterns reveal the high effective protection enjoyed by corn, sorghum, and
sugarcane, and the effective taxation burdening tobacco, cotton, and japonica rice.
Patterns of comparative disadvantage and protection mirror each other. The least
competitive crops tend to be the most protected ones.
China’s accession to the WTO requires the eventual elimination or reduction of
many policies distorting trade, production, and consumption of agricultural commodities,
8 / Fang and Beghin
which are inconsistent with WTO principles (Tuan and Cheng 1999). Reducing domestic
and trade distortions would realign relative costs to relative world prices, reduce but not
eliminate the production of importables (grains, oilseeds), and promote the production of
exportables, such as vegetables, fruits, tobacco, and cotton. Hence, with accession to the
WTO, China’s agricultural trade patterns would be affected, increasing its dependence on
world grain and oilseed markets to satisfy its domestic demand, and to absorb its
exportable agricultural production (Garnaut et al. 1996; Carter et al. 1996; Carter and Li
2000; Wang 1997; Wailes et al. 1998; Lu 1997). In the long run, major factor
productivity gains in agriculture would alter these predicted specialization patterns as
shown by Huang and Chen (1999), and Huang et al. (1999). Realizing these productivity
gains is a major challenge, in terms of policymaking and factor accumulation.
China’s rapid economic growth and gradual transition towards a market economy
have brought about significant changes in production and consumption patterns and
somewhat in trade behavior in agriculture. However, the government, to a considerable
extent, still distorts and controls input supply, output procurement, and trade flows—
especially in the grain sector.
The switch from a large exporter to a large importer of grains, which occurred in
1994 and 1995, led some researchers to believe that China was beginning to rely more on
relative scarcity signals to determine its trade patterns. However, alarmist warnings from
outsiders about China’s inability to feed itself led to a new agricultural policy bias
promoting grain production and self-sufficiency (Brown 1995). Under a new grain
policy, provincial governors were given responsibility to maintain the “grain bag.” The
policy bias toward grains shifted resource allocation away from other crops to grains. As
a result, the harvested area for rice, wheat, and corn was increased from 80.3 million
hectares (mha) to 86.1 mha between 1994 and 1999. The reverse pattern occurred for the
production of several crops competing with grains in the land allocation: for example, the
harvested area for cotton decreased from 5.53 mha to 3.75 mha during the same period.
In the following sections, we first review recent policy changes affecting Chinese
agriculture. Next, we introduce the policy analysis matrix framework. We follow with a
Food Self-Sufficiency, Comparative Advantage, and Agricultural Trade / 9
presentation of the data used, and of our estimates of protection and comparative
advantage. We conclude the paper with remarks on the implications of our findings.
Overview of China’s Agricultural Policy China’s leaders, as in many Asian countries, have been defining food security as
grain security, bringing policymakers’ active interference in grain markets and trade
(Crook 1997, 1999). From the mid-1950s to the early 1980s, the people’s communes
controlled all aspects of the rural economy. Government-owned institutions managed the
production and circulation of agricultural products from farm gate to consumers, and the
century-old open marketing system was closed. The government strictly controlled the
prices of farm products and cropping areas.
After rural economic reform was initiated in the early 1980s, the commune system
was abandoned in favor of households as decision units under the “household
responsibility system” (HRS). The old open marketing system was allowed to revive.
Under the HRS, farm households were permitted to sign long-term land contracts to
cultivate specific plots. Farmers were given somewhat greater production and marketing
discretion. They were able to produce whatever they wanted and to sell their goods
through local open markets as long as they delivered specified quotas to the government.
China’s reform can be divided into several episodes (Carter et al. 1996; Huang
1998). In the period of 1978 to 1984, the household responsibility system was adopted
and procurement prices and above-quota price premiums were increased. Centralized
sown-area plans were relaxed to a certain extent, and procurement quotas were gradually
reduced, and even abolished, for some commodities (Carter et al. 1996).
From 1985 to 1988, urban reforms were initiated. In agriculture, policy reform
focused on liberalizing the mandatory procurement system, except for grain and cotton.
In 1985, rural market reforms were introduced to abolish the unified purchasing and
marketing system. State purchases of grain, cotton, and edible oilseeds were maintained,
but quantities and prices of state purchases were negotiated between the government and
farmers. The additional unit price for grain was significantly reduced. Meanwhile, a

10 / Fang and Beghin
number of other policies were implemented to encourage diversification of non-grain
production (Huang 1998).
Starting in 1992, the Chinese government started market reforms to reduce the
burden of the grain subsidies and to improve the economic efficiency of grain markets.
Domestic prices for grain started to reflect movements in demand and supply in the
domestic markets. As these market reforms accelerated in 1993, most provinces began to
phase out the grain ration system that allowed urban consumers to purchase grain at low
fixed prices. The government started implementing policies that placed grain production
and procurement, at least partially, on a more market-oriented basis. These reforms led to
resources being reallocated from grain production toward other crops. The market
reforms led many observers to believe that China would steadily pursue an economic
course based on free markets and comparative advantage.
During 1994 and 1995, many analysts in and outside of China questioned the
country’s capacity to produce enough grain to meet growing consumption requirements
(e.g. Brown 1995; and Johnson 1994 for a dissenting view). Various research
organizations including the U.S. Department of Agriculture (USDA), the International
Food Policy Research Institute (IFPRI), and the Food and Agricultural Policy Research
Institute (FAPRI) projected Chinese grain imports would reach 22 to 25 million metric
tons (mmt) by 2005 and 40 to 45 mmt by 2020.
These reports might have had a sobering effect on the central leaders, pushing them
to initiate the “governors’ grain bag responsibility system,” a policy designed to promote
self-sufficiency in domestic grains at the provincial level. In this policy, various policy
instruments were employed to boost grain output in 1995 and 1996. Under this policy,
provincial governors assumed the sole responsibility of grain production and raised grain
self-sufficiency rates. Each provincial government had the responsibility for
(a) guaranteeing that a certain percentage of sown area is reserved for grains,
(b) improving crop yields, insuring that local grain stocks are maintained, and
(c) establishing and maintaining a local grain risk fund that can be drawn upon
before central government resources in the event of a disaster.
Food Self-Sufficiency, Comparative Advantage, and Agricultural Trade / 11
In 1996, faced by high international grain prices, policymakers sharply increased
quota prices for grains to stimulate grain production to assure adequate food supplies. As
a result of good weather and higher prices, record grain production occurred in 1996.
Large supplies began to depress prices in 1997 and a protected price was introduced,
under which farmers would receive a minimally acceptable grain price floor covering
their costs of production. Provinces added subsidies, including ones for chemical
fertilizers, to their fixed-quota grain purchase price.
The 1998 grain reforms aimed at strengthening state control over the national grain
system away from market forces. Grain trading by private companies was officially
banned but not thoroughly enforced (Huang 2000b). Farmers were supposed to sell their
grain-to-grain bureau stations, except for small amounts that could be sold in local
markets. In reality, private traders bought large amounts of low quality wheat and early
indica rice.
In 1999, the government started another new reform of China’s grain marketing
system, in the name of reducing government costs. On paper, the new grain reform
allows more differentiation of procurement prices based on grain quality, encouraging
greater production of other crops besides cereal grains, and granting grain companies
more discretion over procurement. In practice, transactions between private traders and
farmers went on a free-market basis for most grains (Huang 2000b). Whereas grain
bureaus have limited capacity to administer quality differentials, the market transactions
do reflect some premia for quality.
Price support measures in Chinese agriculture involve various border controls on
trade, and state controls over domestic producer prices through procurement policies. The
central government controls international trade in almost all major agricultural products.
These controls break the link between world prices and the prices paid by consumers and
received by producers for most agricultural commodities. China conducts a large share of
its international trade through state trading enterprises (STEs). The Cereal, Oil, and
Foodstuffs Importing and Exporting Corporation (COFCO) is a giant corporation playing
a key role in China’s food trade (Carter et al. 1998). While the trade system for many

12 / Fang and Beghin
other tradable products in China has undergone a big change, its foreign grain trade
system is still centralized.
Since 1986, China has reapplied to join the General Agreement on Tariffs and Trade
(GATT) and its successor, the WTO. Negotiations for China’s membership are ongoing.
The U.S.–China agreement, signed in Beijing on November 15, 1999, signaled China’s
desire and commitment to participate in the global trade community. Based on the
agreement, China has committed to cut agriculture tariffs by more than one-half on many
products beginning in the year 2000 and continuing through 2004. China committed to
end its system of discriminatory licensing and import bans for bulk commodities, and it
will establish significant and growing tariff rate quotas (TRQs) for state-traded
commodities such as wheat, corn, cotton, rice, and soybean oil. The within-quota tariffs
will be low, between 1 and 3 percent.
Upon accession, China has committed to not use export subsidies for agricultural
products and will cap and then reduce trade-distorting domestic subsidies. China will
eliminate scientifically unjustified restrictions on agricultural products. For example,
China agreed to the removal of scientifically unjustified restrictions on imports of U.S.
wheat and made a commitment to lift its ban on imports of citrus fruit from California,
Arizona, Texas, and Florida.
In summary, despite substantial rural and economic reforms, which have occurred
since 1978, there is still a significant degree of state intervention in Chinese agriculture.
Cropping patterns are still partly determined by nonmarket influences such as the state
purchase contracts and control of trade flows, the associated input distribution systems,
and the state-controlled production centers for priority commodities.
The Policy Analysis Matrix and Measures of Comparative Advantage and Protection
We use the PAM framework developed by Monke and Pearson (1998), augmented
by a recent development in price distortion analysis brought by Masters and Winter-
Nelson (1995), which accounts for the valuation of nontraded inputs. The PAM has been

Food Self-Sufficiency, Comparative Advantage, and Agricultural Trade / 13
applied to several countries (see, for example, Barichello et al. 1998; Nelson and
Panggabean 1991; Yao 1997; Yao and Tinprapha 1995).
The PAM framework involves the derivation of several important indicators of
protection and comparative advantage. As shown in Table 1, the PAM is a product of two
accounting identities. The first one defines profit as the difference between revenues and
costs, measured in either private or social terms. The second identity measures the effects
of distortions (distorting policies and/or market failures) as the difference between
observed values and social values as indicated by the divergences raw in the PAM. These
divergences are approximations because social values are evaluated at the initial distorted
levels of outputs and inputs. Hence, the PAM provides guidance for incremental changes
rather than wholesale ones.
Table 1. Policy analysis matrix Costs
Revenues Tradable
Inputs Domestic Factors
Profits
Valued at private prices A B C D1
Valued at social prices E F G H2
Divergences I3 J4 K5 L6
Source: Based on Monke and Pearson (1998). 1Private profits, D, equal A minus B minus C. 2Social profits, H, equal E minus F minus G. 3Output transfers, I, equal A minus E. 4Input transfers, J, equal B minus F. 5Factor transfers, K, equal C minus G. 6Net policy transfers, L, equal D minus H.
The data in the first row provide a measure of private profitability (D), defined as the
differences between observed revenues (A) and costs (B+C) valued at actual market
prices. Measures A, B, C, and D reflect transfers and taxes. They show the
competitiveness of the agricultural system, given current technologies, output values,
input costs, and policy transfers. The second row of the matrix in Table 1 calculates
social profitability measured at “social” prices that reflect social opportunity costs.
Efficient outcomes are achieved when an economy aligns its private price signals to
social prices. Social profits measure efficiency and provide a measure of comparative
14 / Fang and Beghin
advantage. At the margin, a positive social profit indicates that the system uses scarce
resources efficiently and the commodity has a static comparative advantage. When social
profits are negative, a sector cannot sustain its current output without assistance from the
government, with a resulting waste. The cost of domestic production exceeds the cost of
importing at the margin.
Three coefficients are used to compare the extent of policy transfers or policy
incentives between agricultural commodities. The nominal protection coefficient (NPC)
is a ratio that contrasts an observed (private) price with a comparable world (social) price.
This ratio indicates the impact of policy on divergence between the two prices for output
(NPCO) and tradable inputs (NPCI). Subsidies to output are indicated by NPCO larger
than one, and inputs subsidies lead to NPCI smaller than one. The EPC is a ratio of value
added in private prices (A-B) to value added in world prices (E-F). This coefficient
indicates the degree of policy transfer from output and tradable input distortions. A value
greater than one indicates a net subsidy to value added.
Three indicators are used to compare the relative efficiency or comparative
advantage between agricultural commodities. The first indicator is the domestic resource
cost (DRC). The DRC is defined as G/(E-F) and indicates whether the use of domestic
factor is sociably profitable (DRC<1) or not (DRC>1). It has been widely used in
developing countries to measure efficiency or comparative advantage and guide policy
reforms (World Bank 1991; Appleyard 1987; Morris 1990; Gonzales et al. 1993; Alpine
and Pickett 1993). However, the DRC may be biased against activities that rely heavily
on domestic nontraded factors, i.e., land and some subsets of labor. A good alternative for
the DRC is the social cost-benefit ratio (SCB), which accounts for all cost and avoids
classification errors in the calculation of DRC (Masters and Winter-Nelson 1995). SCB is
defined as (F+G)/E. Land is a more restricted factor than other domestic factors in
China’s crop production (7 percent world land and 25 percent world population).
Therefore another indicator, the SCB without land-cost (LSB) is used to measure the
return to this fixed factor for this study. LSB is defined as (E+G without land cost)/E.
Higher values of SCB and LSB indicate stronger competitiveness.
Food Self-Sufficiency, Comparative Advantage, and Agricultural Trade / 15
Data Sources, Modeling Assumptions, and Results The basic information needed for compiling a PAM are yields, input requirements,
and the market and social prices of inputs and outputs. The major sources of data used for
the private account in the PAM are 1996, 1997, and 1998 farm household survey data on
China’s cost-of-production. The survey was conducted by China’s Price Bureau in
cooperation with the Ministry of Agriculture, the Ministry of Forestry, the Ministry of
Domestic Trade, the China Silk Import and Export General Company, the China
Federation of Supply and Marketing Cooperatives, China’s Tobacco Administration
Bureau, China’s Chinese Medicine Administration Bureau, and China’s Light Industry
General Committee. The survey has been carried out for decades. Many of the same
households are included in the survey each year. The number of households in the survey
varies across agricultural activities, according to the relative importance of each activity
in each household. Part of the data is available in China’s Rural Statistical Yearbook
(China’s State Statistical Bureau, various issues).
The choice of social prices has a significant impact on the calculation of the PAM.
We use the world price as a reference price for most commodities in the study. The U.S.
FOB Gulf prices are used as reference prices for wheat, corn, sorghum, and soybeans.
The cash Vancouver price, the Cotlook A Index, and FOB Caribbean price are
represented as the reference prices for rapeseed, cotton, and sugar, respectively. These
world prices are obtained from FAPRI. Rice quality varies among the different varieties
grown in China, as well as in other countries. Using a reference world price for rice raises
quality differential problems. To avoid quality differentials, we use China’s unit value of
exports as the reference price for the different types of rice. For the same reason, we use
the unit value exported from China as the reference price for tobacco leaves because a
representative world price for leaf tobacco is hard to identify. The unit values are
calculated as the value of the exported commodity divided by the total quantity exported
from China. The unit value data come from China’s Customs Statistics Yearbook
(Customs General Administration of PRC 1997). Vegetable and fruits markets are free
markets in China with no explicit price distortions during the study period. The domestic
prices for fresh apples, fresh oranges, Chinese cabbage, and green beans are used as an
16 / Fang and Beghin
approximation of social prices for these vegetables and fruits. Hence, we abstract from
second-round effects of distortions in other markets on these fruit and vegetable prices.
The world prices are adjusted to be compared at the farm gate by first adding to them
(subtracting) the international transportation cost of the commodity from (to) the
originating market to (from) the domestic market. The transportation cost is assumed to
be the ocean freight rates from the United States to China for imported commodities. The
transportation cost for exported commodities is assumed to be one-half of these freight
rates since most of China’s agricultural products in this study go to neighboring
countries. The data on the ocean freight rates were obtained from the USDA. Social
prices at the farm gate are then calculated by subtracting the domestic marketing cost to
the board prices. The domestic marketing costs are assumed to be equal to 10 percent of
the border price, which is approximately equal to the difference between domestic
wholesale price and producer price.
Reference prices in U.S. dollar terms are converted to China’s currency, the RMB.
China maintains fixed foreign exchange rate policy and limited currency convertibility.
Starting in the late 1980s, China had dual exchange rates: official and secondary. Market-
determined exchange rates existed alongside the overvalued fixed-official rates in the so-
called two-tiered exchange rate system. While the overvalued official exchange rates
distorted trade conducted by state trading companies, the share of transactions made at
market-determined rates gradually increased (World Bank 1994; USDA 1998). With
roughly 80 percent of all trade transactions taking place at the market exchange rate,
China’s government decided in 1994 to unify the two exchange rates. The official
currency was devalued to the then market rate of 8.7 RMB per U.S. dollar. China did not
give up its fixed exchange rate policy after 1994: the new rate is still pegged to the U.S.
dollar. There is a consensus view that China’s currency is overvalued (Yin and Stoever
1994; Shuguang et al. 1999).
Adjusting the exchange rate for the impacts of output price distortions and
macroeconomic policy effects is a complex task. In this study, we assume that the 1994
unified exchange rate was a shadow exchange rate, with relative purchase power parity
holding between China and the United States. We calculate the shadow nominal
Food Self-Sufficiency, Comparative Advantage, and Agricultural Trade / 17
exchange rates based on the real effective exchange rates from 1994 to 1997 from the
World Bank (World Bank 1996, 1997, 1998). The estimated shadow nominal exchange
rates are 9.41 RMB/U.S.$, 10.13 RMB/U.S.$, 10.58 RMB/U.S.$, and 10.31 RMB/U.S.$
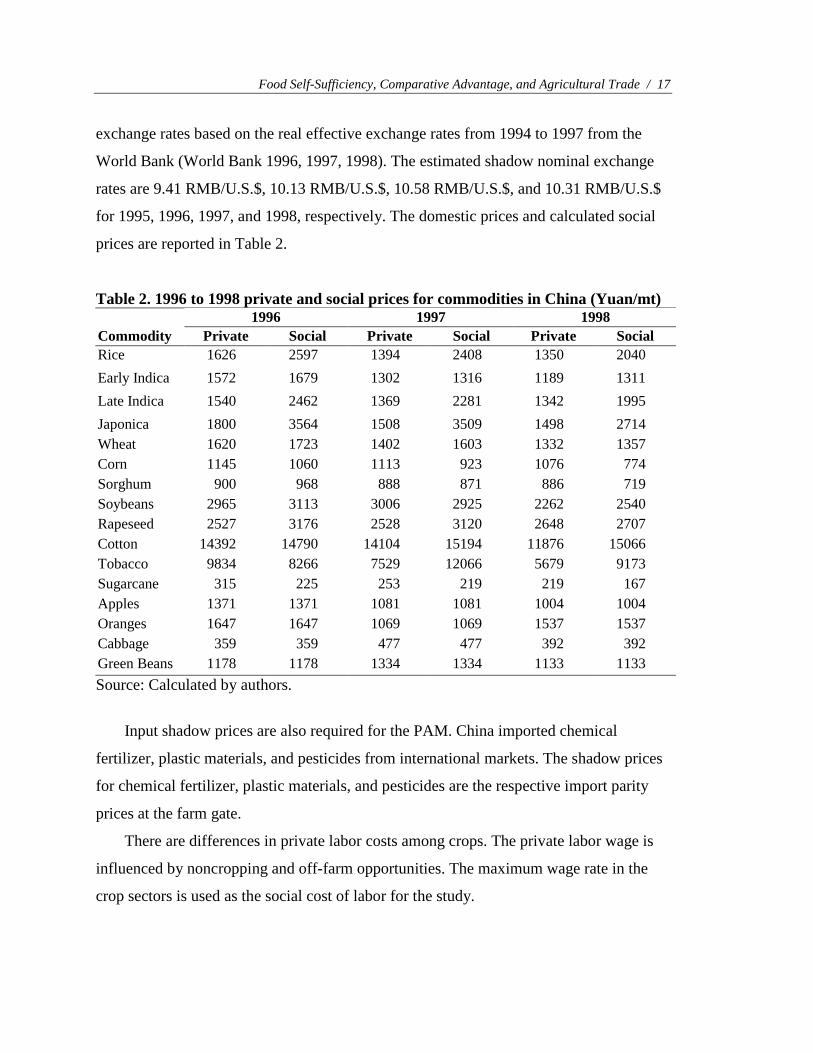
for 1995, 1996, 1997, and 1998, respectively. The domestic prices and calculated social
prices are reported in Table 2.
Table 2. 1996 to 1998 private and social prices for commodities in China (Yuan/mt) 1996 1997 1998 Commodity Private Social Private Social Private Social Rice 1626 2597 1394 2408 1350 2040 Early Indica 1572 1679 1302 1316 1189 1311 Late Indica 1540 2462 1369 2281 1342 1995 Japonica 1800 3564 1508 3509 1498 2714 Wheat 1620 1723 1402 1603 1332 1357 Corn 1145 1060 1113 923 1076 774 Sorghum 900 968 888 871 886 719 Soybeans 2965 3113 3006 2925 2262 2540 Rapeseed 2527 3176 2528 3120 2648 2707 Cotton 14392 14790 14104 15194 11876 15066 Tobacco 9834 8266 7529 12066 5679 9173 Sugarcane 315 225 253 219 219 167 Apples 1371 1371 1081 1081 1004 1004 Oranges 1647 1647 1069 1069 1537 1537 Cabbage 359 359 477 477 392 392 Green Beans 1178 1178 1334 1334 1133 1133 Source: Calculated by authors.
Input shadow prices are also required for the PAM. China imported chemical
fertilizer, plastic materials, and pesticides from international markets. The shadow prices
for chemical fertilizer, plastic materials, and pesticides are the respective import parity
prices at the farm gate.
There are differences in private labor costs among crops. The private labor wage is
influenced by noncropping and off-farm opportunities. The maximum wage rate in the
crop sectors is used as the social cost of labor for the study.
18 / Fang and Beghin
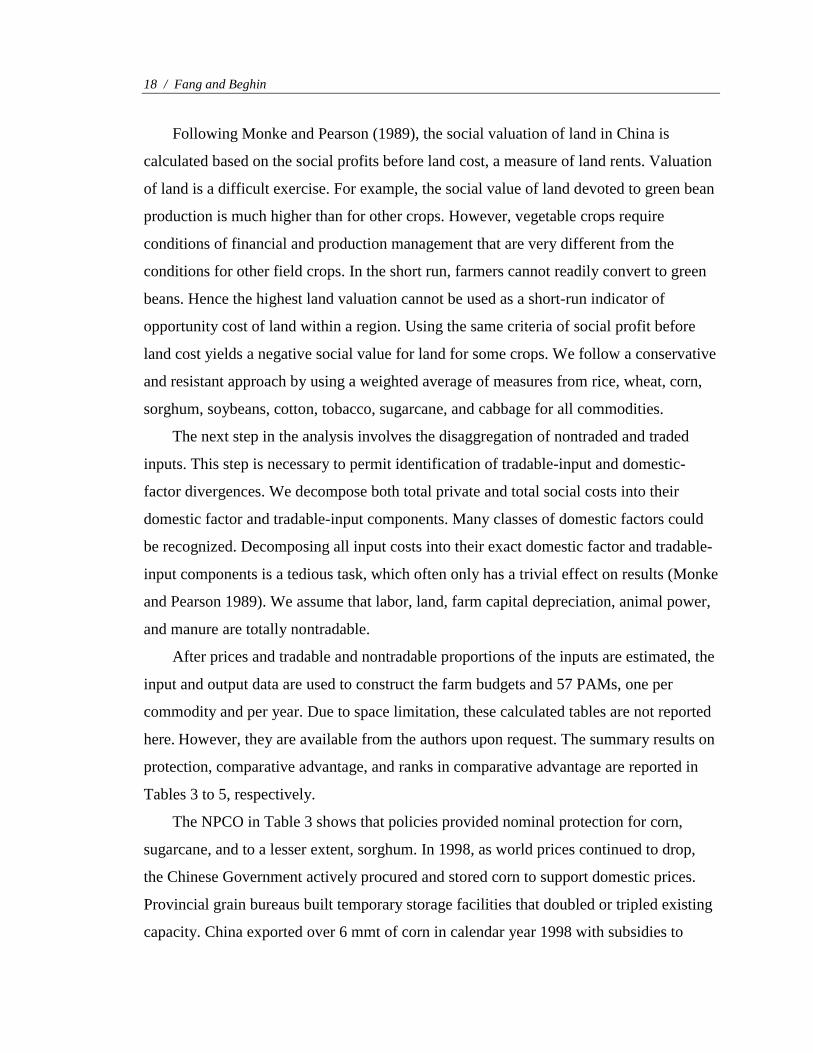
Following Monke and Pearson (1989), the social valuation of land in China is
calculated based on the social profits before land cost, a measure of land rents. Valuation
of land is a difficult exercise. For example, the social value of land devoted to green bean
production is much higher than for other crops. However, vegetable crops require
conditions of financial and production management that are very different from the
conditions for other field crops. In the short run, farmers cannot readily convert to green
beans. Hence the highest land valuation cannot be used as a short-run indicator of
opportunity cost of land within a region. Using the same criteria of social profit before
land cost yields a negative social value for land for some crops. We follow a conservative
and resistant approach by using a weighted average of measures from rice, wheat, corn,
sorghum, soybeans, cotton, tobacco, sugarcane, and cabbage for all commodities.
The next step in the analysis involves the disaggregation of nontraded and traded
inputs. This step is necessary to permit identification of tradable-input and domestic-
factor divergences. We decompose both total private and total social costs into their
domestic factor and tradable-input components. Many classes of domestic factors could
be recognized. Decomposing all input costs into their exact domestic factor and tradable-
input components is a tedious task, which often only has a trivial effect on results (Monke
and Pearson 1989). We assume that labor, land, farm capital depreciation, animal power,
and manure are totally nontradable.
After prices and tradable and nontradable proportions of the inputs are estimated, the
input and output data are used to construct the farm budgets and 57 PAMs, one per
commodity and per year. Due to space limitation, these calculated tables are not reported
here. However, they are available from the authors upon request. The summary results on
protection, comparative advantage, and ranks in comparative advantage are reported in
Tables 3 to 5, respectively.
The NPCO in Table 3 shows that policies provided nominal protection for corn,
sugarcane, and to a lesser extent, sorghum. In 1998, as world prices continued to drop,
the Chinese Government actively procured and stored corn to support domestic prices.
Provincial grain bureaus built temporary storage facilities that doubled or tripled existing
capacity. China exported over 6 mmt of corn in calendar year 1998 with subsidies to
Food Self-Sufficiency, Comparative Advantage, and Agricultural Trade / 19
reduce stocks. The government spent US $30/mt to subsidize exports of corn in 1998
(USDA 1998). Sugarcane and sugar beet prices have been determined mainly by market
forces. However, the government provides a “guidance price” for sugar refineries to
procure sugarcane and sugar beets from farmers. The “guidance prices” are allowed to
vary within 10 percent, up or down, from the price issued by the government. Smuggling
in sugar has been effectively cracked down since 1996. In 1999, the average sugarcane
procurement price declined by more than 20 percent over 1998 to reflect the market
conditions.
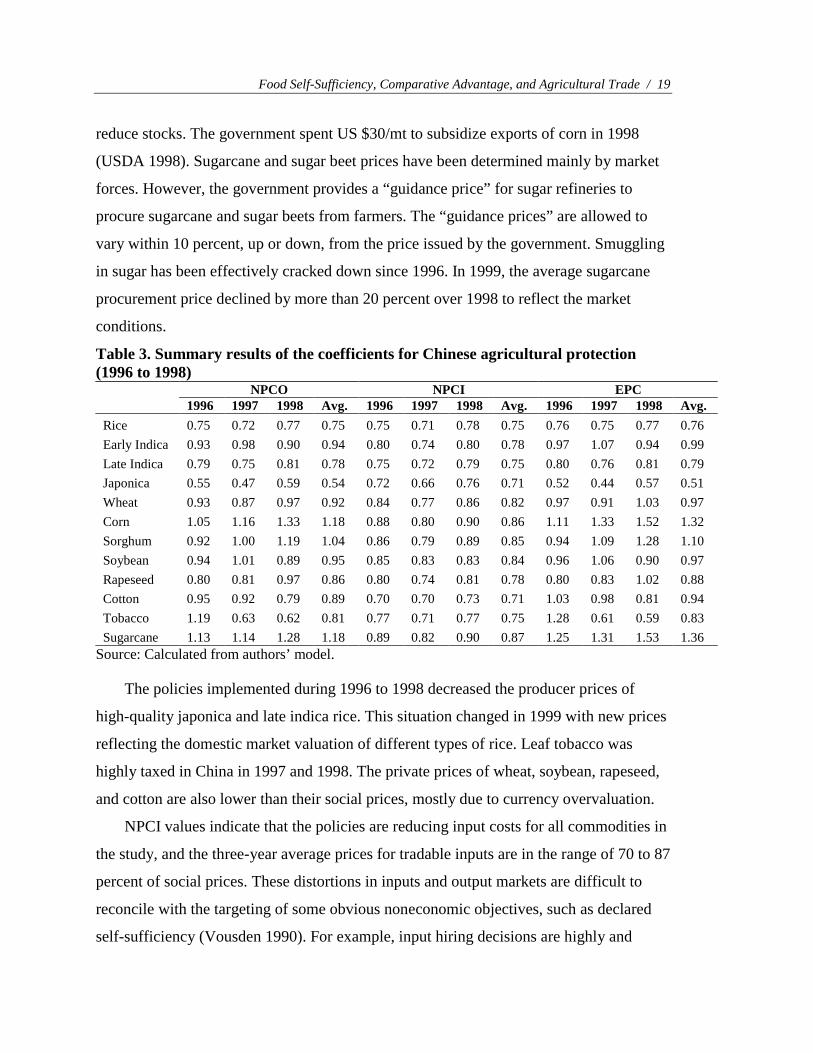
Table 3. Summary results of the coefficients for Chinese agricultural protection (1996 to 1998)
NPCO NPCI EPC 1996 1997 1998 Avg. 1996 1997 1998 Avg. 1996 1997 1998 Avg.
Rice 0.75 0.72 0.77 0.75 0.75 0.71 0.78 0.75 0.76 0.75 0.77 0.76 Early Indica 0.93 0.98 0.90 0.94 0.80 0.74 0.80 0.78 0.97 1.07 0.94 0.99 Late Indica 0.79 0.75 0.81 0.78 0.75 0.72 0.79 0.75 0.80 0.76 0.81 0.79 Japonica 0.55 0.47 0.59 0.54 0.72 0.66 0.76 0.71 0.52 0.44 0.57 0.51 Wheat 0.93 0.87 0.97 0.92 0.84 0.77 0.86 0.82 0.97 0.91 1.03 0.97 Corn 1.05 1.16 1.33 1.18 0.88 0.80 0.90 0.86 1.11 1.33 1.52 1.32 Sorghum 0.92 1.00 1.19 1.04 0.86 0.79 0.89 0.85 0.94 1.09 1.28 1.10 Soybean 0.94 1.01 0.89 0.95 0.85 0.83 0.83 0.84 0.96 1.06 0.90 0.97 Rapeseed 0.80 0.81 0.97 0.86 0.80 0.74 0.81 0.78 0.80 0.83 1.02 0.88 Cotton 0.95 0.92 0.79 0.89 0.70 0.70 0.73 0.71 1.03 0.98 0.81 0.94 Tobacco 1.19 0.63 0.62 0.81 0.77 0.71 0.77 0.75 1.28 0.61 0.59 0.83 Sugarcane 1.13 1.14 1.28 1.18 0.89 0.82 0.90 0.87 1.25 1.31 1.53 1.36
Source: Calculated from authors’ model.
The policies implemented during 1996 to 1998 decreased the producer prices of
high-quality japonica and late indica rice. This situation changed in 1999 with new prices
reflecting the domestic market valuation of different types of rice. Leaf tobacco was
highly taxed in China in 1997 and 1998. The private prices of wheat, soybean, rapeseed,
and cotton are also lower than their social prices, mostly due to currency overvaluation.
NPCI values indicate that the policies are reducing input costs for all commodities in
the study, and the three-year average prices for tradable inputs are in the range of 70 to 87
percent of social prices. These distortions in inputs and output markets are difficult to
reconcile with the targeting of some obvious noneconomic objectives, such as declared
self-sufficiency (Vousden 1990). For example, input hiring decisions are highly and
20 / Fang and Beghin
heterogeneously distorted. These distortions induce some unnecessary deadweight loss to
achieve self-sufficiency. With the presumption of constant return-to-scale production,
efficiency in production implies no input distortions.
The values of the EPC show that there is a big difference in the degree of policy
transfer across commodities. Corn, sugarcane, and sorghum enjoy a heavy support of 32
percent, 10 percent, and 36 percent on three-year average, respectively for their value-
added, while japonica rice, late indica rice, and leaf tobacco face a net tax of 49 percent,
21 percent, and 17 percent, respectively, on average on their value-added.
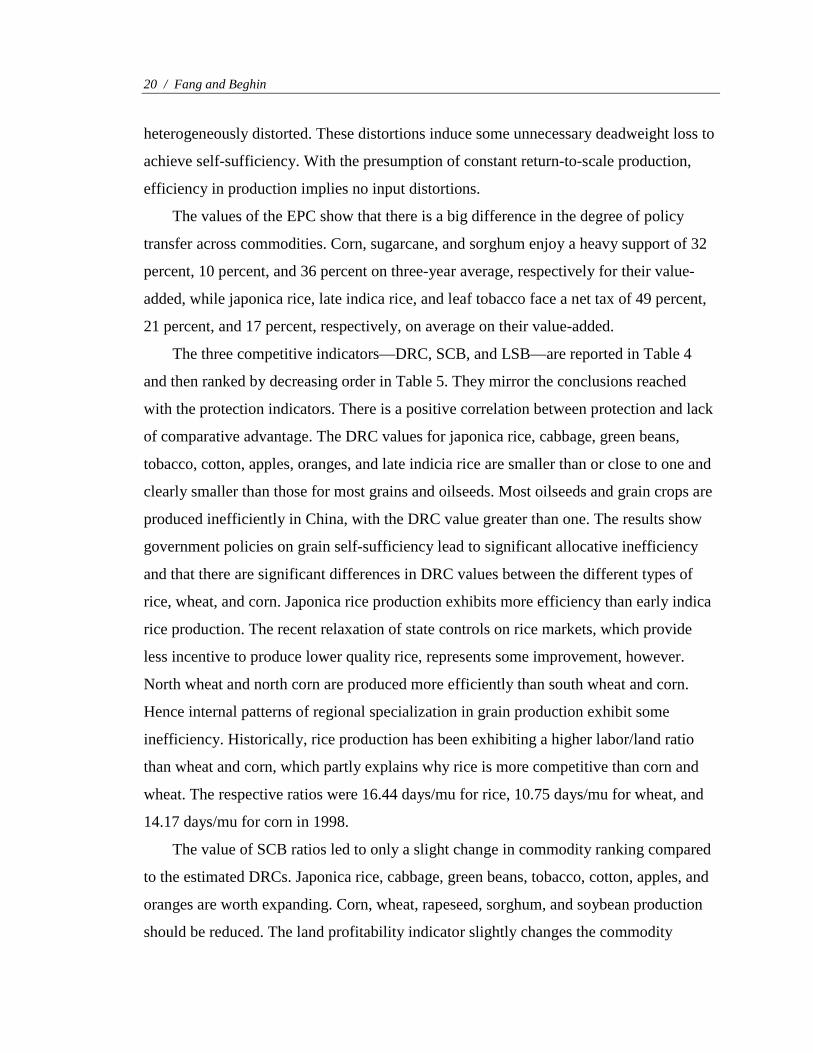
The three competitive indicators—DRC, SCB, and LSB—are reported in Table 4
and then ranked by decreasing order in Table 5. They mirror the conclusions reached
with the protection indicators. There is a positive correlation between protection and lack
of comparative advantage. The DRC values for japonica rice, cabbage, green beans,
tobacco, cotton, apples, oranges, and late indicia rice are smaller than or close to one and
clearly smaller than those for most grains and oilseeds. Most oilseeds and grain crops are
produced inefficiently in China, with the DRC value greater than one. The results show
government policies on grain self-sufficiency lead to significant allocative inefficiency
and that there are significant differences in DRC values between the different types of
rice, wheat, and corn. Japonica rice production exhibits more efficiency than early indica
rice production. The recent relaxation of state controls on rice markets, which provide
less incentive to produce lower quality rice, represents some improvement, however.
North wheat and north corn are produced more efficiently than south wheat and corn.
Hence internal patterns of regional specialization in grain production exhibit some
inefficiency. Historically, rice production has been exhibiting a higher labor/land ratio
than wheat and corn, which partly explains why rice is more competitive than corn and
wheat. The respective ratios were 16.44 days/mu for rice, 10.75 days/mu for wheat, and
14.17 days/mu for corn in 1998.
The value of SCB ratios led to only a slight change in commodity ranking compared
to the estimated DRCs. Japonica rice, cabbage, green beans, tobacco, cotton, apples, and
oranges are worth expanding. Corn, wheat, rapeseed, sorghum, and soybean production
should be reduced. The land profitability indicator slightly changes the commodity
Food Self-Sufficiency, Comparative Advantage, and Agricultural Trade / 21
ranking, but essentially brings the same message. Social profits of land devoted to fruits
and vegetables, tobacco, cotton, and the higher quality rice are much higher than those
for oilseeds, wheat, corn sorghum, and sugarcane. The social profits of land for south
corn and south wheat are negative, indicating that corn and wheat production in South
China would drastically decrease without assistance from the government. Low yields are
the major cause of lack of competitiveness for these two products.
Table 4. Results of the indicators for Chinese agricultural comparative advantage DRC SCB LSB
1996 1997 1998 1996 1997 1998 1996 1997 1998 Rice 0.83 1.02 0.94 0.85 0.99 0.94 7650 6135 5096 Early Indica 1.09 1.54 1.32 1.07 1.39 1.24 3377 456 1336 Late Indica 0.95 1.14 1.06 0.96 1.11 1.04 4507 2485 2652 Japonica 0.43 0.40 0.46 0.51 0.47 0.54 15925 16343 11896 Wheat 1.42 1.39 1.76 1.29 1.27 1.49 1938 1634 430 South Wheat 1.84 1.82 2.65 1.60 1.58 1.99 437 111 -1153 North Wheat 1.24 1.17 1.43 1.17 1.12 1.28 2733 2638 1293 Corn 1.54 2.03 1.91 1.40 1.69 1.63 1366 -244 -62 South Corn 2.14 2.34 2.51 1.84 1.92 2.04 -699 -1162 -1298 North Corn 1.27 1.77 1.53 1.20 1.52 1.37 2579 591 978 Sorghum 1.48 2.45 1.62 1.37 1.98 1.48 1812 -285 785 Soybeans 1.32 1.58 1.25 1.27 1.47 1.21 2466 1222 2015 Rapeseed 1.74 1.65 2.19 1.59 1.51 1.90 905 732 -544 Cotton 1.06 0.94 0.79 1.04 0.95 0.83 3411 4449 5981 Tobacco 1.07 0.72 0.88 1.06 0.76 0.90 3073 9733 5039 Sugarcane 1.04 1.11 1.36 1.02 1.07 1.21 3645 2308 322 Apples 0.93 1.10 0.78 0.95 1.07 0.83 5525 1692 7240 Oranges 0.84 1.19 0.85 0.89 1.12 0.90 7031 601 6070 Cabbage 0.77 0.65 0.59 0.81 0.70 0.65 8307 12087 11252 Green Beans 0.68 0.70 0.67 0.73 0.75 0.72 10842 10531 10115
22 / Fang and Beghin
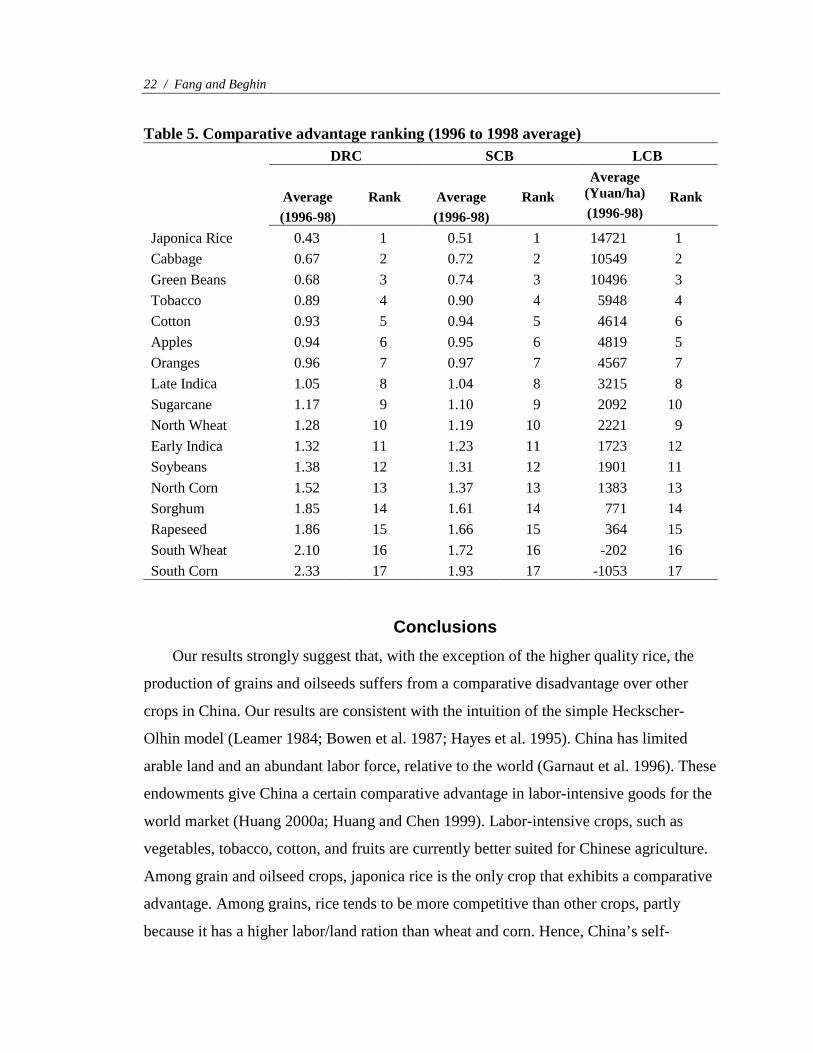
Table 5. Comparative advantage ranking (1996 to 1998 average) DRC SCB LCB
Average (1996-98)
Rank
Average (1996-98)
Rank
Average (Yuan/ha) (1996-98)
Rank
Japonica Rice 0.43 1 0.51 1 14721 1 Cabbage 0.67 2 0.72 2 10549 2 Green Beans 0.68 3 0.74 3 10496 3 Tobacco 0.89 4 0.90 4 5948 4 Cotton 0.93 5 0.94 5 4614 6 Apples 0.94 6 0.95 6 4819 5 Oranges 0.96 7 0.97 7 4567 7 Late Indica 1.05 8 1.04 8 3215 8 Sugarcane 1.17 9 1.10 9 2092 10 North Wheat 1.28 10 1.19 10 2221 9 Early Indica 1.32 11 1.23 11 1723 12 Soybeans 1.38 12 1.31 12 1901 11 North Corn 1.52 13 1.37 13 1383 13 Sorghum 1.85 14 1.61 14 771 14 Rapeseed 1.86 15 1.66 15 364 15 South Wheat 2.10 16 1.72 16 -202 16 South Corn 2.33 17 1.93 17 -1053 17
Conclusions Our results strongly suggest that, with the exception of the higher quality rice, the
production of grains and oilseeds suffers from a comparative disadvantage over other
crops in China. Our results are consistent with the intuition of the simple Heckscher-
Olhin model (Leamer 1984; Bowen et al. 1987; Hayes et al. 1995). China has limited
arable land and an abundant labor force, relative to the world (Garnaut et al. 1996). These
endowments give China a certain comparative advantage in labor-intensive goods for the
world market (Huang 2000a; Huang and Chen 1999). Labor-intensive crops, such as
vegetables, tobacco, cotton, and fruits are currently better suited for Chinese agriculture.
Among grain and oilseed crops, japonica rice is the only crop that exhibits a comparative
advantage. Among grains, rice tends to be more competitive than other crops, partly
because it has a higher labor/land ration than wheat and corn. Hence, China’s self-
Food Self-Sufficiency, Comparative Advantage, and Agricultural Trade / 23
sufficiency policy goes against its current comparative advantage, except for high quality
rice production.
The cotton case deserves a qualifier. Since 1996, China has expanded its production
of cotton and has accumulated large stocks of cotton, which are reflected via expectations
in low world prices. We can reasonably guess that the DRC for cotton evaluated at 1999
prices would be higher that one and that China would be ill advised to further expand
cotton production. Assessing this conjecture, however, requires data not yet available.
Further, we can conclude that grain self-sufficiency policies reduce allocative
efficiency twice. First, self-sufficiency could be achieved with smaller deadweight losses
by reducing input market distortions. The latter distortions are inconsistent with
predictions of the targeting principle for self-sufficiency. In addition, any noneconomic
objective is inherently costly even with proper policy instrument targeting. The recurrent
large levels of inventory holdings suggest that the targeting was not optimum, but rather
an economic aberration guided by old policy reflexes. Chinese grain production was and
is sufficient to meet domestic food demand (Johnson 1994, 1999). Our results are also in
agreement with recent findings obtained by Estrin (1990) using a stochastic production
frontier approach to grain output. The promotion of grain production and the pursuit of
self-sufficiency in China are inefficient.
While static efficiency gains in grain production could be achieved in the short run
with a reform of distortions, long run gains are possible through greater factor
productivity. This dynamic perspective on comparative advantage of grain production is
particularly relevant in the context of China’s accession to the WTO. If China persists
with its food security objective, higher productivity gains will have to occur in grain
production, or else large grain imports will take place as implied by WTO accession. The
substantial productivity gains of land and labor that have occurred the last 20 years have
relied strongly on increased use of fertilizer and chemicals (Fan and Pardey 1997; Huang
and Rozelle 1996). Eventually, these two sources of productivity gains will become
exhausted. Significant investments in agricultural research and infrastructure, especially
24 / Fang and Beghin
irrigation,1 have to take place (Huang and Chen 1999; Huang et al. 1999). Further, the
capital intensity of agriculture will have to increase to foster substitution possibilities
between machinery capital and relatively unskilled labor (Johnson 2000). More human
capital will be required as well for this substitution to take place. The current state of
credit and land markets in China makes this capitalization of agriculture difficult and
hence, a major challenge to Chinese policymakers.
1 The improvements in irrigation infrastructure are especially acute in the context of grain production in Northeast and North China. Over the long term, the potential to increase higher quality grain production faces increased water constraints because both agricultural and nonagricultural uses have put high pressure on available water resources over the past 20 years. The latter have sharply cut river flows and drawn down aquifer levels (Crook and Diao 2000).
References Alpine, R.W.L., and J. Pickett. (1993). Agriculture, Liberalisation and Economic Growth
in Ghana and Cote d’Ivoire, 1960-1990. OECD Development Center, Paris: OECD Publications.
Appleyard, D. (1987). “Comparative Advantage of Agricultural Production Systems and
its Policy Implications in Pakistan.” Development Paper No. 68. Food and Agriculture Organization, Rome.
Barichello, R., S. Pearson, and M. Selim. (1998). “The Impact of the Indonesian
Macroeconomic Crisis on Agricultural Profitabilities.” Mimeo. University of British Columbia, December.
Brown, L. (1995). Who Will Feed China? Wake up Call for a Small Planet. World Watch
Institute, September. Bowen, H. P., E. E. Leamer, and L. Sveikauskas. (1987). “Multicountry, Multifactor
Tests of the Factor Abundance Theory.” American Economic Review 77(5): 791-809. Carter, C. A., J. Chen, and S. D. Rozelle. (1998). “China’s State Trading in Grains: An
Institutional Overview.” Proceedings of WCC-101 of Food Markets in China: New Looks and Deeper Understandings, January 12-13, 1998, Honolulu, Hawaii.
Carter, C. A., and X. Li. (2000). “Economic Reform and the Changing Pattern of China’s
Agricultural Trade.” Paper presented at the 44th Annual Australian Agricultural and Resource Economics Society Conference, January 23-25, 2000, Sydney, Australia.
Carter, C., F. Zhong, and F. Cai. (1996). China’s Ongoing Agricultural Reform. San
Francisco: The 1990 Institute. Distributed by University of Michigan Press. China’s State Statistical Bureau. China Statistical Yearbook. (Zhongguo Tongji
Nianjian). Various issues. Beijing, China. Crook, F. W. (1997). “Current Agricultural Policies Highlight Concerns About Food
Security.” China Situation and Outlook, International Agriculture and Trade Reports, U.S. Department of Agriculture, WRS-97-3.
_______________. (1999). “An Analysis of China’s Quest for Food Grain Security,”
Paper presented at the WCC-101 Conference, February 1999, San Diego, California.

26 / Fang and Beghin
Crook, F. W., and X. Diao. (2000). “Water Pressure in China: Grow the Strains Resources.” Agricultural Outlook, U.S. Department of Agriculture. Jan-Feb 2000/AGO-268.
Customs General Administration of PRC. (1997). China’s Customs Statistics. Various
issues. Beijing, China. Estrin, A. J. (1999). “The Impacts of Self-Sufficiency Policies and Fiscal
Decentralization on the Efficiency of Grain Production in China.” Mimeo. University of California, Davis, May.
Fan, S., and P. H. Pardey. (1997). “Research, Productivity, and Output Growth in
Chinese Agriculture.” Journal of Development Economics 53: 115-37. Garnaut, R., G. Shutian, and M. Guonan. (1996). The Third Revolution in the Chinese
Countryside. United Kingdom: Cambridge University Press. Gonzales, L. A., F. Kasryno, N. D. Perez, and M. W. Rosegrant. (1993). “Economic
Incentives and Comparative Advantage in Indonesian Food Crop Production.” Research Report No. 93. International Food Policy Research Institute, Washington, D.C.
Hayes, D. J., A. Kumi, and S. R. Johnson. (1995). “Trade Impacts of Soviet Reform: A
Heckscher-Ohlin-Vanek Approach.” Review of Agricultural Economics 17(May)2: 131-45.
Huang, Y. (1998). Agricultural Reform in China: Getting Institutions Right. United
Kingdom: Cambridge University Press. Huang, J. (2000a). “Trade Liberalization and China’s Food Economy in the 21st Century:
Implications to China’s National Food Security,” Mimeo. Center for Chinese Agricultural Policy, Chinese Academy of Agricultural Sciences, Beijing.
_______________. (2000b). Personal electronic mail communication. Huang, J., and C. Chen. (1999). “Effects of Trade Liberalization on Agriculture in
China.” Working Paper 43. CGPRT Centre, Bogor, Indonesia. Huang, J., and S. Rozelle. (1996). “Technological Change: Rediscovering the Engine of
Productivity Growth in China’s Rural Economy,” Journal of Development Economics 49: 337-69.
Huang, J., S. Rozelle, and M. W. Rosegrant. (1999). “China’s Food Economy to the
Twenty-First Century: Supply, Demand, and Trade,” Economic Development and Cultural Change 47(4): 737-66.
Food Self-Sufficiency, Comparative Advantage, and Agricultural Trade / 27
Johnson, D. G. . (1994). “Does China Have a Grain Problem?” China Economic Review 5(1)Spring: 1-14.
_______________. (1999). “China’s Grain Trade: Some Policy considerations.” Paper
presented at the symposium of China’s Agricultural Trade and Policy Issues, Analysis, and Global Consequences, June 25-26, 1999, San Francisco, California.
_______________. (2000). “China’s Agriculture and WTO Accession.” Paper No 00-02.
Office of Agricultural Economics Research, University of Chicago, March. Krueger, A. O., M. Schiff, and A. Valdes, (eds.). (1991). The Political Economy of
Agricultural Pricing Policy. A World Bank Comparative Study. Baltimore and London: Johns Hopkins University Press for the World Bank.
Leamer, E. E. (1984). Sources of International Comparative Advantage: Theory and
Evidence. Cambridge, MA: MIT Press. Lu, F. (1997). “Comparative Advantage and China’s Food Trade Pattern: A Third Option
for China’s Food Policy Adjustment” In Agricultural Polices in China. Organisation for Economic Co-operation and Development, Paris, France.
Masters, W. A., and A. Winter-Nelson. (1995). “Measuring the Comparative Advantage
of Agricultural Activities: Domestic Resource Costs and the Social Cost-Benefit Ratio.” American Journal of Agricultural Economics 77: 243-50.
Ministry of Agriculture (MOA). (1996). “Report on China’s Agricultural Development.”
Beijing, Zhongguo Nongye Chubanshe, August. Monke, E. A., and S. R. Pearson. (1989). The Policy Analysis Matrix for Agricultural
Development. Ithaca and London: Cornell University Press. Morris, M. L. (1990). “Determining Comparative Advantage through DRC Analysis:
Guidelines Emerging from CIMMYT’s Experience.” CIMMYT Economics Paper No. 1. Mexico City, Mexico.
Nelson, G. C., and M. Panggabean. (1991). “The Costs of Indonesian Sugar Policy: A
Policy Analysis Matrix Approach.” American Journal of Agricultural Economics 73: 704-12.
Shuguang, Z., Z. Yansheng, and W. Zhongxin. (1999). Measuring the Costs of Protection
in China. Institute for International Economics, Washington, D.C. Tuan, F., and G. Cheng. (1999). “A Review of China’s Agricultural Trade Policy.” Paper
presented at the Symposium of China’s Agricultural Trade and Policy: Issues, Analysis, and Global Consequences, June 25-26, 1999, San Francisco, California.
28 / Fang and Beghin
U.S. Department of Agriculture-ERS. (1998). “China: International Agriculture and Trade Report.” U.S. Department of Agriculture, Economic Research Service, WRS-98-3, July 1998.
Vousden, N. (1990). The Economics of Trade Protection. United Kingdom: Cambridge
University Press. Wailes, E., C. Fang, and F. Tuan. (1998). “U.S.-China Agricultural Trade: Constraints
and Potential.” Journal of Agricultural And Applied Economics 30(1): 113-26. Wang, Z. (1997). “China’s Agricultural Trade in 1996: Commodity Structure,
Geographical Distribution, and its Role in U.S. and World Agricultural Trade.” U.S. Department of Agriculture, Economic Research Service, “China: Situation and Outlook Series.” WRS-97-3, pp. 6-15.
World Bank. (1991). “Zimbabwe Agricultural Sector Memorandum.” Report No. 9429-
ZIM. Washington, D.C. _______________. (1994). “China: Foreign Trade Reform, “World Bank Country Study,
1994, pp. 184-95. World Bank. (1996). World Development Indicators. Washington, D.C.: The World
Bank. _______________. (1997). World Development Indicators. Washington, D.C.: The
World Bank. _______________. (1998). World Development Indicators. Washington, D.C.: The
World Bank. Yao, S. (1997). “Comparative Advantages and Crop Diversification: A Policy Analysis
Matrix for Thai Agriculture.” Journal of Agricultural Economics 48(2): 211-22. Yao, S., and C. Tinprapha. (1995). “Comparative Advantage and Crop Diversification: A
Policy Analysis Matrix for the Thai Agriculture.” A Technical Report prepared for the Food and Agriculture Organisation (FAO) of the United Nations and the Ministry of Agriculture and Cooperatives of the Royal Thailand Government.
Yin, J. Z., and W. A. Stoever. (1994). “Testing the Causes of Discontinuities in the Black
Market Exchange Rate in China.” World Development 22(9): 1413-24.