Self Help Group-Banking-Poverty Reduction Nexus: A · PDF fileSelf Help Group-Banking-Poverty...
22
Self Help Group-Banking-Poverty Reduction Nexus: A Case Study of Uttarakhand State, India* Kaliappa Kalirajan Crawford School of Economics and Government The Australian National University & Kanhaiya Singh National Council of Applied Economic Research New Delhi * Financial support provided by the Foundation for Advanced Studies on International Development, Tokyo is gratefully acknowledged.
Transcript of Self Help Group-Banking-Poverty Reduction Nexus: A · PDF fileSelf Help Group-Banking-Poverty...

Self Help Group-Banking-Poverty Reduction Nexus:
A Case Study of Uttarakhand State, India*
Kaliappa Kalirajan Crawford School of Economics and Government
The Australian National University
&
Kanhaiya Singh National Council of Applied Economic Research
New Delhi
* Financial support provided by the Foundation for Advanced Studies on International Development, Tokyo is gratefully acknowledged.

Self Help Group-Banking-Poverty Reduction Nexus: A Case Study of Uttarakhand State, India
Introduction In spite of having diversified regional development with different languages and communities in a vibrant democratic administrative framework, India has made remarkable progress in recent years on a scale, size and pace that is unprecedented in its own history. As a result of two decades of economic reform, India achieved a remarkable average gross domestic product (GDP) growth rate of 8% from 2003-2010. Apart from accounting for almost a third of the world population, the share of both China and India in the world economy has grown substantially. Taken together they are expected to contribute around 1.8 percent of the 4.5 percent global growth expected in 20111. Currently, India is the fourth largest economy, replacing Germany (IMF, 2011 2 ). Furthermore, based on the current economic growth trajectory (in PPP terms), India is expected to be the third world largest economy by 20203. What are the major engines of growth in India?
Table 1 shows that India enjoys consumption-led growth and investment is slowly increasing its contribution to growth in recent years. Unlike the East Asian model, India’s is not of export-led growth in goods. However, export of services has been making significant contribution to GDP growth consistently over the years. For example, India exported goods worth $218.9 billion during 2010 while export of services was $190.6 billion. In spite of the outstanding economic growth, particularly consumption-led growth, and a bright future growth prospect, reducing poverty is still the most daunting challenge for India. While poverty in India has reduced significantly, a significant number of Indians still lives below the national poverty line. According to the estimates of poverty incidence by the planning commission of India (2001), the headcount ratio of consumption poverty, at the national poverty line (the proportion of the population with monthly per capita consumption expenditure below the official poverty line), was 26.1% in 1999-2000 compared to 36.0% in 1993-1994. The percentages of people living below national poverty lines in rural and urban areas were 27.1% and 23.6% in 1999-2000 compared to 37.3% and 32.4% in 1993-1994 respectively4. India witnessed a significant reduction in headcount ratio between 1993-1994 and 1999-2000. However, there is a large disparity between rural poverty and urban poverty across states (Table 2). It is customary to argue that urban poverty is a spillover of rural poverty. Which aspect of poverty is crucial for improving human welfare consistently? Sen (1992) has argued that neither the income nor the consumption aspects of measurements of poverty are adequate to understand the severity of poverty. The reasons behind the argument are that areas with a large concentration of the poor are also those with low levels of income, low nutritional levels, low literacy rates, low life expectancy, and high rates of infant mortality. They also have low standards of physical and social infrastructure, particularly in rural areas, and receive low levels of public expenditure. Nevertheless, drawing on Anand and Ravallion (1993) and Bidani and Ravallion (1995), it may be argued that progress in reducing income poverty is crucial in reducing most non-income dimensions of poverty. 1 http://www.conference-board.org/data/globaloutlook.cfm 2 International Monetary Fund, World Economic Outlook Database, April 2011: Nominal GDP list of countries. Data for the year 2010. 3 http://blog.euromonitor.com/2010/07/special-report-top-10-largest-economies-in-2020.html 4 The poverty line was defined using per capita monthly expenditure, which varied across states from Indian Rupees (Rs.) 262.94 in rural Andhra Pradesh to Rs.374.79 in rural Kerala, and from Rs.344 in urban Assam to Rs.539.71 in urban Maharashtra for 1999–2000 (Planning Commission 2002).

What are the effective methods to reduce poverty that are feasible at the individual and community levels?
The World Development Report of 2000-2001 of the World Bank (2000) argues,
“Access to financial markets is important for poor people. Like all economic agents, low income households and micro-enterprises can benefit from credit, savings, and insurance services. Such services help to manage risk and to smooth consumption… And allow people to take advantage of profitable business opportunities and increase their earnings potential. But financial markets, because of their special features, often serve poor people badly… Since poor people often have insufficient traditional forms of collateral (such as physical assets) to offer, they are often excluded from traditional financial markets… transactions costs are often high relative to the small loans typically demanded by poor people. And in areas where population density is low, physical access to banking services can be very difficult… ”
In order to fight back poverty, the Central as well as States Governments in India have
attempted a number of programs leading to income generation. Some of these programs lead to creation of common physical assets, such as rural infrastructure including roads; facility for drinking water; sewerages while others create self-employment, promote entrepreneurship and provide support for business to the individuals or groups. Yet, another type of program, mainly in the form of public intervention, includes those that reduce the cost of livelihood. Often assets creating schemes are criticised because they are one-off employment opportunities and at the same time the assets created are also not durable. However, in the case of programs with temporary employment can also lead to sustainable development if the resultant income could be deployed in profitable activity through self help groups (SHGs). Since poverty reduction on a permanent basis requires a sustainable income stream, it is worth initiating schemes with such end results. The poverty alleviation programs target the people living below poverty line or just above poverty line through SHG units that are given loans without any mortgage and less paper work at a reasonably lower interest rate of 12 per cent per annum5.
As of 31 March 2007, about 2.92 million SHGs were linked to the banks in India with the population of 1.122 billion, which means on an average one SHG for every 275 persons (Table 3). The leading states in this movement include Andhra Pradesh, Karnataka and Himachal Pradesh. The interesting question is whether the high concentration of SHGs in Andhra Pradesh, where almost every family appears to have been attached to this movement has led to any significant improvement in poverty reduction. Figures in Table 2 reveals that the annual change in the percentage of population living below the poverty line between 1993-94 and 1999-2000 in Andhra Pradesh was only 1 percent, which is a matter for concern. Nevertheless, the more interesting phenomenon is the absence of any correlation between the share of poor residing in a state and the share of SHGs formed in the states (Figure 1).
5 The concepts of microfinance, and SHG are explained as follows: “Microfinance involves the provision of financial services such as savings, loans and insurance to poor people living in both urban and rural settings who are unable to obtain such services from the formal financial sector” (Wrenn, 2005). “A SHG is a registered or unregistered group of micro entrepreneurs having homogenous social and economic background voluntarily, coming together to save small amounts regularly, to mutually agree to contribute to a common fund and to meet their emergency needs on mutual help basis. The group members use collective wisdom and peer pressure to ensure proper end-use of credit and timely repayment thereof. In fact, peer pressure has been recognized as an effective substitute for collaterals” ( http://www.geocities.com/kstability/learning/banking2/micro2.html#help).

It is, therefore, imperative to assess the effectiveness of SHG movement in Uttarakhand, which was carved as a new state from Uttar Pradesh in 2000, for the following major reasons6: (a) the burden of loan per SHG is the highest in Andhra Pradesh and Uttarakhand is not much far behind (Table 4); (b) Though during the recent years, the growth in SHGs have been very high in Maharashtra, Karnataka and Uttar Pradesh but the loan per SHG remained low unlike in Uttarakhand, where the volume of loan has increased faster than the number of SHGs; (c) according to the data compiled in NABARD (2005), only 5.6 percent of SHGs in Uttarakhand were given repeat loans during 2004-05 as against 40 percent in Andhra Pradesh, 19.5 per cent in Himachal Pradesh, and 15.0 per cent in Karnataka; and (d) the ratio of SHGs having repeat loans to the new SHGs linked to banks (Ratio-RN) in Uttarakhand was among the smallest7. These characteristics call for an in-depth analysis of the performance of SHGs towards reducing poverty in Uttraranchal, which is the main objective of this study.
The next section discusses the issues related to poverty in India and Uttarakhand, which is followed by a more detailed analysis of the SHG movement in Uttarakhand. Section 3 discusses the survey data on SHG families in part of Uttarakhand and the results are discussed in section 4. Conclusions of this study and policy recommendations are given in a final section. 2. Poverty Reduction in India and Uttarakhand: A Synopsis
At the national level, during 1973 to 2005 the percentage of population living below the poverty line (PVR) has declined from 56 per cent to 27.1 per cent in rural areas and from 49.0 per cent to 23.6 per cent in urban areas. In total the PVR has gone down from 54.9 percent to 26.1 percent. It shows a sharp fall in the poverty ratio over time. However, the problem of poverty is more severe in rural areas than in the urban areas albeit, over the years the difference between rural and urban poverty ratio has gradually come down from 7.0 percent in 1973-74 to 3.5 percent in 2004-05. With 70 percent as the rural population in India during 2001, the share of poor residing in the rural areas can be approximately estimated as about 74.per cent. It is also clear that maximum decline in the poverty ratio has occurred during the period marked by economic reforms from the middle of 1991.
The results of Uttarakhand’s BPL census for 1997 and 2002 are presented in Table 5 along with the PVR values for the selected states for the period of 1993-94 and 2004-05, which shows a decline in BPL-based rural poverty in the order of 4.96 percentage points. With high rate of growth in GSDP of Uttarakhand during the recent years, the poverty would have declined further in the state. Thus, based on BPL census, incidence of poverty in Uttrakhand is lower than its parent state and all India average but much higher than the neighbouring state of Himachal Pradesh. Like many other states, Uttrakhand too has introduced different schemes like Swarna Jayanti Gram Swarojgar Yojana (SJGSY), Swashakti Project, Swayamsiddha program, and JFM, which are expected to generate self-employment leading to sustainable poverty alleviation and economic empowerment. The aims and the objectives of these programs are summarised in Table 6.
In all these programs the SHG is taken as the key unit and the success of the program is tightly linked to the operational success of these SHG units. The poverty alleviation programs target the people living below poverty line or just above poverty line through SHG
6 Uttranchal and Uttarakhand are synonymously used in this study. 7 While Ratio-RN was of the order of 1.43 in Andhra Pradesh, 0.56 in Himachal Pradesh and 0.48 at the all
India level, it was just about 0.19 in the case of Uttarakhand.
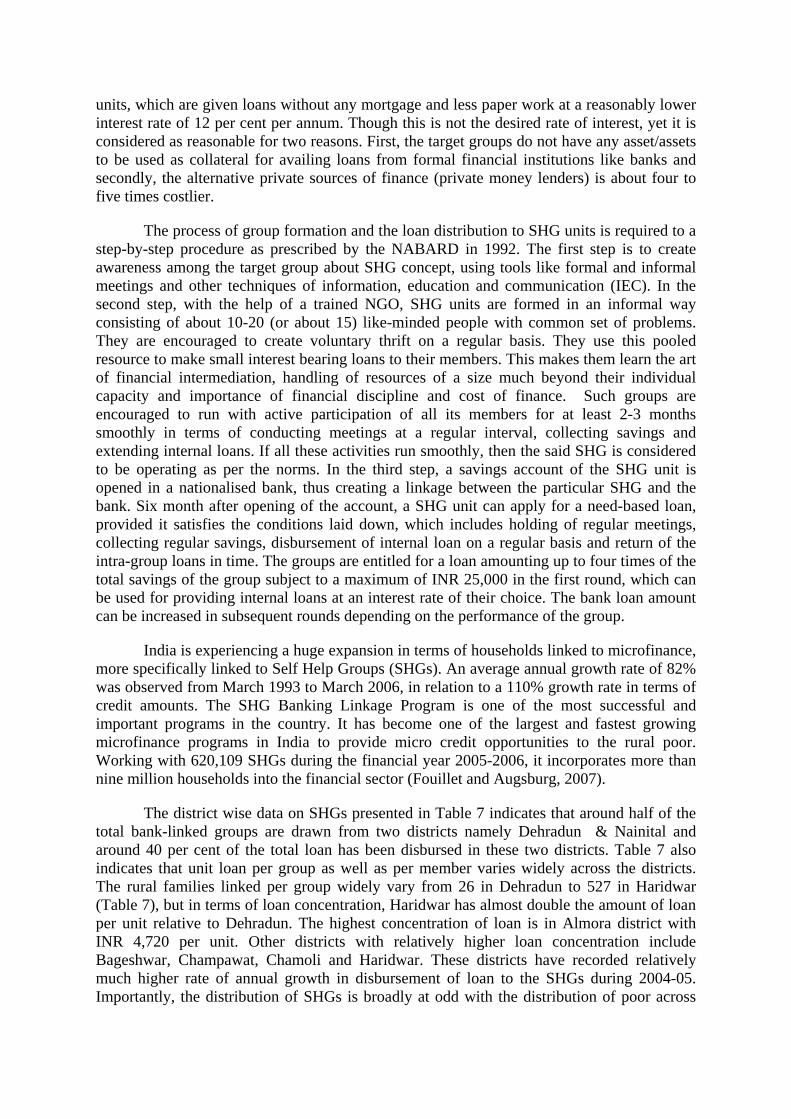
units, which are given loans without any mortgage and less paper work at a reasonably lower interest rate of 12 per cent per annum. Though this is not the desired rate of interest, yet it is considered as reasonable for two reasons. First, the target groups do not have any asset/assets to be used as collateral for availing loans from formal financial institutions like banks and secondly, the alternative private sources of finance (private money lenders) is about four to five times costlier.
The process of group formation and the loan distribution to SHG units is required to a step-by-step procedure as prescribed by the NABARD in 1992. The first step is to create awareness among the target group about SHG concept, using tools like formal and informal meetings and other techniques of information, education and communication (IEC). In the second step, with the help of a trained NGO, SHG units are formed in an informal way consisting of about 10-20 (or about 15) like-minded people with common set of problems. They are encouraged to create voluntary thrift on a regular basis. They use this pooled resource to make small interest bearing loans to their members. This makes them learn the art of financial intermediation, handling of resources of a size much beyond their individual capacity and importance of financial discipline and cost of finance. Such groups are encouraged to run with active participation of all its members for at least 2-3 months smoothly in terms of conducting meetings at a regular interval, collecting savings and extending internal loans. If all these activities run smoothly, then the said SHG is considered to be operating as per the norms. In the third step, a savings account of the SHG unit is opened in a nationalised bank, thus creating a linkage between the particular SHG and the bank. Six month after opening of the account, a SHG unit can apply for a need-based loan, provided it satisfies the conditions laid down, which includes holding of regular meetings, collecting regular savings, disbursement of internal loan on a regular basis and return of the intra-group loans in time. The groups are entitled for a loan amounting up to four times of the total savings of the group subject to a maximum of INR 25,000 in the first round, which can be used for providing internal loans at an interest rate of their choice. The bank loan amount can be increased in subsequent rounds depending on the performance of the group.
India is experiencing a huge expansion in terms of households linked to microfinance, more specifically linked to Self Help Groups (SHGs). An average annual growth rate of 82% was observed from March 1993 to March 2006, in relation to a 110% growth rate in terms of credit amounts. The SHG Banking Linkage Program is one of the most successful and important programs in the country. It has become one of the largest and fastest growing microfinance programs in India to provide micro credit opportunities to the rural poor. Working with 620,109 SHGs during the financial year 2005-2006, it incorporates more than nine million households into the financial sector (Fouillet and Augsburg, 2007).
The district wise data on SHGs presented in Table 7 indicates that around half of the total bank-linked groups are drawn from two districts namely Dehradun & Nainital and around 40 per cent of the total loan has been disbursed in these two districts. Table 7 also indicates that unit loan per group as well as per member varies widely across the districts. The rural families linked per group widely vary from 26 in Dehradun to 527 in Haridwar (Table 7), but in terms of loan concentration, Haridwar has almost double the amount of loan per unit relative to Dehradun. The highest concentration of loan is in Almora district with INR 4,720 per unit. Other districts with relatively higher loan concentration include Bageshwar, Champawat, Chamoli and Haridwar. These districts have recorded relatively much higher rate of annual growth in disbursement of loan to the SHGs during 2004-05. Importantly, the distribution of SHGs is broadly at odd with the distribution of poor across

districts. The highest percentage share of poor resides in Haridwar (80 percent), but it has the least concentration of SHGs (Table 7). 3. A random sample of SHG families in Uttarakhand In order to analyse the impact of SHGs on income poverty reduction in Uttarakhand, data has been collected during January to March 2005 from 294 households randomly from three districts covering 32 SHGs spread over three districts of Dehradun, Pithoragarh and Almora, where the poverty ratio was about 40 percent in each of these districts in 2005. While the summary of the data coverage is presented in Annex-I, the characteristics are discussed briefly below.
3.1 Sample Characteristics
SHG were dominated by female members. While 85 percent of the SHG were purely female SHGs, only 3.4 percent were male SHGs and the rest 11.5 percent were mixed. Almost 89 percent of the SHG covered have been operating for more than 3 years. According to programs, 31 percent of the SHG belonged to SJGSY, 64.4 percent belong to SWASHAKTI and the rest were distributed among Swayam-Siddha, JFM and DASP. The SGSY program is mainly targeted to below poverty people but the membership is not restricted.
The main occupation of the SHG members was animal husbandry (31 percent), while a majority 42 percent still remained housewives only. 11 percent of the SHG members worked as agriculture labourers, while 7.4 percent were self employed in agriculture. Almost 80 percent of the SHG members had pucca (all season permanent) house, 17 percent have semi-pucca houses and only 3.1 percent lived in kuccha (wetherable) houses. Average family size was just about 3.7 with 35 percent of the families had 4 members in family and 30 percent had 5-member family. Average schooling of the SHG members was about 5 years with 30 percent of the SHG members as illiterates, while the average education of head of the family was about 7 years with only 17.5 percent as illiterate. 4. Key Findings from the survey analysis 4.1. Women Empowerment
In order to find out the effect of SHG movement on empowerment following five questions were asked:
E1. Did you attend any community or village meeting such as Panchayat, Gram Sabha or other committee meeting?
E2. Are you member of any village or government committee? E3. Are you sending your children of school age (girls in the age group of 6-14 years) to
school? E4. Are you sending your children of school age (boys in the age group of 6-14 years) to
school? E5. Have you approached any government department for any of your problem?
The responses are presented in Table 8. Clearly, there is poor participation of the
members in village and government committees and they have occasionally approached government departments for resolving problems; yet, the change is significant. There is significant change in attitude and participation of the members in sending their female and male children to schools. However, girls’ education still remains a neglected priority. Positive changes have been reported with respect to self confidence and participation in the decision

making process (Table 9). At least 35.5 percent of the SHG members have reported increase in self confidence, which is a fairly good number and with the passage of time such confidence will increase further. The members have started participating in monetary decision and controls over expenditure of the household income and loans.
4.2. Change in Income8 and assets
SHG members were asked to report exclusively their own annual income before joining SHG and the income obtained currently. The interview also included the income of other family members from various sources. A before and after income analysis presented in Figures 2 to 5 indicates positive increase in members income even though the other members of the family did not increase their own income. Increase in income of other members has been weak but has positive association with the increase in member’s income.
Since land and other assets holdings are common to the family, we present the change in land asset and household asset holding for the family as a whole. Clearly, the land holding has not changed substantially (Figure 4), but the assets holding has changed largely for those who had smaller assets before joining SHG (Figure 5). In order to find out whether the changes are different from zero significantly, paired sample test were carried out for before and after results with respect to land holding, assets holding and the per capita income of the member and non-members. The test results are presented in Table 10.
The paired test clearly shows the following:
(1) Change in land asset is not significant but it has increase since joining the SHG
(2) The value of current assets owned (AOVC) is significantly higher than the value of assets owned before joining the SHG
(3) Current Income of member (HHINCMC) and non-members (NMINCMC) are significantly more than that before joining SHG
4.3. Other Findings About 79 percent of the loans were used for consumption purposes. Another important finding is that the group enterprise is still not a common activity in the state. Most of the loans are taken on individual basis. During the field visits, it was also observed that the major reasons behind this include the following:
A sizeable section of the group members did not know how to use the money except for consumption purpose.
The influential members in the groups did not allow others to borrow from the SHGs.
A section of members who got loan did not repay it back in time.
Lack of trust among the members prevailed. Above problems do breed misunderstanding among the group members and ultimately many of them leave the group. However, in order to maintain the group strength, new members are added. There was fairly a long list of economic activities against which members have taken loans. This includes animal husbandry, poultry, floriculture, marketing of spices, diversification of agriculture, general shops, and workshops for cycle repairing. However, among the surveyed participants, the most popular activity was animal husbandry. As noted earlier, group enterprise is still not a common activity in the state. During the fieldwork only one example of group enterprise was found. 8 We use nominal income for this analysis and propose to extend the analysis after conversion to real income in
later version of the paper.

As noted above, participation in income generating activities with the help of group finance is not a wide spread phenomenon in the state. More importantly, the government sponsored SJGSY has performed worst as compared to other projects. The failure of SJGSY amounts to the failure of anti-poverty program. In the case of SJGSY, around 14 percent of the beneficiaries were from the APL families. A similar observation was made in the "Concurrent evaluation of SJGSY " conducted by the Central Ministry of Rural Development in the year 2002 (see GoI 2003).
Percentage of total beneficiaries belonging to BPL Families Percentage of total beneficiaries belong to BPL Families SJGSY Other Projects Total Almora 92 59 62 Dehradun 84 62 57 Total 86 61 58 Source: Office of District Rural Development Agency, District Dehradun, 2004-05. Not surprisingly, the survey team came across some of the highly successful women entrepreneurs, but most of them were attached to non-SJGSY groups and from APL families. It appears that a member has to arrange at least half of the total investment on her own. However, groups led by some influential persons, could get most of the required investment financed through banks. Clearly, all such programs are not useful for BPL people, who cannot arrange the seed money and the working capital.
There is no doubt that the income generating activities with the help of the SHGs raised hopes in certain cases. These activities helped women specially, in acquiring economic and social empowerment. However, in most of the situations the benefits did not reach the poorest of the poor. Unforeseen consumption expenditure has become the major purpose of internal loaning. Therefore, the basic goals of economic empowerment and poverty alleviation get defeated. 4.4. Causes of problems to SHG movement in Uttarakhand
The field survey revealed that many members joined the groups just for getting loan without cultivating a habit of saving. They leave the groups in between even without repaying the loan, making the group vulnerable. Such groups are compelled to look for and include other persons to substitute the outgoing member, but often the new incumbent joining the SHG too has similar intentions. This reflects an unhealthy and negative attitude of the people towards the SHG movement, which has developed mainly due to faulty implementation of the program and lack of awareness among people about the basic objective and purpose of the SHGs.
In most cases, the groundwork for group formation is not carried out as per the prescribed norm (Table 11). As a result, the base itself has become weak and in the process the regular activities like savings, meetings, internal loaning, repayment of the loan in time etc. have been affected. These activities have not been done, the way it should have been. Among the projects, the SJGSY appears to have been affected and abused the most.
One of the most important activities of the SHG movement is to hold regular meeting of its members and run awareness campaigns. The field survey carried out indicated lack of all these aspects as almost 78 per cent of groups did not meet regularly (Table 12). In many villages instead of regular meetings the village development officers (VDO or village

secretary) or NGO Workers collected monthly savings through door-to-door visits. It is also reported during informal discussions that the registers are maintained by the village development officers or NGO workers and for getting the signatures / thumb impression the registers were sent to the group members at their residence.
Six-monthly audit of accounts was accomplished in about 86 percent of the groups, but only a few members were aware of this and its implications. Thus, the decision-making, and finance management process were in the hands of a few influential members or the functionaries like village development officers or NGO workers. In this context, the opinion (in Hindi) of a village sabhapati (president) who wanted remain anonymous, is worth quoting:
"secretary ne smuho banane ke samay 25,000 rupiyae ka lalach dikhiaye the. Us samay unhone bacahat, meeting eya sab ki bate kutch nahi kiya tha. To kaiyase umid kare ki SJGSY ka group chalega. Paysa milne ke bad group to toot hi jayega."
The meaning of the above quote is: ‘the secretary had promised INR 25,000 at the time of forming the group. At that time, he did not tell us about the savings and meetings. Then, how can we believe that the groups belonging to SJGSY will run successfully? After getting the money, the group disintegrated inevitably.’
Apparently, bankers’ attitude towards SHGs seems to be fair and forthcoming irrespective of group’s affiliation. However, the Swashkti officials strongly opposed this view. In their opinion SJGSY groups manage to get favour from the bankers due to the repeated intervention of the chief development officers and at times the banks were forced to even violate the NABARD guidelines for approving the loans to the SJGSY groups, which were not even 6 months old. On the other hand, in many cases, Swashkti group leaders had to take help of Assistant General Manager of NABARD to get loans.
Almost all the programmes have ignored the component of capacity building specially, for entrepreneurship development programme. In some cases, in the name of entrepreneurship development, a few training programs have been conducted from time to time but these programs were lacking in quality of training materials, trainers and follow up programs. Involvement of inactive NGOs was also highly responsible for this. As a result, the members have failed to initiate new enterprises in most of the situations.
Marketing support forms the backbone in establishing tiny new enterprises. In most of the projects, this concept was not taken seriously. In the projects like Swashakti, and Swayamsiddha a special unit called marketing unit has been formed and experts have been appointed in this unit from time to time, but this too has not been able to go beyond few stray cases such as one reported in Almora district for spices marketing. In the case of SJGSY, it was expected that district rural development agency (DRDA) would help the farmers for creating a forward & backward linkage for their products in the market. However, the evaluation study done by the Ministry of Rural Development on SJGSY reveals that DRDA in Uttrakhand is nothing but merely a show piece (GOI 2003). 5. Conclusions and Policy Recommendations
The analysis based on the primary survey clearly indicates that the SHG movement in Uttarakhand is poorly linked to targeting poor; instead it is a general phenomenon of raising income in the rural areas. Its success is also linked to the social fabric, where tendency to co-

operate and work in group for common cause is more important. The other critical factor is the availability of traditional economic activities to leverage the skill with more efficient methods and affordable credit. If such activities are not available in the region then the situation is more challenging and the challenge is to discover economic activity that can be pursued cost effectively.
Poor governance and weak implementation are the main causes of persistent poverty, backwardness and low human development in India. The case studies and the field survey in this study lead to similar conclusions. Therefore, there is a need to improve the system and it should be designed to take care of itself. In the current context the following issues are relevant for implementation.
1. Methodology to identify the poor needs to be improved.
2. The planners need to develop the vision for a long-term goal instead of short-term goal.
3. The system should be made more transparent than the present scenario.
4. The policy approach in employment generation programs should aim at the ultimate goal of poverty alleviation, not one time employment generation.
5. The programs should be monitored more seriously than the existing level.
6. In any project planning, execution and monitoring cannot be done by the same person. It has become visible in the programs like SJGSY and the similar kind of programs.
7. The system needs a massive administrative reform at all levels.
8. Sound policy needs to be framed in the state keeping the issues on participatory management in mind.
Institutional Experiences:
Some of the institutions such as Bharatiya Agro Industries Foundation (BAIF), Development for Humane Action (DHAN) Foundation, Shri Kshethra Dharmasthala Rural Development Project (SKDRDP) etc shared their experiences in promotion of micro enterprises among SHG members. The experiences, though mostly are at the pilot stage, highlighted that:
1. It is appropriate to introduce income-generating activities based on known skills, knowledge and resources.
2. It is better to integrate with existing livelihood activities of group members.
3. More emphasis needs to be laid on developing business skills than on providing backward and forward linkages.
4. Micro enterprise development is not a stand-alone activity, but requires a combination of factors to enable growth as a business entity.
5. It is both efficient and cost effective to promote farm sector micro enterprises because backward and forward linkages are locally available.
6. Promotion of non-farm sector activities, particularly those in manufacturing sector, is a challenge for providing market linkages because significant sales turn over is required by each member to earn incomes, which are even equivalent of minimum wages or to cross the poverty line.

References
1. Anand, Sudhir and M artin Ravallion (1993), ‘Human development in poor countries: on the role of private incomes and public services’, Journal of Economic Perspectives, 7(1):133–50.
2. Bidani, B. and Martin Ravallion (1995), ‘Decomposing social indicators using distributional data’, Journal of Econometrics, 77:159–79.
3. Center for Management Development (2003): Concurrent Evaluation of Swarnajayanti Gram
Swarozgar Yojana, Ministry of Rural Development, Government of India.
4. Government of India (2005): Performance Evaluation of Targeted Public Distribution System,
Planning Commission
5. Government of India (2005): Policy Guideline‐ESA‐Project, Government of India, New
Delhi.
6. Government of India (2005): Policy Guideline‐SJGSY, Government of India, New Delhi.
7. Govt. of India (1999): Guideline for Swarna Jayanti Swarozgar Yojana, Govt. of India, New
Delhi.
8. Govt. of India (1999): Guideline on Joint Forestry Management Project, Govt. of India, New
Delhi.
9. Khosla, R.K. (2000): Rural & Urban Development in India, IPD, Delhi.
10. Ministry of Rural Development (2005): Annual Report 2003‐04, Ministry of Rural
Development, Govt. of India.
11. NABARD training manual (2005), NABARD, New Delhi.
12. National Institute of Rural Development ( 2005): Rural Development Statistics, National
Institute of Rural Development, New Delhi.
13. Planning Commission (1993): Report of The Expert Group on Estimation of Proportion and
Number of poor, Planning Commission, New Delhi.
14. Planning Commission (2007): Eleventh Five Year Plan Document, Planning Commission,
New Delhi.
15. Saxena, Naresh C. (1999), Improving delivery of programmes through administrative reforms
in India, http://nac.nic.in/concept%20papers/ncsimprovingdelivery.pdf 16. Sen, Amartya (1992), Inequality Re-Examined, Oxford University Press, Oxford. 17. Singh, Kanhaiya (2006), State Development Report for Uttarakhand State.
18. Women Development Council (1999): Guideline Swashakti Project, Women Development,
Council, New Delhi.

Table 1. Drivers of the Indian Economy
Table 2. Poverty Reduction across Indian States
Drivers of GDP Growth: India
India
1995-00 2001-08
Final consumption expenditure 76.4 67.6
Gross capital formation 26.3 36.4
Net exports -2.7 -4.0
Total 100.0 100.0
Source: Computed from CSO data.
Drivers of GDP Growth: India
India
1995-00 2001-08
Final consumption expenditure 76.4 67.6
Gross capital formation 26.3 36.4
Net exports -2.7 -4.0
Total 100.0 100.0
Source: Computed from CSO data.
PVT93 PVT99 DPVTA Percentage of population
below the poverty line 1993-94
Percentage of population below the poverty line 1999-00
Annual change in percentage of population below the poverty line
1 ANDHRA PRADESH 22.19 15.77 1.072 ARUNACHAL PRADESH 39.35 33.47 0.983 ASSAM 40.86 36.09 0.794 BIHAR 54.96 42.60 2.065 DELHI 14.69 8.23 1.086 GOA 14.92 4.40 1.757 GUJARAT 24.21 14.07 1.698 HARAYANA 25.05 8.74 2.729 HIMACHAL PRADESH 28.44 7.63 3.47
10 KARNATAKA 33.16 20.04 2.1911 KERALA 25.43 12.72 2.1212 MADHYA PRADESH 42.52 37.43 0.8513 MAHARASHTRA 36.86 25.02 1.9714 MANIPUR 33.78 28.54 0.8715 MEGHALAYA 37.92 33.87 0.6816 MIZORAM 25.66 19.47 1.0317 NAGALAND 37.92 32.67 0.8818 ORISSA 48.56 47.15 0.2419 PUNJAB 11.77 6.16 0.9420 RAJASTHAN 27.41 15.28 2.0221 SIKKIM 41.43 36.55 0.8122 TAMIL NADU 35.03 21.12 2.3223 TRIPURA 39.01 34.44 0.7624 UTTAR PRADESH 40.85 31.15 1.6225 WEST BENGAL 35.66 27.02 1.44

Table 3. Characteristics of SHGs in India
Sl. No.
Particulars Cumulative as on 31 March 2007
All India
1 No.of SHGs linked 2,924,973 2 % of women groups 90 % 3 No.of participating banks : 498 i. Commercial Banks 50 ii. Regional Rural Banks 96 iii. Co-operative Banks 352 4 No. of States/UTs 31 5 No. of districts covered 587 6 Bank Loan Rs in billion 180.41 7 Refinance Rs. in billion 54.59 8 No.of poor households assisted (in million) 40.95 9 Average Loan/SHG - New Rs. 44,342 - Repeat Rs. 78,693 10 Average Loan/Family - New Rs. 3,167 - Repeat Rs. 5,621 11 Model Wise Linkage ( Cumulative) i. SHGs formed and financed by Banks 17 % ii. SHGs formed by other agencies but directly financed by banks 75 % iii. SHGs financed by banks using financial intermediaries 08 %
Source: NABARD (2008). Table 4. SHG-Banking Nexus in selected states in India
States Total
population
(lakh)
2004
Number
of SHGs
as on
31.03.05
SHG
Share
in
India
Population
/SHG
Estimated
number
of 5‐unit
rural
families
per SHG*
Loan
distributed
by the
banks
(INR lakh)
(31.03.05)
Loan
outstanding
per SHG
(INR)
Annual
growth
in
SHGs
during
2004‐05
Annual
growth
in loan
during
2004‐05
Uttrancahl 88.25 14043 0.87 628 90 5761 41020 28.74 56.74
Uttar Pradesh 1743.8 119648 7.39 1457 210 31558 26376 51.05 83.86
Himachal
Pradesh
62.49 17798 1.10 351 51 5650 31747 34.55 79.35
Karnataka 543.7 163198 10.08 333 48 55015 33711 57.12 93.98
Andhra
Pradesh
778.73 492927 30.46 158 23 274609 55710 27.84 58.88
Maharastra 1003.09 71146 4.40 1409 203 22341 31402 84.63 96.65
India 10682.14 1618456 100.00 660 95 689846 42624 49.98 76.69

Table 5. Poverty in India and Uttarakhand: A comparison States Planning Commission
(1993-94) Planning Commission
(2004-05) BPL
Census Rural Urban All Rural Urban All Rura
l 1997
Rural
2002Uttarakhand 40.8 36.5 39.6 36.44 31.4
8 Uttar Pradesh 42.3 35.4 40.9 33.4 30.6 32.8 36.91 Himachal Pradesh
30.3 9.2 28.4 10.7 3.4 1 0.0 27.59
India 37.3 32.4 36.0 28.3 25.7 27.5 41.05
Source (basic data): Planning Commission (2007): Eleventh Plan (2007-12). NCAER Estimate using NSSO 55th and 61st Round consumption data and poverty line as estimated in Planning Commission; For Uttrakhand the 1999-00 poverty line is same as Uttar Pradesh. http://www.uard.gov.in/bpl_list_2002/BPL%20Survey2002.htm for BPL 2002.

Table 6. Poverty reduction programs in Uttarakhand Projects Swarna Jayanti
Gramswarozgar Yojana (SJGSY)
Swashakti Swamsiddha Joint Forestry Management Program
Date of Commencement
01.04.1999 01.04.1999 01.04.2003 01.04.1998
Present Status
It is in operation at present.
The project was completed in March 2004.
The project is in operation.
The project was completed in March 2004.
Objectives To increase the income of the rural poor.
To empower the women in the economic, social and the other spheres of life
To make the womenfolk economically self sufficient and socially stronger
Protection of forests from fire and degradation
Sustainable livelihood for the rural mass.
Key Target Group
Rural families living below and just above the poverty line.
The economically and socially deprived women in the society of the rural areas.
The economically and socially deprived women in the society of the rural areas.
People living in the surrounding areas of the forest and dependent on the forest for their livelihood.
Preference /Priority if any
Preference to the women and SC/ST families.
Illiterate/semiliterate women of the rural areas.
Illiterate/semiliterate women of the rural areas.
No special priority group.
Funding Agency
The central & the state government contribute the fund in the ratio of 75:25 respectively.
The World Bank & IFAD
The World Bank & IFAD
The World Bank
Sources: (1) Govt. of India (1999): Guideline for Swarna Jayanti Swarozgar Yojana, Govt. of India, New Delhi. (2) Govt. of India (1999): Guideline on Joint Forestry Management Project, Govt. of India, New Delhi. (3) Women Development Council (1999): Guideline Swashakti Project, Women Development, Council, New Delhi.

Table 7. District wise Distribution of SHGs in Uttarakhand as on 31 March 2005 Rural
Population
(estimate
No. of SHGs
linked to Bank
Loan given
(INR lakh)
Annual
growth
in
SHGs
during
2004‐05
Annual
growth
in loan
during
2004‐05
Population/
Linked
Groups
Estimated
number
of 5‐unit
rural
families
per SHG
Unit Loan
(INR)
Number Share INR
lakh
Share Per
group
Per
Member
Almora 8.41 621 4.42 440 7.64 247.5 966 193 70837 4720
Bageshwar 4.81 269 1.92 191 3.32 220.8 1277 255 71078 4740
Chamoli 4.72 370 2.63 275 4.78 22.3 912 182 74378 4960
Champawat 2.86 296 2.11 196 3.41 175.6 689 138 66284 4420
Dehradun 9.32 5205 37.06 1585 27.51 11.7 128 26 30446 2030
Haridwar 15.54 421 3.00 269 4.67 78.3 2635 527 63943 4260
Nainital 7.87 1700 12.11 656 11.39 38.2 331 66 38588 2570
Pauri
Garhwal
9.90 686 4.88 353 6.13 82.1 1030 206 51472 3430
Pithoragarh 6.08 853 6.07 384 6.67 118.8 509 102 45041 3000
Rudraprayag 3.65 290 2.07 64 1.12 45.7 898 180 22207 1480
Tehri
Garhwal
9.69 1249 8.89 529 9.18 123.6 554 111 42346 2820
U.S.Nagar 12.98 1094 7.79 595 10.34 96.3 847 169 54424 3630
Uttarkashi 4.17 989 7.04 222 3.86 13.8 301 60 22457 1500
Source: Projected on the basis of the previous year data, Annual Report of NABARD, 2004-05

Table 8. Change in aspects of Empowerment and governance
Paired Samples Test Before After Paired Differences Per
cent Per
cent 95% Confidence
Interval of the Difference
Mean Std. Deviation
Std. Error Mean
Upper Upper
t df Sig. (2-
tailed)
Pair E1 1.7 21.2 0.02 0.13 0.01 0.00 0.03 2.25 292.00 0.03Pair E3 4.1 12.0 0.09 0.34 0.02 0.05 0.13 4.47 289.00 0.00Pair E4 17.5 38.2 0.21 0.42 0.02 0.16 0.25 8.33 291.00 0.00Pair E5 1.4 3.4 0.02 0.14 0.01 0.00 0.04 2.47 288.00 0.01
Table 9. Changes in Self Confidence and Control of Resources Management
Degree of Change Sl No
Case Percent of respondents reporting positive change
Good (1)
Slight (2)
No Change (3)
1 Increase in self-confidence since you joined
the SHG 35.5 21.6 60.3 18.1
2 Increase in ability to tackle the problems has changed since you joined the SHG
26.7 48.8 47.6 3.6
3 Increase in control over the use of money in the household since you became SHG member
25.4 16.3 55.1 28.6
4 Increase in control over the use of Loan money since you became SHG member
19.0 48.7 47.4 3.8

Table 10: Paired Samples Test
Paired Samples Test
Paired Differences 95% Confidence
Interval of the Difference
Mean Std.
DeviationStd. Error Mean
Lower Upper
t df Sig. (2-tailed)
Pair 1 LANDB - LANDC -0.05 1.05 0.06 -0.17 0.07 -0.78 296 0.43Pair 2 AOVB - AOVC -8,873 12,133 704 -10,258 -7,487 -12.60 296 0.00Pair 3 DPCNMINC - DPCMINC 272 5,097 298 -315 859 0.91 291 0.36Pair 4 HHINCMB - HHINCMC -13,552 23,907 1,390 -16,286 -10,817 -9.75 295 0.00Pair 5 NMINCMB - NMINCMC -7,364 20,497 1,191 -9,709 -5,020 -6.18 295 0.00
Paired Samples Statistics
Mean N Std. Deviation Std. Error Mean
LANDB 1.25 297.00 2.18 0.13Pair 1
LANDC 1.29 297.00 2.38 0.14
AOVB 11,165 297 43,914 2,548Pair 2
AOVC 20,038 297 45,411 2,635
DPCNMINC 1,799 292 5,380 315Pair 3
DPCMINC 1,527 292 2,402 141
HHINCMB 40,170 296 67,410 3,918Pair 4
HHINCMC 53,721 296 66,682 3,876
NMINCMB 35,908 296 64,296 3,737Pair 5
NMINCMC 43,272 296 62,534 3,635
Paired Samples Correlations
N Correlation Sig.
Pair 1 LANDB & LANDC 297 0.898 0.000
Pair 2 AOVB & AOVC 297 0.964 0.000
Pair 3 DPCNMINC & DPCMINC
292 0.338 0.000
Pair 4 HHINCMB & HHINCMC
296 0.936 0.000
Pair 5 NMINCMB & NMINCMC
296 0.948 0.000

Table 11: Group Formation Process in SJGSY (followed vs. recommended)
Standard steps laid down by NABARD Steps followed during implementation
Selection of NGOs
Training of NGO Workers
Motivation & Awareness campaign in the rural mass
Formation of SHGs through informal way
Selection of Group Leaders
Let the group work for 2‐3 months smoothly
Before opening of an account the bank should ensure that the group has
already held 2‐3 meetings with participation of all the members and that
all the members were aware of the benefits of the group
Opening account in the bank
Groups were formed by the Village
Development Officials without any
motivation and campaign
Leaders were selected without any
/proper consent of all the members
NGOs were selected and the groups
were handed over to them without any
proper training of the NGO Workers
Source: NABARD training manual (2005); Field survey, 2005
Table 12. Factors indicating awareness and internal consistency about group activities
Indicators Dehradun Almora Total
Number of groups interviewed 25 24 49
Groups which have got a properly framed bye laws 32.0 37.5 34.7
Groups where meeting are held regularly 24.0 20.8 22.4
Groups where more than half of the members attend meetings regularly 12.0 8.3 10.2
Records are maintained properly 84.0 87.5 85.7
Groups where at least 25 per cent of the members are aware of audit done in
the group
8.0 4.2 6.1
Groups where more than 50 per cent of the members are aware of the points
mentioned in agenda
8.0 4.2 6.1
Groups which discussed other issues beyond savings and internal loaning in
more than 3 meetings
12.0 4.2 8.2
Groups where audits have been done at least once in 6 months 68.0 58.3 63.3
Source: Field survey, 2005 Figure 1. Distribution of poor (share) and the number of SHGs across Indian States
y = 0.1916x + 2.6063
R2 = 0.1572
0
10
20
30
0 5 10 15 20 25 30 35 Share of SHG (number)
Share of Poor
Share of Poor Linear (Share of Poor)

Figure 2. Scatter plot of change in the income of the SHG member and that of other
members in the family
y = 0.0882x + 5519.4
R2 = 0.042-20000
-10000
0
10000
20000
30000
40000
50000
-150000 -100000 -50000 0 50000 100000 150000 200000
Change in Income of Non-Members of SHG Family
Ch
ang
e in
In
com
e o
f M
emb
ers
Figure 3. Scatter plot of change in the income per capita of the SHG member and that of
other members in the family
y = 0.1521x + 1236.7R2 = 0.1156
-5000
0
5000
10000
15000
20000
-40000 -30000 -20000 -10000 0 10000 20000 30000 40000 50000 60000
Change in per capita Income of Non-Members of SHG Family
Ch
ang
e in
Per
Cap
ita
Inco
me
of
Mem
ber
s

Figure 4. Change in Land holding pattern
0
5
10
15
20
25
0 5 10 15 20 25
Land Holding Before Joining SHG (Acre)
Cu
rren
t L
and
Ho
ldin
g (
Acr
e)
Figure 5. Change in Assets Holding Pattern
0
100000
200000
300000
400000
500000
600000
0 100000 200000 300000 400000 500000 600000
Holding Before Joining SHG (INR)
Cu
rren
t H
old
ing
(IN
R)

Appendix I: Sample Summary
District/ Village Name of SHG Sample SHG Population
Details
No. of Interviews
Project Name Total no. of Members
No. of Absentee Members
No. of members sharing same kitchen
No. of Members in BPL List
Dehradun
Fatehpur Tanda Adarsh 12 SGSY 17 2 4 5
Fatehpur Tanda Govind Ram 4 SGSY 16 3 3 2
Fatehpur Tanda Lupin Kalpana 5 SWASHAKTI 14 4 4 1
Bhaniyawala Mahima Bhagirathi 10 SGSY 14 3 5 5
Bhaniyawala Sandhiya Bhagirathi 11 SGSY 18 2 4 6
Jolly Grant Milan Bhagirathi 5 SGSY 16 2 3 4
Jolly Grant Surkanda Bhagirathi 10 SGSY 17 5 5 7
Jolly Grant Vardhan Prearna 10 SGSY 15 11 4 6
Jolly Grant Vardan Shakti 9 SGSY 16 3 3 4
Jolly Grant Vardan Navodaya 10 SGSY 18 4 5 3
Shergarh Amarjyoti 10 NABARD 17 5 6 0
Shergarh Jyoti Bindu 7 NABARD 16 3 5 0
Gumaniwala Lupin Vikash 10 SGSY 15 4 5 4
District Total 113 209 51 56 47
Almora
Bakh Swaymju 6 SGSY 17 5 4 4
Gar Jyoti 5 SWASHAKTI 17 4 3 0
District Total 11 34 9 7 4
Pithoragarh
Gurmali Balichand 8 SWASHAKTI 16 1 4 0
Dungari Chugga 12 SWASHAKTI 15 5 3 0
Dungari Goril 8 SWASHAKTI 18 4 4 0
Dungari Jayanti 12 SWASHAKTI 16 3 5 3
Naini Goril 10 SWASHAKTI 18 6 3 2
Pukhora Jagril 9 SWASHAKTI 17 3 4 1
Dharpaurauli Jayanti 16 SWASHAKTI 16 4 3 2
Suraun Bhagawti 9 SWASHAKTI 15 2 3 1
Surgaon Jai Bhole Nath 9 SWASHAKTI 18 5 3 2
Birkhan Gar Devi 11 SWASHAKTI 15 5 3 0
Askora Chugga 11 SWASHAKTI 16 5 3 0
Uriari Watelshwar 12 SWASHAKTI 15 2 3 0
Dola Durga 10 SWASHAKTI 17 3 4 0
Bhandariyan Laxmi 10 SWASHAKTI 16 5 5 0
Naret Paewati 6 SWASHAKTI 15 3 3 0
Lamra Batelshwar 11 SWASHAKTI 18 4 4 0
Chonki Khandernath 8 SWASHAKTI 16 2 3 0
District Total 172 277 62 60 11
296 520 122 123 62