Catalytic distillation and hydrogenation of heavy unsaturates in an

The University of Maine The University of Maine
DigitalCommons@UMaine DigitalCommons@UMaine
Honors College
Spring 5-2020
Selectivity of the Catalytic Hydrogenation of Cinnamaldehyde Selectivity of the Catalytic Hydrogenation of Cinnamaldehyde
Using a Polymer Cross-Linked Catalyst Using a Polymer Cross-Linked Catalyst
Madeline Logan
Follow this and additional works at: https://digitalcommons.library.umaine.edu/honors
Part of the Chemical Engineering Commons
This Honors Thesis is brought to you for free and open access by DigitalCommons@UMaine. It has been accepted for inclusion in Honors College by an authorized administrator of DigitalCommons@UMaine. For more information, please contact [email protected].
SELECTIVITY OF THE CATALYTIC HYDROGENATION OF
CINNAMALDEHYDE USING A POLYMER CROSS-LINKED CATALYST
by
Madeline Logan
A Thesis Submitted to Partial Fulfillment of the Requirements for a Degree with Honors
(Chemical Engineering)
The Honors College
The University of Maine
May 2020
Advisory Committee: Thomas Schwartz, Assistant Professor of Chemical Engineering, Advisor
William DeSisto, Professor of Chemical Engineering William Gramlich, Associate Professor of Chemistry Mark Haggerty, Rezendes Preceptor for Civic Engagement in the Honors College M. Clayton Wheeler, Professor of Chemical Engineering

ABSTRACT
The transition from non-renewable fossil fuel chemical feedstocks to bio-renewable
chemical feedstocks will be vital for the health of the environment. The current processing
and use of fossil fuels produced by the petroleum industry release greenhouse gasses like
carbon dioxide into the air causing heat to get trapped in the atmosphere. If greenhouse gas
emissions continue at the rate they are now it is expected to cause polar ice caps to melt,
ocean levels to rise, and climate all over the globe to change. By switching to bio-renewable
feedstocks, the level of greenhouse gasses emitted would drastically decrease because
processing renewable resources is nearly carbon neutral, meaning there would be no
additional carbon dioxide output than what was already present in the plants and trees from
which the renewable resources were sourced from.
Some of the major challenges surrounding conversion of bio-renewable resources
are finding efficient ways to mass produce the chemical building blocks, prevention of
catalyst deactivation due to biogenic impurities like sulfur containing amino acids and
selective conversion of compounds containing α,β-unsaturated aldehydes to their
respective unsaturated alcohols. Some of the way’s researchers have been trying to
overcome these challenges have been by synthesizing heterogeneous catalysts using new
approaches to get them to perform more selectively. One possible method is synthesizing
multi-metal catalysts. Multi-metal catalysts have been proven to increase catalytic activity
as well as increase reaction rate, making them of interest for the conversion of biomass.
Another possible method is by introducing a polymer microenvironment to the surface of
the catalyst to act as a “solid solvent”. This microenvironment has been proven to decrease
catalyst deactivation due to biogenic impurities as well as restrict access to the catalyst’s
active sites causing a shift in catalyst selectivity.
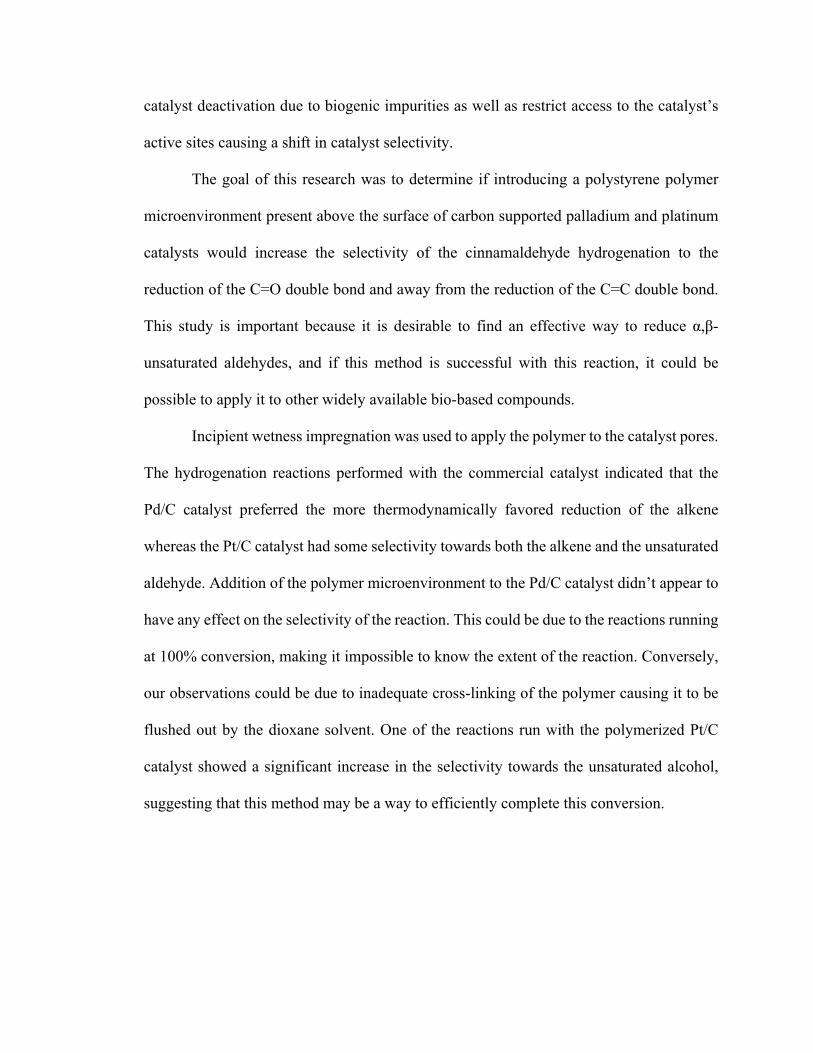
The goal of this research was to determine if introducing a polystyrene polymer
microenvironment present above the surface of carbon supported palladium and platinum
catalysts would increase the selectivity of the cinnamaldehyde hydrogenation to the
reduction of the C=O double bond and away from the reduction of the C=C double bond.
This study is important because it is desirable to find an effective way to reduce α,β-
unsaturated aldehydes, and if this method is successful with this reaction, it could be
possible to apply it to other widely available bio-based compounds.
Incipient wetness impregnation was used to apply the polymer to the catalyst pores.
The hydrogenation reactions performed with the commercial catalyst indicated that the
Pd/C catalyst preferred the more thermodynamically favored reduction of the alkene
whereas the Pt/C catalyst had some selectivity towards both the alkene and the unsaturated
aldehyde. Addition of the polymer microenvironment to the Pd/C catalyst didn’t appear to
have any effect on the selectivity of the reaction. This could be due to the reactions running
at 100% conversion, making it impossible to know the extent of the reaction. Conversely,
our observations could be due to inadequate cross-linking of the polymer causing it to be
flushed out by the dioxane solvent. One of the reactions run with the polymerized Pt/C
catalyst showed a significant increase in the selectivity towards the unsaturated alcohol,
suggesting that this method may be a way to efficiently complete this conversion.

iv
ACKNOWLEDGEMENTS
I would first like to thank my advisor Tom Schwartz for agreeing to help me along
my honors thesis journey and for his patience with me while I juggled this project with my
other degree related responsibilities. Without his help, none of this would have been
possible. I would also like to thank one of Dr. Schwartz’s graduate students Elnaz
Jamalzade for the many hours she spent training me in the lab and helping me when my
calculations didn’t make sense. Our weekly check-ins were a great help to me throughout
this entire project. Another big thanks are due to all of Dr. Schwartz’s graduate students
for giving me a helpful hand in the lab when I couldn’t find what I was looking for and for
welcoming me into the group.
Thank you to my thesis committee for agreeing to participate in my defense with a
special thanks to Dr. Gramlich for meeting with Dr. Schwartz and I to provide knowledge
into the world of polymers and polymerization. I would like to thank the rest of my
committee for their involvement in my undergraduate career, the faculty and staff of
UMaine are what make this campus great.
A very special thanks to my Dad for teaching me the lessons that couldn’t be taught
in school, and for always believing in me (even when I didn’t).
Finally, I would like to thank the entire Chemical Engineering Department and the
Pulp and Paper Foundation for all the support they have provided to myself and my peers.
I can say with absolute certainty, I would not be the engineer I am today without their help.

v
TABLE OF CONTENTS
INTRODUCTION .............................................................................................................. 1
I. Transition from Fossil Fuels to Biofuels ..................................................................... 1
II. Catalytic Hydrogenation Reactions ............................................................................ 5
Homogenous Catalysis ............................................................................................... 6
Heterogeneous Catalysis ............................................................................................. 7
III. Polymer Microenvironments .................................................................................... 8
Polymers ..................................................................................................................... 8
Polymers and Catalysts ............................................................................................. 10
Microenvironments Increasing Recyclability ........................................................... 11
Microenvironments Preventing Deactivation ........................................................... 12
Microenvironments Altering Selectivity .................................................................. 14
IV. Cinnamaldehyde and its Derivatives ...................................................................... 15
Cinnamaldehyde ....................................................................................................... 15
Hydrocinnamaldehyde .............................................................................................. 18
Phenyl Propanol ........................................................................................................ 19
Cinnamyl Alcohol ..................................................................................................... 20
Hydrogenation of Cinnamaldehyde .......................................................................... 22
General Selectivity using Pd/C ................................................................................. 23
General Selectivity using Pt/C .................................................................................. 24
Selective Hydrogenation ........................................................................................... 25
Justification for Work ................................................................................................... 26
vi
METHODS ....................................................................................................................... 27
Materials ....................................................................................................................... 27
Equipment ..................................................................................................................... 27
Preparation of GC Standards ........................................................................................ 28
Hydrogenation Reaction Procedure .............................................................................. 28
Preparation of GC Samples ........................................................................................... 29
Obtaining Data from the GC ......................................................................................... 29
Determination of the Incipient Wetness Point .............................................................. 30
Incipient Wetness Impregnation Catalyst Preparation Method .................................... 31
Wet Impregnation Catalyst Preparation Method .......................................................... 31
RESULTS AND DISCUSSION ....................................................................................... 33
CONCLUSION ................................................................................................................. 42
FUTURE WORK .............................................................................................................. 43
REFERENCES ................................................................................................................. 45
APPENDIX ....................................................................................................................... 49
Wetness Point Sample Calculation ............................................................................... 49
Monomer Solution Masses of Compounds Sample Calculation .................................. 49
Conversion Sample Calculation .................................................................................... 50
Selectivity Sample Calculation ..................................................................................... 50
Sample Calculation of Product Concentration .............................................................. 52
AUTHOR’S BIOGRAPHY .............................................................................................. 53

vii
LIST OF FIGURES
Figure 1: Reaction Energy Diagram for Hydrogenation Reaction12 ................................... 5
Figure 2: Catalytic Hydrogenation Mechanism12 ............................................................... 6
Figure 3: General Radical Polymerization Steps Using a Peroxide Initiator17 ................... 8
Figure 4: Initiation of AIBN18 ........................................................................................... 10
Figure 5: Copolymerization of Styrene and Divinylbenzene19 ......................................... 10
Figure 6: Triacetic Acid Lactone Compound ................................................................... 13
Figure 7: Cinnamaldehyde compound30 ........................................................................... 16
Figure 8: Base Catalyzed Adol Reaction .......................................................................... 17
Figure 9: Base Catalyzed Dehydration Reaction .............................................................. 17
Figure 10: Hydrocinnamaldehyde compound35 ................................................................ 18
Figure 11: Hydrogenation of Cinnamaldehyde in the Presence of Iron to Produce Hydrocinnamaldehye ........................................................................................................ 19
Figure 12: Phenyl Propanol Compound35 ......................................................................... 19
Figure 13: Cinnamaldehyde to Hydrocinnamaldehyde to Phenyl Propanol ..................... 20
Figure 14: Cinnamaldehyde to Cinnamyl Alcohol to Phenyl Propanol ........................... 20
Figure 15: Cinnamyl Alcohol Compound35 ...................................................................... 21
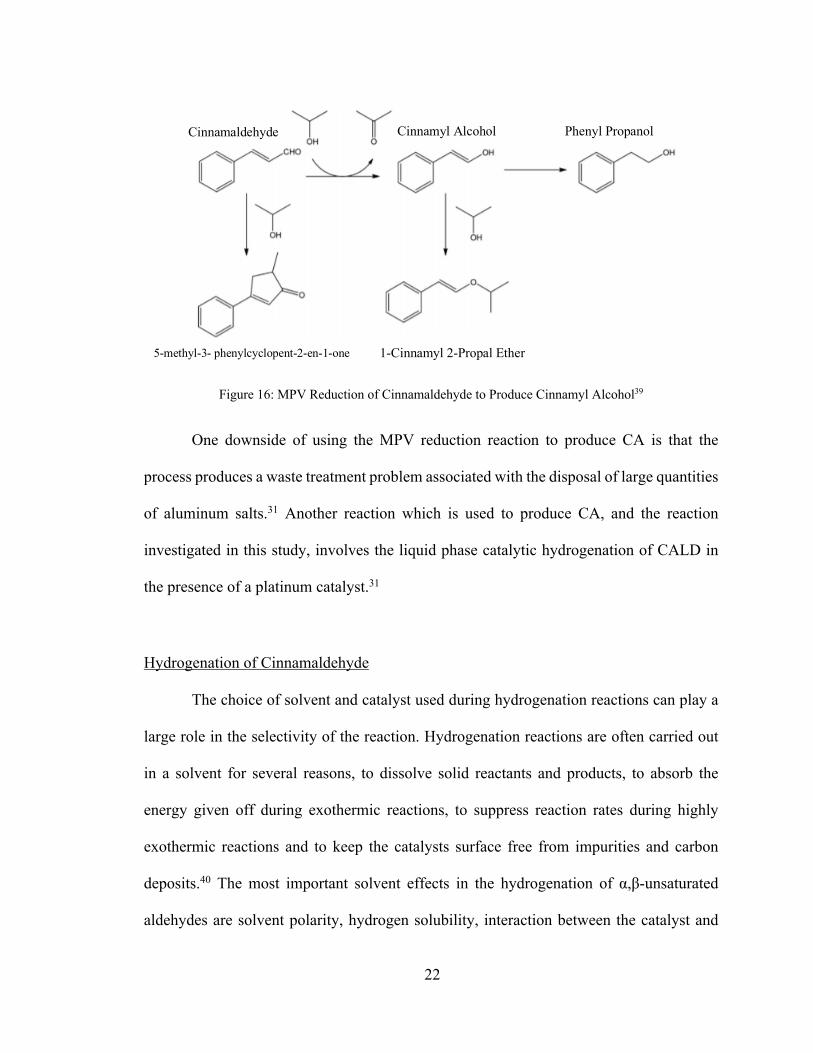
Figure 16: MPV Reduction of Cinnamaldehyde to Produce Cinnamyl Alcohol39 ........... 22
Figure 17: Calibration Curves Used for Product Concentration Calculation ................... 51

viii
LIST OF TABLES
Table 1: Base Case Reaction Conditions .......................................................................... 34
Table 2: Incipient Wetness Point and Time ...................................................................... 35
Table 3: Masses for the Monomer Solutions .................................................................... 36
Table 4: Reaction Conditions with the Catalysts Polymerized using Incipient Wetness Impregnation ..................................................................................................................... 36
Table 5: Reaction Conditions with the Solid Polymerized Catalyst Reactions ................ 37
Table 6: Reaction Conditions for the Pd/POF Catalyst Reaction ..................................... 38
Table 7: Hydrogenation Reaction Selectivity with Palladium Catalysts Results ............. 39
Table 8: Hydrogenation Reaction Selectivity with Platinum Catalysts Results ............... 41
Table 9: Incipient Wetness Point Raw Data ..................................................................... 49
1
INTRODUCTION
I. Transition from Fossil Fuels to Biofuels
Studies of global climate change and its causes have become increasingly more
important over the last several years. Most energy produced in the world is derived from
burning fossil fuels like coal and crude oil. Fossil fuels have been the primary source of
energy because of its abundance and low cost. Carbon dioxide is a greenhouse gas that is
naturally present in the atmosphere and it is absorbed by many natural processes like plant
respiration. Carbon dioxide and other greenhouse gasses are also released by burning fossil
fuels. Since the industrial revolution, mankind has increased the concentration of carbon
dioxide in the atmosphere by three-fold. This increase of carbon dioxide concentration is
believed to be one of the main causes of global climate change which is being witnessed
all over the world. Increasing the amount of greenhouse gasses creates a heat-trapping
effect in the atmosphere which can increase the ocean temperature causing glaciers to melt
which in turn causes an increase in the sea level. The singular act which would vastly
decrease the amount of carbon dioxide being released into the atmosphere would be
transitioning from fossil fuels to renewable biomass to produce the world’s energy.
Over the last few decades researchers all around the world have been trying to find
economical ways to process biomass to be used in both the petrochemical and chemical
industries. The U.S has taken special interest in research of biorefining because the country
no longer wants to depend on foreign and politically unstable sources of nonrenewable
carbon like coal and crude oil.1 For over 120 years technological advancements in
feedstock conversion and processing technologies has optimized the processing of fossil
fuel based carbon. During the refining of crude oil to produce transportation fuels, light

2
hydrocarbon by-products are produced which are too volatile to be used in the fuels. The
need to process these by-products sparked the inception of the chemical industry known
today. The light hydrocarbons are processed by thermal cracking to form ethylene and
propylene, which, along with benzene, are the three primary building blocks of many of
the industrial chemicals produced today.2
For the successful transition from fossil fuels to bio renewable sources it will be
important follow the same platform chemical approach like seen in the current petroleum
industry which produces the building blocks ethylene and propylene. In this approach a
small number of chemical intermediates must first be produced which could then be
converted using either a biological process or a chemical conversion to produce a large
number of desired chemical products.2 In addition to following the platform chemical
approach it will be important to isolate specific biologically derived compounds which
could act as a functional replacement for certain petrochemicals. Functional replacement
of existing petrochemicals has the advantage of providing an opportunity to introduce a
new chemical species into the market which could both replace and extend current
chemical products into new applications.2
Renewable carbon sources are of great abundance, and can come from agricultural
waste, aquatic plants, trees and animal waste, making them an ideal feedstock for energy
production as well as other industrial feed stocks. Processes which use biomass are nearly
carbon dioxide neutral because at the end of the product’s life cycle, the biobased products
release no more carbon dioxide than was originally introduced to the system when it was
grown.3 Another benefit of using biomass as a carbon source is the ability to use
biotechnology to alter the structure of the plants to provide specific intermediates or to

3
increase the production of specifically useful compounds.4 The use of biomass in the
chemical industry also supports green chemistry, which is the design of chemical products
and processes to reduce the use and generation of hazardous substances.5 Because the
environmental advantages of replacing nonrenewable carbon sources with biomass based
carbon sources are endless it is vital that the U.S makes this transition.
One of the challenges of using biomass feedstocks in the chemical industry is the
presence of impurities in the biological feedstocks which can negatively impact the
chemical processes in which they are used. One example is the presence of sulfur-
containing amino acids which poison palladium and ruthenium catalysts causing
deactivation of the catalyst.6 Several research groups in the U.S have been working to
optimize the catalysts which are used in the chemical conversions of biological materials
to try to combat some of the known issues with conversion of biomass. One promising way
to optimize heterogenous catalysts during chemical conversion is to use an organic polymer
to create an microenvironment that surrounds the catalytically active sites of the catalyst.7
Research has shown that a polymer microenvironment can alter the surface properties,8
increase recyclability9 and also prevent deactivation of supported metal heterogeneous
catalysts.7 This shows that it could be a viable method to improve biomass conversion
technology.
The chemical conversion studied in this thesis will be the catalytic hydrogenation
of the biological compound cinnamaldehyde. Cinnamaldehyde has an aromatic ring bound
to an α,β-unsaturated aldehyde. The selective hydrogenation of the unsaturated aldehyde
to its corresponding allylic alcohol (cinnamyl alcohol in this case) is important in both the
chemical and the pharmaceutical industries due to their prevalence in many common
4
compounds. Unsaturated aldehydes contain two functionalities which can be
hydrogenated, the C=C double bond whose hydrogenation leads to saturated aldehydes and
an aldehyde whose reduction leads to unsaturated alcohols.10 Generally, the reduction of
the C=C double bond is more thermodynamically favorable than the hydrogenation of the
C=O double bond making the selective hydrogenation of α,β-unsaturated aldehydes a
challenging task. The goal of this thesis was to determine if introducing a polymer
microenvironment to the catalysts used during the hydrogenation of cinnamaldehyde could
increase the selectivity of the reaction towards the reduction of the C=O double bond and
away from the more thermodynamically favored C=C double bond.
Successful selective hydrogenation of cinnamaldehyde would be important for a
few reasons. The biggest reason would be because if the catalysts with the polymer
microenvironment are able to achieve selective hydrogenation of cinnamaldehyde, it could
act as a pseudo reaction, meaning it likely be used in the hydrogenation of other compounds
with similar structures. This would mean that it could be possible to use the same principles
to hydrogenate other unsaturated aldehydes containing compounds into their associated
unsaturated alcohol. Not only could polymer microenvironments improve feasibility of
hydrogenation reactions, but it could also improve the selectivity of many other catalyzed
reactions. If it is possible to alter the selectivity of chemical reactions it would be possible
to transition from using nonrenewable resources to biomass resources in the chemical and
pharmaceutical industries. This would be a significant step in reducing the amount of
carbon dioxide released into the atmosphere.
5
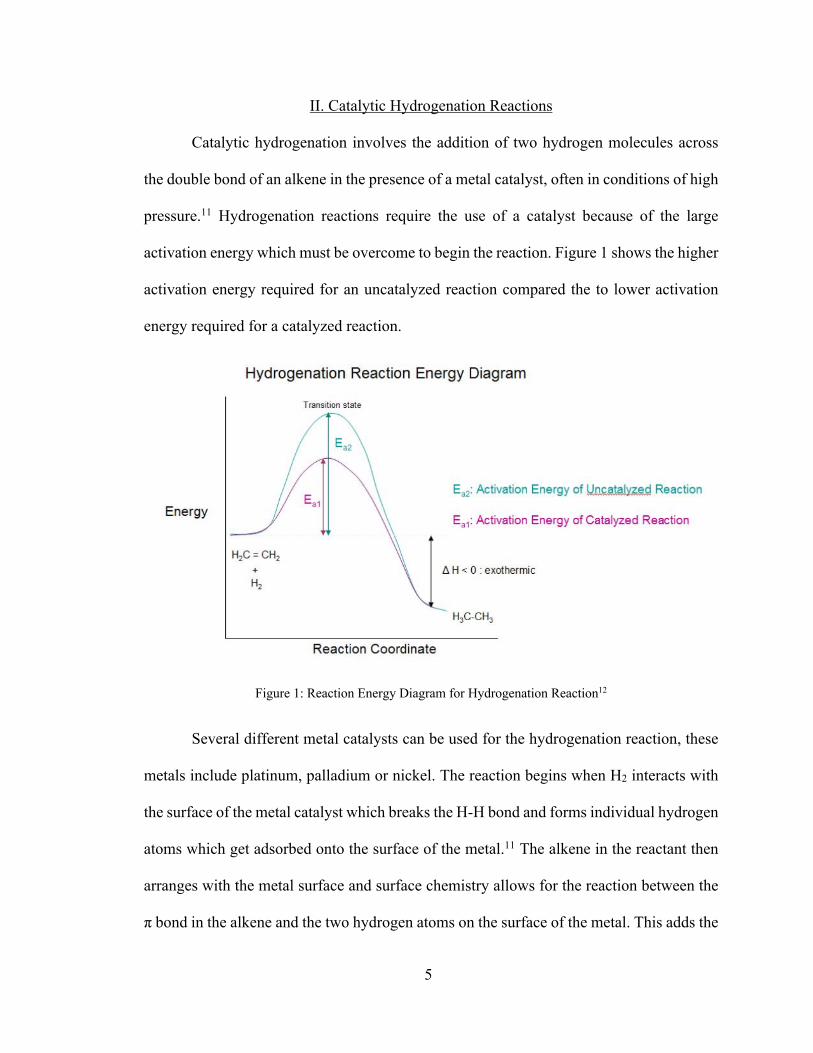
II. Catalytic Hydrogenation Reactions
Catalytic hydrogenation involves the addition of two hydrogen molecules across
the double bond of an alkene in the presence of a metal catalyst, often in conditions of high
pressure.11 Hydrogenation reactions require the use of a catalyst because of the large
activation energy which must be overcome to begin the reaction. Figure 1 shows the higher
activation energy required for an uncatalyzed reaction compared the to lower activation
energy required for a catalyzed reaction.
Figure 1: Reaction Energy Diagram for Hydrogenation Reaction12
Several different metal catalysts can be used for the hydrogenation reaction, these
metals include platinum, palladium or nickel. The reaction begins when H2 interacts with
the surface of the metal catalyst which breaks the H-H bond and forms individual hydrogen
atoms which get adsorbed onto the surface of the metal.11 The alkene in the reactant then
arranges with the metal surface and surface chemistry allows for the reaction between the
π bond in the alkene and the two hydrogen atoms on the surface of the metal. This adds the

6
two hydrogen atoms to the carbon on either end of the alkene. Figure 2 shows the
mechanism for a catalytic hydrogenation reaction.
Figure 2: Catalytic Hydrogenation Mechanism12
Homogenous Catalysis
Homogeneous catalysis is a reaction which occurs with a catalyst which is in the
same phase as the reactants. The biggest advantage of homogeneous catalysts is that they
can tend to be more selective for certain types of reactions.13 These catalysts are often used
for chiral reactions where the stereochemistry is important, like the synthesis of
pharmaceuticals. Some examples of widely used homogeneous catalysis processes are acid
catalysis, organometallic catalysis and enzymatic catalysis.
The major downside to homogeneous catalysis is that it can be difficult to separate
the catalyst from the reaction solution. Often separation would require a distillation
column. This forms a problem when separating certain catalysts because the temperature
needed for distillation could destroy the catalyst making it unusable. This disadvantage
causes increased cost of the process due to not being able to recycle the catalyst and to the
cost of disposing of waste materials.

7
Heterogeneous Catalysis
Heterogeneous catalysis is a reaction which occurs with a catalyst which is in a
different phase than the reactant solution. Typically, the catalyst is a solid and the reactants
can either be gasses or liquids. The major advantage of this method is that it is easy to
separate and recycle the catalyst by using filtration. This is a very important factor for
industrial manufacturing processes which need large amounts of expensive catalysts for
their reactions. One limitation of heterogeneous catalysis has to do with the available
surface area of the catalyst. The surface of the catalyst can become completely saturated
with the reactant, preventing access to the active sites and slowing or even stopping the
reaction until the products leave the surface to make space for additional reactants. 13
An example of a heterogeneous catalyst is a supported metal catalyst. The active
component of many catalysts is a supported metal like platinum, palladium or nickel. Since
only the surface of the metal is available to catalyze a reaction, catalysts are normally
prepared to maximize the metal surface area for a given weight of metal.14 Catalysts are
usually prepared by using small metal crystallites of the desired metal and attaching them
to a thermally stable, high surface area support like alumina, silica or carbon.14 The most
common preparation methods are impregnation, ion-exchange, adsorption and deposition-
precipitation.15 Another important reason to use a support is they physically separate the
small metal crystallites preventing them from clumping together into larger crystallites
which would decrease the overall effective surface area of the catalyst.16 The different
preparation methods to make supported metal catalysts will not be reviewed in this study.

8
III. Polymer Microenvironments
Polymers
Polymers are synthesized by polymerization of monomer subunits. One type of
polymerization is called radical polymerization. There are three main phases during this
process. Figure 3 shows a general radical polymerization using peroxide as an initiator.
Phase one is initiation. During initiation an initiator like a peroxide is heated to produce
two carbon free radicals (1). An initiator is required for this step because monomers are
stabilized to prevent unwanted polymerization while in storage. Initiators provide a source
of free radicals that are needed for the propagation step and when added at a high enough
concentration, they increase the rate of polymerization. Phase two is called the propagation
step. During this step, the carbon free radicals react with the alkene in the monomers to
form more free radicals (2) which again react with the monomers to create a chain (3). This
step continues to repeat, adding monomer after monomer to the chain. Phase 3, the final
phase, is called termination. During termination, two free radicals couple together to form
the final, stable polymer (4).11
Figure 3: General Radical Polymerization Steps Using a Peroxide Initiator17
(1)
(2)
(3)
(4)

9
The polymer used in this study is was a styrene/divinylbenzene copolymer. A
copolymer is a polymer which is made with more than one species of monomer. This
copolymer was polymerized using the monomers styrene and divinylbenzene and the
initiator azobisisobutyronitrile (AIBN). The addition of the divinylbenzene to the monomer
solution allowed for cross-linking to occur. Cross-linking is when covalent bonds are
formed to connect polymer chains to each other. The more divinylbenzene added to the
polymer solution, the greater the degree of cross-linking and the greater the degree of cross-
linking, the more rigid and stiff the polymer becomes. The goal of this polymerization was
to produce a rigid polymer with a high degree of cross-linking to prevent the solvent from
extracting the polymer from the catalyst during the hydrogenation reaction.
Figure 4 shows the initiation of AIBN during the initiation step of the radical
polymerization of a styrene/divinylbenzene copolymer. During this phase, the N=N double
bond turns into a triple bond which releases the two carbon radicals on either side of it.
Figure 5 shows the general copolymerization of styrene and divinylbenzene. This figure
shows that the styrene monomers polymerize to create polystyrene chains which then get
cross-linked to each other using the divinylbenzene monomers to create a multi-chain
system. The higher the concentration of divinylbenzene in the monomer solution, the more
places that the polystyrene chains could be connected.

10
Figure 4: Initiation of AIBN18
Figure 5: Copolymerization of Styrene and Divinylbenzene19
Polymers and Catalysts
The recent research around chemical conversion of biomass feedstocks has
prompted the need to improve the economics of catalytic reactions. One area which has
been readily studied in the last several years is the introduction of a polymer
microenvironment to the surface and the pores of catalysts. A polymer microenvironment
is essentially a polymer or copolymer compound which is cross-linked within the pores of
the catalyst. The addition of polymers to catalysts has been shown to alter the surface
properties,8 increase recyclability by immobilizing metal based catalysts,9 prevent
deactivation of supported metal catalysts7 and even control selectivity by restricting access
to the catalysts active sites,8 which is the topic of this study.
One way to apply the polymer to the pores of the catalyst is the process called
incipient wetness impregnation. During this process, the metal catalyst is slowly treated
Styrene
Divinylbenzene
AIBN
11
with the exact volume of polymer solution needed to fill the pores of the catalyst. During
the addition, capillary action pulls the polymer solution into the pores. Once the total
volume of polymer solution is added to the catalyst it is left to polymerize (oftentimes it is
heated to speed up the polymerization process). When done correctly, there shouldn’t be
an obvious difference in appearance of the catalyst and the polymer should coat the walls
of the catalytic pores.
Microenvironments Increasing Recyclability
When investigating catalyst recyclability researchers struggled to find ways to
synthesize heterogenous catalysts which wouldn’t leach, and which provided adequate
activity. Catalyst leaching occurs when the conditions used during catalysis reactions
(temperature, pressure and choice in solvent) causes the bonds between the metal catalyst
and its support to break causing them to separate, rendering the catalyst unusable. This
phenomenon is detrimental to both the economics and the environmental impact of the
process. One promising method to prevent catalyst leaching is the process of
microencapsulation. Microencapsulation was first introduced in 1998 as a way to coat and
isolate substances until their activity was needed and it was studied vastly for its
applications in the pharmaceutical industry.20 It’s use in catalysis is as a technique to
immobilize catalysts onto polymer supports. In this process, catalysts would be physically
enveloped by thin films of polymers (typically polystyrene derivatives) which would
immobilize the catalyst due to the interaction between the π electrons of the benzene rings
in the polystyrene backbone and the vacant orbitals of the catalysts.9 This new type of
heterogenous catalysts were named “microencapsulated catalysts”. Microencapsulated
12
catalysts prevent catalyst leaching by increasing the strength of the interactions between
the metal and the support making it more difficult for reaction conditions to impact the
recyclability of the catalyst. Another advantage to microencapsulated catalysts is that,
unlike other processes that were studied to address this issue, it does not negatively affect
the activity of the catalyst (in some cases it even improved it).9
Microenvironments Preventing Deactivation
There are two main forms of chemical deactivation which can cause a catalyst to
become ineffective. Catalyst poisoning is when there is a loss of catalytic activity due to
the absorption of impurities at the catalyst’s active sites. Poisons are substances like sulfur
or lead which interact very strongly and irreversibly with the catalyst’s active sites. Catalyst
inhibitors also cause a loss of catalytic activity which is due to the absorption of inhibitors
that have weak interactions. The difference between poisons and inhibitors is that poisons
are irreversible, and inhibitors can often be reversed. One major issue when trying to
convert bio-renewable feedstock sources is the presence of biogenic impurities like sulfur
containing amino acids. The hydrogenation of triacetic acid lactone (TAL) is of chemical
importance because it produces the intermediates necessary to produce sorbic acid which
is used as a food preservative (see Figure 6). The palladium catalysts used for the
hydrogenation are easily deactivated and irreversibly poisoned by amino acids and sulfur
containing amino acids present as biogenic impurities in TAL feedstock. Deactivation of
the catalyst can also occur via carbon deposition which is when carbon compounds
decompose and clog the pores of the catalyst. Carbon deposition is common when
upgrading highly functionalized and reactive species like TAL. Complex separation

13
processes could be implemented to try to filter biogenic impurities out of the reaction
solution to prevent catalyst poisoning, but these processes are expensive.
Figure 6: Triacetic Acid Lactone Compound
There are two topics that have been studied by researchers to reduce the
deactivation of catalysts during chemical conversions. One way is creating and
implementing a multi metal catalyst and the other way is by adding a polymer
microenvironment to the catalyst. Synthesizing a multi-metal catalyst can be an effective
way to prevent deactivation. The first two steps during the conversion of TAL to sorbic
acid are hydrogenation reactions. When the hydrogenation is completed using an aluminum
oxide supported palladium catalyst, deactivation of the catalyst occurs over time due to
carbon deposition. When gold nanoparticles are added to the palladium catalyst and used
in the hydrogenation, the deactivation due to carbon deposition is eliminated.7 For the
production of sorbic acid, a multi-metal catalyst is effective at preventing catalyst
deactivation due to carbon deposition however it is still subject to deactivation due to
poisoning from biogenic impurities.
Addition of a polymer microenvironment to a catalyst is an effective way to prevent
catalyst deactivation due to biogenic impurities during hydrogenation reactions. Many of
the biogenic impurities which cause deactivation contain polar functional groups while bio-
renewable feedstocks like TAL are often less polar.7 The difference in polarity can be used
Triacetic Acid Lactone Sorbic Acid

14
when picking the polymer coating for the catalyst to create a microenvironment that is
unfavorable for polar species. For example, for the hydrogenation of TAL, polyvinyl
alcohol (PVA) was the chosen polymer because TAL is highly soluble in alcohols while
amino acids are not. A polymer coating on a catalyst can act as a “pseudo solvent” or a
“solid solvent” which suppresses the access of biogenic impurities while still allowing
access of the reactants to the catalytic active sites therefore reducing catalyst deactivation.7
When the multi-metal palladium/gold catalyst which was developed to prevent
deactivation from carbon deposition, was overcoated with PVA the catalyst was found to
have improved tolerance towards biogenic impurities.7 The combination of a multi-metal
catalyst and a polymer microenvironment has been proven to be a viable way to efficiently
and selectively convert biologically derived platform species with little catalyst
deactivation.
Microenvironments Altering Selectivity
Polymer microenvironments have been found to be efficient in improving the
selectivity of a chemical conversion towards a more desirable product. Research completed
by Ricardo Alamillo and colleagues8 used Polyvinylpyrrolidone (PVP) as a polar aprotic
polymer microenvironment to increase the selectivity of the dehydration reaction of
fructose to produce the possible biological platform chemical 5-hydroxymethylfurfural
(HMF). Prior to Alamillo’s research, conversion of fructose to HMF was only possible in
water, but the yields were low. Both methods require difficult separation which decrease
yield of HMF making the conversion expensive and inefficient. Results of this study
showed that the addition of the PVP polymer to the catalyst achieved selectivity levels like
15
those of the other two methods of preparation. Unlike the other two preparation methods
of HMF, the PVP polymer coated solid catalyst can be easily separated from the reaction
products, and the product can be easily separated from the low boiling, single phase solvent
system.8
Polystyrene (PS) was chosen for the polymer microenvironment to be used for the
hydrogenation of cinnamaldehyde because like the aromatic ring and the alkene in the
cinnamaldehyde compound, it is nonpolar. This suggests that the PS pseudo solvent could
bring both the aromatic ring and the alkene into solution with the solid polymer solvent
leaving just the aldehyde to interact with the active site of the catalyst. If this were to
happen, it would increase the selectivity of the reaction towards cinnamyl alcohol and away
from hydrocinnamaldehyde. Like previously stated, altering the selectivity of the reaction
towards the unsaturated aldehyde to produce its respective unsaturated alcohol is an area
of research of great importance for the viability of conversion of biologically derived
feedstocks.
IV. Cinnamaldehyde and its Derivatives
Cinnamaldehyde
3-Phenyl-2-propenal, also known as cinnamaldehyde (CALD) is a naturally
occurring compound found in the bark of the Chinese Cinnamon and the Ceylon Cinnamon
trees which grow primarily in Indonesia.21 CALD is a yellow liquid at room temperature
with the sweet smell of cinnamon which is extracted from the essential oils of the tree’s
bark using distillation.21 The compound contains an aromatic ring with an α,β-unsaturated
aldehyde (see Figure 7). The most common use of CALD is in cooking and baking

16
applications as well as in the fragrance industry.21 However, research has shown that
treatment for diabetes,22 use as antifungal agents,23,24 antimicrobial agents25,26, antiviral
agents27, anticancer agents28, and antioxidant agents,29 are some of the many other
applications for CALD.
Figure 7: Cinnamaldehyde compound30
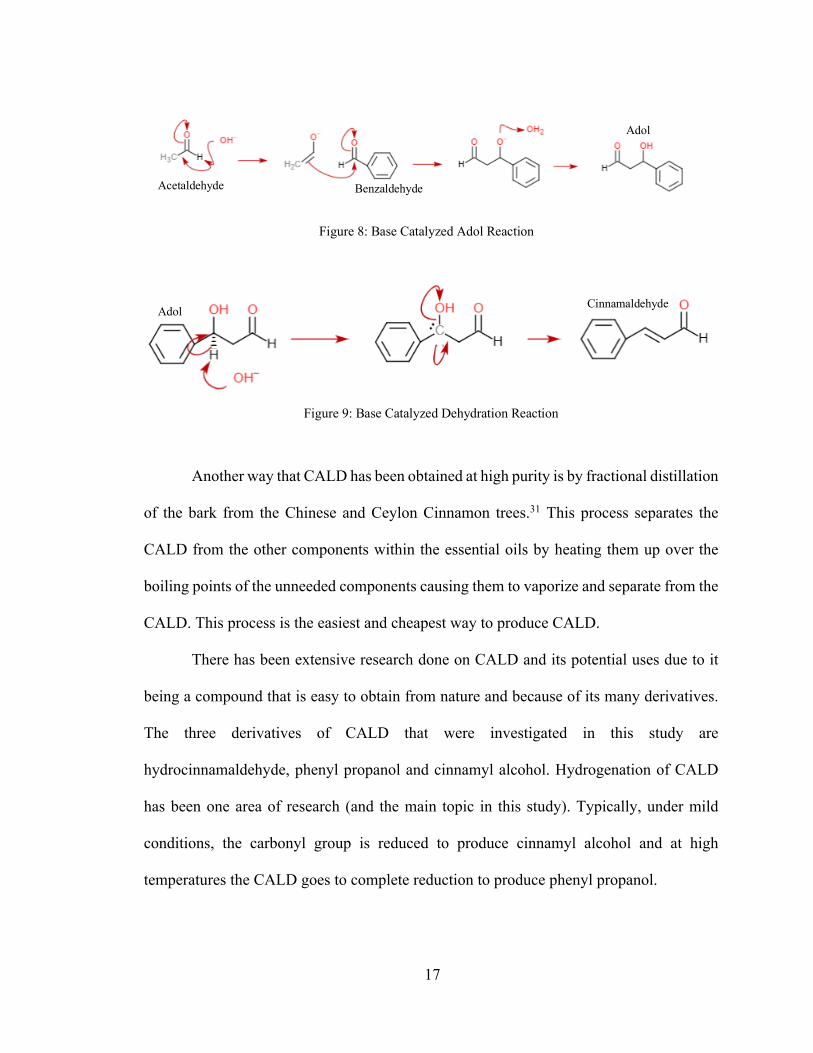
The main industrial process used to produce CALD is the base-catalyzed aldol
addition of benzaldehyde with acetaldehyde.31 The industrial process is carried out in the
presence of a dilute sodium hydroxide solution with at least two equivalents of
benzaldehyde.31 About 80% yield of CALD can be achieved by slowly adding
acetaldehyde to benzaldehyde at around 70°C.32 This process beings by using the sodium
hydroxide base to catalyze an adol reaction between the acetaldehyde and benzaldehyde to
produce an adol (see Figure 8). Then the same base catalyzes the dehydration of the alcohol
which was created in the first step to produce the C=C double bond in the cinnamaldehyde
compound (see Figure 9).
17
Another way that CALD has been obtained at high purity is by fractional distillation
of the bark from the Chinese and Ceylon Cinnamon trees.31 This process separates the
CALD from the other components within the essential oils by heating them up over the
boiling points of the unneeded components causing them to vaporize and separate from the
CALD. This process is the easiest and cheapest way to produce CALD.
There has been extensive research done on CALD and its potential uses due to it
being a compound that is easy to obtain from nature and because of its many derivatives.
The three derivatives of CALD that were investigated in this study are
hydrocinnamaldehyde, phenyl propanol and cinnamyl alcohol. Hydrogenation of CALD
has been one area of research (and the main topic in this study). Typically, under mild
conditions, the carbonyl group is reduced to produce cinnamyl alcohol and at high
temperatures the CALD goes to complete reduction to produce phenyl propanol.
Acetaldehyde Benzaldehyde
Adol
Figure 8: Base Catalyzed Adol Reaction
Adol Cinnamaldehyde
Figure 9: Base Catalyzed Dehydration Reaction

18
Hydrocinnamaldehyde
3-Phenylpropionaldehyde, also known as hydrocinnamaldehyde (HCALD), is a
derivative of CALD. The compound is a light-yellow liquid at room temperature with a
similar cinnamon scent as its CALD predecessor.33 The C=C double bond in CALD gets
hydrogenated to produce HCALD which has an aromatic ring with a saturated aldehyde
(see Figure10). HCALD has been found to be an important intermediate compound in the
production of several pharmaceutical drugs, one which is used in the treatment of HIV.34
Figure 10: Hydrocinnamaldehyde compound35
The current way to produce HCALD is the hydrogenation of CALD. The challenge
with this reaction is increasing the selectivity towards the HCALD compound. One
possible way to increase the selectivity of the hydrogenation reaction towards HCALD is
to run the reaction using a palladium catalyst in the presence of iron. The iron can be on
the same support as the palladium catalyst or iron salt could be mixed in the reagent
solution, both options produced similar selectivity results.36 This process was able to
produce 100% selectivity towards HCALD when the hydrogenation was run near room
temperature in either a batch or a continuous process.36 Figure 11 shows the hydrogenation
reaction of CALD which was completed in the presence of iron(II) chloride to produce
HCALD.

19
Phenyl Propanol
3-Phenyl-1-Propanol, or phenyl propanol (PP), is a derivative of CALD. PP is a
white powder at room temperature which dissolves easily in solvent.37 The C=C double
bond in CALD gets hydrogenated to produce HCALD. Then the C=O double bond in the
aldehyde of HCALD gets hydrogenated to produce a saturated alcohol connected to the
aromatic ring (see Figure 12). PP is used as a fragrance ingredient in cosmetic products
such as perfumes, shampoos, and soaps and in non-cosmetic products like household
cleaners and detergents.37
Figure 12: Phenyl Propanol Compound35
PP is produced when CALD is fully hydrogenated. This can follow one of two
pathways. Figure 13 shows the full hydrogenation of CALD via the HCALD compound to
produce PP. Figure 14 shows the full hydrogenation of CALD via the cinnamyl alcohol
compound to produce PP. Both reaction pathways can occur with any catalyst used during
the hydrogenation if the reaction is run long enough, with enough excess hydrogen gas.
+ H2 Pd
FeCl2
Cinnamalde Hydrocinnamaldehyde
Figure 11: Hydrogenation of Cinnamaldehyde in the Presence of Iron to Produce Hydrocinnamaldehye

20
Cinnamyl Alcohol
3-Phenyl-2-propen-1-ol, or cinnamyl alcohol (CA), is a derivative of CALD. CA is
a colorless solid with a sweet hyacinth smell.31 It can be found in nature in hyacinth
absolute, the essential oil from the hyacinth flower, in the leaves and bark of the cinnamon
tree, and in Guava fruit.31 The unsaturated aldehyde of the CALD compound gets
hydrogenated to produce CA which is an aromatic ring with an unsaturated alcohol group
(see Figure 15). CA is the cinnamaldehyde derivative with the most industrial importance
and is used widely in the fragrance industry, as a food flavoring, in the production of
photosensitive polymers, in the creation of inks for printing, in the formulation for animal
repellents and in the development of insect attractants.31 It is also an important raw material
and intermediate in medicine and in the production processes of other fine chemicals.
Cinnamaldehyde Hydrocinnamaldehyde Phenyl Propanol
+ H2 + H2
Figure 13: Cinnamaldehyde to Hydrocinnamaldehyde to Phenyl Propanol
Cinnamaldehyde Phenyl Propanol Cinnamyl Alcohol
+ H2 + H2
Figure 14: Cinnamaldehyde to Cinnamyl Alcohol to Phenyl Propanol

21
Figure 15: Cinnamyl Alcohol Compound35
Production of CA is very important due to its wide array of industrial applications.
CA was mainly prepared industrially using a borohydride reaction with a homogenous
catalyst.38 While this process successfully produced CA, it had two significant downsides:
it is very difficult to separate the catalyst from the reaction products, and the catalyst often
lost activity making it impossible to recycle.38 Lack of recyclability makes the process both
expensive and a detriment to the environment. One process which has been preferred over
the previous borohydride reduction is the Meerwein-Ponndorf-Verley reduction (MPV).31
This reaction is the reduction of aldehydes and ketones to their corresponding alcohols by
using a heterogeneous catalyst like aluminum alkoxide in the presence of an alcohol. In a
typical MPV process, CALD is dissolved in 2-propanol which contains aluminum
isopropoxide. During this reaction the 2-propanol is oxidized to form acetone which is then
removed continuously at reflux, and CALD is selectively reduced to CALD.39 Lastly,
purification of the end product yields up to 90% cinnamyl alcohol.31 Figure 16 shows the
reaction scheme of the MPV reduction of CALD to produce CA as well as some other
possible side products which could be produced during the reduction.
22
Figure 16: MPV Reduction of Cinnamaldehyde to Produce Cinnamyl Alcohol39
One downside of using the MPV reduction reaction to produce CA is that the
process produces a waste treatment problem associated with the disposal of large quantities
of aluminum salts.31 Another reaction which is used to produce CA, and the reaction
investigated in this study, involves the liquid phase catalytic hydrogenation of CALD in
the presence of a platinum catalyst.31
Hydrogenation of Cinnamaldehyde
The choice of solvent and catalyst used during hydrogenation reactions can play a
large role in the selectivity of the reaction. Hydrogenation reactions are often carried out
in a solvent for several reasons, to dissolve solid reactants and products, to absorb the
energy given off during exothermic reactions, to suppress reaction rates during highly
exothermic reactions and to keep the catalysts surface free from impurities and carbon
deposits.40 The most important solvent effects in the hydrogenation of α,β-unsaturated
aldehydes are solvent polarity, hydrogen solubility, interaction between the catalyst and
Cinnamaldehyde Cinnamyl Alcohol Phenyl Propanol
5-methyl-3- phenylcyclopent-2-en-1-one 1-Cinnamyl 2-Propal Ether

23
the solvent as well as solvation of reactants in the bulk liquid phase.34 A non-polar solvent
like toluene used during the hydrogenation of CALD over a palladium catalyst efficiently
produces HCALD while a polar solvent like acetone was less effective because it had the
tendency to produce diacetals.41 When designing reaction conditions it is vital to pick a
solvent and a catalyst system which would favor the desired products. The polar solvent
dioxane and the metal catalysts palladium and platinum on carbon (Pd/C and Pt/C) were
used for the reactions carried out in this study. Both catalysts were studied to see if either
one (or both) would be affected by the addition of the carbon microenvironment to its
surface. Differences in catalyst activities and resulting reaction selectivity’s may be due to
the geometry of the catalytic sites as well as an influence of the size of the metal particles.42
Reaction selectivity is not only affected by solvent and catalyst choice, it can also be
affected by reaction conditions like temperature and pressure as well as the choice in
catalyst support.
General Selectivity using Pd/C
Hydrogenation of CALD over a palladium catalyst is typically used when trying to
reduce the C=C double bond to produce HCALD. Research by Tomasz Szumelda and
colleagues studied a CALD hydrogenation reaction over Pd/C catalyst and the effect of
adding gold (Au) nanoparticles to the catalyst.43 The first reaction investigated used Pd/C
and the non-polar solvent toluene which achieved 100% conversion of CALD after 45
minutes when it was run at 1 bar hydrogen pressure at 22 ˚C in an agitated batch reactor.
Over 45 minutes, this reaction had HCALD selectivity ranging from 60 to 70%, CA
selectivity ranging from 22 to 30% and PP selectivity ranging from 7 to 8%. This research

24
found that under the specific reaction conditions the Pd/C catalyst favored the HCALD
product, it also found that running the reaction beyond 45 minutes, caused an increase in
PP and a decrease in both HCALD and CA.
General Selectivity using Pt/C
Hydrogenation of CALD over a platinum metal catalyst is typically used when
trying to reduce the C=O double bond to produce CA. Research by Arnaldo B. da Silva
and colleagues investigated the effect of metal support interaction during the selective
hydrogenation of CALD to CA using platinum based metallic and bimetallic catalysts.42 In
this study the hydrogenation reaction used the polar solvent isopropanol and was run at 60
˚C and 400 bars in a stirred Parr reactor. They found that the Pt/C catalyst deactivated after
280 minutes after only about 50% CALD conversion. The cause of the catalyst deactivation
was suspected to be due to the strong adsorption of HCALD inhibiting the absorption of
CA. After reacting for 280 minutes, the selectivity of CA was slightly higher than that of
the Pd/C catalyst at 32%, the selectivity of HCALD was 50% and the selectivity PP was
17%. This study was not effective at proving the fact that Pt/C catalysts tend towards the
production of CA. Some possible reasons for the failure of high CA selectivity could be
due to the deactivation of the catalyst or due to the choice of solvent and reaction
conditions. A better example of Pt/C catalysts tending towards the CA product was studied
by Nagendranath Mahata and colleagues.10 This study ran a hydrogenation reaction over
Pt/C in a stirred batch reactor at 16 bar hydrogen and 75 ˚C with the non-polar solvent
cyclohexane to avoid the formation of acetals. After 12 hours the CALD conversion was
45%, the selectivity of CA was 42%, HCALD was 45% and PP was 13%. Mahata and

25
colleagues’ research illustrated that the Pt/C catalyst has a higher selectivity of CA at lower
conversion of CALD than the use of a Pd/C catalyst.
Selective Hydrogenation
In addition to the selection of the reaction conditions, the solvent, the supported
catalyst, and the use of polymer microenvironments, the use of multi-metal catalysts has
been a proven way to alter the selectivity of hydrogenation reactions. The hydrogenation
reaction over the Pd/C catalyst studied by Tomasz Szumelda and colleagues ran an
additional reaction under the same conditions with the addition of Au to the catalyst.43 The
CALD hydrogenation over the multi-metal catalyst PdAu/C reduced the selectivity
preference of the reaction from the reduction of the C=C double bond towards the reduction
of the C=O double bond when the Au:Pd ratio was greater than 1. The selectivity towards
CA increased from about 30% to nearly 60% and the selectivity towards HCALD
decreased from 65% to only 40%. Addition of iron (Fe), a second metallic nanoparticle to
the Pt/C catalyst used in Arnaldo B. da Silva and colleagues research showed nearly 7 times
the catalytic activity and much better selectivity towards CA than the original Pt/C
reaction.42 The CALD hydrogenation over PtFe/C reached 50% conversion after only 40
minutes and the selectivity of CA increased from 32% to 76% while the selectivity of
HCALD decreased from 50% to 5%. Both aforementioned studies illustrated the benefit of
using a bimetallic catalyst during the production of CA via catalytic hydrogenation.

26
Justification for Work
The major goal of this study was to see if the addition of the polystyrene polymer
microenvironment to the surface of carbon supported palladium and platinum catalysts
could enable the polymer to act as a solid solvent and direct selectivity of the hydrogenation
of cinnamaldehyde. The polymer polystyrene was chosen for this research because of the
aromatic rings present in both the polymer and the cinnamaldehyde compound. The
similarity in the chemical structures can cause the polymer to act as a pseudo solvent by
bringing the aromatic ring in the cinnamaldehyde compound into solution with the
aromatic rings within the polystyrene coating. This solvation can cause the
cinnamaldehyde compound to stabilize within the polymer and arrange itself in a way to
improve selectivity towards the hydrogenation of the unsaturated aldehyde. Should this
phenomenon occur, the addition of specific polymer microenvironments to metal catalysts
could be applied to other catalytic reactions to allow for the ability of altering reactions
towards the more valuable products.
27
METHODS
Materials
Trans-cinnamaldehyde (CALD), 3-phenyl-1-propanol (PP), 3-phenyl-2propen-1-ol
(CA) and 3-phenylpropionaldehyde (HCALD) were acquired from Acros Organic. CALD
was kept refrigerated when it was not being used. 1,4 Dioxane and Toluene were acquired
from Acros Organics. 2-tert-butylphenol (TBP) was acquired and used as an internal
standard. Styrene and 1,1’-azobis(cyclohexanecarbonitrile) (AIBN) were acquired from
Sigma Aldrich, and divinylbenzene (DVB) was acquired from Alfa Aesar. Styrene, AIBN
and DVB were kept refrigerated when not in use. Palladium, 5% on carbon powder, type
490 was acquired from Alfa Aesar and Platinum, 1% on carbon powder was acquired from
Acros Organics. Palladium 3% on porous organic framework (POF) was prepared
according to the procedure described by Andrew Riscoe et al. (2019)44 and was graciously
provided by Prof. Matteo Cargnello of Stanford University.
Equipment
An Agilent 7820 gas chromatograph coupled to a 5973 mass selective detector
(GC-MS) and an Agilent 7820 gas chromatograph with flame ionization detector (GC-FID)
were used for the identification of compounds in the reaction products and for calculation
of compound concentrations, respectively. All hydrogenation reactions were run in a 50
mL Parr autoclave reactor. Reaction temperatures were controlled by a PID temperature
controller (Automation Direct). The reactions took place in the reaction vessel over a
hotplate and magnetic stirrer. A hot oil bath was used during the polymerization, a vacuum
filter and oven were used to dry polymerized catalysts and filter reaction products and

28
benchtop balances were used to weigh compounds. The procedures for the processes listed
above are yet to come.
Preparation of GC Standards
Standards for CALD, HCALD, PP and CA were needed to analyze GC-FID data.
Each standard contained an internal standard to attain a ratio between the concentration of
the sample and the concentration of the IS. First, four standards with increasing
concentrations were created for CALD by adding 0.26, 0.52, 0.78 and 1.04 grams of CALD
to 5 milliliters of dioxane in individual vials. This produced CALD solutions with
concentrations of 52, 104, 156 and 208 grams per liter. Next, 50 microliters of each of the
four concentrations were added to individual vials and mixed with 10 microliters of the
TBP internal standard and 1 milliliter of dioxane. This process was repeated three times
additional times for the HCALD, PP and CA standards.
Hydrogenation Reaction Procedure
The hydrogenation reaction was completed in the 50 mL Parr autoclave reactor.
The reactant solution was prepared by mixing about 500 milligrams of CALD with about
22 grams of dioxane and adding them to the reactor vessel. Then a stir bar and the Pd/C or
Pt/C catalyst was weighed and added to the reactor vessel. The reactor vessel was then
placed on the hot plate, sealed and the stir bar was turned on to 600 rotations per minute.
Next, the reaction vessel was purged seven times with an inert gas, either argon or nitrogen
depending on which was available, and the seal was inspected for leaks by coating the seal
in soap and looking for bubbles. After determining that the vessel was properly sealed, it

29
was purged three times with hydrogen gas and then filled with hydrogen at a pressure of
40 bar. Lastly, the temperature controller was set to heat the reaction from room
temperature to 40 ˚C over ten minutes, from 40 ˚C to 80 ˚C over fifteen minutes and run at
80 ˚C until the specified reaction time at which point the heating element turned off and
the reaction cooled down to room temperature. Once the reactor cooled to room
temperature, the temperature controller was turned off, the hydrogen was released from the
reactor and the products and catalyst was removed from the reaction vessel.
Preparation of GC Samples
All products from the hydrogenation reactions were prepared the same way. The
product/catalyst mixture was first filtered using the vacuum filtration. The filtered catalyst
was disposed of and the remaining product solution was filtered a second time using
syringe filters to ensure no solid particulates. 5 milliliters of filtered product were added to
a vial and mixed with 100 microliters of IS. Lastly, 100 microliters of the IS containing
sample was mixed with 100 microliters of dioxane and added to a GC vial.
.
Obtaining Data from the GC
The prepared GC samples were run through the GC-MS so that the products
produced could be identified. The GC application was used to determine the identity of the
products present in the sample. The samples were also run in the GC-FID. The GC-FID
results provided the area under the peaks of the compounds present in the product sample
as well as the area under the peak of the IS which, when used in conjunction with the

30
previously prepared standards, allowed for the calculation of the concentrations of the
compounds in the reaction products
Determination of the Incipient Wetness Point
The incipient wetness point was calculated for both the Pd/C catalyst and the Pt/C
catalyst to determine the necessary volume of the monomer solution for the incipient
wetness impregnation of the polymer into the catalyst pores. The wetness point was found
by first weighing out an amount of catalyst in a bowl and an amount of toluene in a vial
(toluene was used because it is volatile like styrene). Then a timer was started, and toluene
was added to the catalyst using a pipette until the point when the texture of the catalyst was
analogous to not-quite-wet sand. At that point, the timer was stopped, and the total time
was recorded, and the vial of toluene was weighed again. The time period that the toluene
was added to the catalyst was recorded so that when the incipient wetness impregnation
was completed, the styrene could be added over the same amount of time to account for
any material which may have volatilized during the calculation of the incipient wetness
point. The wetness point was calculated by dividing the difference in the mass of the
toluene vial before and after the addition to the catalyst by the initial mass of the catalyst.
This process was completed several times to get an average wetness point value. This value
gives the mass of polymer solution that is needed per gram of catalyst. This process was
completed for the Pd/C and the Pt/C catalysts.

31
Incipient Wetness Impregnation Catalyst Preparation Method
The monomer solution was prepared by mixing 0.05 weight percent AIBN, 35
weight percent DVB and 64.95 weight percent styrene. The ratio of compounds was
determined from research on the glass transition temperature of polystyrene completed by
T. S. Ellis et al in 1983.19 The weight percent of DVB was the highest tested in the study,
this percent was chosen to increase the amount of polymer cross-linking during the
polymerization. Once the monomer solution was created, the incipient wetness point for
each catalyst was used to calculate the amount of the solution which needed to be added to
5 grams of the catalyst. The desired monomer solution was added over the amount of time
which was recorded when finding the incipient wetness point to account for any solution
which may have volatilized during that time. After addition of the required volume of
monomer solution, the mixture was placed in a hot oil bath at 60 ˚C for 48 hours. After 48
hours, the catalyst was removed from the oil bath, washed with dioxane and then deionized
water and dried in the oven before it was ready to be used in a hydrogenation reaction.
Wet Impregnation Catalyst Preparation Method
The monomer solution was prepared using the same compound ratios as stated in
the previous method. For this polymerization, 1 gram of each of the catalysts were added
to 5 grams of the monomer solution. The submerged catalysts were polymerized in the hot
oil bath at 60 ˚C for 48 hours. After 48 hours, the solution became a translucent solid
material which had the black catalyst suspended inside. To remove both polymer/catalyst
mixtures from the flasks tetrahydrofuran (THF) was added to help loosen the mixture from

32
the surface of the glass. The mixtures were scraped out of the flasks and crushed using a
mortar and pestle.
33
RESULTS AND DISCUSSION
The first eight reactions which were ran were “base case” reactions to get an initial
idea of the selectivity of the Pt/C and Pd/C catalyst and to determine running conditions
needed to achieve the desired conversion. The two reaction variables which were adjusted
were the mass of catalyst and the reaction time. Reaction temperature, pressure and amount
of the CALD and the solvent remained the same. There were four series of base case
reactions completed for each catalyst. Table 1 indicates the reaction conditions for the first
eight reactions. Reactions 1 through 4 were competed using the commercially produced
Pd/C catalyst. The conditions of the first reaction used 100 milligrams of catalyst and had
a reaction time of 4 hours which ran to 100% conversion. In the attempt to reduce the
CALD conversion, reaction 2 was run for one hour less with the same amount of catalyst.
Reaction 2 still had high conversion so the 3rd and 4th reactions were completed, decreasing
both the mass of the catalyst and the length of the reaction. Despite these changes, it was
not possible to achieve a CALD conversion lower than 100% while remaining within the
operating conditions of the reactor, so the running conditions for the Pd/C reaction were
set at 1 hour using 80 milligrams of catalyst.
Reactions 5 through 8 followed the same general thought process as reactions 1
through 4. Reaction 5 was run with 100 milligrams of Pt/C for four hours. Initial conversion
calculations indicated that this reaction had a high CALD conversion, a flaw was found in
these calculations later which indicated that the actual CALD conversion was 70%. To
reduce the supposed high CALD conversion, reactions 7 and 8 were run by reducing the
catalyst loading to 80 milligrams and the reaction time to 3 hours and then 2 hours. The
initial CALD conversion calculations determined that reaction 8 was the ideal running

34
conditions because it produced a CALD conversion near the goal of 80%. A CALD
conversion of 80% was the goal of the base case reactions because it is high enough to
produce measurable concentrations of the products and low enough to prevent a large
amount of the HCALD and CA products to be completely hydrogenated to produce PP. It
is clear after the miscalculation that reaction 8 had a CALD conversion of 42%, which is
lower than the goal but would be enough for this study.
The large difference in CALD conversion between the Pd/C catalyst and the Pt/C
catalyst is due to the difference in metal loading of the catalyst. The Pd/C catalyst had a
palladium loading of 5%, meaning that 5% of the total supported catalyst mass was
palladium metal. However, the platinum loading of the Pt/C catalyst was 1% meaning that
only 1% of the total supported catalyst mass was platinum metal. The metal of the
supported catalysts is the material which contains the catalytic active sites so a higher metal
loading would lead to more active sites and a higher CALD conversion. Another
characterization which could aid in understanding the difference in conversion between the
two catalysts would be the dispersion of the metal catalysts on the carbon support. The data
necessary to calculate the dispersion of the catalysts is unavailable so this metric was not
possible to measure for this study.
Table 1: Base Case Reaction Conditions
Reaction Catalyst CALD Feed
Concentration (g/L)
Catalyst Mass (mg)
Reaction Time (hr)
CALD Conversion
1 Pd/C 23.5 100 4 100 ± 0% 2 Pd/C 23.8 100 3 97 ± 0.2% 3 Pd/C 22.6 80 3 100 ± 0% 4 Pd/C 23.6 80 1 100 ± 0% 5 Pt/C 23.5 100 4 70 ± 1.8% 6 Pt/C 24.1 100 4 56 ± 2.7% 7 Pt/C 22.9 80 3 45 ± 3.3% 8 Pt/C 24.0 80 2 42 ± 5.0%

35
The incipient wetness point of the Pt/C and Pd/C catalysts were found following
the procedure indicated above. Table 2 shows the calculated wetness points of the two
catalysts and the amount of time it took to achieve the point of wetness. A sample
calculation can be found in the Appendix. The average wetness point was used for both
catalysts. The average wetness point for the palladium catalyst was 0.84 grams of solvent
per gram of catalyst which needed to be added over the period of 68 seconds. The average
wetness for the platinum catalyst was 1.06 grams of solvent per gram of catalyst which
needed to be added over the period of 95 seconds. It was important to add the monomer
solution over the average time which was recorded during the calculation of the wetness
points because it accounted for the loss in monomer solution mass due to volatilization.
Table 2: Incipient Wetness Point and Time
Catalyst Wetness Point (g solvent/g catalyst) Time (seconds) Pd/C 0.92 52 Pd/C 0.74 63 Pd/C 0.85 89 Pt/C 1.07 106 Pt/C 1.05 82 Pt/C 1.06 96
Once the average wetness points for each catalyst were determined, incipient
wetness impregnation was completed following the procedure outlined above. See table 3
for the amounts of styrene, AIBN and DVB that were needed to create the necessary
amount of monomer solution for the polymerization. See the Appendix for a sample
calculation using the wetness point to calculate the masses of the compounds. It was
observed that after the 48 hours in the hot oil bath, the catalysts still appeared wet and there
36
was a strong smell of styrene. The catalysts were left under the hood for several hours to
allow some of the excess polymer solution to volatilize.
Table 3: Masses for the Monomer Solutions
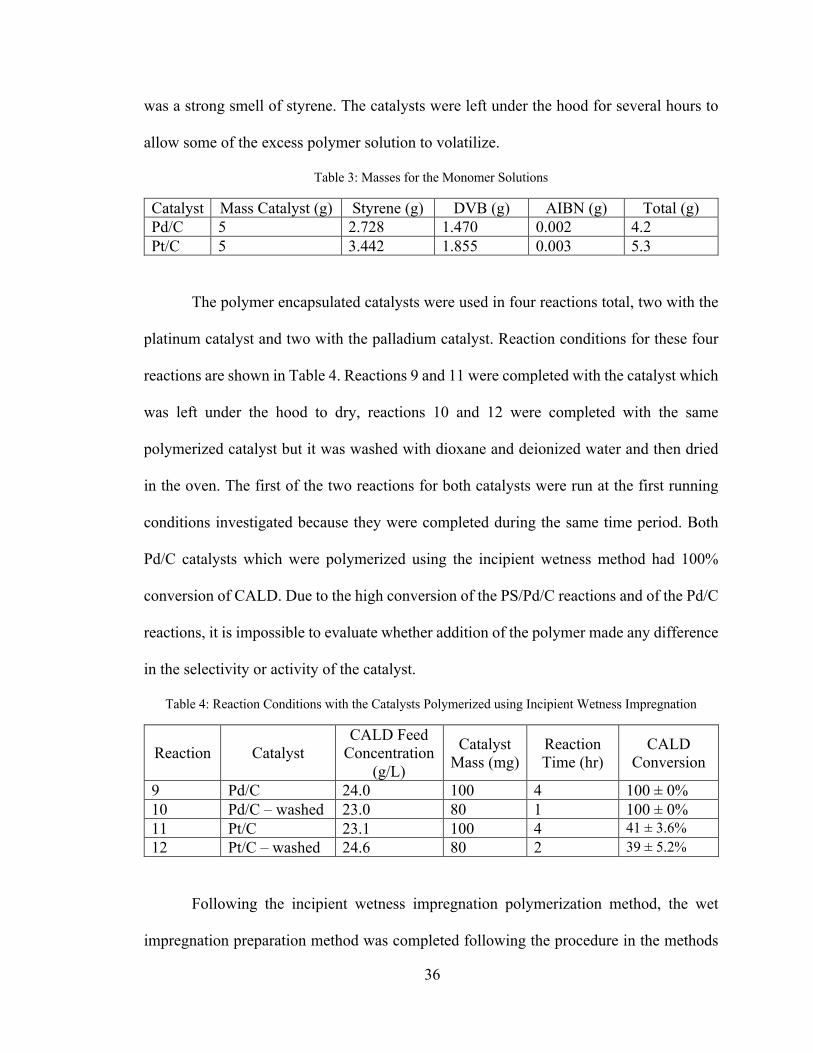
Catalyst Mass Catalyst (g) Styrene (g) DVB (g) AIBN (g) Total (g) Pd/C 5 2.728 1.470 0.002 4.2 Pt/C 5 3.442 1.855 0.003 5.3
The polymer encapsulated catalysts were used in four reactions total, two with the
platinum catalyst and two with the palladium catalyst. Reaction conditions for these four
reactions are shown in Table 4. Reactions 9 and 11 were completed with the catalyst which
was left under the hood to dry, reactions 10 and 12 were completed with the same
polymerized catalyst but it was washed with dioxane and deionized water and then dried
in the oven. The first of the two reactions for both catalysts were run at the first running
conditions investigated because they were completed during the same time period. Both
Pd/C catalysts which were polymerized using the incipient wetness method had 100%
conversion of CALD. Due to the high conversion of the PS/Pd/C reactions and of the Pd/C
reactions, it is impossible to evaluate whether addition of the polymer made any difference
in the selectivity or activity of the catalyst.
Table 4: Reaction Conditions with the Catalysts Polymerized using Incipient Wetness Impregnation
Reaction Catalyst CALD Feed
Concentration (g/L)
Catalyst Mass (mg)
Reaction Time (hr)
CALD Conversion
9 Pd/C 24.0 100 4 100 ± 0% 10 Pd/C – washed 23.0 80 1 100 ± 0% 11 Pt/C 23.1 100 4 41 ± 3.6% 12 Pt/C – washed 24.6 80 2 39 ± 5.2%
Following the incipient wetness impregnation polymerization method, the wet
impregnation preparation method was completed following the procedure in the methods

37
section. Four reactions were run with these catalysts, two for the Pd/C catalyst and two for
the Pt/C catalyst. Table 5 shows the reaction conditions for these four reactions. For the
two Pd/C catalyst reactions the mass of polymerized catalyst was further reduced from 80
milligrams to 50 milligrams as a last effort to decrease CALD conversion. Reactions 13
and 14 indicate a decrease in CALD conversion. This was the only time in the study that
the conversion was able to be reduced below 100% when using the palladium catalyst. This
suggests the addition of the PS polymer to the catalyst altered the activity of the catalyst.
The decrease in catalyst mass from 80 to 50 milligrams and the fact that some of that mass
was taken up by polymer, further reducing the catalyst loading also could have aided in the
decrease of conversion, but it is unlikely that it is the only cause.
Table 5: Reaction Conditions with the Solid Polymerized Catalyst Reactions
Reaction Catalyst CALD Feed Concentration (g/L)
Catalyst Mass (mg)
Reaction Time (hr)
CALD Conversion
13 Pd/C 22.7 50 1 63 ± 3.2% 14 Pd/C 23.1 50 1 70 ± 2.5% 15 Pt/C 24.5 80 2 45 ± 4.7% 16 Pt/C 24.5 80 2 84 ± 1.4%
The final reaction which was run was using a palladium catalyst which was on a
POF support. The catalyst was the subject of a study completed by Andrew Riscoe et al.
(2019) which investigated whether the addition of a polymer microenvironment could
influence the energetics of catalytic oxidation of carbon monoxide.44 This research found
that the addition of the POF to the palladium catalyst had an effect on the oxidation of
carbon monoxide. Because the Pd/POF catalyst had been proven to act differently than that
of a regular Pd/C catalyst, a sample of the catalyst was used for the CALD hydrogenation
to see if the more sophisticated polymer-encapsulated catalyst would have a stronger effect
38
on the selectivity of the reaction than that of the catalysts made in this study. Table 6 shows
the reaction conditions for the reaction run using the Pd/POF catalyst.
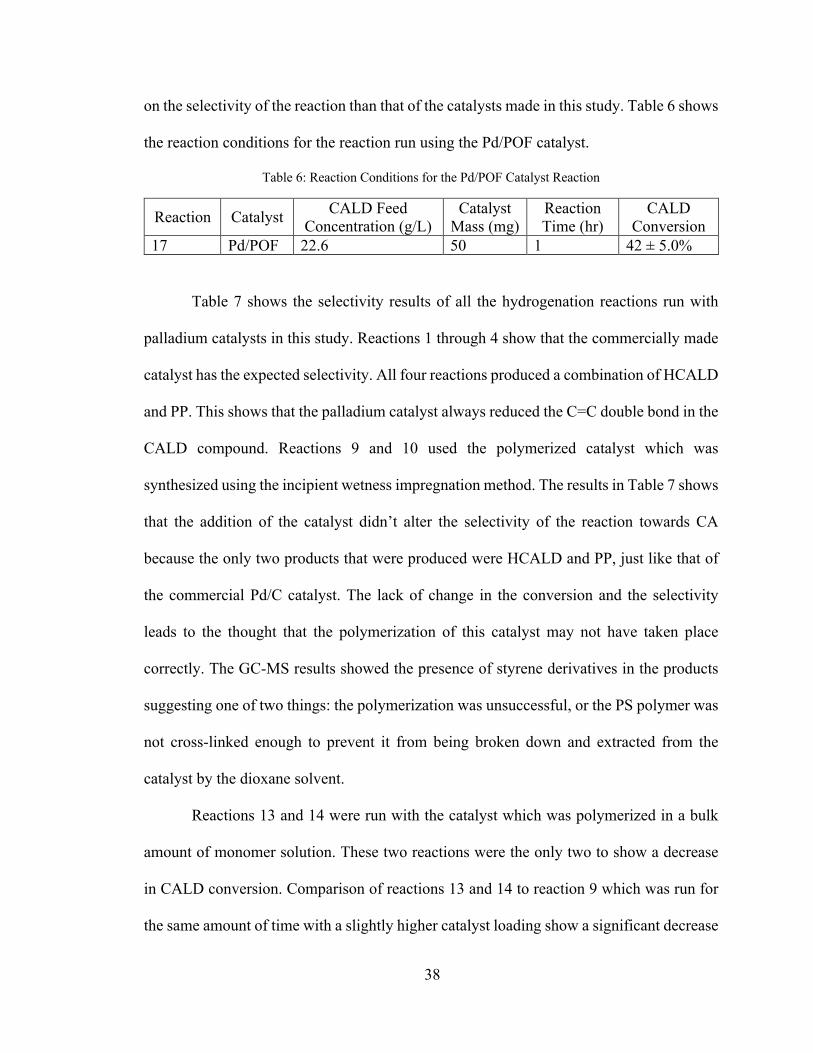
Table 6: Reaction Conditions for the Pd/POF Catalyst Reaction
Reaction Catalyst CALD Feed Concentration (g/L)
Catalyst Mass (mg)
Reaction Time (hr)
CALD Conversion
17 Pd/POF 22.6 50 1 42 ± 5.0%
Table 7 shows the selectivity results of all the hydrogenation reactions run with
palladium catalysts in this study. Reactions 1 through 4 show that the commercially made
catalyst has the expected selectivity. All four reactions produced a combination of HCALD
and PP. This shows that the palladium catalyst always reduced the C=C double bond in the
CALD compound. Reactions 9 and 10 used the polymerized catalyst which was
synthesized using the incipient wetness impregnation method. The results in Table 7 shows
that the addition of the catalyst didn’t alter the selectivity of the reaction towards CA
because the only two products that were produced were HCALD and PP, just like that of
the commercial Pd/C catalyst. The lack of change in the conversion and the selectivity
leads to the thought that the polymerization of this catalyst may not have taken place
correctly. The GC-MS results showed the presence of styrene derivatives in the products
suggesting one of two things: the polymerization was unsuccessful, or the PS polymer was
not cross-linked enough to prevent it from being broken down and extracted from the
catalyst by the dioxane solvent.
Reactions 13 and 14 were run with the catalyst which was polymerized in a bulk
amount of monomer solution. These two reactions were the only two to show a decrease
in CALD conversion. Comparison of reactions 13 and 14 to reaction 9 which was run for
the same amount of time with a slightly higher catalyst loading show a significant decrease

39
in conversion and a slight increase of HCALD selectivity. This difference in selectivity is
likely due to the difference in conversion, although there is a possibility that the PS
microenvironment had an effect. Nether of the catalysts polymerized in bulk produced any
CA. Reaction 17 was the reaction run with the Pd/POF catalyst. This catalyst showed lower
conversion than any of the other palladium reactions, however there were no products
produced. One of the major concerns associated with the synthesis of this polymer was the
incorporation of sulfur caused by decomposition of the solvent which was used.44 Sulfur is
a known poison of palladium catalysts and could be the cause of the lack of reaction. The
lack of reaction should suggest that the CALD conversion should be 0%, but it was
observed to be 42%. One possible cause of the difference in conversion could be that during
the reaction, some of the CALD could be trapped within the surface of the catalyst,
preventing the products from diffusing from the catalyst surface and therefore increasing
CALD conversion.
Table 7: Hydrogenation Reaction Selectivity with Palladium Catalysts Results
Reaction Catalyst Conditions Conversion HCALD PP CA 1 Commercial Cat 100 ± 0% 72 ± 2.0% 28 ± 2.0% 0% 2 Commercial Cat 97 ± 0.2% 86 ± 1.0% 14 ± 1.0% 0% 3 Commercial Cat 100 ± 0% 73 ± 2.0% 27 ± 2.0% 0% 4 Commercial Cat 100 ± 0% 91 ± 2.0% 9 ± 2.0% 0% 9 Impregnation Cat 100 ± 0% 82 ± 2.0% 18 ± 2.0% 0% 10 Impregnation Cat - washed 100 ± 0% 92 ± 2.0% 8 ± 2.0% 0% 13 Solid Polymer Cat 63 ± 3.2% 95 ± 1.0% 5 ± 1.0% 0% 14 Solid Polymer Cat 70 ± 2.5% 96 ± 1.0% 4 ± 1.0% 0% 17 Pd/POF Cat 42 ± 5.0% 0% 0% 0%
Table 8 shows the selectivity results of the hydrogenation reactions run using the
platinum catalysts. Reactions 6 through 8 completed with the commercial catalyst followed
similar selectivity to what was expected from the literature. The Pt/C reactions produced

40
HCALD, PP, and CA showing that there was some reduction of both the C=C and the C=O
double bonds. It is expected for the selectivity of HCALD to be higher than that of the CA
because the hydrogenation of the C=C double bond is still thermodynamically favored over
the C=O double bond. The reaction conditions which were able to produce the highest
percent of CA was reaction 6 which was run with 100 milligrams of catalyst for 4 hours.
Reactions 11 and 12 were run with the PS catalyst synthesized using the incipient
wetness impregnation method. These two reactions showed slightly lower conversion than
that of the commercial catalyst run at the same conditions (reaction 8). The unwashed
catalyst used in reaction 11 showed a significant increase in CA selectivity when compared
to reaction 8 at the same reaction conditions. The catalyst used in reaction 12 was washed
before use. This reaction produced selectivity results almost identical to those of the
reaction 8 ran at the same conditions. These results suggest that the initial PS
polymerization was successful in increasing the selectivity towards CA but that washing
the catalyst with dioxane likely removed the PS from the surface of the catalyst causing
catalyst to return it it’s unaltered state. Reactions 15 and 16 were run using the catalyst
which was polymerized in bulk monomer solution. The reaction results in Table 8 show
that there were no products produced but there was an increase in CALD conversion. This
suggests that the addition of the polymer microenvironment in this manner likely trapped
the CALD reactant in the polymer/catalyst surface preventing the products to enter the
solution and therefore increasing the conversion.

41
Table 8: Hydrogenation Reaction Selectivity with Platinum Catalysts Results
Reaction Catalyst Conditions Conversion HCALD PP CA 5 Commercial Cat 70 ± 1.8% 100 ± 0% 0% 0% 6 Commercial Cat 56 ± 2.7% 76 ± 2.0% 8 ± 1.0% 15 ± 1.0% 7 Commercial Cat 45 ± 3.3% 87 ± 1.0% 0% 13 ± 1.0% 8 Commercial Cat 42 ± 5.0% 91 ± 5.0% 2 ± 0% 7 ± 5.0% 11 Impregnation Cat 41 ± 3.6% 80 ± 2.0% 0% 20 ± 2.0% 12 Impregnation Cat - washed 39 ± 5.2% 92 ± 5.0% 2 ± 0% 6 ± 5.0% 15 Solid Polymer Cat 45 ± 4.7% 0% 0% 0% 16 Solid Polymer Cat 84 ± 1.4% 0% 0% 0%

42
CONCLUSION
In conclusion, this study of whether the addition of a polymer microenvironment to
a palladium catalyst can alter the selectivity of the reaction away from the reduction of the
C=C double bond and towards the reduction of the C=O double bond doesn’t lead to
substantial differences in selectivity. The running conditions and CALD concentrations
used for the palladium reactions were not enough to produce a reaction with a CALD
conversion less than 100%. It is hard to analyze reactions run at high conversions because
it makes it impossible to know the extent of the reaction. This study of whether the addition
of a polymer microenvironment to a platinum catalyst could increase the selectivity
towards the unsaturated aldehyde shows some promise. The unwashed PS polymerized
Pt/C catalyst using the incipient wetness impregnation method showed an increase in CA
selectivity of over 10% when compared to the reaction run at the same conditions using
the commercial catalyst. These results suggest that this method is a possible way to
upgrade metal catalysts to improve the selectivity of α,β-unsaturated aldehydes which
would be a vital step in the successful transition from fossil fuel based chemical feedstocks
to bio-renewable chemical feedstocks.

43
FUTURE WORK
Additional research about ways to improve metal catalysts to be more selective
towards the desirable compounds containing unsaturated alcohols will be of great industrial
importance. One area which could be most important to study could be the synthesis of
multi-metal polymer encapsulated catalysts. Multi-metal catalysts on their own have been
proven to have the ability of altering reaction selectivity’s as well as increasing reactant
conversion and rate of reaction. Increasing conversion and reaction rate will aid in the
commercial viability of the catalysts by making the process more efficient. Polymer
microenvironments have been proven to reduce deactivation of catalysts due to biogenic
impurities as well as improve reaction selectivity. The combination of these two types of
catalysts could produce the heterogeneous catalyst necessary to allow for the transition
towards bio-renewable chemical feedstocks. It will take many tries before the ideal
combination of metals and polymers are found which is why it is vital to continue to
research these catalysis topics.
In respect to this thesis, should future work be completed on this project there are
a few things that could be adjusted. The reaction conditions need to be significantly
changed to allow for trustworthy data related to the palladium catalyzed reactions. Using a
catalyst with lower loading and reducing the CALD concentration in the reactant feedstock
are two ways which this could be completed. These changes would be necessary to
accurately evaluate both the selectivity of the commercial catalyst and that of the
polymerized catalyst. The incipient wetness method of PS polymerization was shown to be
the best way to synthesize the polymer encapsulated catalyst. However, with this method,
washing of the catalysts with dioxane seemed to have removed the PS coating. Increasing

44
the amount of DVB in the monomer solution would increase the polymers level of cross-
linking as well as prevent the solvent from stripping the polymer from the catalyst.
Catalyst characterization is something that could have aided in understanding
exactly what was occurring on the surface of the catalyst. Should further work on this
project be done, BET analyses on the polymerized catalysts should be completed. BET
catalyst characterization can be used to evaluate the pore volumes of both the commercial
catalyst and the polymerized catalyst, and the results could be used for comparison. This
would show how much of the catalysts pore volume is taken up by the polymer
microenvironment and would indicate whether the polymerization was successful or not.
Lastly, it would be important to test this theory on other compounds. It is assumed
that if it worked for CALD that it would also work for other compounds with similar
functional groups. Before this theory could be implemented anywhere, it would be
important to test it with a wide variety of compounds to determine optimum catalyst
synthesis and reaction conditions.
45
REFERENCES
1. Bozell JJ. Feedstocks for the future - Biorefinery production of chemicals from renewable carbon. Clean - Soil, Air, Water. 2008;36(8):641-647. doi:10.1002/clen.200800100
2. Nikolau BJ, Perera MADN, Brachova L, Shanks B. Platform biochemicals for a biorenewable chemical industry. Plant J. 2008;54(4):536-545. doi:10.1111/j.1365-313X.2008.03484.x
3. Claassen PAM, Van Lier JB, Lopez Contreras AM, et al. Utilisation of biomass for the supply of energy carriers. Appl Microbiol Biotechnol. 1999;52:741-755.
4. Xu Y, Hanna MA, Isom L. “Green” Chemicals from Renewable Agricultural Biomass - A Mini Review. Open Agric J. 2008;2(1):54-61. doi:10.2174/1874331500802010054
5. Anastas PT, Kirchhoff MM. Origins, Current Status, and Future Challenges of Green Chemistry †. Acc Chem Res. 2002;35(9):686-694. doi:10.1021/ar010065m
6. Schwartz TJ, Brentzel ZJ, Dumesic JA. Inhibition of Metal Hydrogenation Catalysts by Biogenic Impurities. Catal Letters. 2014;145:15-22. doi:10.1007/s10562-014-1441-z
7. Schwartz TJ, Johnson RL, Cardenas J, et al. Engineering catalyst microenvironments for metal-catalyzed hydrogenation of biologically derived platform chemicals. Angew Chemie - Int Ed. 2014;53(47):12718-12722. doi:10.1002/anie.201407615
8. Alamillo R, Crisci AJ, Gallo JMR, Scott SL, Dumesic JA. A tailored microenvironment for catalytic biomass conversion in inorganic-organic nanoreactors. Angew Chemie - Int Ed. 2013;52(39):10349-10351. doi:10.1002/anie.201304693
9. Akiyama R, Kobayashi S. “Microencapsulated” and Related Catalysts for Organic Chemistry and Organic Synthesis. Chem Rev. 2009;109(2):594-642. doi:10.1021/cr800529d
10. Mahata N, Gonçalves F, Fernando M, Pereira R, Figueiredo L. Selective hydrogenation of cinnamaldehyde to cinnamyl alcohol over mesoporous carbon supported Fe and Zn promoted Pt catalyst. Appl Catal. 2008:159-168. doi:10.1016/j.apcata.2008.01.023
11. Klein D. Organic Chemistry. 3rd ed. John Wiley & Sons, Inc.; 2017.
12. Catalytic Hydrogenation of Alkenes . https://chem.libretexts.org/Bookshelves/Organic_Chemistry/Supplemental_Modul

46
es_(Organic_Chemistry)/Alkenes/Reactivity_of_Alkenes/Catalytic_Hydrogenation. Accessed March 23, 2020.
13. Catalysis | Boundless Chemistry. https://courses.lumenlearning.com/boundless-chemistry/chapter/catalysis/. Accessed March 23, 2020.
14. Mehrabadi BAT, Eskandari S, Khan U, White RD, Regalbuto JR. A Review of Preparation Methods for Supported Metal Catalysts. Adv Catal. 2017;61:1-35. doi:10.1016/bs.acat.2017.10.001
15. Campanati M, Fornasari G, Vaccari A. Fundamentals in the preparation of heterogeneous catalysts. Catal Today. 2003;77:299-314.
16. Flynn PC. The Sintering of Supported Metal Catalysts. Catal Rev. 1975;12(1):93-135. doi:10.1080/01614947508067523
17. Free Radical Polymerization. CROW. http://polymerdatabase.com/polymer chemistry/radical polymerization.html. Published 2015. Accessed April 1, 2020.
18. azo compounds. In: IUPAC Compendium of Chemical Terminology. 2.3.3. IUPAC; 2008. doi:10.1351/goldbook.a00560
19. Ellis TS, Karasz FE, Brinke G Ten. The influence of thermal properties on the glass transition temperature in styrene/divinylbenzene network–diluent systems. J Appl Polym Sci. 1983;28(1):23-32. doi:10.1002/app.1983.070280103
20. Kobayashi SJ, Nagayama S. A Microencapsulated Lewis Acid. A New Type of Polymer-Supported Lewis Acid Catalyst of Wide Utility in Organic Synthesis. J Am Chem Soc. 1997;120:2985-2986. https://pubs.acs.org/sharingguidelines. Accessed April 2, 2020.
21. Shreaz S, Wani WA, Behbehani JM, et al. Cinnamaldehyde and its derivatives, a novel class of antifungal agents. Fitoterapia. 2016;112:116-131. doi:10.1016/j.fitote.2016.05.016
22. Subash Babu P, Prabuseenivasan S, Ignacimuthu S. Cinnamaldehydea_potential_anti.PDF. Phytomedicine Int J Phyther Phytopharm. 2006;14(1).
23. Wang S-Y, Chen P-F, Chang S-T. Antifungal activities of essential oils and their constituents from indigenous cinnamon (Cinnamomum osmophloeum) leaves against wood decay fungi. Bioresour Technol. 2004;96:813-818. doi:10.1016/j.biortech.2004.07.010
24. Matan N, Matan N. Effect of Combined Cinnamon and Clove Oil Against Major Moulds Identified from Rubberwood (Hevea brasiliensis). Walailak J Sci Tech. 2007;4(2):165-174.
47
25. Hili P, Evans CS, Veness RG. Antimicrobial action of essential oils: The effect of dimethylsulphoxide on the activity of cinnamon oil. Lett Appl Microbiol. 1997;24(4):269-275. doi:10.1046/j.1472-765X.1997.00073.x
26. Matan N, Rimkeeree H, Mawson AJ, Chompreeda P, Haruthaithanasan V, Parker M. Antimicrobial activity of cinnamon and clove oils under modified atmosphere conditions. Int J Food Microbiol. 2006;107(Matan, N., Rimkeeree, H., Mawson, A. J., Chompreeda, P., Haruthaithanasan, V., Parker, M. (n.d.). Antimicrobial activity of cinnamon and clove oils under modified atmosphere conditions. https://doi.org/10.1016/j.ijfoodmicro.2005.07.007):180-185. doi:10.1016/j.ijfoodmicro.2005.07.007
27. Hayashi K, Imanishi N, Kashiwayama Y, et al. Inhibitory effect of cinnamaldehyde, derived from Cinnamomi cortex, on the growth of influenza A/PR/8 virus in vitro and in vivo. Antiviral Res. 2007;74:1-8. doi:10.1016/j.antiviral.2007.01.003
28. Kwon H-K, Jeon K, Hwang J-S, et al. Cinnamon extract suppresses tumor progression by modulating angiogenesis and the effector function of CD8 + T cells. Cancer Lett. 278:174-182. doi:10.1016/j.canlet.2009.01.015
29. Suryanti V, Wibowo FR, Khotijah S, Andalucki N. Antioxidant Activities of Cinnamaldehyde Derivatives. IOP Conf Ser Mater Sci Eng. 2017;333(1). doi:10.1088/1757-899X/333/1/012077
30. Zhu R, Liu H, Liu C, et al. Review Cinnamaldehyde in diabetes: A review of pharmacology, pharmacokinetics and safety. Pharmacol Res. 2017;122:78-89. doi:10.1016/j.phrs.2017.05.019
31. Eilerman RG, Staff U by. Cinnamic Acid, Cinnamaldehyde, and Cinnamyl Alcohol. Kirk-Othmer Encycl Chem Technol. 2014:1-11. doi:10.1002/0471238961.0309141405091205.a01.pub2
32. Richmond HH. PREPARATION OF CINNAMALDEHYDE. November 1950.
33. Nagpure AS, Gurrala L, Gogoi P, Chilukuri S V. Hydrogenation of cinnamaldehyde to hydrocinnamaldehyde over Pd nanoparticles deposited on nitrogen-doped mesoporous carbon †. RSC Adv. 2016;6(50):44333-44340. doi:10.1039/c6ra04154j
34. Mäki-Arvela P, Hájek J, Salmi T, Murzin DY. Chemoselective hydrogenation of carbonyl compounds over heterogeneous catalysts. Appl Catal A Gen. 2005;292:1-49. doi:10.1016/j.apcata.2005.05.045
35. Tessonnier JP, Pesant L, Ehret G, Ledoux MJ, Pham-Huu C. Pd nanoparticles introduced inside multi-walled carbon nanotubes for selective hydrogenation of cinnamaldehyde into hydrocinnamaldehyde. Appl Catal A Gen. 2005;288(1-2):203-210. doi:10.1016/j.apcata.2005.04.034

48
36. Rylander PN, Himseistein N, Side H. PROCESS FOR THE PRODUCTION OF HYDROCINNAMALDEHYDE. March 1968.
37. Bhatia SP, Wellington GA, Cocchiara J, Lalko J, Letizia CS, Api AM. Fragrance material review on 3-phenyl-1-propanol. Food Chem Toxicol. 2011;49:S246-S251. doi:10.1016/j.fct.2011.07.050
38. Cinnamyl alcohol composite oxide catalyst prepared through MPV (Meerwein-Ponndorf-Verley) reduction of cinnamyl aldehyde and preparation method of catalyst - Google Patents. November 2015. https://patents.google.com/patent/CN105080524A/en?q=Meerwein–Ponndorf–Verley&oq=Meerwein–Ponndorf–Verley. Accessed March 23, 2020.
39. Xiao Z. Insight into the Meerwein-Ponndorf-Verley reduction of cinnamaldehyde over MgAl oxides catalysts. Mol Catal. 2017;436:1-9. doi:10.1016/j.mcat.2017.04.016
40. Rajadhyaicshat RA, Karwa SL. SOLVENT EFFECTS IN CATALYTIC HYDROGENATION. Chem Eng Sci. 1986;41(7):1765-1770.
41. Zhang L, Winterbottom JM, Boyes AP, Raymahasay S. Studies on the Hydrogenation of Cinnamaldehyde over Pd/C Catalysts. Chem Technol Biotechnol. 1998;72:264-272.
42. Silva AB, Jordzo E, Mendes MJ, Fouilloux P. Effect of metal-support interaction during selective hydrogenation of cinnamaldehyde to cinnamyl alcohol on platinum based bimetallic catalysts. Appl Catal A Gen. 1997;148:253-264.
43. Szumełda T, Drelinkiewicz A, Kosydar R, Gurgul J. Hydrogenation of cinnamaldehyde in the presence of PdAu/C catalysts prepared by the reverse “water-in-oil” microemulsion method. Appl Catal A Gen. 2014;487:1-15. doi:10.1016/j.apcata.2014.08.036
44. Riscoe AR, Wrasman CJ, Herzing AA, et al. Transition state and product diffusion control by polymer-nanocrystal hybrid catalysts. Nat Catal. 2019;2:852-863. doi:10.1038/s41929-019-0322-7

49
APPENDIX
Table 9: Incipient Wetness Point Raw Data
Catalyst Catalyst Mass (g)
Initial Toluene Mass (g)
Final Toluene Mass (g)
Wetness Point (g solvent/g catalyst)
Time (seconds)
Pd/C 1.0 25.68 24.76 0.92 52 Pd/C 1.0 23.84 23.11 0.74 63 Pd/C 1.0 24.74 23.89 0.85 89 Pt/C 1.0 22.75 21.68 1.07 106 Pt/C 0.99 21.74 20.71 1.05 82 Pt/C 0.99 22.81 21.77 1.06 96
Wetness Point Sample Calculation
WP =massinitialtoluene − massfinaltoluene
masscatalyst =25.68g − 24.76g
1.0g
= 0.95gpolymergcatalyst
Monomer Solution Masses of Compounds Sample Calculation
masspolymersolution = WP ∗ masscatalyst = 0.84gpolymergcatalyst ∗ 5gcatalyst
= 4.2gpolymer
massstyrene = masspolymersolution ∗ wt%styrene = 4.2gpolymer ∗ 0.6495= 2.728gstyrene
massDVB = masspolymersolution ∗ wt%DVB = 4.2gpolymer ∗ 0.35
= 1.47gstyrene massAIBN = masspolymersolution ∗ wt%AIBN = 4.2gpolymer ∗ 0.0005
= 0.002gAIBN

50
Conversion Sample Calculation
CALDConversion =InitalCALDConcentration − FinalCALDConetration
InitalCALDConcentration ∗ 100%
=0.178molL − 0.054molL
0.178molL∗ 100% = 70%
Selectivity Sample Calculation
HCALDConversion =conc. HCALD
conc. HCALD + conc. PP + conc.CA ∗ 100%
=0.019molL
0.019molL + 0.002molL + 0.004molL∗ 100% = 76%
PPConversion =conc. PP
conc. HCALD + conc. PP + conc.CA ∗ 100%
=0.002molL
0.019molL + 0.002molL + 0.004molL∗ 100% = 8%
CAConversion =conc. CA
conc. HCALD + conc. PP + conc.CA ∗ 100%
=0.004molL
0.019molL + 0.002molL + 0.004molL∗ 100% = 15%
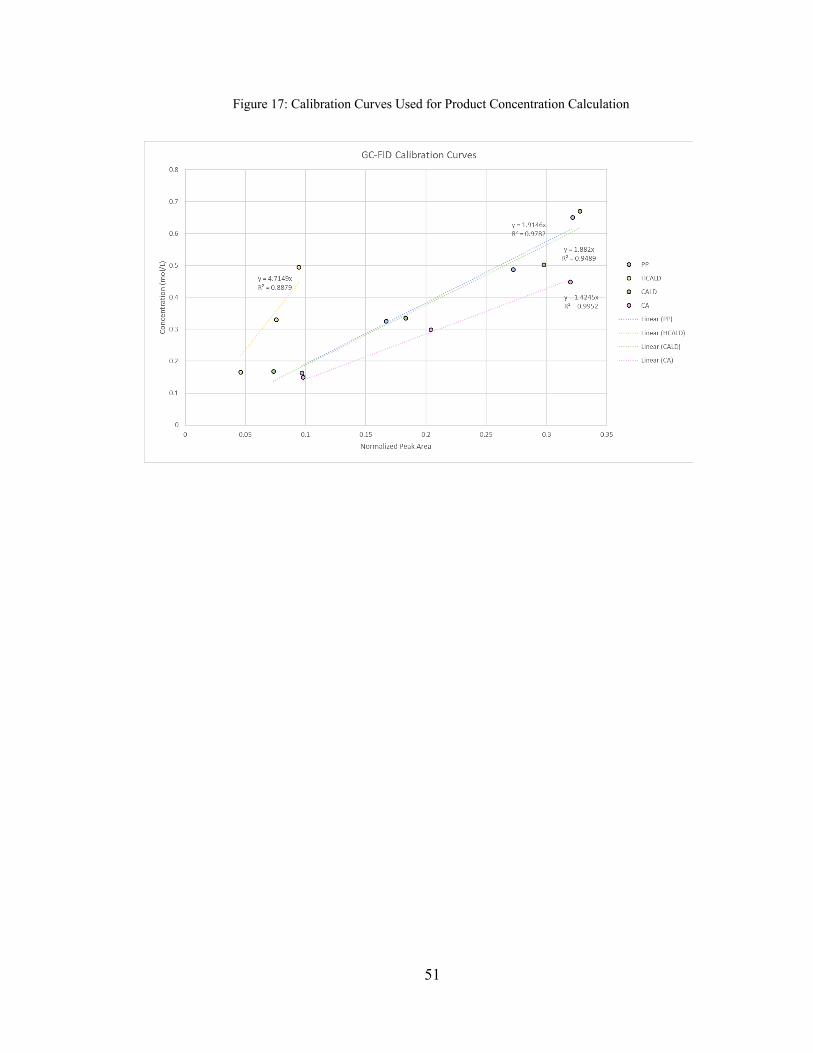
51
Figure 17: Calibration Curves Used for Product Concentration Calculation

52
Sample Calculation of Product Concentration
Conc. HCALD = slope ∗AVGHCALDPeakAreaAVGISPeakArea ∗
109 ∗ Conc. IS
= 4.7149 ∗2579035069 ∗
109 ∗ 0.046
molL = 0.177
molL
Conc. CALD = slope ∗AVGHCALDPeakAreaAVGISPeakArea ∗
109 ∗ Conc. IS
= 1.822 ∗265435069 ∗
109 ∗ 0.046
molL = 0.007
molL
Conc. PP = slope ∗AVGHCALDPeakAreaAVGISPeakArea ∗
109 ∗ Conc. IS
= 1.9146 ∗622335069 ∗
109 ∗ 0.046
molL = 0.017
molL
Conc. CA = slope ∗AVGHCALDPeakAreaAVGISPeakArea ∗
109 ∗ Conc. IS
= 0.9952 ∗168835069 ∗
109 ∗ 0.046
molL = 0.002
molL

53
AUTHOR’S BIOGRAPHY
Madeline Logan was raised in Bar Mills, Maine where she spent many of her
summer days fishing, hiking and camping with her dad and younger sister. She graduated
from Bonny Eagle High School in 2016 and began her first year in the Chemical
Engineering program at the University of Maine the following fall. In her second year she
was happy to accept a scholarship from the University of Maine Pulp and Paper Foundation
for her interest in pursuing a career in the industry. She spent two semesters working as a
co-op in the Sappi paper mill in Westbrook, Maine where she worked as a process engineer.
Her co-op experience challenged her in a way that she had never been before and it showed
her what life could be like post-graduation.
Madeline is a member of the engineering honors society Tau Beta Pi and spent her
free time on campus working as a student tutor for the University of Maine’s Tutor Program
and as a teaching assistant for the Department of Chemical Engineering. She was also
involved in the American Institute of Chemical Engineers (AICHE) and Technical
Association of the Pulp and Paper Industry (TAPPI) student chapters.
Upon graduation, Madeline has accepted a full-time process engineering position
at the Pixelle Specialty Solutions paper mill in Spring Grove, Pennsylvania. She plans on
at some point pursing an MBA and, in the meantime, is looking forward to seeing what the
industry has in store for her. Madeline hopes to return to Maine following a few years of
industry experience out of state.