Selective online exposure and political polarization during Swedish election campaigns
22
Selective online exposure and political polarization during Swedish election campaigns a longitudinal analysis using four waves of panel data Peter M. Dahlgren Adam Shehata Jesper Strömbäck @ peterdalle peterdahlgren.com [email protected]
-
Upload
peter-dahlgren -
Category
Science
-
view
239 -
download
2
Transcript of Selective online exposure and political polarization during Swedish election campaigns

Selective online exposure and political polarization during Swedish election campaignsa longitudinal analysis using four waves of panel data
Peter M. Dahlgren
Adam Shehata
Jesper Strömbäck
@peterdalle
peterdahlgren.com
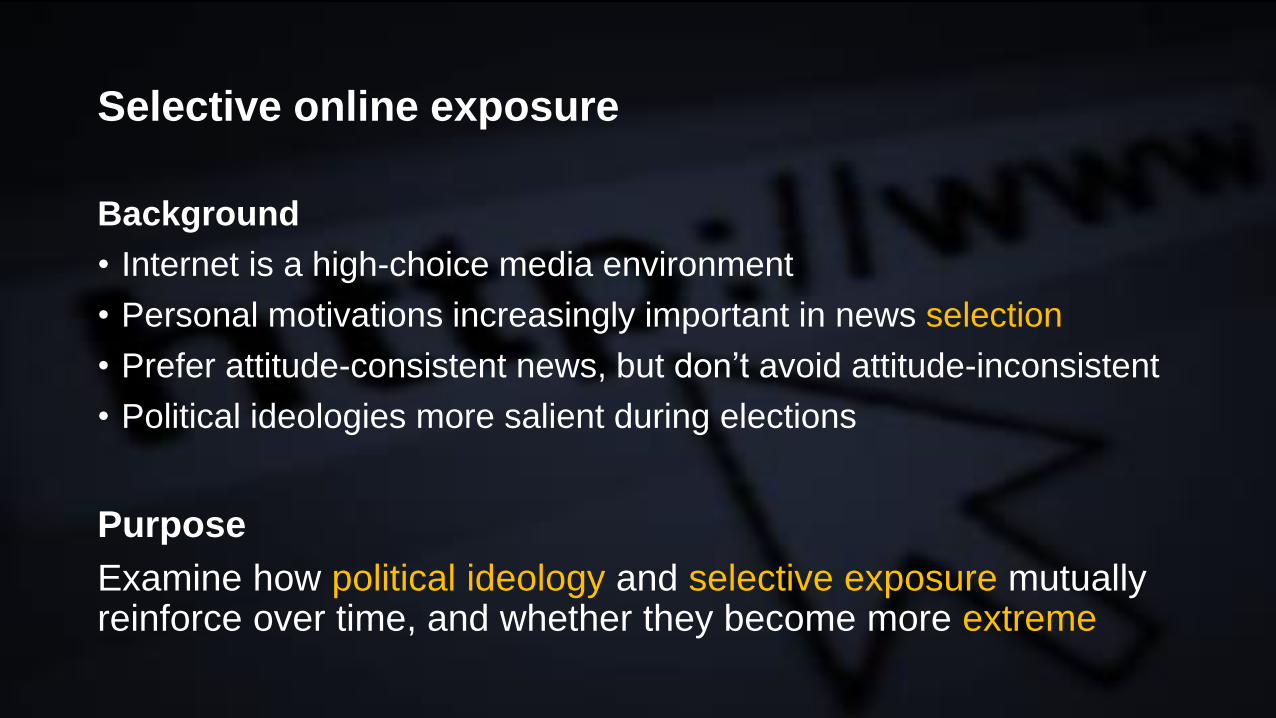
Selective online exposure
Background
• Internet is a high-choice media environment
• Personal motivations increasingly important in news selection
• Prefer attitude-consistent news, but don’t avoid attitude-inconsistent
• Political ideologies more salient during elections
Purpose
Examine how political ideology and selective exposure mutuallyreinforce over time, and whether they become more extreme

Media Use
Belief/attitude/
behavior
Media Use
Belief/attitude/
behavior
Media Use
Belief/attitude/
behavior
Reinforcing spirals model
Slater (2007, p. 284)
Time 1 Time 2 Time 3

Media Use
Belief/attitude/
behavior
Media Use
Belief/attitude/
behavior
Media Use
Belief/attitude/
behavior
Reinforcing spirals model
Slater (2007, p. 284)
Time 1 Time 2 Time 3

Media Use
Belief/attitude/
behavior
Media Use
Belief/attitude/
behavior
Media Use
Belief/attitude/
behavior
Reinforcing spirals model
Slater (2007, p. 284)
Time 1 Time 2 Time 3

Hypotheses
More selective exposure more ideologically extreme
Less selective exposure less ideologically extreme
Research questions
Selective exposure over time?
Role of political interest?
RQ1
RQ2
H1
H2

Method
• Panel survey during five months in the 2014 EU and Swedish national election: ”super election year”
• Random sample
• 2,281 (33%) completed all waves
Wave 1 Wave 2 Wave 3 Wave 4
May 22–25 September 14May 26–June 4April 11–22 August 1–13 September 15–24

Sample (n=2,281)
Sex:
Education:
Age: 19–76 years (M=46, SD=17)

Left-leaning Moderates Right-leaning
Results: political ideology

Left-leaning Moderates Right-leaning
Results: political ideology

Left-leaning Moderates Right-leaning
Results: political ideology
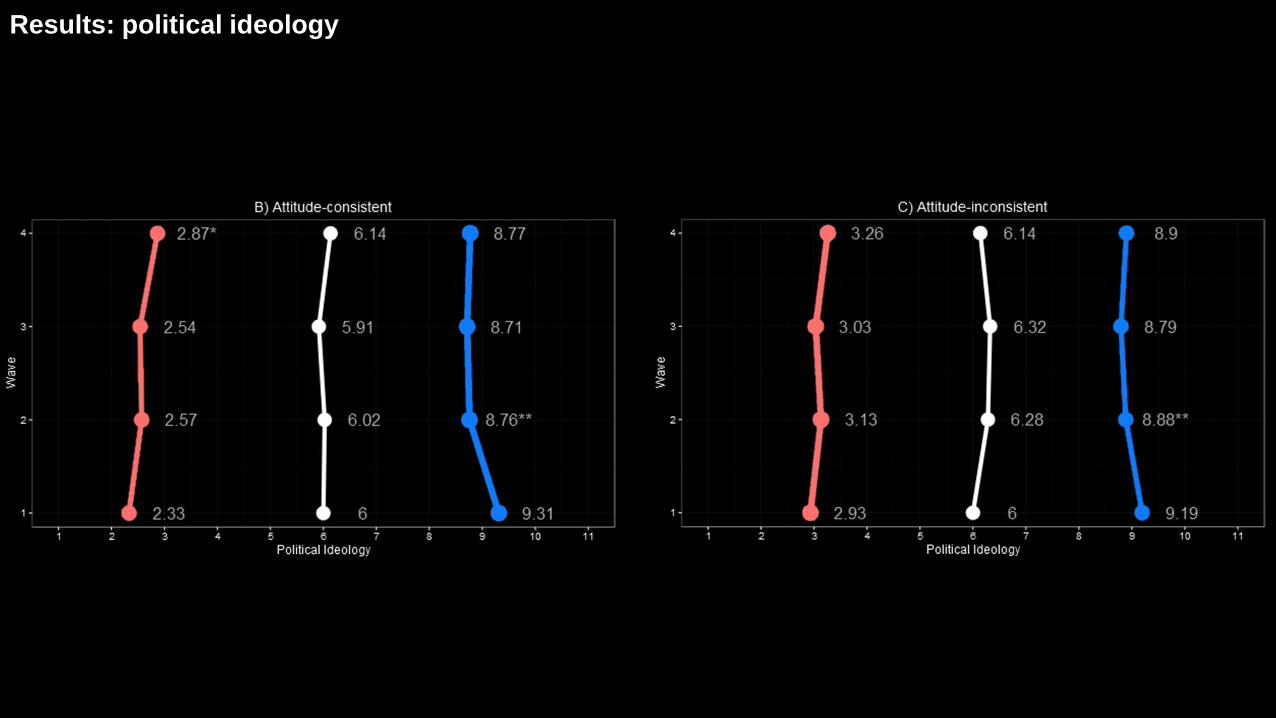
Results: political ideology

Attitude-inconsistent
news exposure
Attitude-consistent
news exposure
Results: selective exposure

Attitude-inconsistent
news exposure
Attitude-consistent
news exposure
Results: selective exposure

Attitude-inconsistent
news exposure
Attitude-consistent
news exposure
Results: selective exposure

Cross-lagged panel model
Political
Ideologyw1
Political
Ideologyw2
Selective
Exposurew2
Political
Ideologyw3
Political
Ideologyw4
Selective
Exposurew4
Political
interest
Income
.7
.31 1*** .91***
1*** .96***
.03*
.23***
.09***
–.05***
.08***
–.07***
.03**
Selective
Exposurew1
Selective
Exposurew3
Sex
.05**
.04**
Education
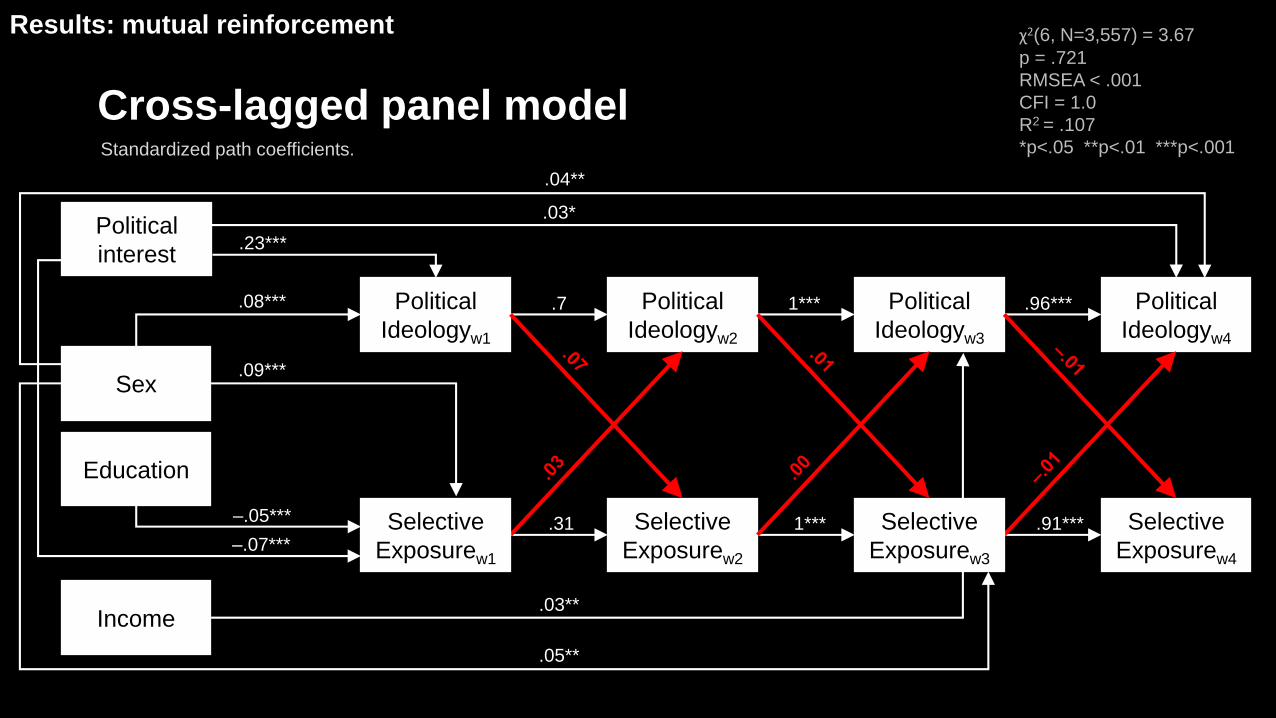
Standardized path coefficients.
χ2(6, N=3,557) = 3.67
p = .721
RMSEA < .001
CFI = 1.0
R2 = .107
*p<.05 **p<.01 ***p<.001
Results: mutual reinforcement

Cross-lagged panel model
Political
Ideologyw1
Political
Ideologyw2
Selective
Exposurew2
Political
Ideologyw3
Political
Ideologyw4
Selective
Exposurew4
Political
interest
Income
.7
.31 1*** .91***
1*** .96***
.03*
.23***
.09***
–.05***
.08***
–.07***
.03**
Selective
Exposurew1
Selective
Exposurew3
Sex
.05**
.04**
Education
Standardized path coefficients.
χ2(6, N=3,557) = 3.67
p = .721
RMSEA < .001
CFI = 1.0
R2 = .107
*p<.05 **p<.01 ***p<.001
Results: mutual reinforcement
Cross-lagged panel model
Political
Ideologyw1
Political
Ideologyw2
Selective
Exposurew2
Political
Ideologyw3
Political
Ideologyw4
Selective
Exposurew4
Political
interest
Income
.7
.31 1*** .91***
1*** .96***
χ2(6, N=3,557) = 3.67
p = .721
RMSEA < .001
CFI = 1.0
R2 = .107
*p<.05 **p<.01 ***p<.001
.03*
.23***
.09***
–.05***
.08***
–.07***
.03**
Selective
Exposurew1
Selective
Exposurew3
Sex
.05**
.04**
Education
Standardized path coefficients.
Results: mutual reinforcement

Cross-lagged panel model
Political
Ideologyw1
Political
Ideologyw2
Selective
Exposurew2
Political
Ideologyw3
Political
Ideologyw4
Selective
Exposurew4
Political
interest
Income
.7
.31 1*** .91***
1*** .96***
.03*
.23***
.09***
–.05***
.08***
–.07***
.03**
Selective
Exposurew1
Selective
Exposurew3
Sex
.05**
.04**
Education
Standardized path coefficients.
χ2(6, N=3,557) = 3.67
p = .721
RMSEA < .001
CFI = 1.0
R2 = .107
*p<.05 **p<.01 ***p<.001
Results: mutual reinforcement

Conclusions
No support for political ideology and selective exposure mutually reinforcing and becoming more extreme over time.
Individuals exposed to attitude-inconsistent news get slightlyless extreme (but mostly moving toward right).
High political interest: more extreme political ideology, and more exposure to attitude-inconsistent news.
RQ1
RQ2
H1
H2

Peter M. Dahlgrenselective exposure and media effects
@peterdalle
peterdahlgren.com