SelectionofOptimumVegetativeIndicesfortheAssessmentof...
10
International Scholarly Research Network ISRN Agronomy Volume 2012, Article ID 450473, 10 pages doi:10.5402/2012/450473 Research Article Selection of Optimum Vegetative Indices for the Assessment of Tobacco Float Seedlings Response to Fertilizer Management Ezekia Svotwa, 1 Barbara Maasdorp, 2 Amon Murwira, 3 and Anxious Masuka 1 1 Tobacco Research Board, Kutsaga Research Station, P.O.Box 1909, Harare, Zimbabwe 2 Department of Crop Science, University of Zimbabwe, Harare, Zimbabwe 3 Department of Geography and Environmental Studies, University of Zimbabwe, Harare, Zimbabwe Correspondence should be addressed to Ezekia Svotwa, [email protected] Received 13 April 2012; Accepted 21 May 2012 Academic Editors: M. Arias-Est´ evez, O. Merah, and M. A. Taboada Copyright © 2012 Ezekia Svotwa et al. This is an open access article distributed under the Creative Commons Attribution License, which permits unrestricted use, distribution, and reproduction in any medium, provided the original work is properly cited. The experiment sought to establish the vegetative indices for assessing tobacco float seedling varieties’ response to different fertilizer rates. A factorial design, with 3 variety × 4 fertilizer management treatments, was used. The N : P : K treatments were applied at 7, 21, and 35 days after sowing, while N treatments were applied at 42 days. Radiometric measurements were taken at 49, 56, 64, and 79 days after sowing on 8 tray plots, using a multispectral radiometer. Mature seedling samples were harvested at day 79 and stem lengths were determined before processing for total N analysis. All the five channels of the radiometer, the NDVI, and the SRI had a strong relationship with fertiliser rate. Both the NDVI and SRI for T66 were greater (P< 0.05) than those for KRK26 and KE1. The SRI had a stronger relationship with seedling dry mass, seedling count/tray, and stem length than the NDVI. The NDVI also showed a stronger relationship with total N than the SRI. The minimum threshold SRI and NDVI values and optimum growth (100% fertilser) were 0.72 and 6.1. This information is useful in identifying and estimating tobacco seedbed area and seedling vigour using remote sensing and, therefore, is important in forecasting potential tobacco crop area and yield. 1. Background Nutrient stress adversely affects seedling growth vigour, pro- ductivity, and overall quality. Early detection of nutrient stress in crops facilitates the timely application of corrective cultural practices before stress adversely affects seedling yield and quality [1]. Tobacco growers visually monitor seedlings for nutrient stress symptoms. A possible alternative to visual seedling health monitoring is the use of optical sensors that rely on light to assess the physiological status either at the leaf or canopy level. A leaf nitrogen concentration is an important indicator of plant fertilizer requirements. Nitrogen (N) is a constituent of chlorophyll, the green colouring matter in plants that plays a role in absorbing light for photosynthesis [2]. Nitro- gen deficiency in tobacco plants decreases chlorophyll and soluble protein content, causing a progressive loss in green colour starting in the older leaves. The affected crop lacks in texture, with much lower nitrogen and nicotine content and a reduction in the rate of leaf expansion and canopy development [3, 4]. Excessive nitrogen results in large, dark- green leaves [2]. Plant nitrogen status influences chlorophyll content. Re- searchers on ways of using remote sensing in quantifying plant nitrogen status have targeted pigment-based reflec- tance indices or the position of the chlorophyll red-edge [5], since pigment-induced crop reflectance is dominated by chlorophyll [6]. Canopy reflectance has the potential to rapidly estimate tobacco seedling N status, and hence seedling vigour and quality. It is important that the detection of plant N status is done at an early stage of crop development and this requires identification of spectral wavebands or indices in which vegetation reflectance is most responsive to unfavorable growth conditions. Remote sensing in the visible and near-infrared (NIR) wavelengths (400 and 1000 nm) is based on the principle that changes in plant light interception and utilization are influenced by plant cell chemical composition and canopy structure [7]. A plant leaf typically has a low reflectance in
Transcript of SelectionofOptimumVegetativeIndicesfortheAssessmentof...

International Scholarly Research NetworkISRN AgronomyVolume 2012, Article ID 450473, 10 pagesdoi:10.5402/2012/450473
Research Article
Selection of Optimum Vegetative Indices for the Assessment ofTobacco Float Seedlings Response to Fertilizer Management
Ezekia Svotwa,1 Barbara Maasdorp,2 Amon Murwira,3 and Anxious Masuka1
1 Tobacco Research Board, Kutsaga Research Station, P.O.Box 1909, Harare, Zimbabwe2 Department of Crop Science, University of Zimbabwe, Harare, Zimbabwe3 Department of Geography and Environmental Studies, University of Zimbabwe, Harare, Zimbabwe
Correspondence should be addressed to Ezekia Svotwa, [email protected]
Received 13 April 2012; Accepted 21 May 2012
Academic Editors: M. Arias-Estevez, O. Merah, and M. A. Taboada
Copyright © 2012 Ezekia Svotwa et al. This is an open access article distributed under the Creative Commons Attribution License,which permits unrestricted use, distribution, and reproduction in any medium, provided the original work is properly cited.
The experiment sought to establish the vegetative indices for assessing tobacco float seedling varieties’ response to different fertilizerrates. A factorial design, with 3 variety × 4 fertilizer management treatments, was used. The N : P : K treatments were applied at 7,21, and 35 days after sowing, while N treatments were applied at 42 days. Radiometric measurements were taken at 49, 56, 64, and79 days after sowing on 8 tray plots, using a multispectral radiometer. Mature seedling samples were harvested at day 79 and stemlengths were determined before processing for total N analysis. All the five channels of the radiometer, the NDVI, and the SRI hada strong relationship with fertiliser rate. Both the NDVI and SRI for T66 were greater (P < 0.05) than those for KRK26 and KE1.The SRI had a stronger relationship with seedling dry mass, seedling count/tray, and stem length than the NDVI. The NDVI alsoshowed a stronger relationship with total N than the SRI. The minimum threshold SRI and NDVI values and optimum growth(100% fertilser) were 0.72 and 6.1. This information is useful in identifying and estimating tobacco seedbed area and seedlingvigour using remote sensing and, therefore, is important in forecasting potential tobacco crop area and yield.
1. Background
Nutrient stress adversely affects seedling growth vigour, pro-ductivity, and overall quality. Early detection of nutrientstress in crops facilitates the timely application of correctivecultural practices before stress adversely affects seedling yieldand quality [1]. Tobacco growers visually monitor seedlingsfor nutrient stress symptoms. A possible alternative to visualseedling health monitoring is the use of optical sensors thatrely on light to assess the physiological status either at the leafor canopy level.
A leaf nitrogen concentration is an important indicatorof plant fertilizer requirements. Nitrogen (N) is a constituentof chlorophyll, the green colouring matter in plants thatplays a role in absorbing light for photosynthesis [2]. Nitro-gen deficiency in tobacco plants decreases chlorophyll andsoluble protein content, causing a progressive loss in greencolour starting in the older leaves. The affected crop lacksin texture, with much lower nitrogen and nicotine contentand a reduction in the rate of leaf expansion and canopy
development [3, 4]. Excessive nitrogen results in large, dark-green leaves [2].
Plant nitrogen status influences chlorophyll content. Re-searchers on ways of using remote sensing in quantifyingplant nitrogen status have targeted pigment-based reflec-tance indices or the position of the chlorophyll red-edge[5], since pigment-induced crop reflectance is dominatedby chlorophyll [6]. Canopy reflectance has the potentialto rapidly estimate tobacco seedling N status, and henceseedling vigour and quality. It is important that the detectionof plant N status is done at an early stage of crop developmentand this requires identification of spectral wavebands orindices in which vegetation reflectance is most responsive tounfavorable growth conditions.
Remote sensing in the visible and near-infrared (NIR)wavelengths (400 and 1000 nm) is based on the principlethat changes in plant light interception and utilization areinfluenced by plant cell chemical composition and canopystructure [7]. A plant leaf typically has a low reflectance in

2 ISRN Agronomy
the visible spectral region because of strong absorption bychlorophylls, a relatively high reflectance in the near-infraredbecause of internal leaf scattering and no absorption, and arelatively low reflectance in the infrared beyond 1.3 µ becauseof strong absorption by water [8, 9]. The peak at the greenregion gives rise to the green colour of vegetation. The leavesof a given plant species tend to have a characteristic surface,thickness, internal structure, and pigment content. Similarly,the canopy’s horizontal and vertical extents tend to havea characteristic structure, which is determined by the size,shape, and orientation of the plants and their leaves and bythe cultural practices or environmental growing conditions.All these factors influence the leaf and canopy optical proper-ties and the reflection patterns received by sensors representthe integration of their effects [10].
The reflectance at plant canopy level is similar, but isslightly modified by the nonuniformity of incident solar ra-diation, plant structures, leaf areas, shadows, and back-ground reflectivity according to [11]. Airborne sensors re-ceive an integrated view of all these effects, and each crop orvegetation type tends to have a characteristic signature whichenables its identification, and possibly, species response toenvironmental factors like moisture, nutrient, and disease[8].
Vegetation indices (VIs) are combinations of surfacereflectance at two or more wavelengths. These indices aredesigned to highlight a particular property of vegetation[10]. By comparing the results of different VIs and cor-relating these to field conditions, one can determine theindices that best correlate with crop agronomic parameters ofinterest [12]. VIs compares reflectance in the near-infraredrange to another measurement taken in the visible.
The rationale for spectral vegetation indices (VIs) is toexploit the different spectral signatures for green vegetationas compared to spectral signatures of other earth materials.Green leaves have a distinct spectral reflectance patternin the visible (VIS) and near-infrared (NIR) wavelengths.Reflectance in the blue and red regions is very low and higherin the green region. This is why leaves appear green to humaneyes. Other materials such as bare soil, sand, exposed rock,concrete, or asphalt, generally show a linear relationshipbetween reflectance and the five wave bands and this isdue to steady rise in reflectance as wavelength increasesfrom the visible to the near-infrared. Most VIs compare thedifferences between the red and near-infrared reflectance.Red (or visible) reflectance is sensitive to chlorophyll contentand the near-infrared reflectance is sensitive to the mesophyllstructure and leaf compositions. The greater the differencebetween the red (or visible) and near-infrared reflectance,the greater the amount of green vegetation present. Smalldifferences between the red (or visible) and near-infraredreflectance indicate the influence of different plant stress,background material such as soil or other nongreen mate-rials. Spectral vegetation indices are related to a numberof biophysical parameters including Leaf Area Index (LAI),percent vegetation cover, green leaf biomass, and fraction ofabsorbed photosynthetically active radiation (fAPAR [13, 14]and can be used as alternative tool for estimating N status[15]).
The most commonly used VI is the Normalized Differ-ence Vegetation Index (NDVI). The NDVI has been in usefor many years to measure and monitor plant growth (vigor),vegetation cover, and biomass production from multispectralsatellite data [10, 11]. The index is calculated using theformula: NDVI = (NIR− Red)/(NIR + Red). As described byJackson et al. [10], the index is considered a good indicatorof amount of vegetation and, hence, useful in distinguishingvegetation from soil.
The Simple Ratio (SR) Index, another well-known VI, isdefined by the equation: SR = NIR/R [16]. The indexbecomes high with increasing vegetative density and planthealth, thus indicating the amount of biomass. The value ofthis index for green vegetation ranges from 2 to 8, accordingto Eitel et al. [11]. Other indices are the Blue NormalizedDifference Vegetative Index, Green Vegetative Index, Chloro-phyll Index, and the Nitrogen Reflectance Index [17].
This research seeks to identify suitable reflectance ratiosfor assessing the nutrient status, vigour, quality, and quantityof tobacco seedlings in the seedbed. The information willbe useful in identifying tobacco seedbeds, estimation oftobacco seedbed area as well as seedling vigour usingremote sensing and, therefore, it is important in forecastingtobacco crop yield using remote sensing. Tobacco yieldestimation in Zimbabwe has been based on the Garvin model[18], seed tracking approach and the statistical and cropcondition assessment approaches. These traditional methodsare tedious and time consuming and are based on datacollected from sampled area and, hence, the precision of themethods is varied [18]. A more objective and practical modelfor yield estimation could assist tobacco stakeholders withmore precise data on tobacco hectarage and yield that wouldbe available for export.
By using satellite imagery instead of traditional samplingtechniques, crop yield forecasts can be generated earlier thantraditional estimates, and because they are based on imagesthat are constantly being downloaded from the satellite, theseforecasts can be updated frequently throughout the growingseason. Remote sensing enables observations over large areasat regular intervals, making it useful in large-scale cropmodeling [19, 20]. Use of satellite imagery would also enablethe verification farmers’ claims of seedbed area established.
2. Method
The experiment was carried out in the floatbed between June2010 and September 2012 at Kutsaga Research Station, nearHarare in Zimbabwe. Kutsaga is located 16 km to the SouthEast of the capital, Harare, between Longitude 31◦ 08′ E,Latitude 17◦ 55′ S, and at an altitude of 1000 m to 1500 m(TRB, 1986). The long-term annual average rainfall for thesite is 850 mm. The annual average temperature is 18.6◦C andthe range average monthly temperature is 8◦C.
2.1. Fertilizer Treatments. A factorial design, with 3 variety×4 fertiliser management treatments, was used. Three Kutsagatobacco varieties, T66, KRK26, and KE1, were used. Thefertilizer treatments were applied by hands as shown inTable 1 below. The N : P : K treatments were hand-applied in

ISRN Agronomy 3
Table 1: Variety × fertilizer treatments.
Variety Fertilizer level
K RK 26
0%
50%
100%
150%
T 66
0%
50%
100%
150%
KE 1
0%
50%
100%
150%
float water at 7, 21, and 35 days after planting in the formof Floatfert (4.5 2.7 4.2), while N treatments were appliedat 42 days after planting. The recommended Floatfert rateof 6 L/ha) is applied at 7 (1 L), 21 (2 L), and 35 days (3 L).Ammonium nitrate (34.5% N), a nitrogen source is appliedat 800 g/ha equivalent. Each plot had sixteen 242-cell floattrays each measuring 67 cm× 34.5 cm and, of these, 8 centraltrays were assessed.
2.2. Procedure. Radiometric measurements made on 8 trayplots, using a hand held multispectral radiometer (Crop-scan MSR-5, 450–1750 nm). The radiometer simultaneouslymeasures irradiance and radiance to provide canopy surfacereflectance. The data acquired represents the average reflec-tion from the area sampled. Normalized Difference Vegeta-tion Index (NDVI) values calculated using the reflectancemeasured from Channel 3 (visible: 630–690 nm) and Chan-nel 3 (near infrared: 760–900 nm) were used to calculate theindex:
NDVI = (Ch4− Ch3)(Ch4 + Ch3)
. (1)
The Multispectral Radiometer (MRS 5) was positionedfacing vertically downward at 1 m above seedling canopies,and measurements were taken around solar noon to min-imize the effect of diurnal changes in solar zenith angle.Ten (10) measurements were taken per sampling area andreflectance measurements were averaged for each samplingplot to estimate a single reflectance value. Seedlings ineach tray were counted and mature seedling samples wereharvested at 79 days after sowing. Seedling stem lengths werealso determined at pulling before samples were dried andground for laboratory total nitrogen measurements using theKjeldahl method.
2.3. Data Analysis. Spectral data was analyzed using Genstat9.2 Edition (2007), while graphs were constructed usingExcel 2007.
0
5
10
15
20
25
30
35
40
45
1 2 3 4 5
Refl
ecta
nce
(%
)
Wavelength channel
Bare soilKRK26 @ 0%KRK26 @ 50%KRK26 @ 100%KRK26 @ 150%
T66 @ 50%
T66 @ 0%T66 @ 100%
T66 @ 150%
KE1 @ 0%KE1 @ 50%KE1 @ 100%KE1 @ 150%
Figure 1: Spectral reflectance signatures for the variety fertilizer oftreatments.
3. Results
3.1. Seasonal Average Spectral Reflectance for the Variety× Fer-tilizer Treatments. Seasonal average reflectance values wereused to plot the spectral response curve (Figure 1). Allvarieties displayed a similar S-shaped spectral reflectancesignature with peaks at Channel 2 (520–600 nm) andChannel 4 (760–900 nm), and dips at Channel 1 (450–520 nm), 3 (630–690 nm) and 5 (1550–1750 nm) (Figure 6).The spectral signature for bare soil was more or less straightwith less pronounced peaks and dips.
Channel 1 (450–520 nm) reflectance values were neg-atively correlated with rate of fertilizer application (r2 =−0.858). KE1 at 0% recommended fertilizer had the highestreflectance on Channel 1 (9.869). Reflectance values forthe other varieties for the same (0%) fertilizer treatmentwere 9.32 (K RK 26) and 8.92 (T66). Percentage reflectancedecreased as the rate of fertilizer application increased,reaching the lowest level at 150% recommended fertilizer.KE1 at 150% of the recommended fertilizer had the lowestreflectance (3.139). Reflectance values for the other twovarieties at 150% fertilizer application rate were 3.44 (KRK26) and 3.18 (T66).
Channel 2 (520–600 mm) (Figure 2), Channel 3(630–690 nm) (Figure 3), and Channel 5 (1550–1750 nm)(Figure 4) followed the same pattern as Channel 1 (450–520 nm), showing a negative correlation with the rate offertilizer application (r2 = 0.90, 0.874 and 0.769, resp.).

4 ISRN Agronomy
−200
20406080
100120140160
2 3 4 5 6 7 8 9 10 11
Fert
ilise
r ra
te (
% r
ec)
Channel 1 reflectance (%)
y = −123ln(x) + 278.3R2 = 0.893
Figure 2: Correlation between fertilizer rate (%) and Channel 1(450–520 nm) reflectance values.
020406080
100120140160180
7 8 9 10 11 12 13 14
Fert
ilise
r ra
te (
% r
ec)
Channel 2 reflectance (%)
y = −248ln(x) + 646.2R2 = 0.904
Figure 3: Correlation between fertilizer rate (%) and Channel 2(520–600 nm) reflectance values.
020406080
100120140160
3 5 7 9 11 13 15
Fert
ilise
r ra
te (
% r
ec)
Channel 3 reflectance (%)
y = −113·ln(x) + 302.9
R2 = 0.908
Figure 4: Correlation between fertilizer application rate (%) andChannel 3 (630–690 nm) reflectance values.
Channel 4 (760–900 nm) reflectance values are positivelycorrelated with rate of fertilizer application (r2 = 0.904)(Figure 5). Percentage reflectance increased as the rateof fertilizer increased from 0%, reaching the highest at150% recommended fertilizer. T66 at 150% recommendedfertilizer had the highest reflectance value (42.414). OtherChannel 4 reflectance values at 150% fertilizer were 40.5(KRK26) and 40.2 (KE1). The 0% fertilizer application rateshad the lowest reflectance values for all the 3 varieties(KRK26 = 22.5; T66 = 23.97 and KE1 = 22.3).
Both the NDVI and the SRI were positively correlatedwith the fertilizer application rate (Figure 7). The coefficientof determination for SR and fertilizer application rate
0
20
40
60
80
100
120
140
160
20 25 30 35 40 45
Fert
ilise
r ra
te (
% r
ec)
Channel 4 reflectance (%)
y = 226.85ln(x) −713.55R2 = 0.8843
Figure 5: Correlation between fertilizer application rate (%) andChannel 4 (760–900 nm) reflectance values.
−20
0
20
40
60
80
100
120
140
160
12 13 14 15 16 17 18 19 20 21
Fert
ilise
r ra
te (
%)
Channel 5 reflectance (%)
y = −287.5ln(x) +854.27R2 = 0.7701
Figure 6: Correlation between fertilizer application rate (%) andChannel 5 (1550–1750 nm) reflectance values.
(r2 = 0.905) was greater than that for NDVI and fertilizerapplication rate (r2 = 0.819). The differences amongvarieties, fertilizer application rates, and variety × fertilizerinteractions were highly significant (F = 0.016) (Figure 10).
Both the NDVI and SRI for T66 were greater (P < 0.05)than those for KRK26 and KE1. The latter two (KRK26 andKE1) had statistically similar (P < 0.05) reflectance values.There were also significant (F < 0.001) fertilizer applicationrate effect on seedling canopy reflectance (0 > 0.05% >100% > 150%), respectively. The treatment differences inNDVI and SR indices were maintained from day 49 to day79, the time of pulling (Figures 8 and 9).
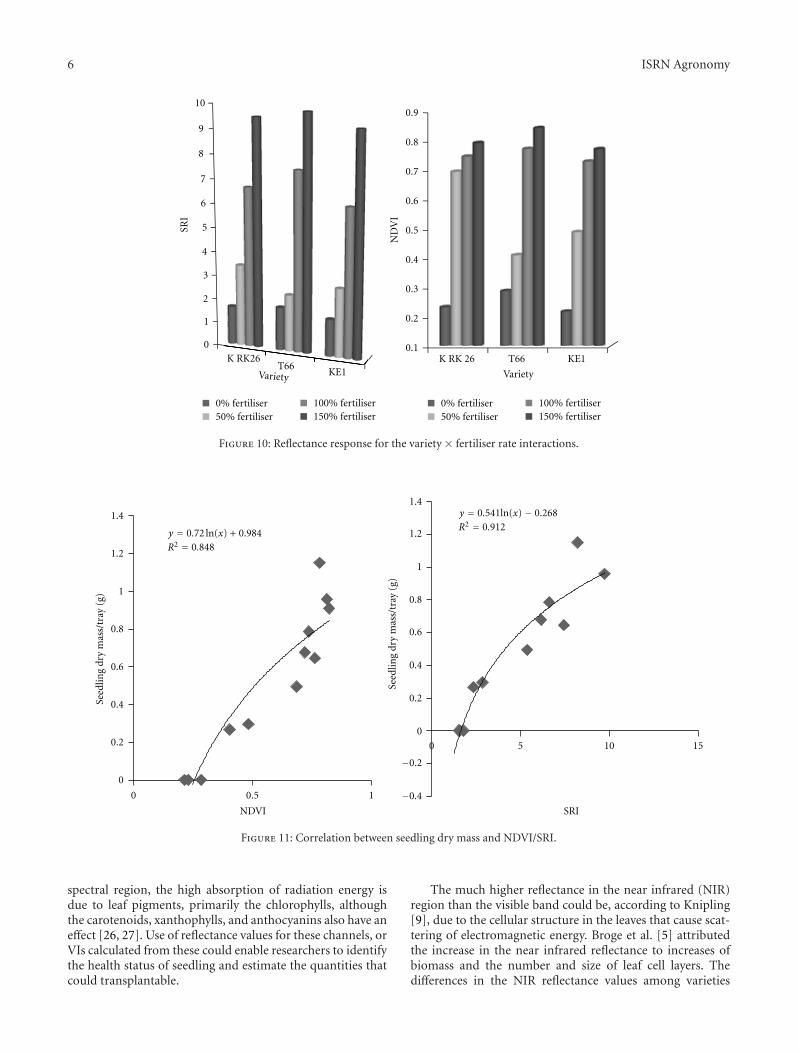
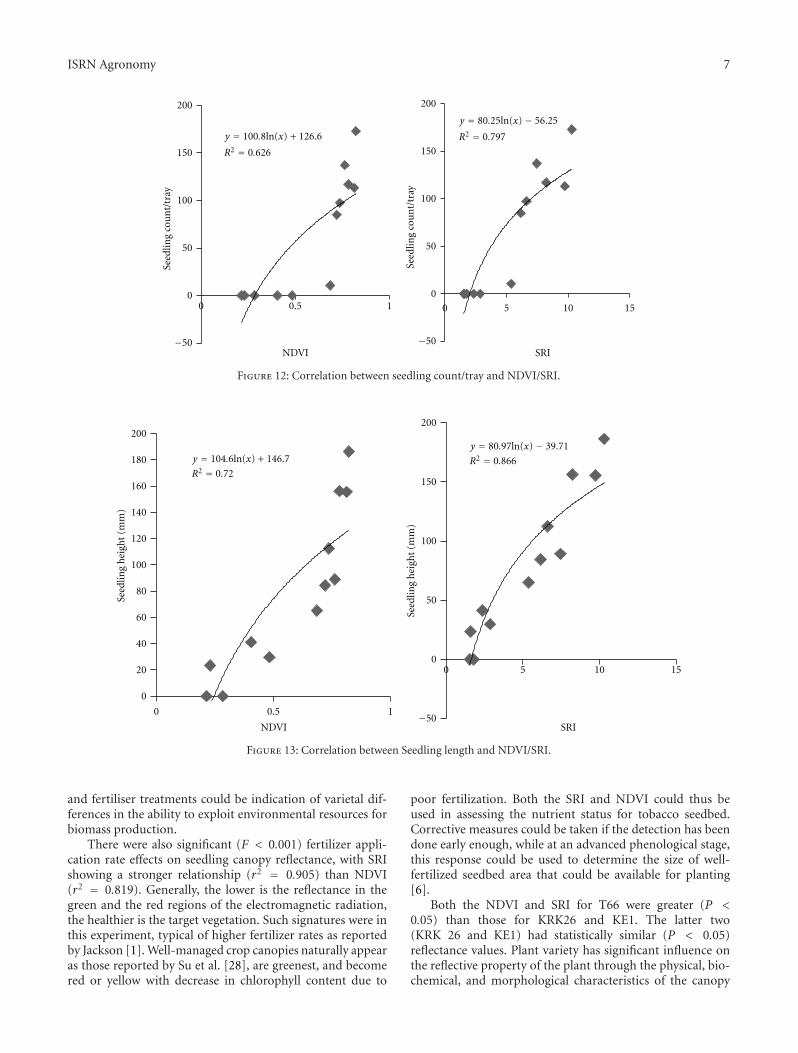
The correlations between seedling dry mass with bothNDVI and SRI correlations were high (r2 = 0.848 andr2 = 0.912 resp.) (Figure 11). The seedling count/tray versusNDVI correlation (r2 = 0.626) was lower than that of theseedling count versus SRI (r2 = 0.797) (Figure 12) and thesame trend was also noted on the seedling height versusNDVI (r2 = 0.80) and seedling height versus SRI (r2 =0.936) (Figures 13 and 14). The NDVI showed a weakercorrelation (r2 = 0.72) with total N than the SRI (r2 =0.866).
A summary for the NDVI and SRI ranges for the differentfertilizer levels is shown in Table 2. The minimum thresholdvalues for NDVI and SRI for good quality, transplantable,and well-nourished seedlings was 0.72 and 6.1, respectively.

ISRN Agronomy 5
−20
0
20
40
60
80
100
120
140
160
0 5 10 15
Fert
ilise
r ra
te (
%)
SRI
y = 76.27ln(x) − 36.43
R2 = 0.9052
−40
−20
0
20
40
60
80
100
120
140
160
10.80.60.40.2
Fert
ilise
r ra
te (
%)
NDVI
y = 102.85ln(x) + 141.94
R2 = 0.8196
Figure 7: Correlation between NDVI/SRI versus fertilizer application rate at 72 days after sowing.
0
0.1
0.2
0.3
0.4
0.5
0.6
0.7
0.8
0.9
49 64 72 79
ND
VI
Days after sowing
KRK26 @ 0%T66 @ 0%KE1 @ 0%KRK26 @ 50%T66 @ 50%KE1 @ 50%
KRK26 @ 100%T66 @ 100%KE1 @ 100%KRK26 @ 150%T66 @ 150%
Figure 8: Seasonal changes in seedling reflectance (NDVI) between49–79 days after sowing.
4. Discussion
The S-shaped spectral response curve produced from theseasonal average reflectance values for the variety fertilizertreatments was typical for green plants. Vegetation has aunique spectral signature which enables it to be distinguishedreadily from other types of land cover in an optical/near-infrared image [12]. This characteristic was according toNowatzki et al. [21] and Demetriades-Shah et al. [22] due tostrong absorption by chlorophylls in the red region, internalleaf scattering in the near-infrared and strong absorption bywater in the infrared beyond 1.3 µ. The reflectance of a plant
0
2
4
6
8
10
12
49 64 72 79
SRI
Days after sowing
KE1 @ 150%KRK26 @ 0%KRK26 @ 100%KRK26 @ 150%KE1 @ 100%
T66 @ 100%KE1 @ 0%T66 @ 150%KE1 @ 50%T66 @ 50%
Figure 9: Seasonal changes in seedling reflectance (SRI) between49–79 days after sowing.
canopy is similar, but is modified by the nonuniformity ofincident solar radiation, plant structures, leaf areas, shadows,and background reflectivities [23]. Species discrimination ismade possible when airborne sensors are used because thesereceive an integrated view of all these effects, and each cropor vegetation type tends to have a characteristic signature [8].
The lower the fertilizer application rate, the higher theChannel 1, 2, and 3 reflectance values. The reflectance valuesin the blue (Channel 1) and red (Channel 3) regions of thespectrum were, as suggested by Ustin et al. [24], due tohigh absorption by chlorophyll for photosynthesis, while thepeaks observed at the green (Channel 2) region were alsotypical of the green colour of vegetation [25]. In the visible
6 ISRN Agronomy
0
1
2
3
4
5
6
7
8
9
10
K RK26 T66
KE1
SRI
Variety
0% fertiliser50% fertiliser
100% fertiliser150% fertiliser
K RK26 T66
K RK 26 T66 KE1
ND
VI
Variety
0% fertiliser50% fertiliser
100% fertiliser150% fertiliser
0.1
0.2
0.3
0.4
0.5
0.6
0.7
0.8
0.9
Figure 10: Reflectance response for the variety × fertiliser rate interactions.
0 10.5
Seed
ling
dry
mas
s/tr
ay (
g)
NDVI
1.4
1.2
1
0.8
0.6
0.4
0.2
0
y = 0.72 ln(x) + 0.984R2 = 0.848
0 5 10 15
Seed
ling
dry
mas
s/tr
ay (
g)
SRI
1.4
1.2
1
0.8
0.6
0.4
0.2
0
−0.2
−0.4
y = 0.541ln(x) − 0.268R2 = 0.912
Figure 11: Correlation between seedling dry mass and NDVI/SRI.
spectral region, the high absorption of radiation energy isdue to leaf pigments, primarily the chlorophylls, althoughthe carotenoids, xanthophylls, and anthocyanins also have aneffect [26, 27]. Use of reflectance values for these channels, orVIs calculated from these could enable researchers to identifythe health status of seedling and estimate the quantities thatcould transplantable.
The much higher reflectance in the near infrared (NIR)region than the visible band could be, according to Knipling[9], due to the cellular structure in the leaves that cause scat-tering of electromagnetic energy. Broge et al. [5] attributedthe increase in the near infrared reflectance to increases ofbiomass and the number and size of leaf cell layers. Thedifferences in the NIR reflectance values among varieties
ISRN Agronomy 7
−50
0
50
100
150
200
0 0.5 1
Seed
ling
cou
nt/
tray
NDVI
y = 100.8ln(x) + 126.6
R2 = 0.626
−50
0
50
100
150
200
0 5 10 15
Seed
ling
cou
nt/
tray
SRI
y = 80.25ln(x) − 56.25
R2 = 0.797
Figure 12: Correlation between seedling count/tray and NDVI/SRI.
0
20
40
60
80
100
120
140
160
180
200
0 0.5 1
Seed
ling
hei
ght
(mm
)
NDVI
y = 104.6ln(x) + 146.7
R2 = 0.72
−50
0
50
100
150
200
0 5 10 15
Seed
ling
hei
ght
(mm
)
SRI
y = 80.97ln(x) − 39.71
R2 = 0.866
Figure 13: Correlation between Seedling length and NDVI/SRI.
and fertiliser treatments could be indication of varietal dif-ferences in the ability to exploit environmental resources forbiomass production.
There were also significant (F < 0.001) fertilizer appli-cation rate effects on seedling canopy reflectance, with SRIshowing a stronger relationship (r2 = 0.905) than NDVI(r2 = 0.819). Generally, the lower is the reflectance in thegreen and the red regions of the electromagnetic radiation,the healthier is the target vegetation. Such signatures were inthis experiment, typical of higher fertilizer rates as reportedby Jackson [1]. Well-managed crop canopies naturally appearas those reported by Su et al. [28], are greenest, and becomered or yellow with decrease in chlorophyll content due to
poor fertilization. Both the SRI and NDVI could thus beused in assessing the nutrient status for tobacco seedbed.Corrective measures could be taken if the detection has beendone early enough, while at an advanced phenological stage,this response could be used to determine the size of well-fertilized seedbed area that could be available for planting[6].
Both the NDVI and SRI for T66 were greater (P <0.05) than those for KRK26 and KE1. The latter two(KRK 26 and KE1) had statistically similar (P < 0.05)reflectance values. Plant variety has significant influence onthe reflective property of the plant through the physical, bio-chemical, and morphological characteristics of the canopy

8 ISRN Agronomy
0 0.5 1
Tota
l lea
f N
(g/
g)
NDVI
y = 1.097ln(x) + 2.213R2 = 0.905
2.5
2
1.5
1
0.5
0
−0.5 0 5 10 15
Tota
l lea
f N
(g/
g)
SRI
y = 0.911ln(x) + 0.013R2 = 0.803
2.5
2
1.5
1
0.5
0
Figure 14: Correlation between leaf total N and NDVI/SRI at pulling (72 days after sowing).
Table 2: Summary of simple ratios for all the variety × fertilizertreatments.
Fertilizer level Simple ratio range NDVI range
0 1.52–1.78 0.21–0.28
50 1.92–5.16 0.38–0.67
100 6.10–7.41 0.72–0.76
150 8.34–10.50 0.79–0.83
[23, 29]. The variety T66 could be genetically more superiorin biomass production. In addition it could also be easydifferentiating these, and calculating their proportions in thefield using the NDVI and SRI profiles.
The high seedling dry mass and height correlations withboth NDVI and SRI were indicative of possible application ofthe two in tobacco seedling quality assessment using remotesensing. The seedling dry mass and seedling length areboth measures of biomass and quality which, according toMutanga [7], are affected by plant N status. The correlationsbetween seedling count/tray with both NDVI (r2 = 0.626)and SRI (r2 = 0.797) were also high enough to be applicablein estimating seedling populations in a tobacco floatbedusing remote sensing.
The VIs were maintained at more or less same levelsbetween days 49 and 79 (pulling stage). Generally in thefloatbed no additional nutrition is added on seedlings afterday 42, except for such cases where nutrients would haveleaked out of the media. Quality and quantity estimationsmade after all fertilizers are applied could hence be reliedon, and any repeated measurements taken would be used forverification of earlier findings.
The high correlations between NDVI and SRI with totalN (0.905 and 0.803) translated to an increase in canopyreflectance as N concentration in the leaves decrease at low
nutrient levels [30]. Past research has associated nitrogendeficiencies with decreasing amounts of chlorophyll in cot-ton [31], and maize [14]. The simple ration and NDVI rangesfor the 100–150% fertilizer treatments were comparable withthose that were associated with high plant health and vigourin past research [14, 17].
5. Conclusions
The spectral response curve can be used to assess seedlingvigour in response to fertilizer management levels. However,the reflectance values at the channels would depend on theamount of energy that falls on top of the canopy and thisvaries according to the time of the day, season and weatherconditions. A better index should be one that minimizes theeffect of the above factors. Channels 1, 2, 3 and Channel 4had high correlation with fertilizer rate and hence can beused in tobacco seedling vigour assessment. The coefficientsof determination for Channels 1, 2, and 3 and fertiliserapplication rates were, however, negative and treatment dif-ferences were so narrow that an experienced person couldneed to accurately apply these in plant vigour assessment.Channel 4, with a positive correlation could be easier toapply, but like the former 3, the treatment differences werealso narrow for easy application in plant vigour assessment.
Both the NDVI and the SRI were highly correlatedwith fertilizer application rates, and hence could be used inassessing nutrient status and requirements in tobacco floatseedling. The two indices could clearly show the differencesin the variety × fertilizer interactions. The strength of therelationship was also maintained up to the time of pulling.
The variety T 66 can be distinguished from K RK26 and KE1 using canopy reflectance. Since these have different yieldpotentials, the potential cropping areas for these could beseparately determined.

ISRN Agronomy 9
The SRI showed a stronger relationship with seedling drymass and seedling height as well as seedling density than theNDVI, and hence could be used in seedling quality assess-ment. Total leaf N was also more linearly related with the SRIthan the NDVI. There is potential in using the VI in nutrientassessment for quick implementation of corrective measures.Because of its higher correlation with seedling count/tray, theSRI can be used more accurately to estimate the quantity ofseedling that can available for planting out in the field.
In tobacco float seedlings an SRI of at least 6.10 andNDVI of at least 0.72 are indicative of optimum growthvigour and health.
From the results, it could be possible to assess vigour,quality, and density of flue cured tobacco float seedling usingremote sensing techniques. Further research is necessary toinvestigate the potential of other indices like the green NDVI,blue NDVI, NRI and the chlorophyll index in assessingtobacco seedling performance in the seedbed. The informa-tion can be used in estimating seedbed size and quantity ofseedling that can be available for crop establishment, andhence produce an early season crop forecast using remotesensing.
References
[1] R. D. Jackson, “Remote Sensing of Biotic and abiotic plantstress,” in Annual Review of Phytopathology, vol. 24, pp. 265–287, 1986.
[2] Ikisan.com, “CropInformation: tobacco,” 2000, http://www.ikisan.com/Crop%20Specific/Eng/links/ap nutrients.shtml.
[3] J. A. Moran, A. K. Mitchell, G. Goodmanson, and K. A.Stockburger, “Differentiation among effects of nitrogen fertil-ization treatments on conifer seedlings by foliar reflectance: acomparison of methods,” Tree Physiology, vol. 20, no. 16, pp.1113–1120, 2000.
[4] M. E. Bausch, “The role of remote sensing in determining thedistribution and yield of crop,” Advances in Agronomy, vol. 27,pp. 271–304, 1975.
[5] N. N. Broge, M. Hvidberg, B. U. Hansen, H. S. Anderson, andA. A. Nielsen, “Analyses of spectral-biophysical relationshipsfor a wheat canopy,” in Proceedings of the 3rd InternationalAirborne Remote Sensing Conference and Exhibition, vol. 2, pp.373–379, 1997.
[6] J. R. Thomas and H. W. Gausman, “Leaf reflectance versus leafchlorophyll and carotenoid concentrations for eight crops,”Agronomy Journal, vol. 69, pp. 799–802, 1977.
[7] O. Mutanga, Hyperspectral remote sensing of tropical grassquality and quantity [Ph.D. thesis], Wageningen University,The Netherlands, ITC Dissertation Number 111, 2004.
[8] S. C. Liew, “Principles of remote sensing,” Centre for RemoteImaging, Sensing and Processing, National University ofSingapore, Singapore 119260, 2001, http://www.crisp.nus.edu.sg/∼research/tutorial/rsmain.htm.
[9] E. B. Knipling, “Physical and physiological basis for thereflectance of visible and near-infrared radiation from vege-tation,” Remote Sensing of Environment, vol. 1, no. 3, pp. 155–159, 1970.
[10] R. D. Jackson, P. N. Slater, and P. J. Pinter, “Discriminationof growth and water stress in wheat by various vegetationindices through clear and turbid atmospheres,” Remote Sensingof Environment, vol. 13, no. 3, pp. 187–208, 1983.
[11] J. U. H. Eitel, R. F. Keefe, D. S. Long, A. S. Davis, and L. A.Vierling, “Active ground optical remote sensing for improvedmonitoring of seedling stress in nurseries,” Sensors, vol. 10, no.4, pp. 2843–2850, 2010.
[12] C. J. Tucker, “Red and photographic infrared linear combina-tions for monitoring vegetation,” Remote Sensing of Environ-ment, vol. 8, no. 2, pp. 127–150, 1979.
[13] E. Boegh, H. Soegaard, N. Broge et al., “Airborne multispectraldata for quantifying leaf area index, nitrogen concentration,and photosynthetic efficiency in agriculture,” Remote Sensingof Environment, vol. 81, no. 2-3, pp. 179–193, 2002.
[14] G. Walburg, M. E. Baccer, C. S. T. Daughty, and T. L. Housley,“Effects of nitrogen on the growth, yield and reflectancecharacteristics of corn,” Agronomy Journal, vol. 74, pp. 677–683, 1982.
[15] G. A. Blackburn, “Remote sensing of forest pigments usingairborne imaging spectrometer and LIDAR imagery,” RemoteSensing of Environment, vol. 82, no. 2-3, pp. 311–321, 2002.
[16] P. J. Sellers, “Canopy reflectance, photosynthesis and transpi-ration.,” International Journal of Remote Sensing, vol. 6, no. 8,pp. 1335–1372, 1985.
[17] S. A. Clay, C. G. Carlson, D. E. Clay et al., “Estimating non-harvested crop residue cover dynamics using remote sens-ing,” 2006, http://www.sdstate.edu/index/directory/directory-detail.cfm?...ci.
[18] R. T. Garvin, “Yield estimation—a tool for reducing Losses,”Zimbabwe Tobacco Today, vol. 9, no. 12, pp. 32–35, 19861986.
[19] K. P. Gallo and T. K. Flesch, “Large-area crop monitoringwith the NOAA AVHRR: estimating the silking stage of corndevelopment,” Remote Sensing of Environment, vol. 27, no. 1,pp. 73–80, 1989.
[20] S. Moulin, A. Bondeau, and R. Delecolle, “Combining agri-cultural crop models and satellite observations: from field toregional scales,” International Journal of Remote Sensing, vol.19, no. 6, pp. 1021–1036, 1998.
[21] J. Nowatzki, R. Andres, and K. Kyllo, “Agricultural remotesensing basics,” North Dakota State University Agriculture andUniversity Extension, 2004, http://www.ag.ndsu.edu/.
[22] T. H. Demetriades-Shah, M. D. Steven, and J. A. Clark,“High resolution derivative spectra in remote sensing,” RemoteSensing of Environment, vol. 33, no. 1, pp. 55–64, 1990.
[23] J. L. Hatfield, A. A. Gitelson, J. S. Schepers, and C. L. Walthall,“Application of spectral remote sensing for agronomic deci-sions,” Agronomy Journal, vol. 100, no. 3, pp. S117–S131, 2008.
[24] S. L. Ustin, D. A. Roberts, J. A. Gamon, G. P. Asner, and R.O. Green, “Using imaging spectroscopy to study ecosystemprocesses and properties,” BioScience, vol. 54, no. 6, pp. 523–534, 2004.
[25] C. S. T. Daughtry, C. L. Walthall, M. S. Kim, E. B. De Colstoun,and J. E. McMurtrey, “Estimating corn leaf chlorophyll con-centration from leaf and canopy reflectance,” Remote Sensingof Environment, vol. 74, no. 2, pp. 229–239, 2000.
[26] A. A. Gitelson, M. N. Merzlyak, and O. B. Chivkunova, “Opti-cal properties and non destructive estimation of anthocyanincontent in plant leaves,” Photochemistry and Photobiology, vol.74, pp. 38–45, 2001.
[27] D. Casanova, G. F. Epema, and J. Goudriaan, “Monitoring ricereflectance at field level for estimating biomass and LAI,” FieldCrops Research, vol. 55, no. 1-2, pp. 83–92, 1998.
[28] F. Su, L. Fu, H. Chen, and L. Hong, “Balancing nutrient usefor flue-cured tobacco,” Better Crops, vol. 90, no. 4, pp. 23–25,2006.
[29] T. Endo, T. Okuda, M. Tamura, and Y. Yasuoka, “Estimationof photosynthetic rate of plants from hyperspectral remote

10 ISRN Agronomy
sensing of biochemical content,” in Proceedings of the 21stAsian Conference on Remote Sensing (ACRS ’00), Taipei, Tai-wan, December 2000.
[30] J. L. Fridgen and J. J. Varco, “Dependency of Cotton LeafNitrogen, Chlorophyll, and Reflectance on Nitrogen andPotassium Availability,” Agronomy Journal, vol. 96, no. 1, pp.63–69, 2004.
[31] C. Yang, J. H. Everitt, and J. M. Bradford, “Using high resolu-tion QuickBird satellite imagery for cotton yield estimation,”in ASAE Annual International Meeting 2004, pp. 893–904, can,August 2004.