Selection of Diagnostic Parameters in Return Voltage ... · Selection of Diagnostic Parameters in...
8
Selection of Diagnostic Parameters in Return Voltage Measurements of Medium Voltage Cables RAINER PATSCH and OLEG KOUZMINE Institute of Materials & Diagnostics in Electrical Engineering, University of Siegen Hoelderlinstr. 3, D-57068 Siegen, GERMANY Abstract: The condition of service aged medium voltage cables can be assessed by measuring the dielectric response of the insulation. In time domain this can be done via return voltage or/and depolarization current measurements. The paper deals with the interpretation of experimental results of Return Voltage Measure- ments and discusses the relevance of different measurement conditions and the meaningfulness of the different diagnostic parameters chosen. Special emphasis is taken on the p-factor, a parameter that seems to be ap- propriate for all types of insulating materials. Key words Return Voltage Method, Boundary Polarization, Maxwell-Model, Dielectric Time Constants I. Introduction For transformers, cables and other high voltage equipment the diagnosis of the condition of the insu- lating components is getting more and more impor- tant. A good method to attain this information are Return Voltage Measurements. The experimental procedure is the following: Application of a dc- voltage for the time t p , form a short circuit for the time t d , and measure the voltage that builds up be- tween the external electrodes after the release of the short circuit. Commonly used parameters of the return voltage curves are the peak voltage U m , the time t m of the voltage peak and the initial incline s of the curve. The principle is known since many years [1-3], the measurements are reliable, at least with regard to the collection of the data, unfortunately not always with regard to all methods of interpretation. In addition, return voltage measurements are less sensitive to disturbances by external noise, a situation that is favourable for measurements in the field. The ex- tractable information is comparable to that derived from other dielectric methods like e.g. the measure- ment of polarization and depolarization currents [4, 5]. Commercially two versions of return voltage meas- urements are in use, one with differently long times for polarization and short circuit [6, 7], and the other with a long polarization time and a short circuit time of 2 s [8]. The interpretation of the data is also dif- ferent and unfortunately not oriented towards real physical parameters. Molecular Processes Polarization processes in dielectrics are well known and especially the time dependences of molecular polarization and relaxation processes have been discussed in detail in the past. Molecular polariza- tion processes are very quick and occur in time scales far below the range of seconds, hence no such molecular effects can be expected to have a relevant influence on processes in the time range of tens or hundreds of seconds or more as found in return voltage measurements of commercial power equip- ment. For specimens with sufficiently thick homogeneous insulations and sufficiently low conductivity (mainly organic polymers) in the high field region (several tens of kV/mm up to more than 100 kV/mm) time dependent currents in the time range of several minutes or even hours may be found. These are mainly due to the generation and decrease of space charges within the bulk (in connection with local trapping and detrapping processes of charge carrier) that influence the local field distribu- tion and hence may produce also a current under short circuit conditions [16]. For polymeric materi- als and not too high electric fields usually the 'Cu- rie-Von Schweidler law' [4, 9, 10] n d p t i i − ≈ ~ with n ≤ 1 is found for the 'polarization' and 'depo- larization' currents. Proceedings of the 5th WSEAS Int. Conf. on Power Systems and Electromagnetic Compatibility, Corfu, Greece, August 23-25, 2005 (pp514-521)
Transcript of Selection of Diagnostic Parameters in Return Voltage ... · Selection of Diagnostic Parameters in...

Selection of Diagnostic Parameters in Return Voltage Measurements of Medium Voltage Cables
RAINER PATSCH and OLEG KOUZMINE
Institute of Materials & Diagnostics in Electrical Engineering, University of Siegen Hoelderlinstr. 3, D-57068 Siegen, GERMANY
Abstract: The condition of service aged medium voltage cables can be assessed by measuring the dielectric response of the insulation. In time domain this can be done via return voltage or/and depolarization current measurements. The paper deals with the interpretation of experimental results of Return Voltage Measure-ments and discusses the relevance of different measurement conditions and the meaningfulness of the different diagnostic parameters chosen. Special emphasis is taken on the p-factor, a parameter that seems to be ap-propriate for all types of insulating materials. Key words Return Voltage Method, Boundary Polarization, Maxwell-Model, Dielectric Time Constants
I. Introduction For transformers, cables and other high voltage equipment the diagnosis of the condition of the insu-lating components is getting more and more impor-tant. A good method to attain this information are Return Voltage Measurements. The experimental procedure is the following: Application of a dc-voltage for the time tp, form a short circuit for the time td, and measure the voltage that builds up be-tween the external electrodes after the release of the short circuit. Commonly used parameters of the return voltage curves are the peak voltage Um, the time tm of the voltage peak and the initial incline s of the curve. The principle is known since many years [1-3], the measurements are reliable, at least with regard to the collection of the data, unfortunately not always with regard to all methods of interpretation. In addition, return voltage measurements are less sensitive to disturbances by external noise, a situation that is favourable for measurements in the field. The ex-tractable information is comparable to that derived from other dielectric methods like e.g. the measure-ment of polarization and depolarization currents [4, 5]. Commercially two versions of return voltage meas-urements are in use, one with differently long times for polarization and short circuit [6, 7], and the other with a long polarization time and a short circuit time of 2 s [8]. The interpretation of the data is also dif-ferent and unfortunately not oriented towards real physical parameters.
Molecular Processes Polarization processes in dielectrics are well known and especially the time dependences of molecular polarization and relaxation processes have been discussed in detail in the past. Molecular polariza-tion processes are very quick and occur in time scales far below the range of seconds, hence no such molecular effects can be expected to have a relevant influence on processes in the time range of tens or hundreds of seconds or more as found in return voltage measurements of commercial power equip-ment. For specimens with sufficiently thick homogeneous insulations and sufficiently low conductivity (mainly organic polymers) in the high field region (several tens of kV/mm up to more than 100 kV/mm) time dependent currents in the time range of several minutes or even hours may be found. These are mainly due to the generation and decrease of space charges within the bulk (in connection with local trapping and detrapping processes of charge carrier) that influence the local field distribu-tion and hence may produce also a current under short circuit conditions [16]. For polymeric materi-als and not too high electric fields usually the 'Cu-rie-Von Schweidler law' [4, 9, 10]
ndp tii −≈ ~
with n ≤ 1 is found for the 'polarization' and 'depo-larization' currents.
Proceedings of the 5th WSEAS Int. Conf. on Power Systems and Electromagnetic Compatibility, Corfu, Greece, August 23-25, 2005 (pp514-521)

Formal equivalent circuit The analysis of return voltage curves or of polariza-tion and depolarisation currents over time is often done by a numerical fit on the basis of equivalent circuits consisting of three or more RC series-elements with different time constants in parallel. Fig. 1 shows such a standard circuit. This equivalent circuit is physically adequate for the description of an insulating material that contains molecules with different polarizabilities. For other processes such as e.g. the built-up of space charges or boundary polarization processes in such an equivalent circuit is just a tool for a mathematical fit.
Fig. 1: Commonly used equivalent circuit of a di-electric for the description of polarization processes (after [4]) In the following some basic facts of multilayer insu-lations and their consequences for the interpretation of data from measurements of commercial power equipment will be discussed. Boundary polarization The insulation of classic power equipment such as oil filled cables or power transformers with pa-per-oil-insulation consists of different insulating materials with different dielectric properties (εr and σ) and thus – in addition to molecular processes in the short time range – shows the phenomenon of boundary polarization, i.e. the accumulation of charge carriers at the boundaries between the differ-ent dielectrics. An appropriate description of the dielectric situation in a hv transformer with paper-oil insulation is given by the XY-model [17, 18], that describes the differ-ent geometries of the different dielectric materials contained in the insulation. The potential difference between electrodes on hv potential and grounded parts is bridged by different dielectric materials, thus producing a voltage distribution that is deter-mined by capacitive and ohmic components in the
current. For a cable with paper-oil insulation the geometric situation is less complicated, because there is only one type of dielectric consisting of a mixture of cellulose and oil, there exists no area with oil only.
Fig. 2: Segment of transformer insulation and XY-model of the transformer insulation with paper-oil-dielectric (after [18]) Dielectric behaviour If a dc-voltage is applied to the external electrodes of such a system, starting with a capacitive voltage distribution, a continuous change into a resistive voltage distribution occurs. Electric charges move within the different dielectrics and in part accumu-late at the interfaces, where they generate local electric fields that are necessary to fulfil the conti-nuity equation for the current density. During this time interval a current with a time dependence simi-lar to the 'Curie-Von Schweidler law' occurs. In some cases a current without time dependence is superimposed. After removal of the poling voltage, during the short circuit a release of the charges at the external electrodes takes place and the locally accumulated charges move within the dielectric materials, thus producing a discharge current. After the release of the short circuit this current generates a voltage difference between the two external electrodes, that first increases, surpasses a maximum and decreases again, thus producing the Return Voltage Curve. In so far no single molecu-lar polarization or depolarization processes are re-sponsible for the experimentally found behaviour during return voltage measurements. Hence it seems
Proceedings of the 5th WSEAS Int. Conf. on Power Systems and Electromagnetic Compatibility, Corfu, Greece, August 23-25, 2005 (pp514-521)

to be necessary to question the meaningfulness of the application of the equivalent circuit shown in Fig. 1, although it is obvious that any curve with the time dependence described can be fitted with this equivalent circuit, but the question is, if there is any real physical meaning in the fit coefficients. II. Maxwell Model For boundary polarization – and this is the rele-vant process in power equipment with paper-oil insulation – another equivalent circuit, the Max-well-Model with two RC parallel-circuits in se-ries, is more appropriate, because it closely repro-duces the physical reality. Fig. 3 shows the basic equivalent circuit. This circuit is in good correspon-dence with the model shown in Fig. 2 that is dis-cussed in the literature for transformers [7].
Fig. 3: Equivalent circuit of a paper-oil-dielectric and basic measuring circuit
The time constants τ2 = R2C2 and τ1 = R1C1 of the two RC-parallel elements correspond to the dielec-tric time constants of the two dielectrics cellulose and oil and Rm is the resistance of the measuring circuit, hence there is a physical relevance.
Fig. 4: Correlation between the two basic equivalent circuits for a paper-oil-dielectric: a) the Maxwell circuit and b) the corresponding formal equivalent circuit
As mentioned already, for a purely formal descrip-tion also an equivalent circuit with the RC series-elements is possible [11]. Fig. 4 shows the two cor-responding circuits. The numerical values of the elements in Fig. 4b) are correlated to the RC parallel-elements in the Max-well-Model, but the physical meaning is lost. For the numerical values of the formal equivalent circuit we find:
21
21
CCCC
C+
= , 21 RRR += ,
)()()(
212
21
21122
CCRRCRCR
C s++
−= ,
21122
2212121
)()()(
CRCRCCRRRR
Rs−
++= ,
21
2121 )(RR
CCRRs +
+=τ
It is worth mentioning that the possibility of a for-mal fit of the data with the circuit shown in Fig. 4b) does not mean that the description is a direct repre-sentation of a real physically process. The time con-stants τ1 and τ2 in the circuit shown in Fig. 4a) cor-respond to the physical dielectric time constants of the two dielectrics. There is no direct physical corre-spondence in the elements Rs, Cs and τs of the RC series-circuit with regard to the different dielectric materials paper and oil, and it is hard to derive any conclusions from their numerical values. Especially the physically relevant dielectric time constants τ1 and τ2 of the insulating materials cannot be calcu-lated from the RC series elements. To have more possibilities for a numerical fit, usu-ally formal equivalent circuits with three or more RC series elements in parallel are used. The physi-cal correspondence would be two or more Maxwell circuits with different time constants in parallel. This might be necessary for a more sophisticated analysis for the interpretation of measurements per-formed in network circuits containing different cables or joints that behave different. In this case the absolute values of the capacitors in the parallel Maxwell circuits determine the 'dominant' values of the time constants.
Proceedings of the 5th WSEAS Int. Conf. on Power Systems and Electromagnetic Compatibility, Corfu, Greece, August 23-25, 2005 (pp514-521)

Numerical simulations with two Maxwell equivalent circuits in parallel showed the possibility to simulate experimentally found return voltage curves by choosing appropriate numerical values of the ele-ments of the circuits. Evaluation of the Maxwell equivalent circuit As a first step the analysis of the results of return voltage measurements can be done on the basis of just one Maxwell-Model. After the application of a dc-voltage, the system starts with a capacitive volt-age division of the poling voltage Up between U1 and U2, that gradually changes into an ohmic divi-sion in accordance to R1 and R2. During the short circuit, charges are exchanged between the two ca-pacitors until the voltages across the capacitors C1 and C2 are identical. During short circuit conditions this voltage decreases simultaneously for both ca-pacitors with a time constant τ. After the release of the short circuit the voltages at both capacitors de-crease independently with the time constants τ1 and τ2. Fig. 5 shows the voltage changes over time for the different time intervals during the return voltage measurement.
t in s
U in
V
U2(t)
U1(t)
Up
0
tp measurementpolarization
shorttd
Ur(t)
U2(t)
U1(t)
circuit Fig. 5: Voltages across the capacitors C1 and C2 during polarization, short circuit and return voltage measurement for τ1 < τ2 The important point for a meaningful interpreta-tion of the measured data is the selection of the parameters used for the diagnosis. As mentioned already the parameters usually taken for the diagno-sis are the initial incline s of the return voltage curve, the maximum Um of the return voltage and the time tm of this maximum or the dependence of these parameters on the height of the poling voltage Up.
Empirically a large variation of these parameters is found without a 'straight forward correlation' like a monotonous tendency of the parameters with age-ing. Under the assumption that the resistance Rm of the voltage measurement system is significantly higher than the resistors R1 and R2, the maximum Um, the initial incline s and the time tm of the maximum can be easily calculated analytically [13]. For the equivalent circuit shown in Fig. 3 we find:
eeUtUtUtUt
t
sr ⎟⎟
⎠
⎞
⎜⎜
⎝
⎛−=+=
−−12)()()( 21ττ
with ,111 CR=τ 222 CR=τ and 12 /ττλ = If Rm is not considerably larger than R1 and R2, the shape of the return voltage curve is also the sum of two exponential functions, but – as a consequence of the coupling of the two RC-elements via Rm – the time constants τ1' and τ2' are different from the val-ues R1C1 and R2C2 [19]. For the voltage across the two capacitors after a poling time tp and a short circuit time td we find:
( ) ττ
λ
λ //11
1
1
2
1
2
dp ttp
CC
RRs eeUU −−−
+++
−= with
21
2112
RRRR
++
=τττ
τ is the time constant of the system and identical with τs in Fig. 4b). Obviously Us depends in a com-plex manner on the elements of the equivalent cir-cuit that are determined by the actual geometry and the dielectric properties of the insulating materials used. Starting from the physical ageing processes in pa-per-oil dielectrics, due to the chemical degradation processes a decrease of the dielectric time constants τ1 and τ2 will occur. Especially τ2, the time constant of the cellulose, will decrease, because water is gen-erated as a by-product of the degradation of pa-per and accumulated in the cellulose. This leads to a marked decrease of the conductivity and hence the dielectric time constant τ2 of the paper. Some of the water will be diluted in the oil, but the amount is far less than the amount in the paper. For the equilib-rium distribution and further details see [12].
Proceedings of the 5th WSEAS Int. Conf. on Power Systems and Electromagnetic Compatibility, Corfu, Greece, August 23-25, 2005 (pp514-521)

III. Diagnostic parameters
Um/s over tm and the p-factor
The classical diagnostic parameters Um and s con-tain Us as a factor and a function of the ratio λ = τ2/τ1. The time tm of the voltage maximum depends on τ1 and a function of the factor λ = τ2/τ1.
( ))1/()1/(1 λλλ λλ −− −= sm UU
⎟⎟⎠
⎞⎜⎜⎝
⎛ −=
λλ
τ1
1
sUs
λλλτ ln
11 ⎟⎟⎠
⎞⎜⎜⎝
⎛−
=mt
The ratio Um/s does not depend on Us but only on τ1 and a function of the factor λ = τ2/τ1 Hence geomet-ric influences on the diagnostic parameters disap-pear.
( ))1/()1/(11 1
λλλ λλλλτ −− −−
=s
U m In addition to the use of the standard plots of Ur over t as a first documentation of the measurement result, a more effective characterization of the re-sults of return voltage measurements can be made by the analysis of the dependence between the two parameters Um/s and tm. Both parameters contain τ1 and depend only on the ratio λ = τ2/τ1. The ratio between the two parameters can be taken as a new parameter p [14]. The p-factor defined as
λλλ λλλ
ln
)1/()1/(1 −− −==
m
m
tsU
p
eliminates not only the factor Us − since s is in-versely and tm is directly proportional to τ1 − but depends only on the ratio λ = τ2/τ1 of the two time constants instead on R1, C1, R2 and C2 separately. Hence the p-factor is not only independent of the geometric dimensions of the two dielectrics but also independent of all parameter changes that influence τ1 and τ2 in the same way. This holds - at least in first approximation - e.g. for the influence of the temperature of the measured object. This may be important if measurements performed in different seasons of the year are compared. In addition the p-factor is also independent of the height of the pol-ing voltage, because both, s and Um are proportional to Up.
Evaluation of the time constants τ1 and τ2
A very interesting and unique possibility of the in-terpretation of the experimental results on the basis of the Maxwell-Model is the possibility to use the dependence of Um/s on tm to calculate the conduc-tivity the time constants τ1 and τ2 of the two dielec-trics in the elements of the equivalent circuit. These time constants are proportional to εr / σ (the ratio of the dielectric constant and the specific conductivity) of the dielectrics and are sensitive on changes of the dielectric constant εr and σ, whereby for cellulose materials the specific conductivity σ is very sensi-tive on the contents of water. In the case of paper-oil-insulations one of the main parameters in the ageing process is the water contents of the paper, that on one hand accelerates ageing and on the other hand appears as a degradation product. Hence the ageing process significantly influences the corresponding dielectric time constant. IV. Analysis of the influence of differ-ent parameters
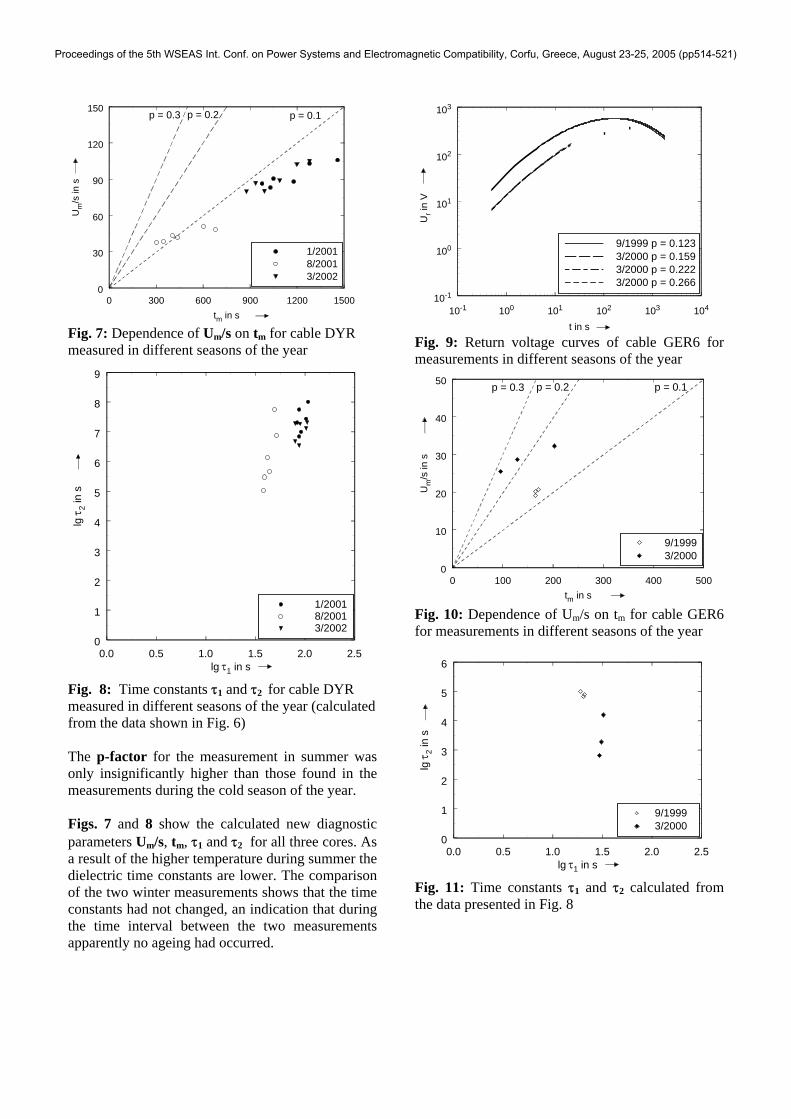
Influence of the ambient temperature It is known that - like other dielectric measurements - return voltage curves are influenced by the tem-perature of the measured object, an effect that must be taken care of [15]. Figs. 6 to 8 show results from three measurements of a cable in different seasons of the year and possibilities for the evaluation of the experimental data. Fig. 5 shows that the return volt-age curve (shown for one core only) was signifi-cantly higher in the measurement that was per-formed in summer. The two curves from the meas-urements in winter are nearly identical.
10-1 100 101 102 103 104
t in s
10-1
100
101
102
103
Ur i
n V
1/2001 p = 0.0818/2001 p = 0.0963/2002 p = 0.081
Fig. 6: Return voltage curves of cable DYR for measurements in different seasons of the year
Proceedings of the 5th WSEAS Int. Conf. on Power Systems and Electromagnetic Compatibility, Corfu, Greece, August 23-25, 2005 (pp514-521)
0 300 600 900 1200 1500tm in s
0
30
60
90
120
150
Um
/s in
s
p = 0.3 p = 0.1p = 0.2
1/20018/20013/2002
Fig. 7: Dependence of Um/s on tm for cable DYR measured in different seasons of the year
0.0 0.5 1.0 1.5 2.0 2.5lg τ1 in s
0
1
2
3
4
5
6
7
8
9
lg τ
2 in
s
1/2001 8/2001 3/2002
Fig. 8: Time constants τ1 and τ2 for cable DYR measured in different seasons of the year (calculated from the data shown in Fig. 6) The p-factor for the measurement in summer was only insignificantly higher than those found in the measurements during the cold season of the year. Figs. 7 and 8 show the calculated new diagnostic parameters Um/s, tm, τ1 and τ2 for all three cores. As a result of the higher temperature during summer the dielectric time constants are lower. The comparison of the two winter measurements shows that the time constants had not changed, an indication that during the time interval between the two measurements apparently no ageing had occurred.
10-1 100 101 102 103 104
t in s
10-1
100
101
102
103
Ur i
n V
9/1999 p = 0.1233/2000 p = 0.1593/2000 p = 0.2223/2000 p = 0.266
Fig. 9: Return voltage curves of cable GER6 for measurements in different seasons of the year
0 100 200 300 400 500tm in s
0
10
20
30
40
50
Um
/s in
s
p = 0.1p = 0.2p = 0.3
9/19993/2000
Fig. 10: Dependence of Um/s on tm for cable GER6 for measurements in different seasons of the year
0.0 0.5 1.0 1.5 2.0 2.lg τ1 in s
50
1
2
3
4
5
6
lg τ
2 in
s
9/19993/2000
Fig. 11: Time constants τ1 and τ2 calculated from the data presented in Fig. 8
Proceedings of the 5th WSEAS Int. Conf. on Power Systems and Electromagnetic Compatibility, Corfu, Greece, August 23-25, 2005 (pp514-521)

Influence of ageing For another cable the effect of ageing was clearly visible. In the first measurement the three cores showed identical return voltage curves. 6 months later the curves were different (see Fig. 9). Addi-tional measurements showed that for two of the three cores the resistance had decreased below 1 GΩ. The p-factor had increased significantly and especially the time constant τ2 of the 'solid part' of the insulation (the cellulose material) had decreased. Figs. 10 and 11 show the corresponding data. Inter-estingly the time constant τ1 (correlated to the oil) had not changed, while the time constant τ2 (corre-lated to the paper) had decreased significantly but differently for the three cores. Influence of the measurement resistor Rm
As long as the resistance Rm of the voltage meas-urement system is significantly higher than the inner resistances of the measured object - symbolized by the resistors R1 and R2 in the equivalent circuit - the return voltage curve can be calculated analytically and described as the sum of two exponential func-tions. If this assumption is not true, Rm leads to a coupling of the voltages across the two capacitors C1 and C2. The initial incline s of the voltage curve is not influenced by this effect, but the further shape. Lower resistances Rm tend to decrease the maximum of the return voltage curve and to shift it to earlier times. Fig. 12 shows results from meas-urements of return voltage curves one core of a pa-per-oil-insulated cable with different measuring resistors Rm = 10 GΩ, 5 GΩ and 2 GΩ. Fig. 12 shows the corresponding graph of for the Um/s over tm plot for all three cores. Interestingly the data points lie on a monotonously increasing curve. Fig. 14 shows the graph of τ2 over τ1. τ1 is unchanged, τ2 decreases with decreasing Rm. Influence of the polarization time In order to examine the influence of the polarization time on the values of the diagnostic parameters, the measurements displayed in Fig. 13 and Fig. 14 have been made with 600, 900 and 1200 s polarization time respectively. The polarization time influences the different pa-rameters differently. The initial incline s shows only a minor change, while the voltage maximum Um and the time of the maximum tm clearly increase with the polarization time tp. The calculated time constants τ1 and τ2 show a negligible influence for τ1 and a
small increase of τ2 with tp. In most cases the p-factor shows a small decrease with increasing po-larization time.
10-1 100 101 102 103 104
t in s
10-1
100
101
102
103
Ur i
n V
Rm = 10 GOhmRm = 5 GOhmRm = 2 GOhm
Fig. 12: Return voltage curves of cable S2 for measurements with different measurement resistors
0 30 60 90 120 150tm in s
0
10
20
30
40
50
Um
/s in
s
p = 0.3
p = 0.2
Rm=10 GOhmRm= 5 GOhmRm= 2 GOhm
p = 0.1
Fig. 13: Dependence of Um/s on tm for cable S2 for measurements with different measurement resis-tances
0.0 0.5 1.0 1.5 2.0 2.5lg τ1 in s
0
1
2
3
4
lg τ
2 in
s
Rm=10 GOhmRm= 5 GOhmRm= 2 GOhm
Fig. 14: Time constants τ1 and τ2 calculated from data shown in Fig. 12
Proceedings of the 5th WSEAS Int. Conf. on Power Systems and Electromagnetic Compatibility, Corfu, Greece, August 23-25, 2005 (pp514-521)

A practical consequence of the observed minor de-pendence of relevant parameters on the polarization time is that the total time of the measurement neces-sary to assess the condition of the cable insulation can be reduced. Practical results show that 15 min are sufficient in most cases. The changes compared to tp = 30 min are not very significant. V. Conclusions The Return Voltage Method is capable of detect-ing changes in the dielectric properties of composite insulations and hence ageing processes in paper-oil insulated medium voltage cables or transformers can be monitored. The application of the Return Voltage Method is possible for all multi layer systems that include insulations with different dielectric proper-ties, and that show the phenomenon of boundary polarization. The evaluation of the data on the basis of the Maxwell-Model allows a meaningful interpre-tation. The p-factor has proven to be a reliable parameter to characterize the ageing of paper-oil insulations. In contrast to other parameters, by the temperature of the measured object the p-factor is only slightly influenced. The evaluation of the correlation be-tween Um/s and tm can be used to calculate the di-electric time constants τ1 and τ2 of the insulation materials that are a good indicator for ageing proc-esses or the contents of water in the dielectrics. VI. References [1] Németh, E.: Zerstörungsfreie Prüfung von Isolatio-
nen mit der Methode der Entlade- und Rückspan-nungen. IWK'66, Ilmenau, Germany, (1966), 87-91
[2] Bognar, A.; Kalocsai, L.; Csepes, G.; Nemeth, E.; Schmidt, J: Diagnostic Tests of High Voltage Oil-Paper Insulting Systems (In Particular Transformer Insulation) using DC Dielectrometrics, CIGRE'90, Paris, France, (1990), 15/33-08
[3] Németh, E.: Practical experiences of diagnostic test-ing of power cable lines by the voltage-response method. IWK'95, Ilmenau, Germany, (1995), 699-708
[4] Zaengl, W. S.: Dielectric Spectroscopy in Time and Frequency Domain for HV Power Equipment, Part I: Theoretical Considerations. IEEE EI-Mag., 19, No. 5, (2003), 5-19
[5] Zaengl, W. S.: Applications of Dielectric Spectros-copy in Time and Frequency Domain for HV Power Equipment. IEEE EI-Mag., 19, No. 6, (2003), 9-22
[6] Urbani, G.M.; Brooks, R.S.: Using the Recovery Voltage Method to evaluate Aging in Oil-Paper In-sulation. ICSD'98, Västeras, Sweden, (1998), 93-7
[7] Houhanessian, V.D.: Measurement and Analysis of Dielectric Response in Oil-Paper Insulations Sys-tems. PhD-Thesis, ETH Zürich, Switzerland, (1998)
[8] Beigert, M.; Kamenka, D.; Kouzmine, O.: Dielek-trische Alterungsdiagnose an Öl-Papier-Iso-lierungen. EVU-Betriebspraxis, 10, (2000), 22-30
[9] Curie, J. : Recherches sur la conductivité des corps cristallisés. Ann. De Chimie et de Physique, Sixième Série, Tome 18, (1889), 203-269
[10] E. v. Schweidler: Studien über die Anomalien im Verhalten der Dielektrika. Ann. D. Physik, 4. Folge, Bd. 24. (1907), 711-70
[11] Alekseev, B. A.: A new method for detecting mois-ture in the insulation of transformer windings. Elek-trichestvo, No.2, (1959),58-63
[12] Oommen, T.V.: Moisture Equilibrium Charts for Transformer Drying Practice. IEEE Trans. on PAS, Vol.103, (1984), 3063-67
[13] Böning, P.: Bemerkenswerte Zusammenhänge zwi-schen den anomalen Strömen, dem Verlustfaktor, der scheinbaren Kapazität und der Rückspannung bei Isolierstoffen. Z. f. techn. Physik, Nr. 8, (1938), 241-7
[14] Patsch, R.; Kouzmine, O.: p-Factor, a Meaningful Parameter for the Evaluation of Return Voltage Measurements. CEIDP'02, Cancun, Mexico, (2002), 906-9
[15] Patsch, R.; Kouzmine, O.: The Influence of Climatic Conditions on the Diagnostic Results of Return Voltage Measurements. ISEI'02, Boston, USA, (2002), 191-4
[16] Patsch, R.: Space Charge Phenomena in Polyethyl-ene at High Electric fields. J. Phys. D: Appl. Phys., 23, (1990), 1495-1505
[17] Gäfvert, U.: Adeen, L.,Tapper, M., Ghasemi, P., Jönsson, B.: Dielectric Spectroscopy in Time and Frequency Domain Applied to Diagnostics of Power Transformers. ICPADM'2000 ,Xian, China, (2000), 825-30
[18] Gäfvert, U, : Influence of Geometric Structure and Material Properties on Dielectric Frequency Re-sponse of Composite Oil Cellulose Insulation. ISEIM'05, Kitakyushu, Japan (2005), 73-6
[19] Patsch, R.; Kouzmine, O.: The Influence of the Ambient Temperature on the Diagnostic Response of Paper-Oil Insulated Cables. APTADM’01, Wro-claw, Poland, (2001), 34-7
Proceedings of the 5th WSEAS Int. Conf. on Power Systems and Electromagnetic Compatibility, Corfu, Greece, August 23-25, 2005 (pp514-521)