The Best Mutual Fund Managers: Testing the Impact of Experience Using a Survivorship-bias Free
Upload
truonghanhCategory
view
224download
1
© 2016. Bilal Ahmad Pandow. This is a research/review paper, distributed under the terms of the Creative Commons Attribution-Noncommercial 3.0 Unported License http://creativecommons.org/licenses/by-nc/3.0/), permitting all non-commercial use, distribution, and reproduction in any medium, provided the original work is properly cited.
Selection Abilities of Select Indian Mutual Fund Managers By Bilal Ahmad Pandow
Abstract- The stock selection is considered to be the core of the investment process. This
involves identifying and selecting undervalued securities which are expected yield good results in the future. In practice fund managers are expected to earn superior returns for unit holders consistently as being professionals therefore possession of superior skills to collect and analyze the data with the purpose to select the right type of securities for the portfolio is a must for them. The present work is based on the review of many studies both foreign and Indian studies relating to mutual funds. The mutual fund industry in India consists of public sector, private sector and foreign funds. All the three sectors are studied to analyse the selectivity performance on the basis of sponsorship of funds. However, from these only active funds belongings to Growth, Income, Balanced and Tax-Saving Schemes were selected for the study. In this paper stock selectivity skills of sample fund managers were tested using Jensen’s Alpha and Fama’s net selectivity measures models.
Keywords: stock selection, mutual funds, growth, income, balanced and tax-saving schemes.
GJMBR-C Classification: JEL Code:
G20
SelectionAbilitiesofSelectIndianMutualFundManagers
Strictly as per the compliance and regulations of:
Global Journal of Management and Business Research: CFinanceVolume 16 Issue 8 Version 1.0 Year 2016 Type: Double Blind Peer Reviewed International Research JournalPublisher: Global Journals Inc. (USA)Online ISSN: 2249-4588 & Print ISSN: 0975-5853

© 20 16 Global Journals Inc. (US)
53
Globa
l Jo
urna
l of M
anag
emen
t an
d Bu
siness Resea
rch
Volum
e XVI Issu
e VIII
Ver
sion
IYe
ar
()
2016
C
Bilal Ahmad Pandow
Selection Abilities of Select Indian Mutual Fund Managers
Abstract- The stock selection is considered to be the core of the investment process. This involves identifying and selecting undervalued securities which are expected yield good results in the future. In practice fund managers are expected to earn superior returns for unit holders consistently as being professionals therefore possession of superior skills to collect and analyze the data with the purpose to select the right type of securities for the portfolio is a must for them. The present work is based on the review of many studies both foreign and Indian studies relating to mutual funds. The mutual fund industry in India consists of public sector, private sector and foreign funds. All the three sectors are studied to analyse the selectivity performance on the basis of sponsorship of funds. However, from these only active funds belongings to Growth, Income, Balanced and Tax-Saving Schemes were selected for the study. In this paper stock selectivity skills of sample fund managers were tested using Jensen’s Alpha and Fama’s net selectivity measures models.
The present work is based on the review of tens of studies both foreign and Indian studies relating to mutual funds. The mutual fund industry in India consists of public sector, private sector and foreign funds. All the three sectors were studied to compare the selectivity and timing performance on the basis of sponsorship of funds. However, from these only active funds belongings to Growth, Income, Balanced and Tax-Saving Schemes were selected for the study. In this paper stock selectivity skills of sample fund managers were tested by using Jensen’s Alpha and Fama’s net selectivity measure.Keywords: stock selection, mutual funds, growth, income, balanced and tax-saving schemes.
I. Introduction
ndian Mutual Fund Industry consists of public sector, private sector and foreign funds. In the present paper all the three sectors were studied to compare the
selectivity and timing performance on the basis of sponsorship of funds. However, from these only active funds belongings to Growth, Income, Balanced and Tax-Saving Schemes were selected for the study.
The period of study is five years from April 2007 to 31st March 2011. The rationale for selecting the study period of 5-years from 1st April 2007 to 31st March 2011 stems from two reasons. Firstly, during this period, the stock market experienced higher volatility, as such chosen to find-out whether the funds have succeeded in surpassing the market performance even under depressed market conditions. Secondly, the five years
were long enough to capture different market phases and to draw meaningful conclusions.
Since large number of schemes were in existence during the period of the study, as such due totime and other constraints, it was not possible to study all the schemes. It is in view of this fact, an adequate and representative sample was drawn from the universe using convenience sampling method. Initially, the study viewed 76 schemes out of 587 schemes existing as on 1st April 2007, however, the availability of consistent data during the study period (April 2007 to March 2011) was available for 40 schemes only, as such the final sample size for the present study was reduced to 40 schemes, accounting for around 7 percent of the total schemes. These schemes belonged to 19 fund houses consisting of all the three sectors viz. public sector, private sector foreign funds, Of the total sample size of 40 schemes, 33 schemes belonged to the private sector and 7 to the public sector including UTI. Further, 37 schemes are open-ended and 3 schemes are close-ended in nature. Aim wise, the sample consisted of 28 Growth Schemes, 3 Income Schemes, 3 Balanced Funds and 6 Tax-Saving Schemes.
Stock selectivity skills of sample fund managers were tested by using Jensen’s Alpha and Fama’s net selectivity measure. Jensen (1968) developed an absolute measure based on Capital Asset Pricing Model (CAPM) to regress the excess returns of a portfolio on the market factor. Assuming that market beta or slope co-efficient is constant then the unconditional Alpha is a measure of average performance as in Jensen (1968). The absolute regression equation is based on the assumption that the funds systematic risk is stationary over time. Owing to this assumption, Jensen’s measurement model attributes funds overall performance to manager’s selectivity performance exclusively.
As such mutual funds are expected to perform better than the market, therefore calls for a continuous evaluation of the performance of funds. The assessment of fund manager’s performance is important for two reasons: one it enables investors to allocate investible funds into different funds efficiently second it influences the compensation of fund managers. From an academic perspective, the goal of identifying superior fund managers is interesting because it challenges the efficient market hypothesis. The present study analyses stock selectivity skills of Mutual Fund Managers in India.
I
Author: Senior Lecturer, Department of Management Studies, Middle East College. e-mail: [email protected]

54
Globa
l Jo
urna
l of M
anag
emen
t an
d Bu
siness Resea
rch
Volum
e XVI Issu
e VIII
Ver
sion
IYe
ar
()
2016
© 2016 Global Journals Inc. (US)1
C
II. Literature Review
On this subject many studies have been conducted world over to examine the investment performance of managed portfolio. The ability of mutual fund managers to time the market, that is, to increase a fund’s exposure to the market index prior to market advances and to decrease exposure prior to market declines has remained the subject matter for researchers. A critical review of the studies on stock selection ability of mutual funds has been undertaken which becomes essential to know what the existing literature has to say about the stock selectivity skills of fund managers.
An extensive and systematic study was made by Friend, et al., (1962) of 152 mutual funds and found that mutual fund schemes earned an average annual return of 12.4 percent, while their composite benchmark earned a return of 12.6 percent. Their alpha was negative with 20 basis points. Overall results did not suggest widespread inefficiency in the industry. Further comparison of fund returns with turnover and expense categories did not reveal a strong relationship.
Irwin, Brown, FE (1965) analyzed issues relating to investment policy, portfolio turnover rate, performance of mutual funds and its impact on the stock markets. The study has revealed that mutual funds had a significant impact on the price movement in the stock market. Also concludes that, on an average, funds did not perform better than the composite markets and there was no persistent relationship between portfolio turnover and fund performance.
The performance of 57 fund managers was evaluated by Treynor and Mazuy (1966) in terms of their market timing abilities and have found that fund managers had not successfully outguessed the market. The results suggested that, investors were completely dependent on fluctuations in the market. Further found that the improvement in the rates of return was due to the fund managers’ ability to identify under-priced industries and companies. The study adopted Treynor’s (1965) methodology for reviewing the performance of mutual funds.
A composite portfolio evaluation technique concerning risk-adjusted returns was developed by Jensen (1968). He evaluated the ability of 115 fund managers in selecting securities during the period 1945-66. Analysis of net returns indicated that, 39 funds had above average returns, while 76 funds yielded abnormally poor returns. Using gross returns, 48 funds showed above average results and 67 funds below average results. On the basis of this study Jensen has concluded that, there was very little evidence that funds were able to perform significantly better than expected as fund managers were not able to forecast securities price movements.
The methods to distinguish observed return due to the ability to pick up the best securities at a given level of risk from that of predictions of price movements in the market was developed by Fama (1972). He introduced a multi-period model allowing evaluation on a period-by-period and on a cumulative basis. He branded that, return on a portfolio constitutes return for security selection and return for bearing risk. His contributions combined the concepts from modern theories of portfolio selection and capital market equilibrium with more traditional concepts of good portfolio management. The investment performance of 40 funds was analyzed by Klemosky (1973) based on quarterly returns during the period 1966-71. He acknowledged that, biases in Sharpe, Treynor, and Jensen’s measures, could be removed by using mean absolute deviation and semi-standard deviation as risk surrogates compared to the composite measures derived from the CAPM.
Gupta Ramesh (1989) evaluated fund performance in India comparing the returns earned by schemes of similar risk and similar constraints. An explicit risk-return relationship was developed to make comparison across funds with different risk levels. His study decomposed total return into return from investors risk, return from managers’ risk and target risk. Mutual fund return due to selectivity was decomposed into return due to selection of securities and timing of investment in a particular class of securities.
The present work is based on the review of tens of studies both foreign and Indian studies relating to mutual funds. The review of foreign studies ensures that, mutual funds have a significant impact on the price movement in the stock market, the average return from the schemes were below that of their benchmark, all the three models provided identical results, good performance were associated with low expense ratio and not with the size.
The aforementioned studies indicate that the evaluation of mutual funds has been a matter of concern in India for the researchers, academicians, fund managers and financial analysts to a greater extent after 1985. The reviews bring to light the importance of mutual funds in the Indian financial scenario; highlight the need for adequate investor protection, singleregulatory authority, higher return for a given risk as per investors’ expectation, greater convenience and liquidity, and the expectations that mutual funds should act as a catalytic agent of economic growth and foster investors’ interest.
III. Objectives of the Study
The study is aimed to achieve the following specific objectives:1. To assess whether the Indian fund managers
possess the stock selection ability.
Selection Abilities of Select Indian Mutual Fund Managers

© 20 16 Global Journals Inc. (US)
55
Globa
l Jo
urna
l of M
anag
emen
t an
d Bu
siness Resea
rch
Volum
e XVI Issu
e VIII
Ver
sion
IYe
ar
()
2016
C
2. To study the consistency in the selectivity of fund managers.
3. To examine whether the selectivity varies with the fund characteristics.
4. To find out whether there exists relationship between different evaluation criterions used to measure selectivity performance.
IV. Hypotheses
In line with the above stated objectives, the following hypotheses are laid in order to provide a direction to the study:
a) Stock Selection SkillsH1: There is no positive selectivity performance among Indian Fund Managers across measurement criteriaH2: There is short term persistence in the selectivity performance of fund managers across the various measurement criteria, but in the long run no such persistence exists across the two measurement criteriaH3: There is no significant difference in the selectivity performance across different fund characteristics H4: There exists significant relationship between different selectivity evaluation criterions
V. Methodology
To test the above hypothesis, the data set used is secondary in nature which was collected from the database of AMFI for Net Asset Value (NAV), National Stock Exchange (NSE) for S&P CNX Nifty and RBI for risk free rate. Fund returns were calculated on the basis of daily NAVs rather than monthly NAVs for the reason that research has revealed that the high frequency data such as daily NAVs have more revealing power than less frequency data. Further, the daily returns so obtained were annualized using geometric averaging to obtain average annual fund return.
The yields on 91-day treasury bills issued by Reserve Bank of India (RBI) have been used as a proxy for risk-free return. Besides, S&P CNX Nifty is used as surrogate for the market portfolio/return as well as for bench-mark variability.
VI. Scope and Reference Period of the Study
The mutual fund industry in India consists of public sector, private sector and foreign funds. All the three sectors were studied to compare the selectivity and timing performance on the basis of sponsorship of funds. However, from these only active funds belongings to growth, Income, Balanced and Tax-Saving Schemes were selected for the present study.
The period of study is five years from April 2007 to 31st March 2011. The rationale for selecting the study period of 5-years from 1st April 2007 to 31st March 2011
stems from two reasons. Firstly, during this period, the stock market experienced higher volatility, as such chosen to find-out whether the funds have succeeded in surpassing the market performance even under depressed market conditions. Secondly, the five years were long enough to capture different market phases and to draw meaningful conclusions.
VII. sample design
Since large number of schemes were in existence during the period of the study, as such due to time and other constraints, it was not possible to study all the schemes. It is in view of this fact, an adequate and representative sample was drawn from the universe using convenience sampling method. Initially, the study viewed 76 schemes out of 587 schemes existing as on 1st April 2007, however, the availability of consistent data during the study period (April 2007 to March 2011) was available for 40 schemes only, as such the final sample size for the present study was reduced to 40 schemes, accounting for around 70 percent of the total schemes. These schemes belonged to 19 fund houses consisting of all the three sectors viz. public sector, private sector foreign funds, of the total sample size of 40 schemes, 33 schemes belonged to the private sector and 7 to the public sector including UTI. Further, 37 schemes are open-ended and 3 schemes are close-ended in nature. Aim wise, the sample consisted of 28 Growth Schemes, 3 Income Schemes, 3 Balanced Funds and 6 Tax-Saving Schemes.
VIII. Data Analysis
Initially we have assessed the overall performance of the sample funds by analyzing their excess return, (Rp-Rf), abnormal excess return, (Rp-Rm), and riskiness of funds viz. a viz. market portfolio. Then the poor or superior performance was decomposed by assessing whether the fund performance is due to the stock selectivity skills or market timing abilities of fund managers. The daily returns for each of the sample schemes and the market portfolio have been calculated after making proper adjustments for the dividend, if any, paid by the schemes, as follows:
Fund Return (Rpt) =NAVt − NAVt−1
NAVt−1
Where:Rpt= Return of a scheme at the end of day tNAVt= Net assets value of the scheme at the end of day‘t’NAVt-1= Net assets value of the scheme at the beginning of day‘t’
Similarly the daily returns for the market Index i.e. for S&P CNX Nifty have been calculated using the following formula:
Selection Abilities of Select Indian Mutual Fund Managers

56
Globa
l Jo
urna
l of M
anag
emen
t an
d Bu
siness Resea
rch
Volum
e XVI Issu
e VIII
Ver
sion
IYe
ar
()
2016
© 2016 Global Journals Inc. (US)1
C
Market Index Return (Rmt) =MIt − MIt−1
S&𝑃𝑃 𝐶𝐶𝐶𝐶𝐶𝐶 𝐶𝐶𝑁𝑁𝑁𝑁𝑁𝑁𝑁𝑁tt−1
Where:Rmt= Return of the market Index for the day‘t’MIt= Market value of the market index i.e. S&P CNX Nifty at the end of day‘t’
MIt-1= Market value of the Market Index i.e. S&P CNX Nifty in the beginning of day’t’
The daily returns are then annualized to obtain mean annual daily returns of each sample scheme and the market Index as follows:
Mean Annual Daily Portfolio Return (Rpt-a) = (Rp1+Rp2+Rp3+……….Rpn)/NMean Annual Daily Market Return (Rmt-a)=(Rm1+Rm2+ Rm3…….Rmn)/N
a) Selectivity Performance Measurement ModelsStock selectivity skills of sample fund managers
were tested by using Jensen’s Alpha and Fama’s net selectivity measure. Jensen (1968) developed an absolute measure based on Capital Asset Pricing Model (CAPM) to regress the excess returns of a portfolio on the market factor. Assuming that market beta or slope co-efficient is constant then the unconditional Alpha is a measure of average performance as in Jensen (1968). The absolute regression equation is based on the assumption that the funds systematic risk is stationary over time. Owing to this assumption, Jensen’s measurement model attributes funds overall performance to manager’s selectivity performance exclusively. This model is shown by the following regression specifications:
Rpt-Rft= α + β (Rmt– Rft) +et
Where:Rpt= The average return of the fund at time‘t’Rft = The risk-free return at time‘t’α = The Jensen performance co-efficient β = The estimate co-efficient for the systematic risk level of the fundRmt = Average return on the market portfolioet = An error term
Here, the intercept α in the above equation is the Jensen’s performance co-efficient indicating risk-adjusted selectivity performance of the fund. A positive and significant Alpha (α) indicates average extra return yielded by a scheme over the benchmark market portfolio return after considering the level of systematic risk of the scheme, thus reflecting the superior performance of the scheme due to the fund manager’s selectivity abilities.
b) Fama’s Decomposition MeasureEugene F.Fama (1972) developed another
selectivity performance measurement criterion which decomposes the fund’s performance into three components viz: risk free return, compensation for systematic risk, and the return due to the stock selectivity performance of the fund manager as revealed by the Fama’s decomposition model. The model further segregates the selectivity performance into two parts viz. compensation for diversification and net selectivity. Greater the diversification of the fund less would be the
compensation for inadequate diversification and vice versa. As such for a well-diversified portfolio, the compensation for inadequate diversification would be close to zero and will always take a non-negative value otherwise. Therefore, net selectivity which is the difference between the compensation for selectivity and compensation for inadequate diversification can always be less than or equal to that of selectivity Fama’s (1972) decomposition measure is expressed as:
Rpt= Rft+ β (Rmt– Rft) + (Rmt– Rft) (σp/ σm- β) + (Rpt– Rft)-(σp/ σm) (Rmt– Rft)
WhereRpt= The average return of the fund at time ‘t’Rft = The risk free return at time ‘t’β = The estimate co-efficient for the systematic risk level of the fundRmt = Average return on the market portfolioβ (Rmt– Rft) = Compensation for systematic risk(Rmt– Rft) (σp/ σm- β) = Compensation for inadequate diversification(Rpt– Rft)-(σp/ σm) (Rmt– Rft) = Net selectivity or excess return after adjusting for all risks.
Here, selectivity is equal to the net selectivity plus compensation for systematic risk and for compensation for inadequate diversification. However, the selectivity performance is measured on the basis of net selectivity rather than the total selectivity. A positive net selectivity is indicates that the fund has been able to earn extra return even after taking into account the compensation required for inadequate diversification, thus better selectivity performance of the fund manager. Conversely, a negative net selectivity indicates that the fund has not been able to earn even a part of the compensation required for inadequate diversification, thus reflects poor selectivity on the part of fund managers.
IX. Hypotheses Testing
To provide a direction to the study, hypotheses were set which were tested by using relevant statistical tools. To test whether Jensen alpha (a), Fama’s net selectivity and Henrickson and Merton’s ‘γ’ co-efficient (Gamma) are statistically significant for each of the sample individual funds, paired two-tailed t-test has been used. For the sample as a whole, whose size was 40 schemes, Z-test has been used to test the statistical
Selection Abilities of Select Indian Mutual Fund Managers

© 20 16 Global Journals Inc. (US)
57
Globa
l Jo
urna
l of M
anag
emen
t an
d Bu
siness Resea
rch
Volum
e XVI Issu
e VIII
Ver
sion
IYe
ar
()
2016
C
significance of Jensen’s alpha, Fama’s net selectivity and HM’s ‘γ’ co-efficient to know whether the sample fund managers have superior selectivity and timing performance. Besides, spearman’s rank co- relation co-efficient technique has been used to assess the association between two selectivity performance measurement models viz. Jensen alpha and Fama’s selectivity and between two selectivity and one timing models. To assess the riskiness of the sample funds and bench mark market index, standard deviation and Beta co-efficient has been used. Standard deviation has been used to assess the total risk while as Beta co-efficient has been used to determine the component of systematic risk.
X. Stock Selection Performance
Stock selection is the nucleus in the investment management process. It involves identifying and selecting undervalued securities which among other things requires the successful forecasting of the company specific events or an ability to predict the general behavior of security prices in the future. If the fund manager is able to identify and select the undervalued securities for the portfolio, then it will be possible for the fund manager to increase the returns of the schemes and vice versa. In practice fund managers are expected to earn superior returns for unit holders consistently as being professionals therefore possess superior skills to collect and analyze the data with the purpose to select the right type of securities for the portfolio.
As already stated earlier that to measure stock selection performance of fund managers, Jensen (1968) and Fama (1972) criterion has been used. Jensen (1968) developed an absolute measure based on CAPM to find out the selectivity performance of fund managers by regressing excess fund returns with the excess market returns. The superior return earned due to the ability of superior stock selection is known from Jensen’s Alpha (α) which is an intercept of the equation it indicates a fund return when the return on the market portfolio is zero. Therefore, a positive and significant Alpha (α) value indicates average extra return earned over the bench mark return after considering the level of systematic risk assumed by the fund. Thus, reflects the superior selectivity performance of the fund manager. Conversely negative alpha (α) indicates to poor stock selectivity skills on the part of the fund manager.
In order to comment on the stock selectivity performance of the fund managers of the sample schemes during the period under study (2007-2011). Alpha’s (α) using the Jensen’s measure have been calculated which have been presented in Table 4.3. Besides, ranks were assigned to the sample funds on the basis of their alphas with the purpose to classify the funds into best and worst ranking funds. Alpha values of the sample funds so obtained were also tested for one percent significance level in order to know whether positive stock picking performance of the fund manager is statistically significant or not.
Table 4.3: Stock Selectivity Performance of Fund Managers using Jensen Model
Scheme Jensen Alpha(α) SD T-Stat P-Value Ranking
ICICI Prudential Discovery Fund – Growth 0.3553 0.8314 0.9556 0.3934 1
HDFC Equity Fund 0.3023 0.6015 1.1238 0.324 2
ICICI Pru Tax Plan 0.2964 0.6828 0.9707 0.3867 3
Reliance Growth Fund 0.2928 0.6651 0.9844 0.3807 4
Franklin India Bluechip Fund 0.2813 0.5789 1.0866 0.3383 5Baroda Pioneer Growth 0.2744 0.5978 1.0264 0.3627 6
Reliance Regular Savings Fund 0.2735 0.6043 1.012 0.3688 7
Birla Sun Life Frontline Equity 0.2663 0.5819 1.0233 0.364 8
HDFC Tax Saver Fund 0.2622 0.6086 0.9634 0.3899 9
Tata Pure Equity Fund 0.2451 0.5687 0.9637 0.3898 10
Tata Tax Advantage Fund 0.2441 0.5220 1.0456 0.3548 11
Principal Index Fund 0.2409 0.5409 0.9959 0.3757 12
Quantum Long-Term Equity Fund 0.2391 0.4931 1.0843 0.3392 13
Sundaram Growth Fund 0.2358 0.5519 0.9554 0.3935 14
UTI - Opportunities Fund 0.2354 0.5305 0.9922 0.3773 15
Fidelity Equity Fund 0.2326 0.5444 0.9554 0.3935 16
L&T Growth Fund 0.2324 0.5477 0.9488 0.3964 17
Selection Abilities of Select Indian Mutual Fund Managers

58
Globa
l Jo
urna
l of M
anag
emen
t an
d Bu
siness Resea
rch
Volum
e XVI Issu
e VIII
Ver
sion
IYe
ar
()
2016
© 2016 Global Journals Inc. (US)1
C
ING Core Equity Fund –Growth 0.2238 0.5381 0.93 0.405 18
Birla Sun Life Top 100 Fund – Growth 0.2110 0.5284 0.8929 0.4224 19
Sundaram Select Focus 0.2098 0.5332 0.8798 0.4286 20
Morgan Stanley Growth Fund 0.2063 0.5955 0.7746 0.4818 21
ING Tax Savings Fund 0.2048 0.6025 0.7601 0.4895 22
Baroda Pioneer ELSS 0.2033 0.5806 0.783 0.4774 23
UTI - Growth Retail 0.2016 0.5071 0.889 0.4243 24
HSBC Equity Fund 0.1924 0.4943 0.8704 0.4332 25
LIC Nomura Mf Equity Fund 0.1821 0.5388 0.7719 0.4832 26
Sahara Growth Fund 0.1674 0.5299 0.7064 0.5189 27
ING Balanced Fund (D) 0.1606 0.4803 0.7477 0.4962 28
LIC Nomura Mf India Vision Fund (D) 0.1502 0.4643 0.7234 0.5095 29SBI Magnum NRI Investment Fund-Flexi Asset (D) Balanced 0.1406 0.4823 0.6519 0.5501 30
SBI One India Fund 0.1067 0.5275 0.4523 0.6745 31
Kotak 50 Growth 0.1009 0.6075 0.3714 0.7292 32
JM Balanced Fund - (D) 0.0529 0.4141 0.2857 0.7893 33
Principal Personal Tax Saver Fund 0.0118 0.6967 0.0379 0.9716 34
Quantum Liquid Fund – Growth -0.0012 0.3455 0.0078 0.9942 35
Kotak Equity Arbitrage Growth -0.0019 0.3394 0.0125 0.9906 36
Templeton India TMA -0.0034 0.3467 0.0219 0.9836 37
SBI Arbitrage Opportunities Fund -0.0036 0.3405 0.0236 0.9823 38
HSBC Cash Fund -0.0131 0.3451 0.0849 0.9364 39
Sahara Growth Fund – Div -0.0199 0.6382 0.0697 0.9478 40
Note:• SD: Standard DeviationSource: AMC reports, NSE historical data and RBI reports
Table 4.3.a: Z-Value of Jensen Alpha
P value and statistical significance:The two-tailed P value is less than 0.0001By conventional criteria, this difference is considered to be extremely statistically significant.Confidence interval:The hypothetical mean is 0.000000The actual mean is 0.179825The difference between these two values is 0.179825The 95 percent confidence interval of this difference:From 0.146750 to 0.212900Intermediate values used in calculations:t = 10.9971df = 39standard error of difference = 0.016
Perusal of the data presented in Table 4.3 brings to fore that out of the total sample of 40 schemes, majority of the schemes i.e. 34 schemes accounting for 85 percent of the sample size have positive Alpha values, which indicates superior stock selectivity performance of their fund managers at their respective levels of systematic risk. On the other hand
fund managers of six schemes namely Quantum LiquidFund - Growth, Kotak Equity Arbitrage Growth, Templeton India TMA, SBI Arbitrage Opportunities Fund, HSBC Cash Fund, and Sahara Growth Fund –Divaccounting for 15 percent of the sample size have demonstrated poor selectivity performance as these schemes are having negative alpha’s which means that
Selection Abilities of Select Indian Mutual Fund Managers

© 20 16 Global Journals Inc. (US)
59
Globa
l Jo
urna
l of M
anag
emen
t an
d Bu
siness Resea
rch
Volum
e XVI Issu
e VIII
Ver
sion
IYe
ar
()
2016
C
their returns were negative when the returns on the market portfolio were zero. Compared to these schemes, the alpha’s of other funds reveals positive abnormal returns (Excess return over the market portfolio) ranging between 1.18 percent to 35.53 percent. It can also be seen from the table that from the sample schemes with positive alphas, only two schemes viz. JM Balanced Fund and Principal Personal Tax Saver Fund have recorded alphas less than 5 percent, whereas the alphas of all other schemes has ranged between 10.09 percent to 35.53 percent which is indicative of the fact that these funds have earned abnormal returns ranging between 10.09 percent to 35.53 percent which is more than sufficient by all standards.
But, it is difficult to infer whether this is due to random chance or superior stock selectivity skills of the sample fund managers. To resolve this, the statistical significance of the estimated performance measure (alpha) has been assessed using ‘t’ test and ‘z’ test, the details of which have been shown in the above referred table. A closer look into the t-values and their corresponding P values presented in Table 4.3.a reveals that although 34 funds or 85 percent of sample funds have positive alphas, but looking at their t-ratio and their corresponding P-values, it is found that the alphas of all the sample funds are not statistically significant even at 1 percent level. This is indicative of the poor stock selection performance of sample fund managers. But when testing significance for all the funds taken together using Z-test, the two tailed P-value is found less than 0.0001 which by conventional criteria implies extremely statistically significant difference even at 5 percent level. This is in total contrast to the significance of Alpha when found on individual basis, this can be attributed to the significant difference in the standard deviations of two data sets. As such, it can be concluded that either the sample fund managers have contributed a very insignificant amount to the extra return of 8.356 percent or have failed to contribute to abnormal excess return (8.3566 percent) by their active selection exercise.
Since the study reveals lack of stock selection skills among the sample fund managers as such the hypothesis laid down about selectivity/performance is accepted. This finding accords with that of Jensen (1968), Shah and Thomas (1994), Gupta and Gupta (2004), Tripathy (2004), Anand and Murugaiah (2006) and Abhijt Khundn (2009). However, there are other studies like Gogginet.al (1993), Debatal (2005), Barua and Verma (1991), Chander (2005), Sehgal and Jhanwar (2008) Anggrinblatt and Titman (1994) which have found superior or better selectivity performance of fund managers. The failure of the sample Indian fund Manager to use selectivity skills to earn superior returns perhaps can be attributed to the recession conditions in the capital market due to the global financial crisis which not only affected Indian equity market but to the equity
markets world-over for quite some period particularly in the years 2008-2010. The markets also witnessed very high volatility which is reflected in the higher standard deviation of sample funds. In statistical terms, more the standard deviation less will be the t-ratio. The similar situation happened with the t-ratios of the funds under study while accessing the significance of alpha.
a) Fama’s Decomposition ModelEugene F.Fama (1972) has developed another
stock selectivity performance evaluation framework, which however, finer breakdown of the fund’s performance. It decomposes the total performance into risk-free return (Rf), premium for systematic risk and return due to stock selection ability of the fund manager at a given level of risk. Fama (1972) has further decomposed the stock selection ability of the fund managers into two parts, viz. Compensation for diversification and net selectivity. In fact, greater the diversification achieved by a fund, lesser would be the compensation for inadequate diversification and vice versa. As such, the compensation for inadequate diversification may be close to zero for a well-diversified fund and will always take a non-negative value otherwise. As such, net selectivity, which is the difference between the selectivity and the compensation for inadequate diversification can always be less than or equal to that of the selectivity. Therefore, a positive net selectivity represents superior return even after the extra return required for inadequate diversification. On the other hand, negative net selectivity denotes that the fund manager has failed to earn even a part of the return required for inadequate diversification thus implies poor net selectivity performance.
Selection Abilities of Select Indian Mutual Fund Managers
Tabl
e 4.
4:
Fam
a’s
Sel
ectiv
ity &
Net
Sel
ectiv
ity o
f Sam
ple
Fund
s
60
Globa
l Jo
urna
l of M
anag
emen
t an
d Bu
siness Resea
rch
Volum
e XVI Issu
e VIII
Ver
sion
IYe
ar
()
2016
© 2016 Global Journals Inc. (US)1
C
Sch
emes
Com
p ens
atio
n fo
r sys
tem
atic
ris
kβ
(Rm
t -R
ft)
Por
tfolio
SD
(σ
p)M
arke
tSD
(σm
)
Com
pens
atio
n Fo
r In
adeq
uate
D
iver
sific
atio
n(R
mt-R
ft) (σ
p/σm
-β)
Net
Sel
ectiv
ity(R
p-R
f)-(σ
p/σm
) (R
mt-R
ft)
Fam
s’s
Sel
ectiv
ity
Bar
oda
Pio
neer
ELS
S-0
.012
40.
0165
0.02
020.
0329
0.08
000.
1006
Bar
oda
Pio
neer
Gro
wth
-0.0
129
0.01
720.
0202
0.03
430.
1374
0.15
88
Birl
a S
un L
ife F
ront
line
Equ
ity-0
.012
20.
0162
0.02
020.
0324
0.14
460.
1648
Birl
a S
un L
ife T
op 1
00 F
und
–G
row
th-0
.011
90.
0158
0.02
020.
0315
0.10
460.
1242
Fide
lity
Equ
ity F
und
-0.0
113
0.01
450.
0202
0.02
940.
1191
0.13
72
Fran
klin
Indi
a B
luec
hip
Fund
-0.0
119
0.01
530.
0202
0.03
090.
1524
0.17
14
HD
FC E
quity
Fun
d-0
.012
30.
0156
0.02
020.
0318
0.20
400.
2235
HD
FC T
ax S
aver
Fun
d-0
.011
50.
0141
0.02
020.
0291
0.16
570.
1833
HS
BC
Cas
h Fu
nd0.
0000
0.00
030.
0202
0.00
04-0
.013
5-0
.013
1
HS
BC
Equ
ity F
und
-0.0
112
0.01
470.
0202
0.02
960.
0840
0.10
23
ICIC
I Pru
Tax
Pla
n-0
.010
50.
0142
0.02
020.
0281
0.18
210.
1997
ICIC
I Pru
dent
ial D
isco
very
Fun
d –
Gro
wth
-0.0
099
0.01
420.
0202
0.02
760.
2507
0.26
84
ING
Bal
ance
d Fu
nd (D
)-0
.009
10.
0119
0.02
020.
0238
0.06
390.
0787
ING
Cor
e E
quity
Fun
d –G
row
th-0
.012
60.
0162
0.02
020.
0328
0.08
410.
1043
ING
Tax
Sav
ings
Fun
d-0
.011
40.
0162
0.02
020.
0315
0.07
940.
0996
JM B
alan
ced
Fund
-(D
)-0
.009
90.
0139
0.02
020.
0272
-0.0
374
-0.0
201
Kot
ak 5
0 G
r ow
th-0
.013
00.
0154
0.02
020.
0321
0.08
660.
1057
Kot
ak E
qui ty
Arb
itrag
e G
row
th0.
0003
0.00
120.
0202
0.00
120.
0005
0.00
19
L&T
Gro
wth
Fun
d-0
.013
50.
0177
0.02
020.
0356
0.09
350.
1155
LIC
Nom
ura
Mf E
quity
Fun
d-0
.013
60.
0183
0.02
020.
0364
0.04
510.
0678
LIC
Nom
ura
Mf I
ndia
Vis
ion
Fund
(D)
-0.0
125
0.01
740.
0202
0.03
410.
0260
0.04
77
Mor
gan
Sta
nley
Gro
wth
Fun
d-0
.012
20.
0164
0.02
020.
0326
0.08
240.
1028
Selection Abilities of Select Indian Mutual Fund Managers

Prin
c ipa
l In d
ex F
und
- 0.0
139
0.01
800.
0202
0.03
620.
0925
0.11
49
Pr in
cip a
l Per
sona
l Ta x
Sav
er F
u nd
-0.0
124
0.01
810.
0202
0.03
49- 0
.010
30.
0122
Qua
ntum
Li q
uid
Fun d
–G
r ow
th0.
0000
0.00
020.
0202
0.00
02- 0
.001
3-0
.001
1
Qua
ntum
Lo n
g-T e
r m E
qui ty
Fun
d- 0
.011
40.
0144
0.02
020.
0293
0.13
450.
1524
Re l
ianc
e G
r ow
t h F
und
- 0.0
110
0.01
520.
0202
0.03
000.
1943
0.21
32
Rel
ian c
e R
egul
ar S
avin
gs F
u nd
- 0.0
090
0.01
220.
0202
0.02
420.
1804
0.19
56
Sa h
ara
Gr o
wth
Fun
d-0
.011
90.
0187
0.02
020.
0352
0.08
800.
1113
Sa h
ara
Gr o
wth
Fun
d -D
iv-0
.010
70.
0354
0.02
020.
0548
- 0.1
231
-0.0
790
SB
I Ar b
it ra g
e O
ppor
tuni
ties
F und
0.00
030.
0011
0.02
020.
0010
- 0.0
015
-0.0
002
SB
I Mag
num
NR
I Inv
estm
ent F
und-
Flex
i Ass
et (D
) Bal
ance
d-0
.010
80.
0134
0.02
020.
0275
0.05
700.
0737
SB
I One
Ind i
a Fu
nd-0
.012
40.
0149
0.02
020.
0309
0.01
230.
0308
Sun
dara
m G
row
th F
und
-0.0
133
0.01
750.
0202
0.03
510.
1255
0.14
74
Sun
dara
m S
elec
t Foc
us-0
.013
00.
0173
0.02
020.
0345
0.11
840.
1400
Tata
Pur
e E
quity
Fun
d-0
.011
60.
0154
0.02
020.
0308
0.14
230.
1614
Tata
Tax
Adv
anta
ge F
und
-0.0
103
0.01
400.
0202
0.02
780.
1511
0.16
86
Tem
plet
on In
dia
TMA
0.00
000.
0002
0.02
020.
0002
-0.0
036
-0.0
034
UTI
-G
row
th R
etai
l-0
.010
00.
0135
0.02
020.
0268
0.11
350.
1303
UTI
-O
ppor
tun i
ties
Fund
-0.0
051
0.01
540.
0202
0.02
430.
2343
0.25
34
Not
e:•
Rpt
:Mea
n D
aily
Ann
ual F
und
Ret
urn
•R
ft : R
isk
Free
Ret
urn
•R
mt:
Mea
n D
aily
Ann
ual M
arke
t Ret
urn
•σp
: Sta
ndar
d D
evia
tion
Por
tfolio
•σm
: Sta
ndar
d D
evia
tion
Mar
ket
•β:
Por
tfolio
Bet
aSo
urce
:AM
C re
ports
, NSE
his
toric
al d
ata
and
RB
I rep
orts
© 20 16 Global Journals Inc. (US)
61
Globa
l Jo
urna
l of M
anag
emen
t an
d Bu
siness Resea
rch
Volum
e XVI Issu
e VIII
Ver
sion
IYe
ar
()
2016
C
Selection Abilities of Select Indian Mutual Fund Managers

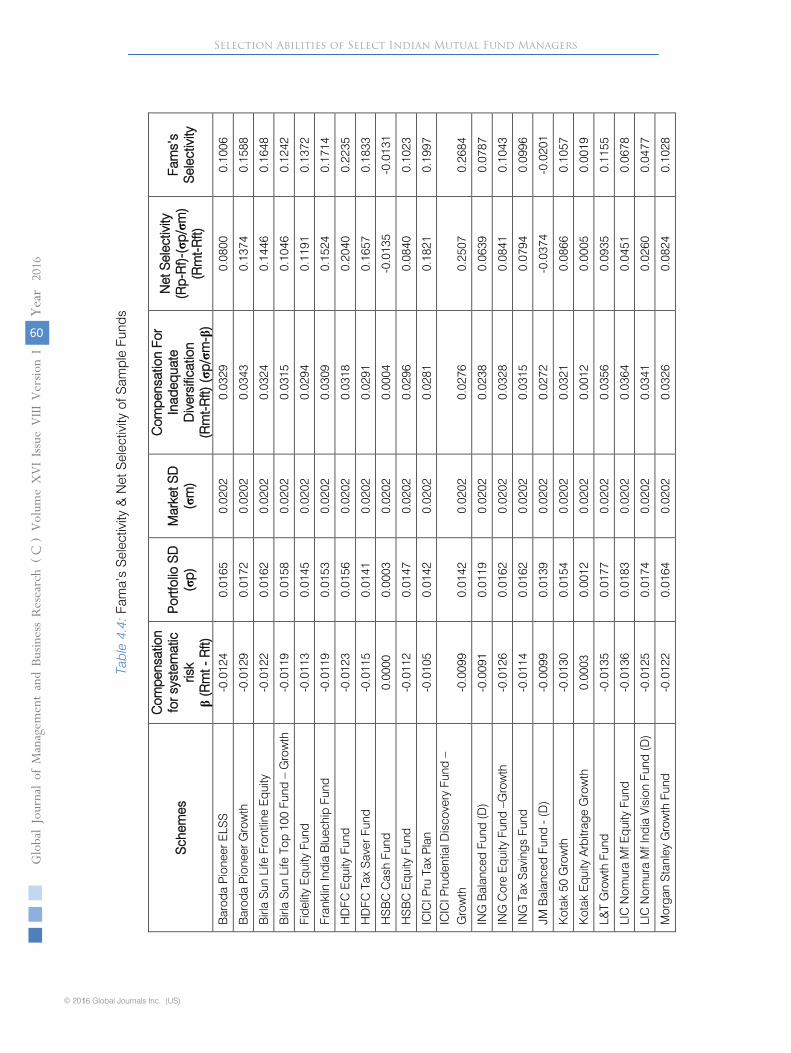
Results of Fama’s decomposition measure have been detailed out in Table 4.4 which among other things presents market risk premium, Compensation for inadequate diversification and net selectivity. It is evident from the table that out of 40 sample schemes, 35 schemes which account for 87.5 percent of the sample size have negative risk premium which implies that the systematic risk to which these schemes were exposed was less than the average market portfolio risk. The risk premium for other three sample schemes was zero and for the remaining two schemes very negligible, i.e. 0.0003. As such it becomes quite clear from the above that the sample schemes were having less than the market risk which is also evident from their beta values which for most of the schemes was either negative or very low. Negative are very insignificant market risk for the sample schemes implies that no portion of actual return will be eaten- up by the market risk premium.
While looking at the compensation for inadequate diversification (Rm-Rf)(σp/σm-β), it become clear from the data presented in the above referred table that no sample scheme has been found to be well diversified as none of their schemes have scored zero value for compensation for inadequate diversification. However, compensation for inadequate diversification on five sample schemes is very low, ranging between 0.0002 to 0.0012 which implies that these schemes were almost well diversified. It can be also seen from the table that the average compensation for inadequate diversification for all the sample schemes has been 2.77 percent which in no way is more given the mean return of 18.39 percent for all the schemes during the reference period. As such it can be concluded that though the majority of the sample schemes were not well diversified yet their level of their inadequate diversification was not significant.
Table 4.4 also presents the data on net selectivity. According to Fama, Selectivity as revealed by (alpha) also includes compensation for inadequate diversification. Therefore, to conclude about the stock selection skills of fund managers, the need is to look into the selectivity net of compensation for inadequate diversification. Given this fact, the net selectivity co-efficient of the sample funds has been calculated using Fama’s metric and the details of which have been presented in the above referred table. Perusal of the data about net selectivity reveals that 33 schemes out of the total sample of 40 schemes i.e. 82.5 percent of the sample schemes have reported positive net selectivity there by indicating superior stock selection performance. However seven sample schemes i.e. 17.5 percent of the sample size have shown poor selectivity performance as these have reported negative values for net selectivity ranging between -0.0013 to -0.0374. It can also be observed from the above table that 16 sample schemes namely
Baroda Pioneer Growth, Birla Sun Life
Frontline Equity, Birla Sun Life Top 100 Fund–Growth, Fidelity Equity Fund, Franklin India Bluechip Fund, HDFC Equity Fund, HDFC Tax Saver Fund, ICICI PRU Tax Plan, ICICI Prudential Discovery Fund–Growth, Quantum Long-Term Equity Fund, Reliance Growth Fund, Reliance Regular Savings Fund, Sundaram Growth Fund, Sundaram Select Focus, Principal Index Fund and L&T Growth Fund have reported better selectivity performance than the average selectivity performance of the sample as a whole as these have scored more than the average value of 9.10 percent of all schemes. While looking at the ranking of different funds as shown in Table 4.4, it can be observed that among the funds which have reported positive selectivity performance, ICICI Prudential Discovery Fund is at the top followed by UTI-Opportunities Fund and HDFC Equity Fund. The schemes that rank at the bottom with positive selectivity performance includes Kotak Equity Arbitage Growth, SBI one Indian Fund, LIC Nomura MF, India vision fund, LIC Nomura MF Equity Fund and SBI Magnum NRI Invest Fund. It can also be observed that though Kotak Equity Arbitrage Growth, SBI One Indian Fund and LIC Nomura MF India Vision Fund have scored positive scores for net selectivity yet these scores are very low ranging between 0.0005 to 0.0256 only. Further to state that among the sample seven funds namely HSBC Cash Fund, JM Balanced Fund-(D), Principal Personal Tax Saver Fund, Quantum Liquid Fund–Growth, Sahara Growth Fund-Div, SBI Arbitrage Opportunities Fund, and Templeton India TMA , which have reported negative selectivity performance, Sahara Growth Funds-Div. with -12.31 percent was the worst performing fund among all funds followed by J.M Balanced Fund, HSBC Cash Fund, Principal Personal Tax Saver Fund, Templeton India TMA, SBI Arbitrage Opportunities Fund And Quantum Liquid Fund-Growth.
While comparing with the Jensen criterion, it can be observed from Table 4.4 and 4.3 that all those schemes which have reported positive selectivity performance under Jensen criterion have shown similar results except with respect to three schemes viz. JM Balanced Fund (D), Kotak Equity Arbitrage Growth and Principal Personal Tax Saver Fund. As such it can be inferred that the result as shown by the Fama’s net selectivity metric can be different from that of Jensen criterion. This in other words means that the selectivity performance as revealed by Jensen metric cannot be a final word on selectivity performance. Given the superiority of the Fama’s criterion, in order to conclude about the selectivity performance, it would be appropriate to use Fama’s net selectivity criterion, which decomposes selectivity into compensation for inadequate diversification and net selectivity.
62
Globa
l Jo
urna
l of M
anag
emen
t an
d Bu
siness Resea
rch
Volum
e XVI Issu
e VIII
Ver
sion
IYe
ar
()
2016
© 2016 Global Journals Inc. (US)1
CSelection Abilities of Select Indian Mutual Fund Managers

Table 4.5: Z Value for Fama’s Alpha
P value and statistical significance: The two-tailed P value is less than 0.0001 By conventional criteria, this difference is considered to be extremely statistically significant.
Confidence interval: The hypothetical mean is 0.000000
The actual mean is 0.108663
The difference between these two values is 0.108663
The 95 percent confidence interval of this difference:
From 0.082976 to 0.134349
Intermediate values used in calculations:
t = 8.5565
df = 39
standard error of difference =0.013
Presence of positive alpha or net selectivity only hints at better selectivity performance. But to conclude about the superior selectivity performance, there is a need to test the statistical significance of Fama’s net selectivity. For this purpose T-test has been used to test the significance of individual funds and Z-test for assessing the significance of all the funds taken together. The results of these two tests of significance have been presented in table 4.5 which reveals that Fama Alpha for none of the funds has been found statistically significant even at 5 percent level which becomes clear from their T-ratios and their corresponding P-values. This in other words means that the managers of the sample funds have failed to identify and pick-up under-valued stocks. So the excess abnormal return of the sample funds cannot be attributed to the selectivity performance of sample fund managers but may be either due to timing performance or by chance. But when significance has been assessed for all the sample funds together using Z-test, Fama’s alpha (Net Selectivity) has been found statistically significant. As can be seen from Table 4.5 the two tailed P-value is found less than 0.0001 which by conventional criteria implies extremely statistically significant difference even at 5 percent level. The difference in result is perhaps due to the difference in standard deviations of two data sets.
Using Jensen Alpha & Fama’s
net selectivity it has been found that the fund managers of sample schemes lack selectivity performance across the two measurement criterions, thus the null hypothesis laid down for selectivity skills of fund managers in India is accepted. This finding corresponds with the finding of Jensen (1968) chen, Lee, Rahman and Chan (1992), Coggin, Fabozzi and Rehman (1993), Lee and Rahman (1990), Irissapaneetal (2000), Sehgal and Jhanwar (2008), Barua and Verma(1991) Chander (2005), Sehgal and Jhanwar (2008), Abhijit Kundu(2009) and Zabiulla (2013), there are equal number of studies whose results are contrary to the findings of the present study. The important such studies includes; Grinblatt and Titman
(1994) Shah and Thomas (1994), Jaydev (1996), Gupta (2004), Tripathy (2004), and Anand and Murugaiah (2006). Differences in the findings of various studies are bound to exist for the reasons that the studies differ on various parameters like sample size, period of study etc. It is also that the sample fund managers perhaps have shown no selectivity performance for the reason that during the 3 years of reference period i.e. 2008-2010, the equity market in India had witnessed deep recession due to global financial crisis. Under deep recession it is unlikely even for the
best managers to perform well or outperform the market. The same is perhaps true about the fund managers of sample schemes studied in the present study.
b)
Stock Selection Performance across the Measurement Criteria
In addition to the study of stock selection performance of Indian Fund Managers during the period under study (2007-11) using different measurement criterion, an effort has also been made to study the extent of relationship that exists between Jensen’s and Fama’s selectivity performance measurement criterions. For this purpose, Spearman’s Rank Correlation Coefficients between the ranks under each selectivity measurement criteria have been calculated, the details of which have been presented in Table 4.6.
© 20 16 Global Journals Inc. (US)
63
Globa
l Jo
urna
l of M
anag
emen
t an
d Bu
siness Resea
rch
Volum
e XVI Issu
e VIII
Ver
sion
IYe
ar
()
2016
C
Selection Abilities of Select Indian Mutual Fund Managers

Table 4.6: Spearman’s Rank Correlation between the Ranks under Selectivity Measurement Models
Jenson Alpha
Fama Selectivity
Net Selectivity
Spe
arm
an's
rho
Jenson Alpha Correlation Coefficient Sig. (2-tailed)
1.000 .939** .937**
.000 .000
Fama Selectivity Correlation Coefficient Sig. (2-tailed)
1.000 .998**
.000
Net Selectivity
Correlation Coefficient Sig. (2-tailed)
1.000
Note:** stands for Correlation is significant at the 0.01 level (2-tailed)
Perusal of the data contained in the Table 4.6 reveals significant level of association between the rankings assigned under the two measurement criterion across all possible combinations viz. rs(1,3), rs(1,2) and rs(2,3) respectively. It can be observed that the correlation coefficients between the rankings under Jensen (1968) and Fama’s (1972) selectivity criterion [rs(1,2)], and between the rankings under Jensen (1968) and Fama’s (1972) net selectivity criterion [rs(1,3)] are 0.939 and 0.937 respectively which are high by all standards thus indicating significant correlation between the results of the two criterions. Similarly under Fama’s (1972) Net selectivity criterion and Fama’s (1972) selectivity criterion [rs(2,3)] is 0.998 which again signifies higher degree of correlation between the two criterion. It can also be seen from the data contained in table that the degree of correlation between the rankings under the two measurement criterion is statistically significant even at 0.01 level of significance. It implies fund manager’s uniform stock selection performance across the measurement criteria. At the same time, highly significant correlation between the two criteria’s i.e. [rs(1,2)] and [rs(2,3)] denotes that the compensation for inadequate diversification has not impacted selectivity performance anyway.
The presence of significant correlation between the ranks under each measurement criteria used the hypothesis that there is positive relationship between the two measurement criterions but statistically insignificant is rejected. This finding across with the findings of many
other studies like: Odean (1999); Barber, Lee, Liu, and Odean (2009); and Markowitz (1952).
XI. Persistence Inselectivity Performance
To comment about the selectivity performance of fund managers using mean Jensen Alpha or mean Fama’s net selectivity for the study period as a whole is meaningful. But more important issue is the persistence in manager’s ability to select stocks and to time risk factors. A fund manager who comes out successful today, whether he/she will be able to repeat the same performance in future consistently, is a matter of concern to the fund investors and other stake holders. Rather to conclude about the stock picking ability of fund managers, one would be interested in knowing whether there is consistency in selectivity performance or not. If a fund manager is able to deliver better performance consistently i.e. quarter-after-quarter or year-after-year, then his or her performance in selecting the right type of stocks for the portfolio would be considered satisfactory. Conversely if the fund manager’s performance varies significantly from period to period, then it would be an indication that there is something wrong with his/her stock selection skills or market timing ability. As per the standard practice, a fund manager is expected to perform better than the market and more importantly perform consistently. Hence it is imperative to analyze the persistence in the stock selection performance of fund managers.
Table 4.7: Persistence in Selectivity Performance of Sample Fund Managers
Jensen Model
Scheme 2007 2008 2009 2010 2011 ICICI Prudential Discovery Fund – Growth 0.0653 0.5510 1.8581 -0.5527 -0.1452
HDFC Equity Fund 0.2832 0.6752 1.2158 -0.4587 -0.2041
ICICI Pru Tax Plan 0.1790 0.6133 1.4186 -0.5690 -0.1600
Reliance Growth Fund 0.3920 0.5733 1.3139 -0.6307 -0.1846
Franklin India Bluechip Fund 0.2566 0.8182 1.0142 -0.5342 -0.1483
Baroda Pioneer Growth 0.4731 0.8285 0.9159 -0.5911 -0.2545
64
Globa
l Jo
urna
l of M
anag
emen
t an
d Bu
siness Resea
rch
Volum
e XVI Issu
e VIII
Ver
sion
IYe
ar
()
2016
© 2016 Global Journals Inc. (US)1
CSelection Abilities of Select Indian Mutual Fund Managers

Reliance Regular Savings Fund 0.2963 0.7375 1.0888 -0.5985 -0.1567
Birla Sun Life Frontline Equity 0.2520 0.7401 1.0576 -0.5324 -0.1855
HDFC Tax Saver Fund 0.2202 0.6212 1.1964 -0.5451 -0.1816
Tata Pure Equity Fund 0.3556 0.6783 0.9619 -0.6182 -0.1522
Tata Tax Advantage Fund 0.3562 0.5946 0.9392 -0.5268 -0.1428
Principal Index Fund 0.3243 0.8755 0.7372 -0.5528 -0.1794
Quantum Long-Term Equity Fund 0.1459 0.4503 1.0377 -0.4478 0.0095
Sundaram Growth Fund 0.3984 0.6005 0.9542 -0.5768 -0.1970
UTI - Opportunities Fund 0.4719 0.1874 1.0678 -0.5344 -0.0160
Fidelity Equity Fund 0.1644 0.7111 0.9713 -0.4881 -0.1955
L&T Growth Fund 0.2107 0.7761 0.8958 -0.5355 -0.1850
ING Core Equity Fund –Growth 0.2148 0.7515 0.8770 -0.5294 -0.1947
Birla Sun Life Top 100 Fund – Growth 0.1131 0.6959 0.9134 -0.5134 -0.1540
Sundaram Select Focus 0.4836 0.6001 0.7937 -0.6077 -0.2206
Morgan Stanley Growth Fund 0.1657 0.7097 1.0100 -0.6142 -0.2399
ING Tax Savings Fund 0.0028 0.5740 1.1793 -0.5002 -0.2322
Baroda Pioneer ELSS 0.3099 0.6164 0.9686 -0.6539 -0.2245
UTI - Growth Retail 0.2348 0.5806 0.8917 -0.5186 -0.1805
HSBC Equity Fund 0.4195 0.6708 0.6449 -0.5682 -0.2050
LIC Nomura Mf Equity Fund 0.1117 0.8036 0.7742 -0.5572 -0.2220
Sahara Growth Fund 0.2827 0.6151 0.7923 -0.6433 -0.2101
ING Balanced Fund (D) 0.2667 0.6385 0.6575 -0.5827 -0.1773
LIC Nomura Mf India Vision Fund (D) 0.4904 0.5047 0.5528 -0.5890 -0.2078 SBI Magnum NRI Investment Fund-Flexi Asset (D) Balanced 0.2205 0.5622 0.7168 -0.5802 -0.2162
SBI One India Fund -0.0542 0.5556 0.8404 -0.6320 -0.1764
Kotak 50 Growth 0.3298 0.6074 0.7128 -0.9292 -0.2164
JM Balanced Fund - (D) 0.0896 0.4635 0.4940 -0.6130 -0.1695
Principal Personal Tax Saver Fund -0.1842 0.4525 1.0608 -0.9938 -0.2761
Quantum Liquid Fund – Growth 0.1687 0.4055 0.1604 -0.5981 -0.1425
Kotak Equity Arbitrage Growth 0.1867 0.3730 0.1698 -0.5934 -0.1454
Templeton India TMA 0.1712 0.4012 0.1586 -0.6040 -0.1440
SBI Arbitrage Opportunities Fund 0.1845 0.3694 0.1692 -0.6007 -0.1403
HSBC Cash Fund 0.1705 0.3893 0.1392 -0.6104 -0.1540
Sahara Growth Fund - Div -0.3704 0.6038 0.7926 -0.9336 -0.1917
Average 0.2213 0.5994 0.8529 -0.5965 -0.1780
Source: AMC reports, NSE historical data and RBI reports
Table 4.8: Persistence in Selectivity Performance of Sample Fund Managers
Fama Model Scheme 2007 2008 2009 2010 2011
UTI - Opportunities Fund 0.5519 -0.507 1.5996 -0.1627 -0.2395
ICICI Prudential Discovery Fund – Growth 0.184 -0.6616 2.2403 -0.2033 -0.3746
Reliance Growth Fund 0.52 -0.6086 1.7914 -0.2323 -0.438
HDFC Equity Fund 0.4054 -0.6668 1.7858 -0.1051 -0.4684
Reliance Regular Savings Fund 0.3939 -0.3728 1.452 -0.2858 -0.3453
Tata Tax Advantage Fund 0.4765 -0.5346 1.4165 -0.1965 -0.3529
ICICI Pru Tax Plan 0.2923 -0.6847 1.8179 -0.2298 -0.3999
Sundaram Select Focus 0.6439 -0.6298 1.4416 -0.2 -0.4665
Tata Pure Equity Fund 0.4922 -0.6007 1.4748 -0.2313 -0.3654
© 20 16 Global Journals Inc. (US)
65
Globa
l Jo
urna
l of M
anag
emen
t an
d Bu
siness Resea
rch
Volum
e XVI Issu
e VIII
Ver
sion
IYe
ar
()
2016
C
Selection Abilities of Select Indian Mutual Fund Managers

HDFC Tax Saver Fund 0.3382 -0.6693 1.7004 -0.2233 -0.3942
Birla Sun Life Frontline Equity 0.3868 -0.6835 1.5855 -0.1603 -0.4347
Sundaram Growth Fund 0.557 -0.7981 1.5515 -0.1627 -0.456
Franklin India Bluechip Fund 0.383 -0.6495 1.4801 -0.193 -0.3852
Baroda Pioneer Growth 0.6088 -0.7254 1.4646 -0.1836 -0.5313
UTI - Growth Retail 0.3507 -0.5018 1.3163 -0.1547 -0.3961
Sahara Growth Fund 0.4919 -0.5262 1.3115 -0.2403 -0.4355
Fidelity Equity Fund 0.2846 -0.6111 1.4443 -0.1405 -0.4219
Birla Sun Life Top 100 Fund – Growth 0.2491 -0.5996 1.4276 -0.1267 -0.4018
Quantum Long-Term Equity Fund 0.2547 -0.9189 1.5115 -0.1203 -0.2351
HSBC Equity Fund 0.5447 -0.5864 1.0873 -0.1812 -0.4518
Kotak 50 Growth 0.4239 -0.6696 1.2299 -0.1888 -0.3934
Baroda Pioneer ELSS 0.4289 -0.8203 1.5164 -0.2193 -0.5126
Morgan Stanley Growth Fund 0.2967 -0.7946 1.5467 -0.2028 -0.4685
L&T Growth Fund 0.3625 -0.8747 1.4664 -0.1492 -0.4325
Principal Index Fund 0.4675 -0.8154 1.3121 -0.1351 -0.4645
ING Tax Savings Fund 0.1339 -0.9205 1.6704 -0.1207 -0.4468
ING Core Equity Fund -Growth 0.3523 -0.8214 1.3472 -0.1413 -0.4433 SBI Magnum NRI Investment Fund-Flexi Asset (D) Balanced 0.3281 -0.7255 1.2858 -0.2642 -0.3416
Sahara Growth Fund - Div 0.1003 -0.5236 1.3108 -0.2118 -0.4211
ING Balanced Fund (D) 0.3678 -0.4882 1.0184 -0.325 -0.351
LIC Nomura Mf Equity Fund 0.2766 -0.8012 1.3256 -0.1457 -0.4881
LIC Nomura Mf India Vision Fund (D) 0.6523 -0.8912 1.0179 -0.1696 -0.4951
SBI One India Fund 0.0598 -0.797 1.4278 -0.2464 -0.396
Equity Arbitrage Growth 0.1899 0.3506 0.184 -0.5557 -0.1608
SBI Arbitrage Opportunities Fund 0.1872 0.3505 0.1786 -0.5602 -0.1534
Quantum Liquid Fund – Growth 0.1694 0.3992 0.1625 -0.5928 -0.1449
Templeton India TMA 0.1719 0.3952 0.1607 -0.5988 -0.1465
Principal Personal Tax Saver Fund -0.0377 -0.794 1.4852 -0.2181 -0.4756
HSBC Cash Fund 0.1719 0.3778 0.1431 -0.5994 -0.158
JM Balanced Fund - (D) 0.1928 -0.7073 0.985 -0.2569 -0.3668
Average 0.34264 -0.55269 1.291875 -0.24088 -0.38137
Source: AMC reports, NSE historical data and RBI reports
The issue of persistence in fund manager’s ability to select undervalued stocks has two dimensions. First, one can ask if some managers who did particularly well or poorly in the past quarter/year continues to do so in the next, that is, one can examine if there is persistence in general. The second question is if managers exhibit persistence in general, that is, no matter what the performance over the previous quarter/year was, it remains unchanged or is better in the next. In this study we check persistence by addressing both of these questions.
To test for persistence in the stock selectivity performance of sample fund managers, across the two measurement criterion namely Jensen (1968) and Fama (1972), we have calculated yearly Alpha’s and also assigned ranks to each fund on the basis of the excess return (Alpha). The said data is presented in Table 4.7, the perusal of which reveals short term persistence (i.e. in the first three years) in terms of first question defined
above i.e. whether the managers repeat the past performance with positive selectivity performance, in case of all the sample 40 funds except three funds namely: SBI One India, Principal Personal Tax Saver Fund and Sahara Growth Fund-Div. However, with respect to the long term persistence i.e. for all the five years, none of the sample funds have shown persistence in their performance as during the first three years most of the sample funds have reported positive alpha’s and in the last two years of the period under study i.e. for 2010 and 2011, all the sample funds have reported negative alpha’s. As such it can be inferred that fund managers have failed to perform well consistently in the long run.
As already stated that the other way to look into the persistence in performance is that if managers exhibit persistence in performance in general i.e. no matter what the performance over the previous year was, it improves or remains unchanged in the next, In
66
Globa
l Jo
urna
l of M
anag
emen
t an
d Bu
siness Resea
rch
Volum
e XVI Issu
e VIII
Ver
sion
IYe
ar
()
2016
© 2016 Global Journals Inc. (US)1
CSelection Abilities of Select Indian Mutual Fund Managers

terms of this question, during the short run i.e. first 3- years of the period under study 30 sample funds i.e. 75 percent of the sample fund have exhibited persistence in general. But in the long run i.e. during the entire study period, none of the sample funds have exhibited persistence in general as in case of all the sample funds the alpha’s were positive in the first three years then negative in the last two years. What emerges from the above is that 75 percent of the sample funds have exhibited persistence in general in first three years of the time series but no such persistence for the entire time series.
Table 4.8 presents year-wise Fama’s Net Selectivity along with the ranks occupied by each fund. It can be observed from the data contained in the above referred table that all the sample 40 funds except four funds namely: SBI Arbitrage Opportunity Fund, HSBC Cash Fund, Templeton India TMA and Quantum Liquid Fund- Growth have reported neither short term (2007-09) nor long run i.e. for the entire study period persistence in stock selectivity performance based on Fama’s Net Selectivity. The above mentioned four sample funds have reported persistence only for the first three years of the study period (2006-2011). But when one looks into the entire period of study, these four funds have also exhibited either little or no persistence. With respect to the persistence in general terms; none of the funds have exhibited persistence in general terms (i.e. no matter what the performance over the previous year was, it remains unchanged in the next). It can also be seen from the above referred table that on the basis of Fama’s Net Selectivity, none of the sample funds have shown persistence in selectivity performance but during the last two years of time series, all the sample funds have consistently reported negative net selectivity performance.
What emerges from the above discussion on persistence of selectivity performance is that on the basis of Jensen Alpha majority of the funds reported persistence in selectivity performance in the short run. But in the longer run i.e. for the entire time series (2006-2011) no such persistence in selectivity performance has been observed for the sample funds. However, on the basis of Fama’s Net selectivity, no persistence neither in the short run nor in the long run in the selectivity of performance of fund managers of sample funds has been observed. Lack of persistence is indicative of the fact that the fund managers have failed in picking up under -valued stocks consistently which in turn implies poor selectivity performance on the part of sample fund managers during the period under study. Short run persistence was observed on the basis of Jensen alpha but no such persistence has been found with respect to Fama’s Net Selectivity, as such the hypothesis set in this regard for the study is rejected. Besides, no relative persistence over the longer run has been observed across both the measurement criterion,
therefore the hypothesis that there is no persistence in the selectivity performance of fund managers across both the criterion is accepted.
The finding about the existence of short term persistence in selectivity performance based on Jensen alpha corresponds with the findings of Benjamini and Hochberg 1995; Benjamini and Yekutieli 2001; and Storey 2002 There seems to be more evidence for relative short term persistence in selectivity performance (Evangeloselal, 2009). A common conclusion in the literature, however, is that expect for the very best fund managers, persistence primarily exists among poor performers Grinber (1996); Carhart(1997), Bolhen and Busse (2004). The similar finding emerges from the present study i.e. poor performers namely HSBC Cash, Quantum Liquid fund-growth, SBI Arbitrage Opportunity Fund and Templeton India. TNA which have performed poorly compared to other sample funds, have been found to report persistence in selectivity performance, however, in the short run only.
With regard to the long run persistence, the finding of the absence of relative long term persistence in selectivity performance of the sample funds across both the measurement criterion is line with the findings of other studies like: Chander (2005), Joyti Dhar(2004) Berk and Green (2004), Elton et.al (1992), Treynor and Mazuy (1996), Henrikson (1984). This lack of persistence in the long run could potentially be attributed to several factors. One is the diminishing investment opportunities of well performing funds Evangelos (2009). Another possibility is that management fee rise over- time so as to capitalize on a good performance record. Finally, the performing managers may simply wish to exploit their reputation and find a more lucrative job, perhaps in a hedge fund Evagelos (2009).
References Références Referencias
1. Abrevaya, J., Jiang, W., 2001. Pairwise-slopes statistics for testing curvature. Working paper, University of Chicago Graduate School of Business and Columbia Business School.
2. Angol, "Role of Self Regulatory Organisation in Mutual Fund Industry in India", Chartered Financial Analyst, Vol.7 (1), 1992, p11.
3. Ansari, "Mutual Funds in India: Emerging Trends", The Chartered Accountant, Vol. 42(2), (August 1993), pp.88-93.
4. Ansari, "Mutual Funds in India: Emerging Trends", The Chartered Accountant, Vol. 42(2), (August 1993), pp.88-93.
5. Arditti, "Another Look at Mutual Fund Performance", Journal of Financial and Quantitative Analysis, Vol. 3, (1971), pp. 909-912.
© 20 16 Global Journals Inc. (US)
67
Globa
l Jo
urna
l of M
anag
emen
t an
d Bu
siness Resea
rch
Volum
e XVI Issu
e VIII
Ver
sion
IYe
ar
()
2016
C
6. Bansal L K, "Challenges For Mutual Funds In India", Chartered Secretary, Vol. 21(10), (October 1991), pp. 825-26.
Selection Abilities of Select Indian Mutual Fund Managers

7.
Batra and Bhatia, "Indian Mutual Funds: A study of Public sector", paper presented, UTI Institute of Capital Market, Mumbai, (1992).
8.
Baur, Sundaram and Smith, "Mutual Funds: The US Experience", Finance India, Vol. 9(4), (1995), pp.945-957.
9.
Carlson, "Aggregate Performance Of Mutual Funds, 1948-1967", Journal of Financial and Quantitative Analysis, Vol. 5, (1970), pp.1-32.
10.
Conrad S Ciccotello and C Terry Grant, "Information Pricing: The Evidence from Equity Mutual Funds", The Financial Review, Vol. 31(2), (1996), pp.365-380.
11.
Dellva, Wilfred L.and Olson, Gerard T. "The Relationship between Mutual Fund Fees and Expenses and Their Effects on Performance", The Financial Review, Vol. 33(1), (Feb 1998), pp.85-104.
12.
Fama, "Components of Investment Performance", Journal of Finance, Vol. 27, (1972), pp.551-567
13.
Fernando, Chitru S et.al., "Is Share Price Related to Marketability? Evidence from Mutual Fund Share Splits", Journal of The Financial Management Association, Vol. 28(3), Autumn (1999) pp.54-67.
14.
Friend et.al, "A Study of Mutual Funds" U.S. Securities and Exchange Commission, USA, (1962).
15.
Friend, Blume, Crockett, Mutual Funds and Other Institutional Investors - A new perspective, Mc Graw Hill Book Company, New York, (1970).
16.
Angadhar V, "The Changing Pattern of Mutual Funds in India", The Management Accountant, Vol. 27 (12), (December 1992), pp. 924-28.
17.
Grubber, "The Persistence Of Risk-Adjusted Mutual Fund Performance", Journal of Business, Vol. 2, (1996), pp.133-157.
18.
Gupta L C, Mutual Funds and Asset Preference, Society for Capital Market Research and Development, New Delhi, First Edition (1992).
19.
Gupta, "The Mutual Fund Industry and Its Comparative Performance", Journal of Financial and Quantitative Analysis, Vol. 6, (1974), pp.894.
20.
Gupta, Ramesh "Mutual Funds", The Management Accountant, Vol. 24(5), (May 1989), pp.320-322.
21.
Ippolito R, "Efficiency with Costly Information: A Study of Mutual Fund Performance", Quarterly Journal of Economics, Vol. 104, (1989), pp.1-23.
22.
Irissappane, Aravazhi, (2000), 'Paradigm Shifts in the Performance of Indian Mutual Funds: An Analysis with Reference to Close-Ended Funds of Selected Institutions', UTI Institute of Capital Markets, Mumbai
23. Irwin, Brown, FE, et al., "A Study of Mutual Funds: Investment Policy and Investment Company Performance" reprinted in Hsiu-kwangwer and Alan Jzakon (Ed.) Elements of Investments, New York: Holt, Renchart and Winston, (1965), pp.371-385.
24.
Jensen Michael C, "The Performance Of Mutual Funds In The Period 1945-1964", Journal of Finance, Vol. 23, (1968), pp.389-416.
25.
Jiang, W., 2001, A Non Parametric Test of Market Timing, Journal of Empirical Finance 10, 399-425.
26.
Khorana, Ajay and Nelling, Edward "The Determinants And Predictive Ability Of Mutual Fund Ratings", Journal Of Investing, Vol. 7(3), Fall (1998), pp 61-66.
27.
Klemosky, "How Consistently Do Managers Manage", Journal of Portfolio Management, Vol. 3, (1977), pp.11-15.
28.
Klemosky, "The Bias in Composite Performance Measures", Journal of Financial and Quantitative Analysis, Vol. 8, (1973), pp.505-514.
29.
Maria Do Ceu Cortez & Florinda Silva, "Conditioning Information on Portfolio Performance Evaluation: A Reexamination of Performance Persistence in the Portuguese Mutual Fund Market", Finance India, Vol. XVI (4), (December 2002), pp. 1393-1408.
30.
McDonald and John, "Objectives And Performance Of Mutual Funds, 1960-69", Journal of Financial and Quantitative Analysis, Vol. 9, (1974), pp. 311-333.
31.
Meyer, "Further Applications of Stochastic Dominance to Mutual Fund Performance", Journal of Financial and Quantitative Analysis, Vol 12(1977) 917-924.
32.
Rich Fortin, and Stuart Michelson, "Are load Mutual Funds Worth the Price?", Journal Of Investing, Vol. 4(3) , (Fall 1995), pp. 89-94.
33.
Saha Asish and Rama Murthy Y Sree, "Managing Mutual Funds: Some Critical Issues", Journal of Social and Management Science, Vol. XXII (1), (1993-94), pp.25-35.
34.
Sahu R K and Panda J, "The Role And Future Of Mutual Funds In India", Management Accountant, (February 1993) pp. 91-3.
35.
Sanjay Kant Khare, (2007), 'Mutual Funds: A Refuge for Small Investors', Southern Economist, Vol.45(18)
36.
Sarkar A K, "Mutual Funds in India - Emerging Trends", The Management Accountant, Vol. 26 (3), (March 1991), pp.171-174.
37.
Shah Ajay and Thomas Susan, "Performance Evaluation of Professional Portfolio Management
In India", paper presented, CMIE, (10 April 1994).
38.
Sharpe, William F "Mutual Fund Performance", The Journal of Business, Vol. 39(1), (1966), pp.119-138.
39.
Shashikant Uma, (1995), Mutual Funds in India: Challenges, opportunities and Performance over time", Journal of Investing, Spring, Vol. 4(1), pp.8-17
40. Shashikant, Uma "Accounting Policy and Practices of Mutual Funds: The Need for Standardization", Prajan, Vol. XXIV (2), (1993), pp. 91-102.
68
Globa
l Jo
urna
l of M
anag
emen
t an
d Bu
siness Resea
rch
Volum
e XVI Issu
e VIII
Ver
sion
IYe
ar
()
2016
© 2016 Global Journals Inc. (US)1
C
41. Shome, "A Study of Performance of Indian Mutual Funds", unpublished thesis, Jhansi University, (1994).
Selection Abilities of Select Indian Mutual Fund Managers

42.
Shukla and Singh, "Are CFA Charter Holders Better Equity Fund Managers", Chartered Financial Analysts, Vol. 2, (1994), pp.68-74.
43.
Smith and Tito, "Risk-Return Measures of Post-Portfolio Performance" Journal of Financial and Quantitative Analysis, Vol. 4, (1969), pp.449-471.
44.
Statman, Meir "Socially Responsible Mutual Funds", Journal of Financial Analysts Vol. 56 (3) (May / June 2000), pp. 30-38.
45.
Treynor and Mazuy, "Can Mutual Funds Outguess the Markets" Harvard Business Review, Vol. 44, (1966), pp.131-136.
46.
Treynor Jack L, "How to Rate Management of Investment Funds", Harvard Business Review, Vol. 43(1), (1965), pp. 63-75.
47.
Vaid, Seema, "Mutual Fund Operations In India", Rishi Publications, Varnasi, (1994).
48.
Vidhyashankar S, "Mutual Funds: Emerging Trends In India", Chartered Secretary, Vol. 20(8), (August 1990), pp.639-640.
49.
Williamson, "Measurement and Forecasting of Mutual Fund Performance: Choosing an Investment Strategy", Financial Analysts Journal, Vol. 28, (1972), pp.78-84.
© 20 16 Global Journals Inc. (US)
69
Globa
l Jo
urna
l of M
anag
emen
t an
d Bu
siness Resea
rch
Volum
e XVI Issu
e VIII
Ver
sion
IYe
ar
()
2016
C
Selection Abilities of Select Indian Mutual Fund Managers

Global Journals Inc. (US)
Guidelines Handbook
2016
www.GlobalJournals.org