Selecting Optimum Cement Contents for Stabilizing Aggregate
64
Technical Report Documentation Page 1. Report No. FHWA/TX-05/7-4920-2 2. Government Accession No. 3. Recipient's Catalog No. 5. Report Date September 2001 Resubmitted: February 2002 4. Title and Subtitle SELECTING OPTIMUM CEMENT CONTENTS FOR STABILIZING AGGREGATE BASE MATERIALS 6. Performing Organization Code 7. Author(s) W. Spencer Guthrie, Stephen Sebesta, and Tom Scullion 8. Performing Organization Report No. Report 7-4920-2 10. Work Unit No. (TRAIS) 9. Performing Organization Name and Address Texas Transportation Institute The Texas A&M University System College Station, Texas 77843-3135 11. Contract or Grant No. Project 7-4920 13. Type of Report and Period Covered Technical Report: September 1998−August 2001 12. Sponsoring Agency Name and Address Texas Department of Transportation Research and Technology Implementation Office P. O. Box 5080 Austin Texas 78763-5080 14. Sponsoring Agency Code 15. Supplementary Notes Project performed in cooperation with the Texas Department of Transportation and the Federal Highway Administration. Project Title: Improving Long-Term Flexible Pavement Performance URL:http://ttitamu.edu/documents/7-4920-2.pdf 16. Abstract Researchers designed a laboratory test sequence to identify the optimum amount of portland type I cement for stabilizing two aggregates, limestone and recycled concrete, typically used in the Houston District. Smectitic compositions identified through mineralogical investigations corresponded with the poor performance of the untreated aggregates in preliminary testing and substantiated the need for stabilization. Samples were subsequently treated with 1.5, 3.0, and 4.5 percent cement and tested for strength, shrinkage, durability, and moisture susceptibility in the laboratory. Strength was determined with the Soil Cement Compressive Strength Test (TxDOT Test Method Tex-120-E), and a linear shrinkage test was developed to assess shrinkage characteristics. Durability was evaluated with the South African Wheel Tracker Erosion Test (SAWTET), and moisture susceptibility was assessed with the Tube Suction Test (TST). The limestone aggregate was also subjected to modulus testing. Based on these parameters, stabilized samples exhibited markedly improved performance with minimum additions of cement. Based on the results of the laboratory testing, the recommendation of this report is 3.0 percent cement for the limestone and 1.5 percent cement for the recycled concrete. For future testing of aggregate base materials to determine optimum cement contents, the joint utilization of the strength test and the TST is recommended. Sufficient quantities of cement should be added to tested samples to obtain minimum unconfined compressive strengths of 300 psi in the former and maximum average surface dielectric values of 10 in the latter. The minimum amount of cement necessary to satisfy both criteria should be recommended for pavement construction. In addition to these tentative specifications, a provisional pre-cracking procedure is also suggested in this report for further evaluation. 17. Key Words Aggregate Base Materials, Cement Stabilization, Durability, Moisture Susceptibility, Pre-cracking, Shrinkage Cracking, Tube Suction Test 18. Distribution Statement No restrictions. This document is available to the public through NTIS: National Technical Information Service Springfield, Virginia 22161 http://www.ntis.gov 19. Security Classif.(of this report) Unclassified 20. Security Classif.(of this page) Unclassified 21. No. of Pages 64 22. Price Form DOT F 1700.7 (8-72) Reproduction of completed page authorized
Transcript of Selecting Optimum Cement Contents for Stabilizing Aggregate
Technical Report Documentation Page 1. Report No. FHWA/TX-05/7-4920-2
2. Government Accession No.
3. Recipient's Catalog No. 5. Report Date September 2001 Resubmitted: February 2002
4. Title and Subtitle SELECTING OPTIMUM CEMENT CONTENTS FOR STABILIZING AGGREGATE BASE MATERIALS
6. Performing Organization Code
7. Author(s) W. Spencer Guthrie, Stephen Sebesta, and Tom Scullion
8. Performing Organization Report No. Report 7-4920-2 10. Work Unit No. (TRAIS)
9. Performing Organization Name and Address Texas Transportation Institute The Texas A&M University System College Station, Texas 77843-3135
11. Contract or Grant No. Project 7-4920 13. Type of Report and Period Covered Technical Report: September 1998−August 2001
12. Sponsoring Agency Name and Address Texas Department of Transportation Research and Technology Implementation Office P. O. Box 5080 Austin Texas 78763-5080
14. Sponsoring Agency Code
15. Supplementary Notes Project performed in cooperation with the Texas Department of Transportation and the Federal Highway Administration. Project Title: Improving Long-Term Flexible Pavement Performance URL:http://ttitamu.edu/documents/7-4920-2.pdf 16. Abstract
Researchers designed a laboratory test sequence to identify the optimum amount of portland type I cement for stabilizing two aggregates, limestone and recycled concrete, typically used in the Houston District. Smectitic compositions identified through mineralogical investigations corresponded with the poor performance of the untreated aggregates in preliminary testing and substantiated the need for stabilization. Samples were subsequently treated with 1.5, 3.0, and 4.5 percent cement and tested for strength, shrinkage, durability, and moisture susceptibility in the laboratory. Strength was determined with the Soil Cement Compressive Strength Test (TxDOT Test Method Tex-120-E), and a linear shrinkage test was developed to assess shrinkage characteristics. Durability was evaluated with the South African Wheel Tracker Erosion Test (SAWTET), and moisture susceptibility was assessed with the Tube Suction Test (TST). The limestone aggregate was also subjected to modulus testing. Based on these parameters, stabilized samples exhibited markedly improved performance with minimum additions of cement. Based on the results of the laboratory testing, the recommendation of this report is 3.0 percent cement for the limestone and 1.5 percent cement for the recycled concrete. For future testing of aggregate base materials to determine optimum cement contents, the joint utilization of the strength test and the TST is recommended. Sufficient quantities of cement should be added to tested samples to obtain minimum unconfined compressive strengths of 300 psi in the former and maximum average surface dielectric values of 10 in the latter. The minimum amount of cement necessary to satisfy both criteria should be recommended for pavement construction. In addition to these tentative specifications, a provisional pre-cracking procedure is also suggested in this report for further evaluation. 17. Key Words Aggregate Base Materials, Cement Stabilization, Durability, Moisture Susceptibility, Pre-cracking, Shrinkage Cracking, Tube Suction Test
18. Distribution Statement No restrictions. This document is available to the public through NTIS: National Technical Information Service Springfield, Virginia 22161 http://www.ntis.gov
19. Security Classif.(of this report) Unclassified
20. Security Classif.(of this page) Unclassified
21. No. of Pages 64
22. Price
Form DOT F 1700.7 (8-72) Reproduction of completed page authorized

SELECTING OPTIMUM CEMENT CONTENTS FOR STABILIZING AGGREGATE BASE MATERIALS
by
W. Spencer Guthrie, E.I.T. Graduate Research Assistant
Texas Transportation Institute
Stephen Sebesta Assistant Transportation Researcher
Texas Transportation Institute
and
Tom Scullion, P.E. Research Engineer
Texas Transportation Institute
Report 7-4920-2 Project 7-4920
Project Title: Improving Long-Term Flexible Pavement Performance
Performed in cooperation with the Texas Department of Transportation
and the Federal Highway Administration
September 2001 Resubmitted: February 2002
TEXAS TRANSPORTATION INSTITUTE The Texas A&M University System
College Station, TX 77843-3135

v
DISCLAIMER
The contents of this report reflect the views of the authors, who are responsible for the
opinions, findings, and conclusions presented herein. The contents do not necessarily reflect the
official views or policies of the Texas Transportation Institute (TTI) or the Texas Department of
Transportation (TxDOT). This report does not constitute a standard, specification, or regulation,
nor is it intended for construction, bidding, or permit purposes. Trade names were used solely
for information and not for product endorsement. The engineer in charge of the project was Tom
Scullion, P.E. #62683.
vi
ACKNOWLEDGMENTS
The authors wish to acknowledge Mr. Pat Henry, P.E., of the Houston District for
arranging this project and serving as project director. His support and flexibility are appreciated.
While Mr. Henry provided the recycled concrete evaluated in this project, Mr. Paul Waites,
supervisor of the Melendy Plant of the Martin Marietta Company in Jersey Village, donated the
limestone aggregate. Mr. Lee Gustavus of TTI was instrumental in obtaining the aggregate
samples and facilitating laboratory needs. Mr. Seungwook Lim and Mr. Imran Syed, graduate
students in the Department of Civil Engineering at Texas A&M University, assisted with the
literature review provided in this report. With assistance from Dr. Pat Harris of TTI, Mr. Syed
also performed the mineralogical evaluation of the recycled concrete aggregate. The
mineralogical investigation of the limestone aggregate was accomplished with support from Dr.
Joe Dixon and Dr. Norman White of the Department of Soil and Crop Sciences at Texas A&M
University. Dr. White provided the scanning electron microscopy images (SEM) included in this
report. Uniaxial resilient modulus tests were performed by Mr. Gene Schlieker of TTI.
vii
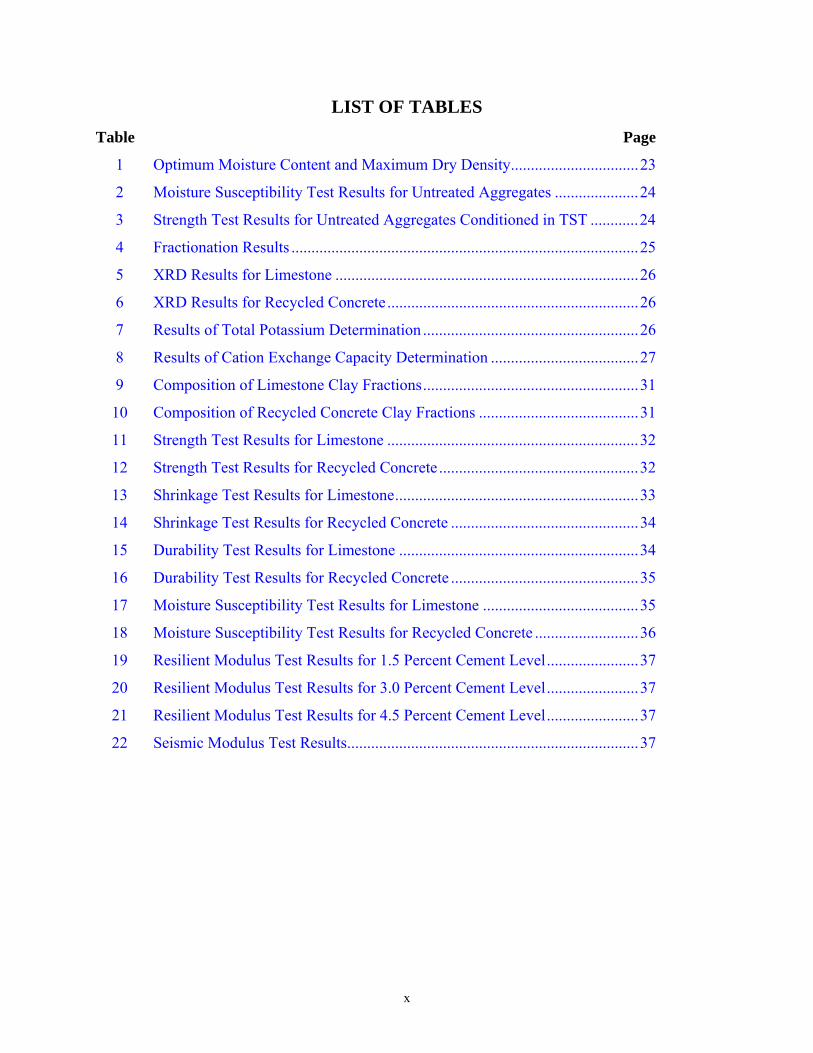
TABLE OF CONTENTS Page
LIST OF FIGURES ........................................................................................................ix
LIST OF TABLES...........................................................................................................x
CHAPTER 1 INTRODUCTION ...................................................................................1
General.....................................................................................................1
CHAPTER 2 BACKGROUND .....................................................................................3
Design Considerations .............................................................................3
Mineralogy...............................................................................................3
Strength ....................................................................................................4
Shrinkage .................................................................................................5
Durability .................................................................................................6
Moisture Susceptibility ............................................................................7
Modulus ...................................................................................................9
CHAPTER 3 TEST PROCEDURES...........................................................................11
Aggregate Characterization Tests ..........................................................11
Mineralogy Tests ...................................................................................12
Strength Test ..........................................................................................15
Shrinkage Test .......................................................................................15
Durability Test .......................................................................................17
Moisture Susceptibility Test ..................................................................19
Modulus Test .........................................................................................20
CHAPTER 4 TEST RESULTS....................................................................................23
Aggregate Characterization Test Results...............................................23
Mineralogy Test Results ........................................................................24
Strength Test Results .............................................................................31
Shrinkage Test Results...........................................................................33
Durability Test Results ..........................................................................34
Moisture Susceptibility Test Results .....................................................35
Modulus Test Results.............................................................................36
viii
TABLE OF CONTENTS (CONTINUED) Page
CHAPTER 5 CONCLUSION......................................................................................39
Summary ................................................................................................39
Findings..................................................................................................40
Recommendations..................................................................................41
REFERENCES ..............................................................................................................43
APPENDIX: PROVISIONAL PRE-CRACKING SPECIFICATION.........................49
ix
LIST OF FIGURES Figure Page
1 Structuring of Water Molecules ........................................................................8
2 TST Arrangement for Unstabilized Aggregates..............................................11
3 Beam Sample...................................................................................................16
4 Shrinkage Measurement Device......................................................................17
5 Cast Beam Sample...........................................................................................18
6 Wheel Tracking Machine ................................................................................18
7 Measurement Jig..............................................................................................19
8 Using the Adek PercometerTM.........................................................................20
9 Resilient Modulus Testing...............................................................................21
10 Seismic Testing ...............................................................................................22
11 Sieve Analyses.................................................................................................23
12 Aggregated Calcite Particles ...........................................................................28
13 Opal and Quartz Particles ................................................................................28
14 Conchoidal Quartz Fracture ............................................................................29
15 Kaolinite Vermiform .......................................................................................29
16 Quartz Morphology .........................................................................................30
17 Iron Oxide Fossil .............................................................................................30
18 Using the Humboldt Stiffness Gauge ..............................................................52
19 Pre-cracking Operations with Vibratory Roller ..............................................52
20 Microcracks in Cement-Treated Base Layer ...................................................53
x
LIST OF TABLES Table Page
1 Optimum Moisture Content and Maximum Dry Density................................23
2 Moisture Susceptibility Test Results for Untreated Aggregates .....................24
3 Strength Test Results for Untreated Aggregates Conditioned in TST ............24
4 Fractionation Results .......................................................................................25
5 XRD Results for Limestone ............................................................................26
6 XRD Results for Recycled Concrete...............................................................26
7 Results of Total Potassium Determination ......................................................26
8 Results of Cation Exchange Capacity Determination .....................................27
9 Composition of Limestone Clay Fractions......................................................31
10 Composition of Recycled Concrete Clay Fractions ........................................31
11 Strength Test Results for Limestone ...............................................................32
12 Strength Test Results for Recycled Concrete ..................................................32
13 Shrinkage Test Results for Limestone.............................................................33
14 Shrinkage Test Results for Recycled Concrete ...............................................34
15 Durability Test Results for Limestone ............................................................34
16 Durability Test Results for Recycled Concrete ...............................................35
17 Moisture Susceptibility Test Results for Limestone .......................................35
18 Moisture Susceptibility Test Results for Recycled Concrete ..........................36
19 Resilient Modulus Test Results for 1.5 Percent Cement Level.......................37
20 Resilient Modulus Test Results for 3.0 Percent Cement Level.......................37
21 Resilient Modulus Test Results for 4.5 Percent Cement Level.......................37
22 Seismic Modulus Test Results.........................................................................37
1
CHAPTER 1. INTRODUCTION
GENERAL
Cement has been applied in situ to modify and stabilize soils and aggregate layers for
highway construction since 1935 (1). Recently, however, some traditionally strong markets for
cement usage have reduced their use of cement treatments due to several factors, such as
shrinkage cracking and faulting, that cause accelerated materials degradation and premature
pavement failure. While the current procedures for determining design levels of cement
treatments are based mainly on compressive strength, additional tests have become available for
assessing other properties of cement-stabilized aggregates that could be used to more accurately
predict performance in the field and more appropriately select optimum cement contents.
In 1998, the Houston District of the Texas Department of Transportation (TxDOT)
initiated a research project with the Texas Transportation Institute (TTI) to use some of these
tests to determine the impact of varying cement levels on performance-related engineering
properties of aggregate base materials. Two aggregates typically used in the Houston area,
limestone and recycled concrete, were selected for the testing.
The laboratory test program was designed to evaluate compressive strength, shrinkage,
durability, and moisture susceptibility of the aggregates at three levels of portland type I cement
treatment, including 1.5, 3.0, and 4.5 percent. The test procedures chosen to evaluate each
engineering property were the Soil Cement Compressive Strength Test (TxDOT Test Method
Tex-120-E), a linear shrinkage test, the South African Wheel Tracker Erosion Test (SAWTET),
and the Tube Suction Test (TST), respectively. Researchers also performed modulus
measurements on cement-treated samples of the limestone aggregate. The research objective
was to identify an optimum cement content for each aggregate that would meet strength
requirements, minimize shrinkage, improve durability, and reduce moisture susceptibility. The
following chapters provide background information, detailed laboratory procedures, test results,
and conclusions.

3
CHAPTER 2. BACKGROUND
DESIGN CONSIDERATIONS
Most problems with cement-stabilized base layers in pavements stem from the fact that
current design practices are based only on strength, without consideration of long-term durability
or performance. For example, many state departments of transportation require sufficient cement
to achieve a minimum unconfined compressive strength as high as 750 psi after seven days (1).
While this level of cement results in a very stiff aggregate layer characterized by a high resilient
modulus, it does not necessarily guarantee acceptable long-term pavement performance.
In many roadways, for instance, shrinkage cracks within heavily cement-stabilized base
layers reflect into the surface treatments and appear as transverse cracks with a spacing of
between 3 ft and 60 ft (1). Although the cracks themselves may not present a structural problem,
they often accelerate degradation of the pavement by allowing water to enter lower pavement
layers. Several documented cases demonstrate the ability of moisture to disintegrate underlying
base materials, causing a reduction in pavement support and a corresponding increase in
pavement roughness that often leads to unacceptable riding quality (2).
Thus, the focus of the research conducted in this project was to evaluate supplements to
strength-based design procedures (3). To this end, following the completion of mineralogical
characterizations, researchers used a series of laboratory test procedures to analyze strength,
shrinkage, durability, and moisture susceptibility characteristics at three levels of cement
treatment for each of the aggregates included in this project. Modulus testing was also
performed on the limestone aggregate. A discussion of each topic follows.
MINERALOGY
Aggregates are predominantly comprised of small mineral crystals that give rise to most
of their physical and chemical properties (4). The primary purpose of mineralogical testing is to
identify and quantify the individual mineral constituents. The use of x-ray diffraction (XRD) for
the qualitative identification of minerals is the backbone of these laboratory investigations.
Chemical tests for total potassium determination and cation exchange capacity (CEC) are useful
supplements for estimating the quantity of each identified mineral. Imaging microscropy
4
provides information about the morphology of individual particles, including shape, angularity,
texture, and agglomeration (5).
These physical and chemical characteristics of soil minerals are important factors in
considering the engineering performance of aggregate base materials. Understanding the
mineralogical composition of aggregates aids in determining such physical parameters as surface
area, affinity for water, and volume stability. The chemistry of reactions can be investigated
through identification of individual mineral constituents that play a significant role in the
strength and durability of materials. In this project, the performance of the untreated materials in
the preliminary characterization was related to the mineral composition of the aggregates, with
emphasis placed on the amount of smectite because of its high surface area and reactivity (6).
STRENGTH
Although the Portland Cement Association and the United States Army Corps of
Engineers developed their individual design criteria for cement-stabilized base materials in
accordance with both strength and durability requirements, most state departments of
transportation have historically focused on compressive strength alone (7, 8). In the 1960s, for
example, the California Division of Highways proposed a minimum strength criterion of 850 psi
at seven days for cement-stabilized base materials, which was thereafter reduced to 750 psi
following several instances of severe shrinkage cracking. During the same period, minimum
strength criteria of 700 psi, 250 to 400 psi, 300 psi, and 450 psi were issued by the Texas
Department of Transportation, the Road Research Laboratory in the United Kingdom, the United
States Air Force, and the Iowa Department of Transportation, respectively (1).
The Texas Department of Transportation constructed thousands of highway miles with
cement-stabilized base layers designed to meet the 700 psi requirement and experienced, like in
California, unsatisfactory performance in many instances due to shrinkage cracking (1). This led
several of the Texas districts to abandon the use of cement-stabilized bases in preference to lime
or fly ash combinations. The use of cement has only made a resurgence in recent years through
significant changes in design criteria, where the target seven-day unconfined compressive
strength has been reduced to lower values. Although lower cement contents have been shown to
improve the long-term performance of stabilized layers, there is still little agreement in the
highway community on the selection of a minimum strength requirement. Unconfined
5
compressive strength remains the most widely referenced property for the design of cement-
stabilized aggregate base materials, however, and is therefore included in this laboratory test
program.
SHRINKAGE
The majority of performance problems occurring in cement-stabilized aggregate base
materials are related to shrinkage cracking. While fine, distantly spaced shrinkage cracks do not
generally create a structural deficiency in the pavement system, poor performance can result
from wide, closely spaced cracks that cause poor load transfer and unacceptable riding quality.
The shrinkage of cement-treated materials results from the loss of water by drying and
from self-desiccation during the hydration of cement (9, 10). Several factors influence the
magnitude and rate of shrinkage, including mixture proportions and the material properties of
individual constituents. Generally, materials containing higher fines contents exhibit greater
shrinkage potential than coarser materials, which, depending on subbase friction and the tensile
strength of the base layer, can lead to the formation of wider cracks (9). The type of clay mineral
present also influences the drying shrinkage potential, with the smectite group exerting the most
pronounced influence (11).
Efforts to minimize shrinkage cracking have centered on material selection, mixture
design, curing quality, and specific construction techniques. Based on research in Queensland,
for example, the Australian code of practice for cement applications has recently changed to
control gradations of raw materials as well as to introduce laboratory-measured linear shrinkage
as an indicator of shrinkage potential in the field (11). Furthermore, the use of low-shrinkage
cement blended with fly ash was recommended to reduce shrinkage strains in treated aggregates.
Limited laboratory testing in Georgia showed that the use of expansive cement also provided a
marked reduction in shrinkage cracking compared to portland type I cement (12).
Effective retention of moisture in cement-treated materials is especially important for
promoting cement hydration and corresponding strength gain while reducing shrinkage. The
impacts of drying shrinkage can be combated by application of a curing emulsion immediately
after construction of the cement-treated base layer (13). Some researchers suggest that delaying
placement of the surface by as long as practical afterwards should then reduce reflective cracking
6
through the surface layer simply because less shrinkage of the base occurs after surface
application (14).
From the construction viewpoint, efforts to further delay the appearance of shrinkage
cracks at the surface are manifest in design of the “upside-down” pavement section (15). An
untreated granular layer between the cement-treated base and the surface layer is added to disrupt
crack growth into the surface. Saw-cutting has also been used to control the spacing of cracks,
where the pre-determined spacing is a function of the material strength, shrinkage stress
development, and crack potential (16).
In the field, pre-cracking is a viable method for reducing reflection cracking through
surface layers placed over cement-treated bases. Pre-cracking should occur within one to three
days after placement, where heavy traffic or vibratory rollers can be used to create networks of
microcracks within the base layer that eliminate the development of larger shrinkage cracks (17).
A recommended provisional specification for pre-cracking procedures was developed at TTI and
is given in the appendix of this report (18). In consideration of the important role shrinkage
cracking plays in the performance of cement-treated materials, this research project included a
measure of linear shrinkage among the laboratory tests.
DURABILITY
Traditional durability testing is generally concerned with abrasion resistance, where the
Wet-Dry Test (ASTM D 559) and the Freeze-Thaw Test (ASTM D 560) are most common.
With these tests, the weight loss of a cement-treated material under wire brushing is determined
through 12 cycles of wetting and drying or freezing and thawing, where the maximum allowable
weight loss is a function of the aggregate classification. In research performed by the Portland
Cement Association, about 20 percent of the samples with a seven-day compressive strength of
300 psi would pass the freezing and thawing test, while about 70 percent would pass with a
compressive strength of 500 psi (7). This correlation between compressive strength and
resistance to freezing and thawing damage was documented for guidance in mixture design,
where higher cement levels generally decrease the average pore size and reduce the permeability
of treated materials, making a sample more difficult to critically saturate (10).
For this project, however, researchers utilized a wheel tracking test developed in South
Africa for assessing the durability of cement-treated materials because it better models the in situ
7
distress mechanisms experienced by aggregates. The SAWTET specifically simulates the stress
conditions that are induced by heavy traffic loading within a base material constructed under a
thin surfacing (19). In the test, three rectangular specimens are submersed in water and covered
with a rubber membrane. The bottom side of the membrane has a rough grit surfacing that
erodes each sample under the back-and-forth motion of three overhead wheels, each 39 lb. in
weight. After 5000 passes, the depth of erosion is measured at 15 points on each sample surface
and averaged to evaluate durability (19).
The SAWTET has been used in Texas to evaluate the durability of cement-treated
materials, where the same samples were used to assess both shrinkage and erosion properties
(20). Researchers included this test in this project to evaluate the consequences of reduced
cement contents on abrasion resistance.
MOISTURE SUSCEPTIBILITY
The permanency of stabilization is a major concern with all stabilizing materials. Many
state departments of transportation have experienced problems with stabilizers “disappearing”
after a few years of service (21). While this predicament is more common in layers stabilized
with lime and fly ash, cement-treated materials have also been found to be susceptible to
chemical reversals of the stabilization process. Generally, such reversals are associated with
moisture intrusion and movement within the stabilized layer. Calcium hydroxide, for example,
which is one of the principal constituents in materials treated with either lime or cement, has a
very high solubility in water and may be leached rather rapidly (4). Combined with traffic
loading, the leaching out of cementitious components from an aggregate matrix by moisture and
the subsequent formation of less stable phases can accelerate deterioration of base materials and
cause early failure due to loss of strength.
During the past few years, the TST has been developed at TTI for investigating the
moisture susceptibility of aggregate base materials (22). The moisture susceptibility ranking is
based on the surface dielectric value of a compacted specimen after a 10-day capillary soak in
the laboratory and depends upon the suction and permeability of the aggregate layer and the state
of bonding of water that accumulates within the aggregate matrix.
Research studies in Texas and Finland have demonstrated that moisture susceptibility is
related to the suction properties of soils and aggregates (22, 23). Soil suction characterizations
8
are derived from the study of moisture flow through soil media and are composed of both
osmotic and matric suction components. Osmotic suction is the suction potential resulting from
salts present in the water portion of a soil system. Matric suction is the suction potential due to
the matrix arrangement of the soil particles themselves. Tightly compacted particles form
capillaries through which water may flow (23).
Materials exhibiting high suction potential are strongly hydrophilic, and, when water is
available, moisture ingress can rapidly deteriorate their engineering properties. Higher
permeability results from more interconnected void space within the pore structure that allows
water to more easily flow into and through the aggregate matrix. Permeability is an especially
important issue in moisture damage mechanisms, such as frost heave, where water must be able
to rapidly respond to changes in suction within the pavement structure (24).
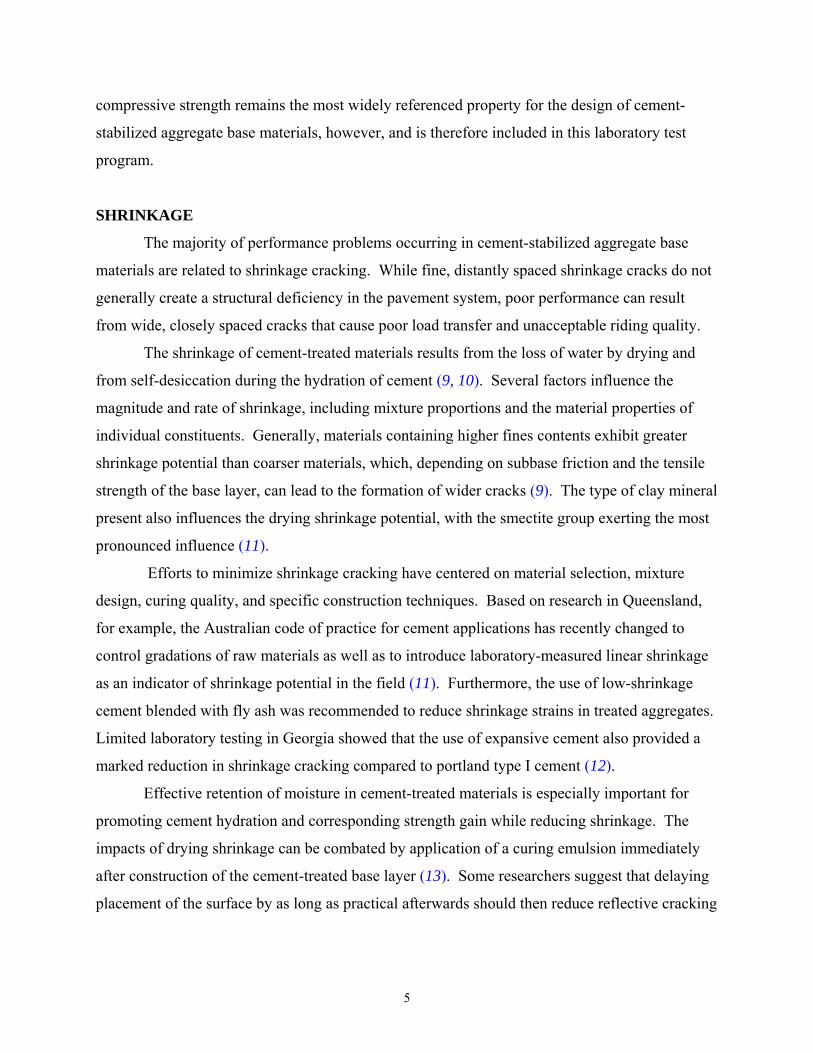
The state of bonding of water describes the structuring of the water molecules within the
soil or aggregate matrix. Adsorbed water molecules are arranged in layers around aggregate
particles as displayed in Figure 1. The first layer is a tightly bound, monomolecular layer, but as
the distance from the aggregate surface increases, the water layers become more and more
loosely bound. So-called viscous, or capillary, water molecules beyond the zone of electrical
capture are considered unbound and, depending on permeability and time, can migrate within the
pavement structure (26).
Figure 1. Structuring of Water Molecules (25).
9
The interpretation of TST results is based on an empirical relationship between the final
dielectric value and the expected performance of aggregate base materials, where the dielectric
value of an aggregate in the TST is most sensitive to the amount of unbound water in the sample
(27). Because the TST can be used to readily measure the affinity of an aggregate for moisture,
researchers also included it in the laboratory test program developed for this project.
MODULUS
The modulus of a base material is often utilized in design procedures to determine the
necessary thickness of the base layer, where strength and thickness are presumed interchangeable
(28). The 2002 AASHTO Design Guide will incorporate a mechanistic-empirical design
approach requiring a modulus input for each layer for relating the stress and strain distributions
through the pavement profile.
In this project, the Standard Method of Test for Resilient Modulus of Subgrade Soils and
Untreated Base/Subbase Materials (AASHTO T 292-91) was used despite its specific
applicability to unbound base materials. Its selection for use in this project evaluating lightly
stabilized materials resulted from personnel preference over the diametral test arrangement
described in the Indirect Tension Test for Resilient Modulus of Bituminous Mixtures (ASTM
D4123-82). A free-free resonant column method developed at the University of Texas at El Paso
was also utilized (29).
In the former test, linear variable differential transformers (LVDTs) are utilized to
measure deflections within a specified gauge length of the sample under a repeated load, and the
recoverable strain after a 200-cycle conditioning period is used to calculate the resilient modulus.
The latter technique is based on elastic wave propagation, where the velocity of seismic waves
within a sample can be used to calculate Young’s modulus, the shear modulus of elasticity, and
Poisson’s ratio. At one end of a sample, the energy source is given as a light tap from a hammer
equipped with a load cell that measures the energy input and triggers a timing circuit. An
accelerometer mounted at the other end of the sample reports the time of longitudinal and
transverse wave arrivals necessary to complete the computer-automated calculations.
In longitudinal waves (P-waves), the particles of the medium move in the direction of
wave travel, causing alternating expansions and contractions of the medium. In transverse waves
(S-waves), the motion of the particles is perpendicular to the direction of wave travel. The
10
equations of motion for dilatation and shear disturbances propagating through a material can be
derived in terms of dilatational and rotation strains. The physical implication of these equations
is that the velocities of longitudinal and transverse waves are related to the elastic properties of
the material (30).
11
CHAPTER 3. TEST PROCEDURES
AGGREGATE CHARACTERIZATION TESTS
The purpose of this project was to utilize a set of laboratory tests based on both strength
and long-term durability to determine the optimum content of portland type I cement for
stabilizing limestone and recycled concrete aggregates typically used in the Houston District. A
mechanical sieve analysis and a determination of optimum moisture content (OMC) and
maximum dry density preceded all other testing. To demonstrate the effects of cement
stabilization on each aggregate, researchers then performed several tests on the untreated
materials. Both aggregates were submitted in their raw condition to the TST to evaluate
moisture susceptibility prior to the addition of cement. The typical testing arrangement for
untreated granular materials is shown in Figure 2. Immediately following the TST, the
unconfined compressive strength of each sample was measured, and the mineralogy of both
aggregates was also determined.
Following this preliminary characterization testing, the aggregates were treated with 1.5,
3.0, and 4.5 percent portland type I cement and tested for strength, shrinkage, durability, and
moisture susceptibility in a series of four tests. These tests included the Soil Cement
Compressive Strength Test (TxDOT Test Method Tex-120-E), a linear shrinkage test, the
Figure 2. TST Arrangement for Unstabilized Aggregates.
12
SAWTET, and the TST. Performance criteria proposed for each test are included in the
following sections describing each test procedure. Modulus measurements were also performed
on stabilized limestone samples. In addition to the Standard Method of Test for Resilient
Modulus of Subgrade Soils and Untreated Base/Subbase Materials (AASHTO T 292-91), a free-
free resonant column test developed at the University of Texas at El Paso was also included in
the laboratory test program (29).
MINERALOGY TESTS
The procedures for mineralogical determinations included pretreatments, dispersion and
fractionation of the bulk sample, XRD, total potassium determination, CEC determination, and
scanning electron microscopy (SEM) of the clay fractions. While the limestone sample was
subjected to each step of the evaluation, the SEM evaluation was not performed on the recycled
concrete. An overview of these procedures follows (5).
Pretreatments
A bulk limestone sample representative of the complete gradation was oven dried and
sufficiently crushed to pass through a 0.0787-in. (No. 10) sieve prior to pretreatments. The bulk
recycled concrete sample was scalped on the No. 10 sieve directly, which, while eliminating the
need for crushing, precluded any evaluation of the mineralogical components of the larger size
fractions. The pretreatments included NaOAc and H2O2 for removal of carbonates and organic
material, respectively, which act as binding agents in soils. The sample was then split on a
0.0029-in. (No. 200) sieve, and pH 4 1 N NaOAc was used to treat the coarse fraction for
removal of carbonates. The fine fraction was treated with pH 5 1 N NaOAc for the same
purpose. Organic matter, sulfides, and manganese oxides were removed with H2O2, and residues
were washed out of the system with pH 5 1 N NaOAc and 1 N NaCl.
Dispersion and Fractionation
Following removal of the above-mentioned binding agents, the sample was dispersed and
fractionated. Because some minerals tend to occur in certain size fractions, the size fractionation
was important for concentrating mineral phases and improving layer silicate preferred
orientation. After dispersion with pH 10 Na2CO3, the sample was scalped on a 0.0017-in. (No.
13
325) sieve to separate the sand fraction. Stoke’s Law was then applied to centrifugation for
separation of the silt, coarse clay, and fine clay fractions. The silt and coarse clay were separated
at 0.0787 mils, and the coarse clay and fine clay were separated at 0.0079 mils.
X-Ray Diffraction
For XRD, dried samples were examined on glass slides and x-rayed over a range of
angles from 2° to 65° 2θ using CuK radiation. A bulk sample was first x-rayed, followed by
samples of various size fractions. The sand fraction was ground sufficiently to pass through a
0.0035-in. (No. 180) sieve, and subsamples of the sand and silt fractions were front loaded into
an aluminum powder mount and x-rayed. The coarse clay was washed with distilled water and
dried, and the fine clay was flocculated with NaCl and subjected to dialysis and freeze-drying
before XRD was performed. One subsample of each of the coarse and fine clay fractions was
saturated with Mg and prepared for XRD on glass slides, while another subsample of each of the
coarse and fine clay fractions was saturated with K and prepared on Vicor slides. Treatment of
the Mg slides with glycerol aided in the detection of smectite, and XRD of the K slides at 77 °F,
572 °F, and 1022 °F afforded distinction of chlorite, hydroxy-interlayered phyllosilicates, mica,
and kaolinite.
Total Potassium Determination
The determination of total K was necessary for estimating the amount of mica in the
sample, given that 10 percent K2O equals 100 percent mica in the absence of potassium
feldspars. In this step, two samples of dried coarse clay and fine clay were each submitted to
acid dissolution and fusion. Atomic absorption was then used to determine the K concentration
in each of the final solutions.
Cation Exchange Capacity Determination
Because many common minerals have unique values of CEC, this testing can aid in
quantifying the amounts of each mineral present in a given aggregate. CEC denotes the tendency
for cations in solution to replace cations adsorbed on the mineral exchange surface. Higher CEC
values indicate a greater number of cation exchange sites on the mineral surface. Exchanges
14
generally follow the concentration-valency rule so that the apparent preference of the mineral
surface for an ion of higher charge increases with dilution of the solution (4).
Studies in surface chemistry indicate that the thickness of the adsorbed water layer can be
reduced by increasing the valence and concentration of the cations within the layer (4). This is a
fundamental mechanism of lime stabilization, for instance, that brings about almost immediate
textural changes in clayey soils. Decreasing the water layer thickness promotes flocculation of
clay particles and increases the shear strength of the soil matrix (31).
As in the determination of total K, two samples each of dried coarse clay and fine clay
were used in this procedure. The samples were saturated with Ca and then washed with 1 N
MgCl2. During the washing, adsorbed Ca ions were replaced by Mg ions at cation exchange
sites on the mineral surface, which allowed freed Ca ions to be released into the supernatant.
The supernatant was sampled, and the concentration of Ca cations was determined with atomic
absorption spectroscopy. Values of replicate samples were averaged for CEC calculations,
where higher substitutions of Mg for Ca yield higher CEC results. Typical values are given in
Chapter 4.
Scanning Electron Microscopy
Researchers used SEM to examine the morphology and elemental composition of the
bulk sample and the silt fraction of the crushed limestone material. Interpretations of SEM data
were aided by prior knowledge of the mineralogy of the sample as determined from XRD.
Data Synthesis
Final descriptions of the mineralogy of each aggregate were prepared from integrated
analyses of the collected test data. XRD was successful in identifying constituent minerals, and
the relative sizes of some peaks, such as those for quartz and kaolinite, were used to compute the
relative percentages of those minerals comprising the bulk sample. The total potassium
measurement provided a direct estimate of the mica content, and the total CEC was used to
calculate the percentages of minerals whose individual CEC values were independently known
from the literature (5).
The total CEC was decomposed into a summation of products of individual CEC values
and their respective compositional percentages. A system of two equations was constructed for
15
each clay fraction of each aggregate sample, with one equation derived from CEC data and the
other from mass balance rules, where the sum of all mass fractions was required to equal 100
percent. The solution for the system of equations then yielded the quantitative estimates of each
mineral present in each clay fraction. For the limestone aggregate, imaging microscopy provided
additional details about the physical structure of the minerals and served to confirm the XRD
results. The mineral composition of both aggregates was then related to the performance of the
untreated materials in preliminary testing.
STRENGTH TEST
The measurement of unconfined compressive strength in this project followed the
procedures of the Soil Cement Compressive Strength Test (TxDOT Test Method Tex-120-E),
except that the aggregates were scalped on the 1-in. sieve prior to sample construction, and
distilled water was specified for mixing. The distilled water was used to avoid contamination of
the samples by any ions present in regular tap water, which might have altered the performance
of samples in the TST by increasing osmotic suction. Compacted samples were capped with
gypsum prior to the testing, which was accomplished at a constant loading rate of 0.135 in./min
under a floating head until failure.
For each cement level, this test was performed at three combinations of moisture and
time of curing. Samples cured at 100 percent relative humidity and 77 °F were tested at seven
days and at 28 days. Also, samples that had been subjected to the TST and then placed
underwater until after reaching constant weight were tested in their soaked condition. Regular
tap water was used for soaking purposes. For the seven-day curing, a strength of 300 psi was set
as the minimum threshold, while the minimum strength after soaking was specified to be greater
than 80 percent of the 28-day strength.
SHRINKAGE TEST
Researchers prepared rectangular beam samples for the linear shrinkage test. After the
aggregate was scalped on the 0.75-in. sieve, mixing was performed according to TxDOT Test
Method Tex-120-E. Again, distilled water was used for mixing. The beams were then
constructed in three lifts inside a metal form, with each lift compacted by 56 blows of a 10-lb.
hammer dropped from a height of 18 in. A leveling load of 18,000 lb. was applied across the top
16
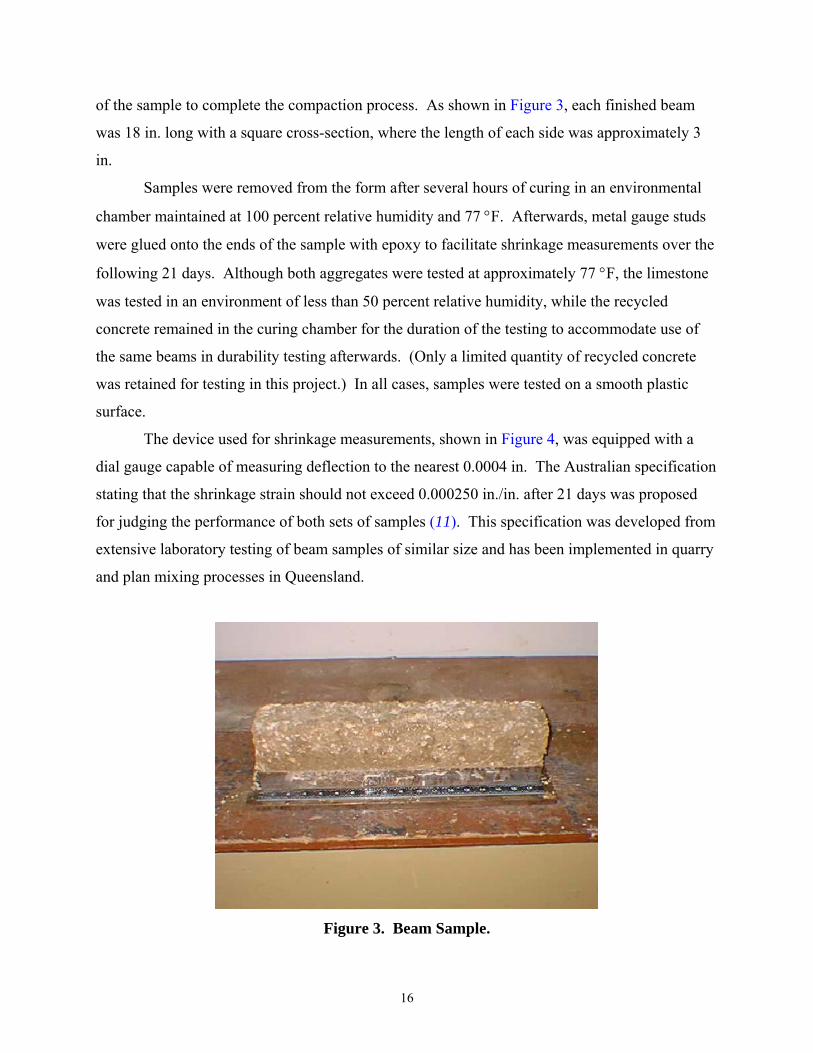
of the sample to complete the compaction process. As shown in Figure 3, each finished beam
was 18 in. long with a square cross-section, where the length of each side was approximately 3
in.
Samples were removed from the form after several hours of curing in an environmental
chamber maintained at 100 percent relative humidity and 77 °F. Afterwards, metal gauge studs
were glued onto the ends of the sample with epoxy to facilitate shrinkage measurements over the
following 21 days. Although both aggregates were tested at approximately 77 °F, the limestone
was tested in an environment of less than 50 percent relative humidity, while the recycled
concrete remained in the curing chamber for the duration of the testing to accommodate use of
the same beams in durability testing afterwards. (Only a limited quantity of recycled concrete
was retained for testing in this project.) In all cases, samples were tested on a smooth plastic
surface.
The device used for shrinkage measurements, shown in Figure 4, was equipped with a
dial gauge capable of measuring deflection to the nearest 0.0004 in. The Australian specification
stating that the shrinkage strain should not exceed 0.000250 in./in. after 21 days was proposed
for judging the performance of both sets of samples (11). This specification was developed from
extensive laboratory testing of beam samples of similar size and has been implemented in quarry
and plan mixing processes in Queensland.
Figure 3. Beam Sample.
17
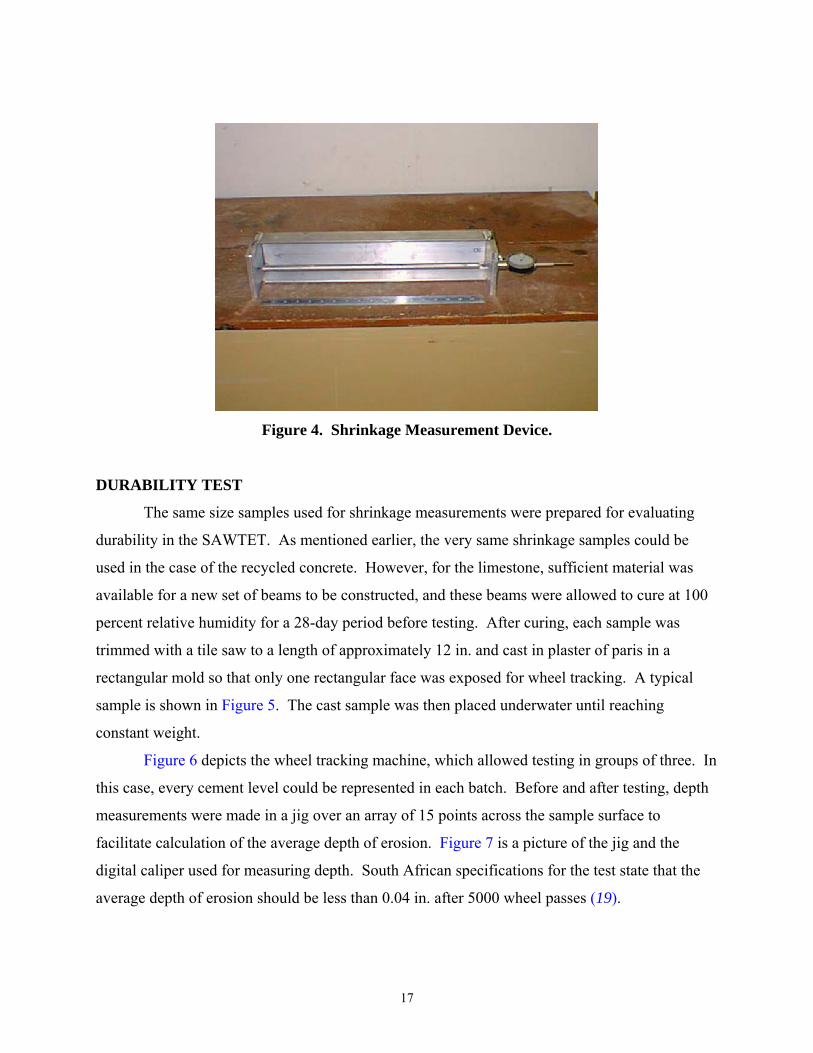
Figure 4. Shrinkage Measurement Device.
DURABILITY TEST
The same size samples used for shrinkage measurements were prepared for evaluating
durability in the SAWTET. As mentioned earlier, the very same shrinkage samples could be
used in the case of the recycled concrete. However, for the limestone, sufficient material was
available for a new set of beams to be constructed, and these beams were allowed to cure at 100
percent relative humidity for a 28-day period before testing. After curing, each sample was
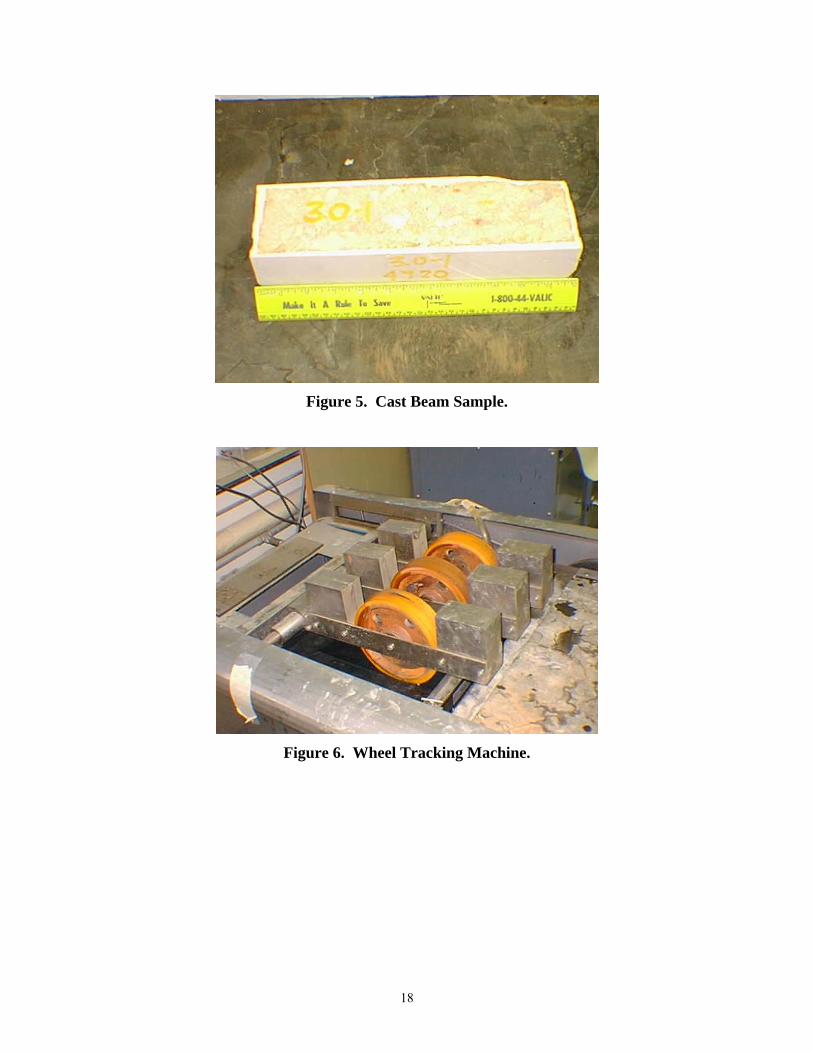
trimmed with a tile saw to a length of approximately 12 in. and cast in plaster of paris in a
rectangular mold so that only one rectangular face was exposed for wheel tracking. A typical
sample is shown in Figure 5. The cast sample was then placed underwater until reaching
constant weight.
Figure 6 depicts the wheel tracking machine, which allowed testing in groups of three. In
this case, every cement level could be represented in each batch. Before and after testing, depth
measurements were made in a jig over an array of 15 points across the sample surface to
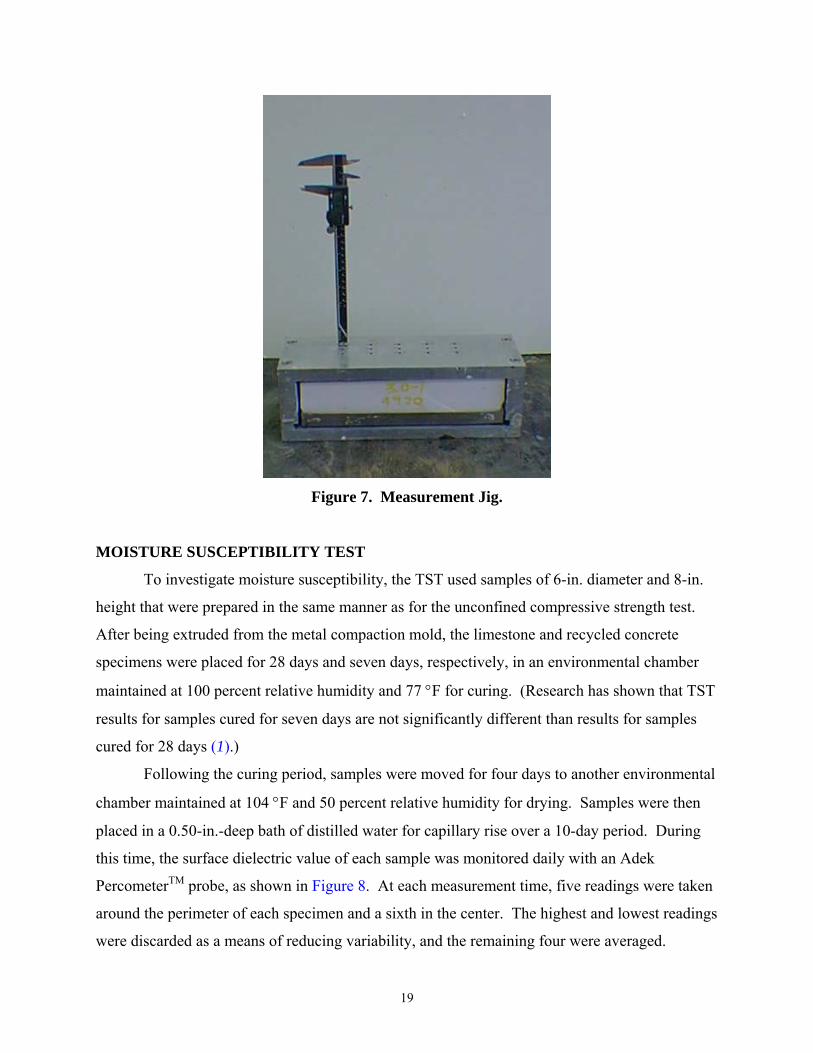
facilitate calculation of the average depth of erosion. Figure 7 is a picture of the jig and the
digital caliper used for measuring depth. South African specifications for the test state that the
average depth of erosion should be less than 0.04 in. after 5000 wheel passes (19).
18
Figure 5. Cast Beam Sample.
Figure 6. Wheel Tracking Machine.
19
Figure 7. Measurement Jig.
MOISTURE SUSCEPTIBILITY TEST
To investigate moisture susceptibility, the TST used samples of 6-in. diameter and 8-in.
height that were prepared in the same manner as for the unconfined compressive strength test.
After being extruded from the metal compaction mold, the limestone and recycled concrete
specimens were placed for 28 days and seven days, respectively, in an environmental chamber
maintained at 100 percent relative humidity and 77 °F for curing. (Research has shown that TST
results for samples cured for seven days are not significantly different than results for samples
cured for 28 days (1).)
Following the curing period, samples were moved for four days to another environmental
chamber maintained at 104 °F and 50 percent relative humidity for drying. Samples were then
placed in a 0.50-in.-deep bath of distilled water for capillary rise over a 10-day period. During
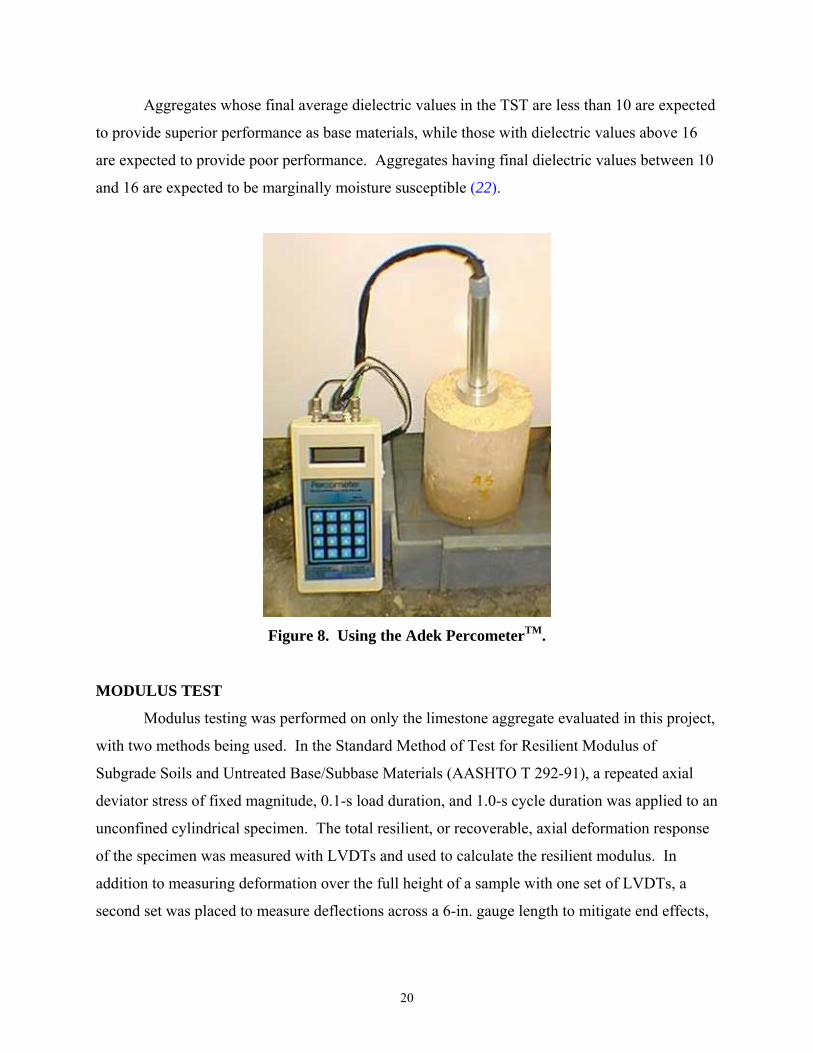
this time, the surface dielectric value of each sample was monitored daily with an Adek
PercometerTM probe, as shown in Figure 8. At each measurement time, five readings were taken
around the perimeter of each specimen and a sixth in the center. The highest and lowest readings
were discarded as a means of reducing variability, and the remaining four were averaged.
20
Aggregates whose final average dielectric values in the TST are less than 10 are expected
to provide superior performance as base materials, while those with dielectric values above 16
are expected to provide poor performance. Aggregates having final dielectric values between 10
and 16 are expected to be marginally moisture susceptible (22).
Figure 8. Using the Adek PercometerTM.
MODULUS TEST
Modulus testing was performed on only the limestone aggregate evaluated in this project,
with two methods being used. In the Standard Method of Test for Resilient Modulus of
Subgrade Soils and Untreated Base/Subbase Materials (AASHTO T 292-91), a repeated axial
deviator stress of fixed magnitude, 0.1-s load duration, and 1.0-s cycle duration was applied to an
unconfined cylindrical specimen. The total resilient, or recoverable, axial deformation response
of the specimen was measured with LVDTs and used to calculate the resilient modulus. In
addition to measuring deformation over the full height of a sample with one set of LVDTs, a
second set was placed to measure deflections across a 6-in. gauge length to mitigate end effects,
21
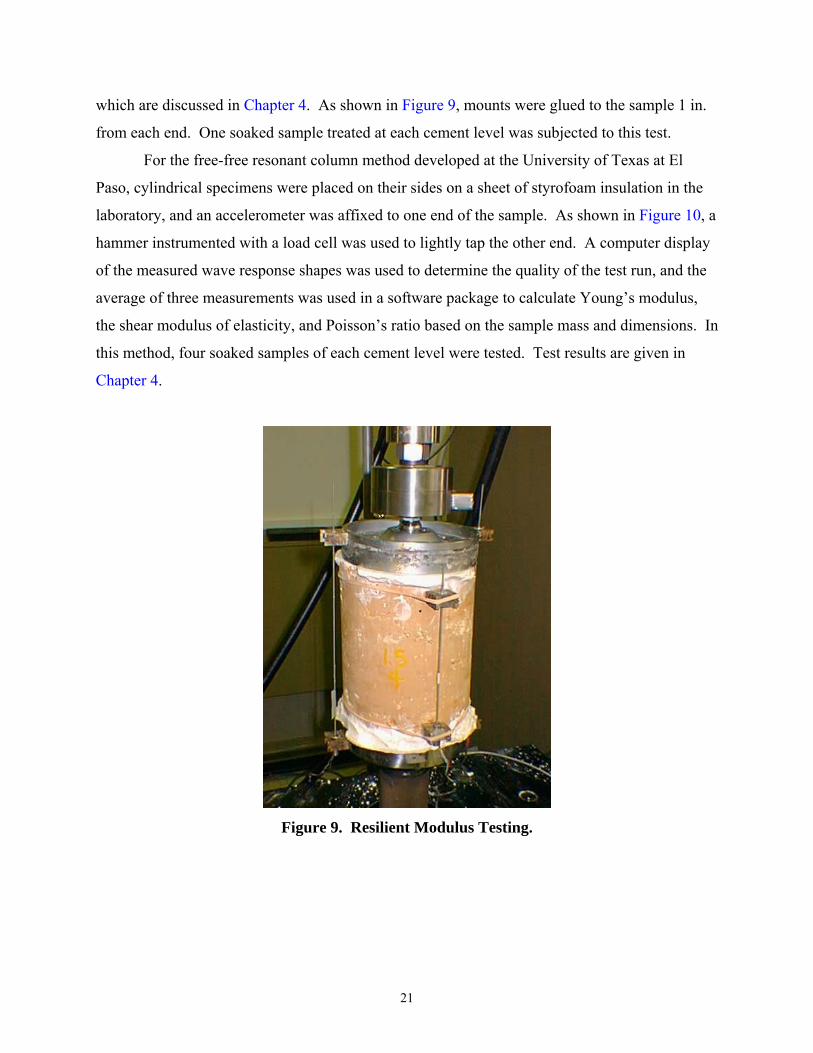
which are discussed in Chapter 4. As shown in Figure 9, mounts were glued to the sample 1 in.
from each end. One soaked sample treated at each cement level was subjected to this test.
For the free-free resonant column method developed at the University of Texas at El
Paso, cylindrical specimens were placed on their sides on a sheet of styrofoam insulation in the
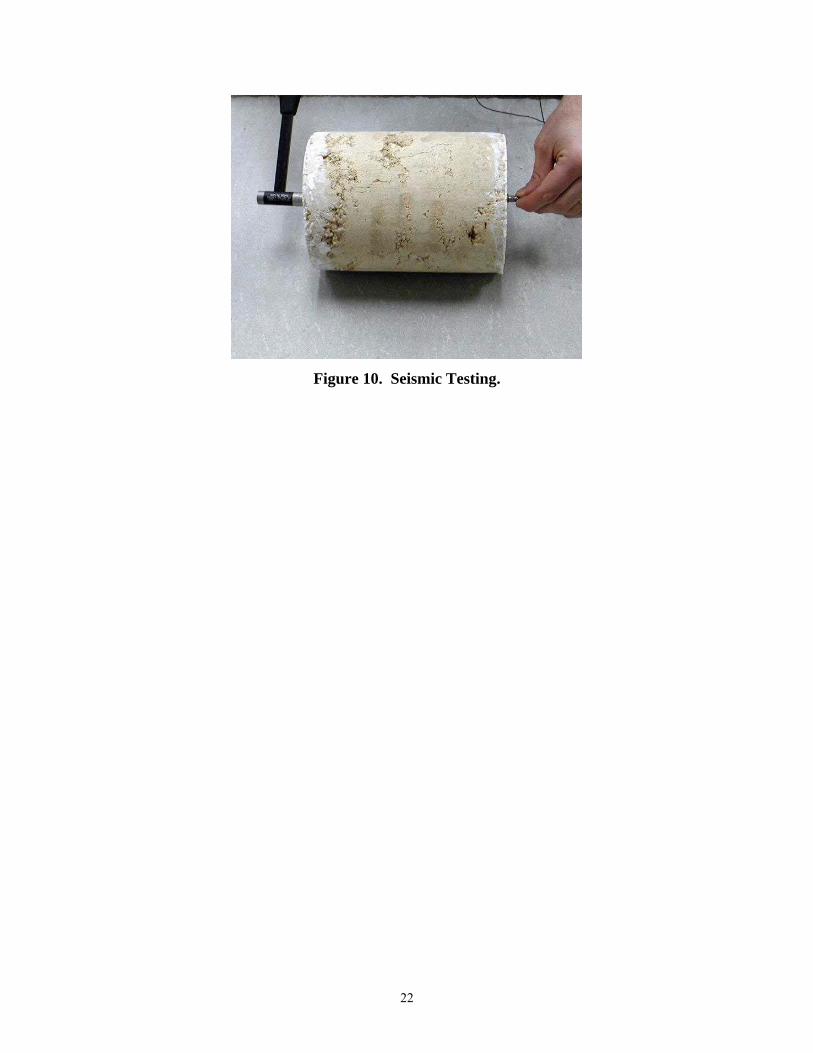
laboratory, and an accelerometer was affixed to one end of the sample. As shown in Figure 10, a
hammer instrumented with a load cell was used to lightly tap the other end. A computer display
of the measured wave response shapes was used to determine the quality of the test run, and the
average of three measurements was used in a software package to calculate Young’s modulus,
the shear modulus of elasticity, and Poisson’s ratio based on the sample mass and dimensions. In
this method, four soaked samples of each cement level were tested. Test results are given in
Chapter 4.
Figure 9. Resilient Modulus Testing.
22
Figure 10. Seismic Testing.
23
CHAPTER 4. TEST RESULTS
AGGREGATE CHARACTERIZATION TEST RESULTS
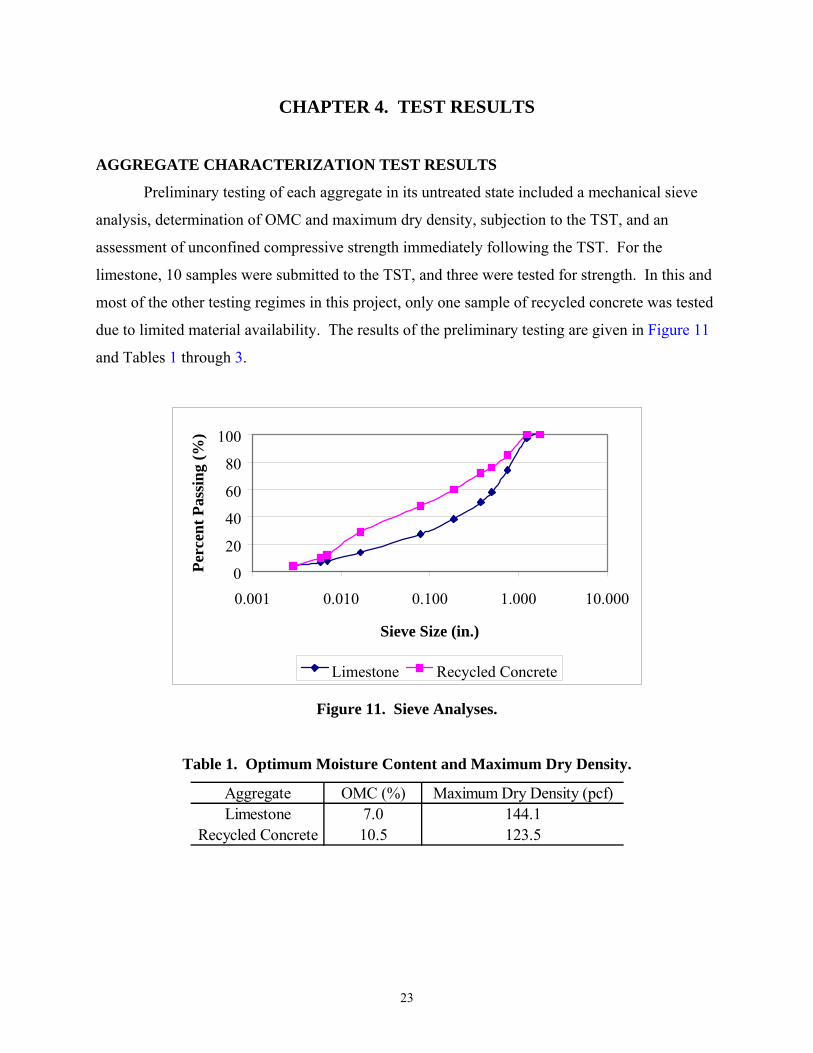
Preliminary testing of each aggregate in its untreated state included a mechanical sieve
analysis, determination of OMC and maximum dry density, subjection to the TST, and an
assessment of unconfined compressive strength immediately following the TST. For the
limestone, 10 samples were submitted to the TST, and three were tested for strength. In this and
most of the other testing regimes in this project, only one sample of recycled concrete was tested
due to limited material availability. The results of the preliminary testing are given in Figure 11
and Tables 1 through 3.
0
20
40
60
80
100
0.001 0.010 0.100 1.000 10.000
Sieve Size (in.)
Perc
ent P
assi
ng (%
)
Limestone Recycled Concrete
Figure 11. Sieve Analyses.
Table 1. Optimum Moisture Content and Maximum Dry Density.
Aggregate OMC (%) Maximum Dry Density (pcf)Limestone 7.0 144.1
Recycled Concrete 10.5 123.5
24
Table 2. Moisture Susceptibility Test Results for Untreated Aggregates.
AggregateMean Std. Dev. Mean Std. Dev. Mean Std. Dev.
Limestone 2.0 0.4 6.1 0.2 19.9 1.3Recycled Concrete 8.2 NA 12.6 NA 30.9 NA
Beginning Moisture (%) Ending Moisture (%) Dielectric Value
Table 3. Strength Test Results for Untreated Aggregates Conditioned in TST.
AggregateMean Std. Dev. Mean Std. Dev.
Limestone 6.1 0.8 39 3Recycled Concrete 12.6 NA 48 NA
Moisture (%) Unconfined Strength (psi)
Although the percentage passing the 0.0029-in. (No. 200) sieve is the same for both
aggregates, the recycled concrete has a finer gradation overall. The effects of this finer matrix
are manifest in the higher OMC of the recycled concrete and its higher dielectric value in the
TST. Because the dielectric value of both aggregates exceeded 16, however, they would both be
expected to provide poor performance as base materials in their untreated condition from the
perspective of moisture susceptibility.
During the drying period prior to the TST, the recycled concrete retained its moisture
more strongly than the limestone samples, and while both aggregates imbibed approximately 4
percent moisture during the test, the recycled concrete aggregate ended the TST with a moisture
content more than 2 percent higher than optimum. Unconfined compressive strength tests were
performed on the samples immediately following the TST, with these moisture conditions being
considered representative of those likely to exist in the field given the availability of moisture.
As shown in Table 3, only the recycled concrete meets the strength requirement of 45 psi for a
Triaxial Class 1 material, perhaps due to secondary chemical reactions causing recementation of
the sample matrix. The following section presents the mineralogy of each aggregate.
MINERALOGY TEST RESULTS
Results and calculations for pretreatments, dispersion and fractionation, XRD, total
potassium determination, CEC, and SEM are given in the following discussion.
25
Pretreatments
After dispersion and fractionation were completed, it was possible to calculate the
percentage of insoluble material contained in each sample. For the limestone, the original
sample was 0.4409 lb., and only 0.0210 lb. remained after pretreatment. Thus, the insoluble
fraction constituted only 4.77 percent of the total sample, which is typical of Georgetown
limestone according to similar studies by TxDOT (32). The soluble fraction was composed
primarily of calcite, with trace impurities, that was readily dissolved during chemical
pretreatment. For the recycled concrete, the original sample was 0.2227 lb., and 0.1784 lb., or
80.12 percent, was recovered. One of the components of the soluble fraction was asphalt
coatings on some of the aggregate particles. The remainder of this mineralogical analysis
focuses on the compositions of the aggregate residuals.
Dispersion and Fractionation
Table 4 shows the relative compositions of each aggregate residual obtained by
fractionation. Based on the percentage of each constituent, the United States Department of
Agriculture (USDA) classifications for the insoluble fractions of limestone and recycled concrete
samples are clay and sandy loam, respectively.
Table 4. Fractionation Results.
AggregateSand Silt Coarse Clay Fine Clay
Limestone 13.6 23.1 12.4 50.9Recycled Concrete 76.9 14.2 5.2 3.7
Composition (%)
X-Ray Diffraction
Tables 5 and 6 list the mineralogical components in each size fraction identified from
XRD patterns. Among these, smectite is the most reactive constituent, with a specific surface
area of approximately 3,906,000 ft2/lb. Kaolinite, in comparison, has a specific surface area of
only 98,600 ft2/lb. Smectite is additionally characterized by high CEC due to its high negative
surface charge and is a significant cause of suction in aggregate base materials. Some studies
have linked the presence of smectite, even in small quantities, to the poor performance of these
26
materials in the field (6). In order to determine the amount of each of these constituents in the
aggregate residuals, researchers performed further testing as described below.
Table 5. XRD Results for Limestone.
Fraction Mineral ComponentsSand Quartz, feldsparSilt Quartz, feldspar, kaolinite
Coarse Clay Quartz, kaolinite, mica, smectite, goethiteFine Clay Kaolinite, mica, smectite, goethite
Table 6. XRD Results for Recycled Concrete.
Fraction Mineral ComponentsSand Quartz, feldsparSilt Quartz, feldspar
Coarse Clay Quartz, kaolinite, mica, smectiteFine Clay Kaolinite, mica, smectite
Total Potassium Determination
Two samples of coarse clay and two samples of fine clay were analyzed to determine the
average percentage of mica in each fraction reported in Table 7 (33). The average K
concentration provided a basis for directly estimating the mica content, given the absence of
potassium feldspars in the coarse and fine clay samples.
Table 7. Results of Total Potassium Determination.
Aggregate
Mean Std. Dev. Mean Std. Dev.Limestone 13.86 3.29 16.91 2.35
Recycled Concrete 16.30 0.65 13.60 0.41
Mica (%)Coarse Clay Fine Clay
Cation Exchange Capacity Determination
The CEC was also determined for the coarse and fine clay fractions, as shown in Table 8
(33). The CEC values for kaolinite, mica, and smectite in later data synthesis calculations were
assumed to be 0.1102 mol/lb., 0.2205 mol/lb., and 2.4251 mol/lb., respectively (4).
27
Table 8. Results of Cation Exchange Capacity Determination.
Aggregate
Mean Std. Dev. Mean Std. Dev.Limestone 0.3874 0.0028 1.5043 0.0131
Recycled Concrete 1.2025 0.0029 1.2874 0.0037
Cation Exchange Capacity (mol/lb.)Coarse Clay Fine Clay
Scanning Electron Microscopy
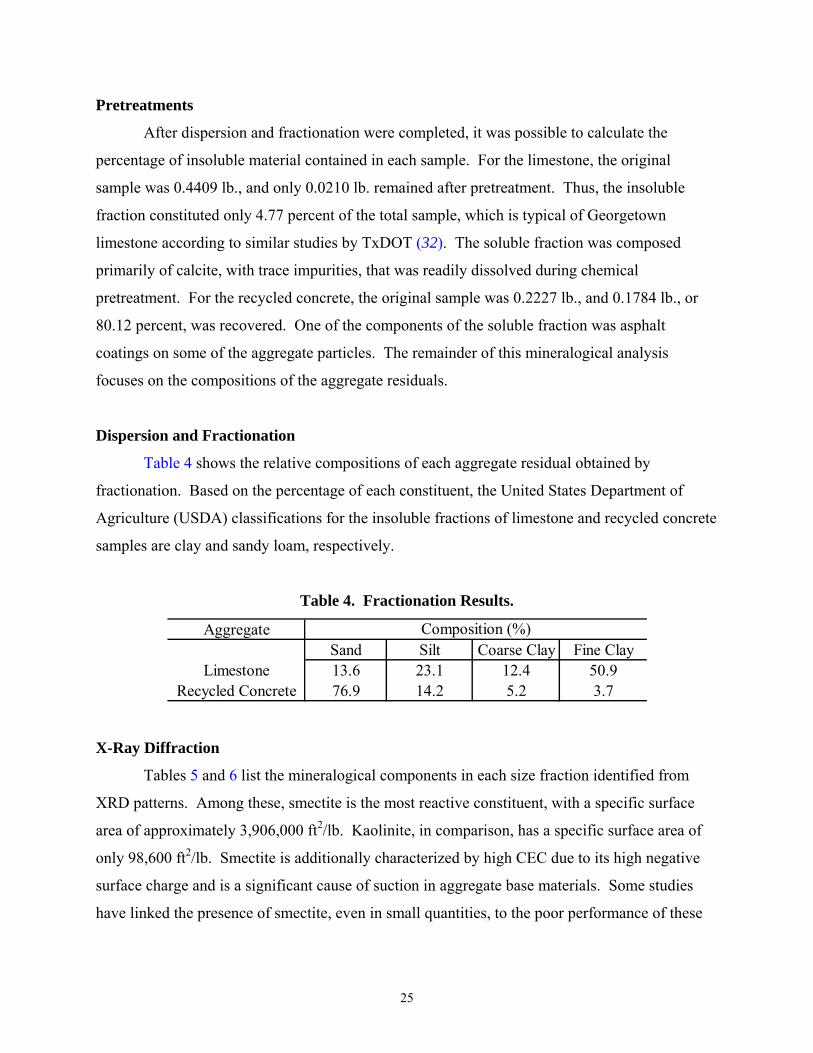
SEM work was completed on the bulk limestone sample as well as on the silt fraction
obtained from fractionation of the limestone residual. Figure 12 shows the morphology of the
calcite particles comprising about 95 percent of the bulk limestone sample. This figure
illustrates the aggregated nature of the limestone and suggests an unusually high surface area
compared to calcite in general (34).
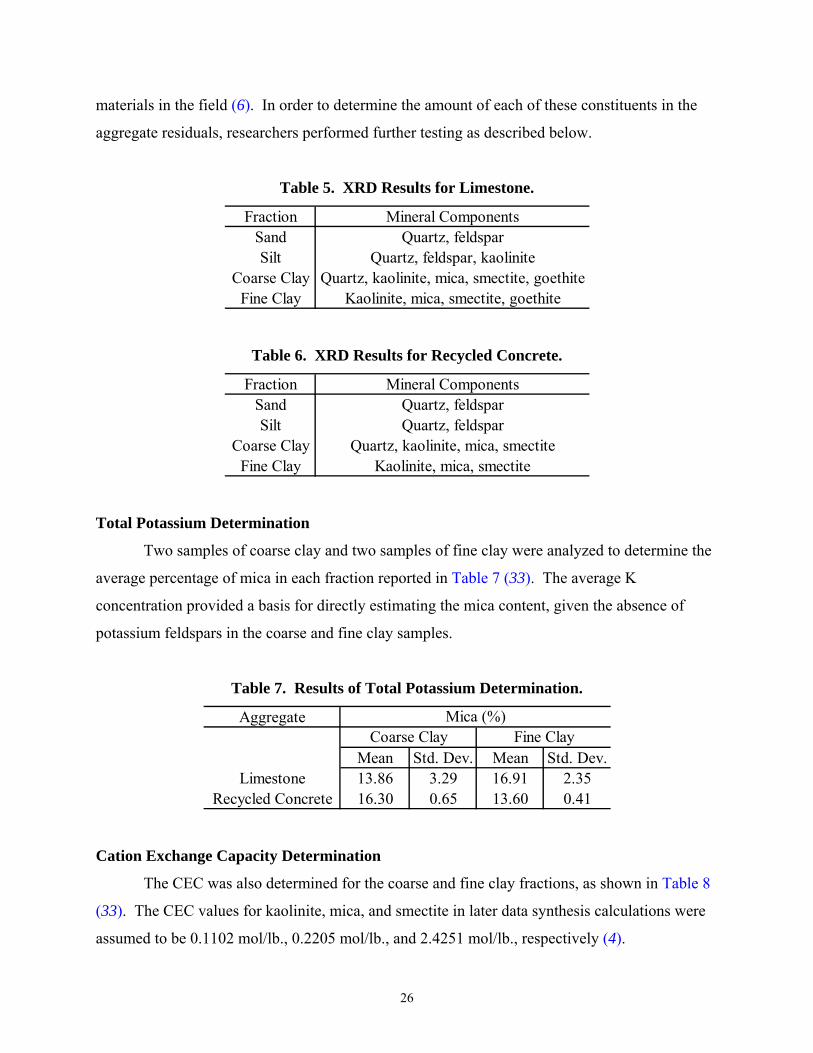
Figures 13 through 17 are from the silt fraction of the limestone sample. The oval-shaped
particles in Figure 13 may be opal, even though the presence of opal was not observed in the
XRD patterns. The aggregated particles to the upper and lower right are quartz. Figure 14
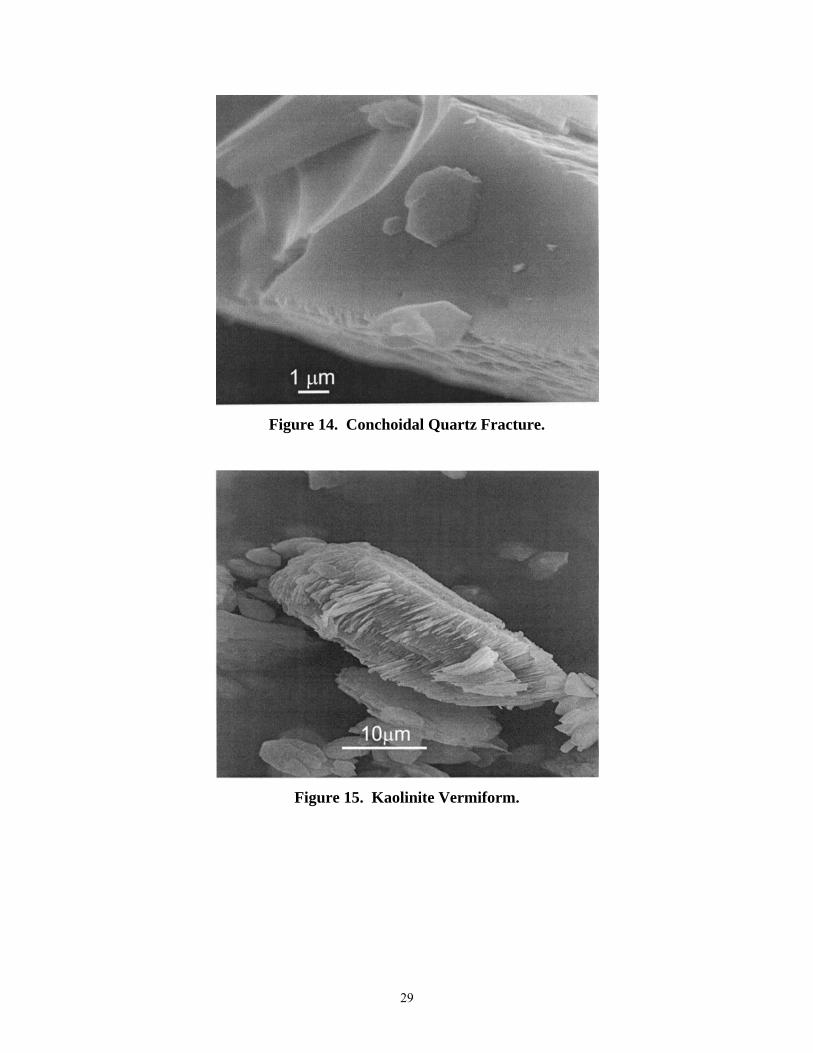
shows a distinctly hexagonal kaolinite particle adhered to a quartz particle. The conchoidal
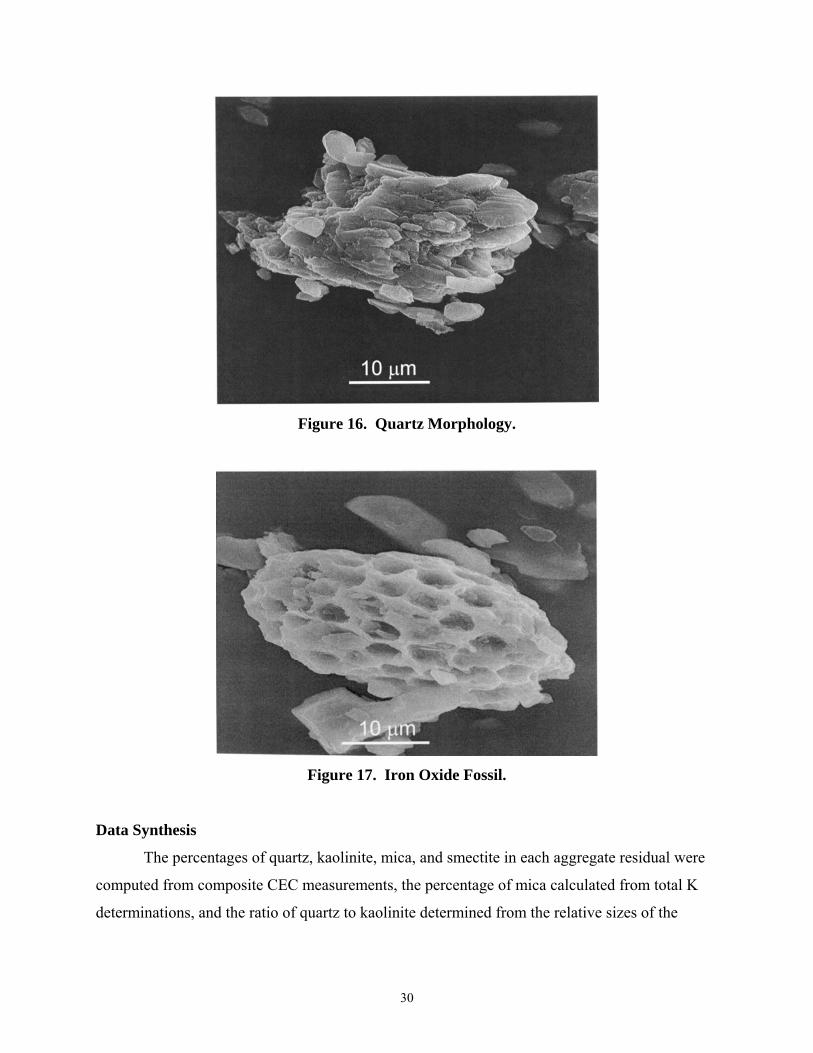
fracture at the left of the photo is typical of quartz. The main feature of Figure 15 is a kaolinite
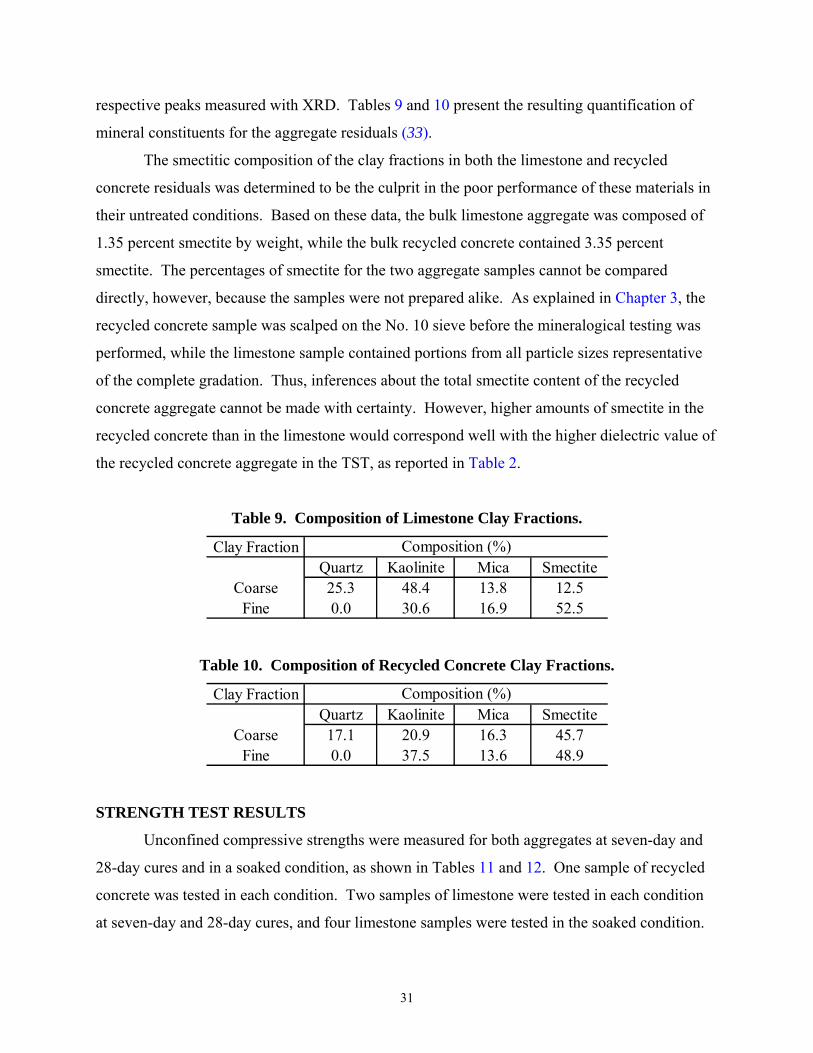
vermiform, with quartz in the background. Figure 16 displays the quartz morphology typical of
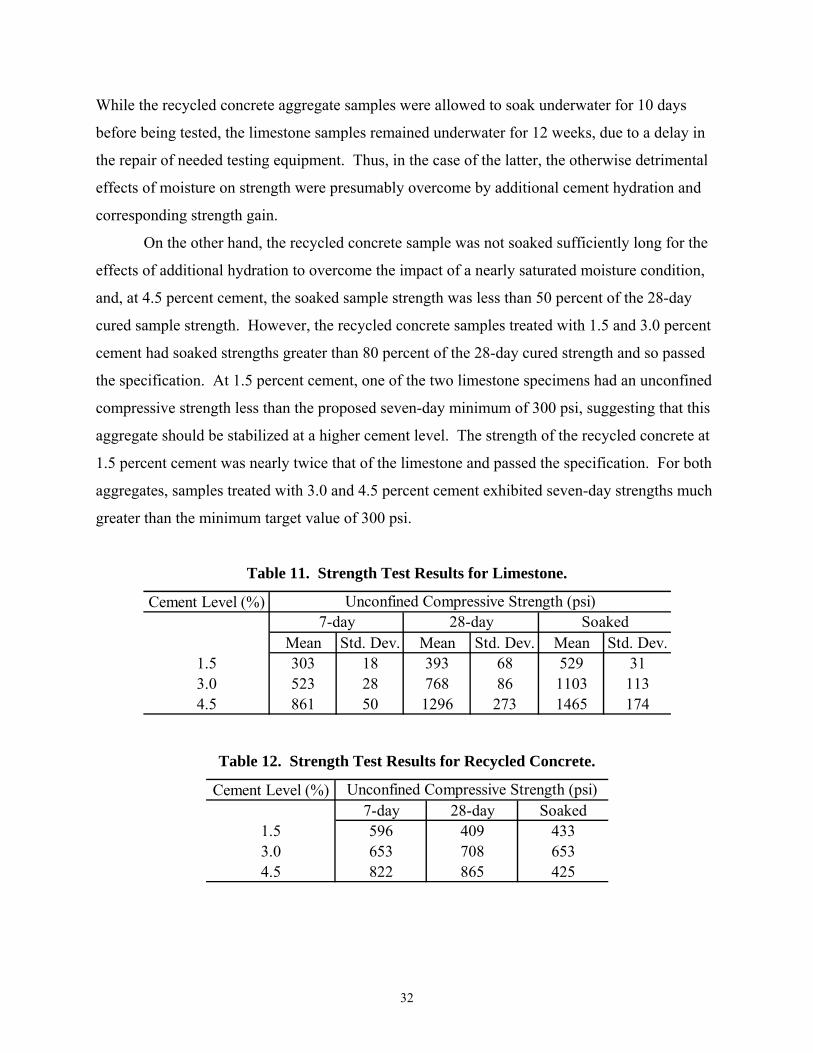
this sample, and Figure 17 depicts an iron oxide, which is probably goethite. The fossil structure
likely formed by small scale, progressive substitution of goethite for the parent material.
28
Figure 12. Aggregated Calcite Particles.
Figure 13. Opal and Quartz Particles.
29
Figure 14. Conchoidal Quartz Fracture.
Figure 15. Kaolinite Vermiform.
30
Figure 16. Quartz Morphology.
Figure 17. Iron Oxide Fossil.
Data Synthesis
The percentages of quartz, kaolinite, mica, and smectite in each aggregate residual were
computed from composite CEC measurements, the percentage of mica calculated from total K
determinations, and the ratio of quartz to kaolinite determined from the relative sizes of the
31
respective peaks measured with XRD. Tables 9 and 10 present the resulting quantification of
mineral constituents for the aggregate residuals (33).
The smectitic composition of the clay fractions in both the limestone and recycled
concrete residuals was determined to be the culprit in the poor performance of these materials in
their untreated conditions. Based on these data, the bulk limestone aggregate was composed of
1.35 percent smectite by weight, while the bulk recycled concrete contained 3.35 percent
smectite. The percentages of smectite for the two aggregate samples cannot be compared
directly, however, because the samples were not prepared alike. As explained in Chapter 3, the
recycled concrete sample was scalped on the No. 10 sieve before the mineralogical testing was
performed, while the limestone sample contained portions from all particle sizes representative
of the complete gradation. Thus, inferences about the total smectite content of the recycled
concrete aggregate cannot be made with certainty. However, higher amounts of smectite in the
recycled concrete than in the limestone would correspond well with the higher dielectric value of
the recycled concrete aggregate in the TST, as reported in Table 2.
Table 9. Composition of Limestone Clay Fractions.
Clay FractionQuartz Kaolinite Mica Smectite
Coarse 25.3 48.4 13.8 12.5Fine 0.0 30.6 16.9 52.5
Composition (%)
Table 10. Composition of Recycled Concrete Clay Fractions.
Clay FractionQuartz Kaolinite Mica Smectite
Coarse 17.1 20.9 16.3 45.7Fine 0.0 37.5 13.6 48.9
Composition (%)
STRENGTH TEST RESULTS
Unconfined compressive strengths were measured for both aggregates at seven-day and
28-day cures and in a soaked condition, as shown in Tables 11 and 12. One sample of recycled
concrete was tested in each condition. Two samples of limestone were tested in each condition
at seven-day and 28-day cures, and four limestone samples were tested in the soaked condition.
32
While the recycled concrete aggregate samples were allowed to soak underwater for 10 days
before being tested, the limestone samples remained underwater for 12 weeks, due to a delay in
the repair of needed testing equipment. Thus, in the case of the latter, the otherwise detrimental
effects of moisture on strength were presumably overcome by additional cement hydration and
corresponding strength gain.
On the other hand, the recycled concrete sample was not soaked sufficiently long for the
effects of additional hydration to overcome the impact of a nearly saturated moisture condition,
and, at 4.5 percent cement, the soaked sample strength was less than 50 percent of the 28-day
cured sample strength. However, the recycled concrete samples treated with 1.5 and 3.0 percent
cement had soaked strengths greater than 80 percent of the 28-day cured strength and so passed
the specification. At 1.5 percent cement, one of the two limestone specimens had an unconfined
compressive strength less than the proposed seven-day minimum of 300 psi, suggesting that this
aggregate should be stabilized at a higher cement level. The strength of the recycled concrete at
1.5 percent cement was nearly twice that of the limestone and passed the specification. For both
aggregates, samples treated with 3.0 and 4.5 percent cement exhibited seven-day strengths much
greater than the minimum target value of 300 psi.
Table 11. Strength Test Results for Limestone.
Cement Level (%)
Mean Std. Dev. Mean Std. Dev. Mean Std. Dev.1.5 303 18 393 68 529 313.0 523 28 768 86 1103 1134.5 861 50 1296 273 1465 174
7-day 28-day SoakedUnconfined Compressive Strength (psi)
Table 12. Strength Test Results for Recycled Concrete.
Cement Level (%)7-day 28-day Soaked
1.5 596 409 4333.0 653 708 6534.5 822 865 425
Unconfined Compressive Strength (psi)
33
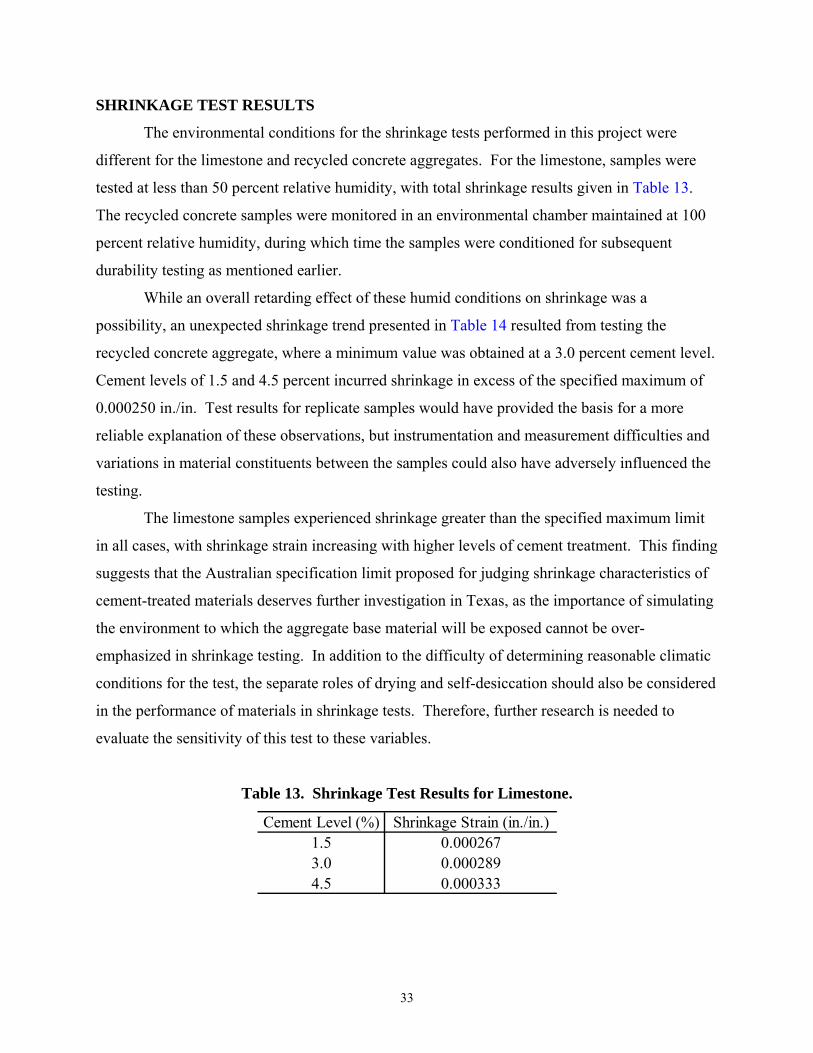
SHRINKAGE TEST RESULTS
The environmental conditions for the shrinkage tests performed in this project were
different for the limestone and recycled concrete aggregates. For the limestone, samples were
tested at less than 50 percent relative humidity, with total shrinkage results given in Table 13.
The recycled concrete samples were monitored in an environmental chamber maintained at 100
percent relative humidity, during which time the samples were conditioned for subsequent
durability testing as mentioned earlier.
While an overall retarding effect of these humid conditions on shrinkage was a
possibility, an unexpected shrinkage trend presented in Table 14 resulted from testing the
recycled concrete aggregate, where a minimum value was obtained at a 3.0 percent cement level.
Cement levels of 1.5 and 4.5 percent incurred shrinkage in excess of the specified maximum of
0.000250 in./in. Test results for replicate samples would have provided the basis for a more
reliable explanation of these observations, but instrumentation and measurement difficulties and
variations in material constituents between the samples could also have adversely influenced the
testing.
The limestone samples experienced shrinkage greater than the specified maximum limit
in all cases, with shrinkage strain increasing with higher levels of cement treatment. This finding
suggests that the Australian specification limit proposed for judging shrinkage characteristics of
cement-treated materials deserves further investigation in Texas, as the importance of simulating
the environment to which the aggregate base material will be exposed cannot be over-
emphasized in shrinkage testing. In addition to the difficulty of determining reasonable climatic
conditions for the test, the separate roles of drying and self-desiccation should also be considered
in the performance of materials in shrinkage tests. Therefore, further research is needed to
evaluate the sensitivity of this test to these variables.
Table 13. Shrinkage Test Results for Limestone.
Cement Level (%) Shrinkage Strain (in./in.)1.5 0.0002673.0 0.0002894.5 0.000333
34
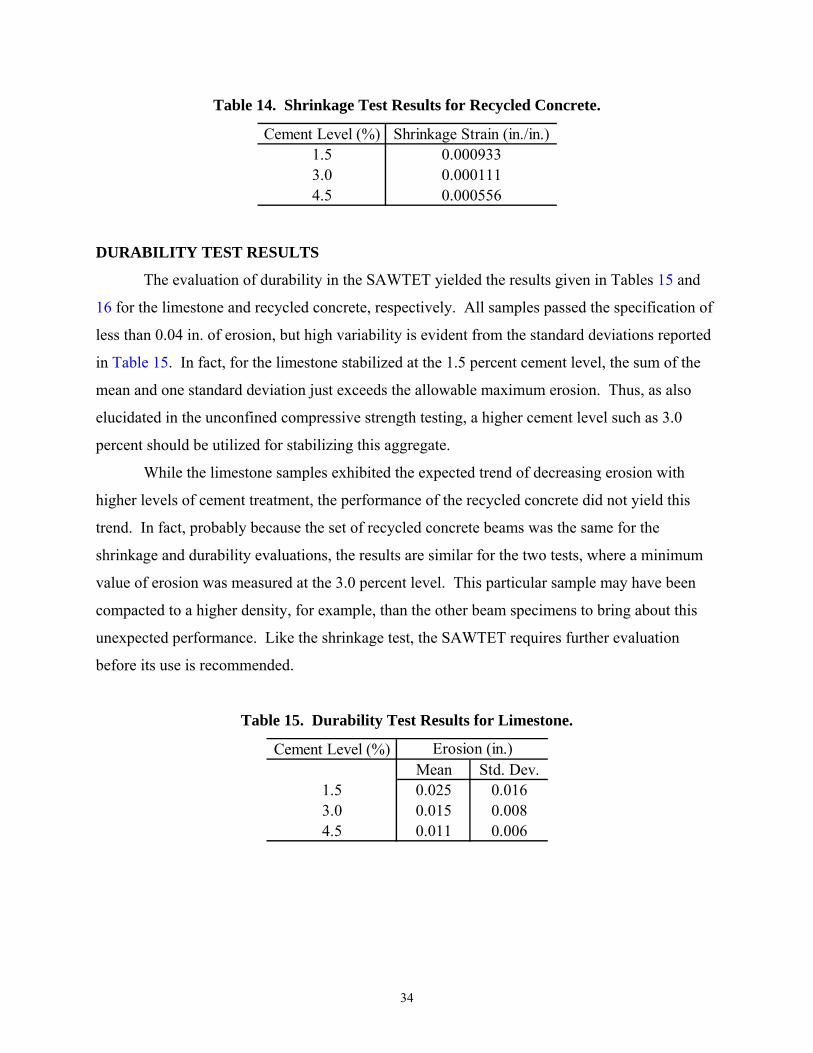
Table 14. Shrinkage Test Results for Recycled Concrete.
Cement Level (%) Shrinkage Strain (in./in.)1.5 0.0009333.0 0.0001114.5 0.000556
DURABILITY TEST RESULTS
The evaluation of durability in the SAWTET yielded the results given in Tables 15 and
16 for the limestone and recycled concrete, respectively. All samples passed the specification of
less than 0.04 in. of erosion, but high variability is evident from the standard deviations reported
in Table 15. In fact, for the limestone stabilized at the 1.5 percent cement level, the sum of the
mean and one standard deviation just exceeds the allowable maximum erosion. Thus, as also
elucidated in the unconfined compressive strength testing, a higher cement level such as 3.0
percent should be utilized for stabilizing this aggregate.
While the limestone samples exhibited the expected trend of decreasing erosion with
higher levels of cement treatment, the performance of the recycled concrete did not yield this
trend. In fact, probably because the set of recycled concrete beams was the same for the
shrinkage and durability evaluations, the results are similar for the two tests, where a minimum
value of erosion was measured at the 3.0 percent level. This particular sample may have been
compacted to a higher density, for example, than the other beam specimens to bring about this
unexpected performance. Like the shrinkage test, the SAWTET requires further evaluation
before its use is recommended.
Table 15. Durability Test Results for Limestone.
Cement Level (%)Mean Std. Dev.
1.5 0.025 0.0163.0 0.015 0.0084.5 0.011 0.006
Erosion (in.)
35
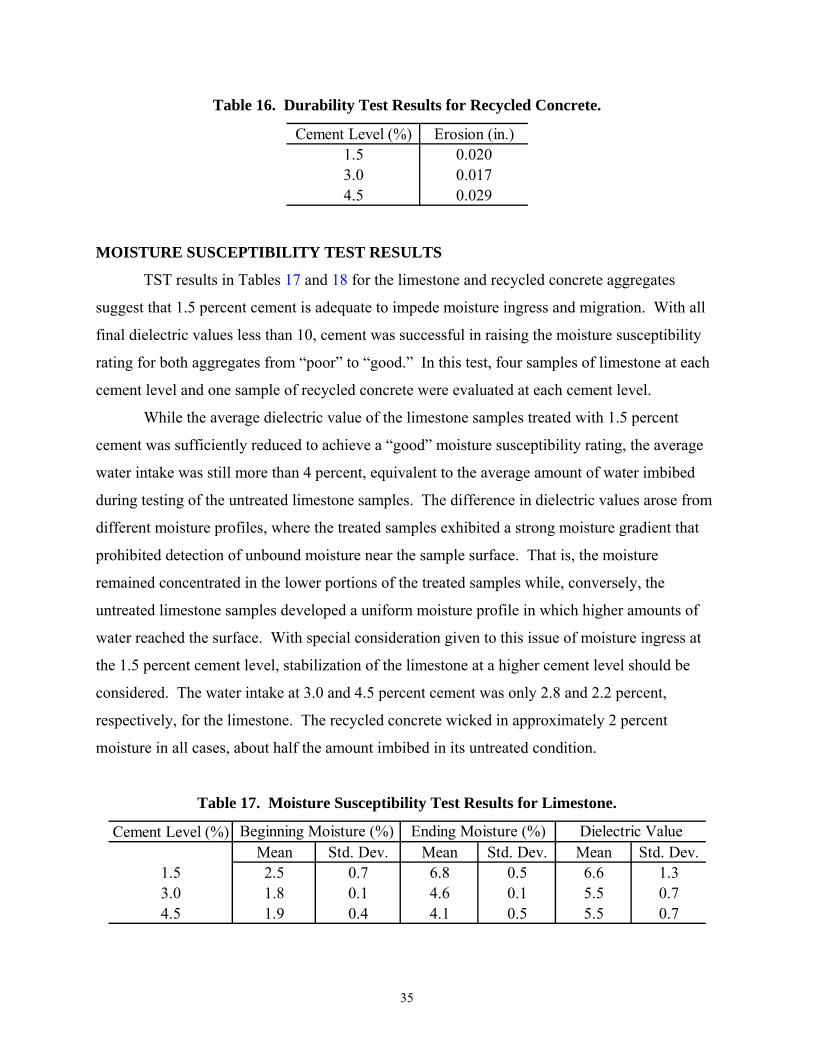
Table 16. Durability Test Results for Recycled Concrete.
Cement Level (%) Erosion (in.)1.5 0.0203.0 0.0174.5 0.029
MOISTURE SUSCEPTIBILITY TEST RESULTS
TST results in Tables 17 and 18 for the limestone and recycled concrete aggregates
suggest that 1.5 percent cement is adequate to impede moisture ingress and migration. With all
final dielectric values less than 10, cement was successful in raising the moisture susceptibility
rating for both aggregates from “poor” to “good.” In this test, four samples of limestone at each
cement level and one sample of recycled concrete were evaluated at each cement level.
While the average dielectric value of the limestone samples treated with 1.5 percent
cement was sufficiently reduced to achieve a “good” moisture susceptibility rating, the average
water intake was still more than 4 percent, equivalent to the average amount of water imbibed
during testing of the untreated limestone samples. The difference in dielectric values arose from
different moisture profiles, where the treated samples exhibited a strong moisture gradient that
prohibited detection of unbound moisture near the sample surface. That is, the moisture
remained concentrated in the lower portions of the treated samples while, conversely, the
untreated limestone samples developed a uniform moisture profile in which higher amounts of
water reached the surface. With special consideration given to this issue of moisture ingress at
the 1.5 percent cement level, stabilization of the limestone at a higher cement level should be
considered. The water intake at 3.0 and 4.5 percent cement was only 2.8 and 2.2 percent,
respectively, for the limestone. The recycled concrete wicked in approximately 2 percent
moisture in all cases, about half the amount imbibed in its untreated condition.
Table 17. Moisture Susceptibility Test Results for Limestone.
Cement Level (%)Mean Std. Dev. Mean Std. Dev. Mean Std. Dev.
1.5 2.5 0.7 6.8 0.5 6.6 1.33.0 1.8 0.1 4.6 0.1 5.5 0.74.5 1.9 0.4 4.1 0.5 5.5 0.7
Dielectric ValueBeginning Moisture (%) Ending Moisture (%)
36
Table 18. Moisture Susceptibility Test Results for Recycled Concrete.
Cement Level (%) Beginning Moisture (%) Ending Moisture (%) Dielectric Value1.5 6.6 8.7 5.93.0 6.9 9.3 6.14.5 7.0 9.3 5.8
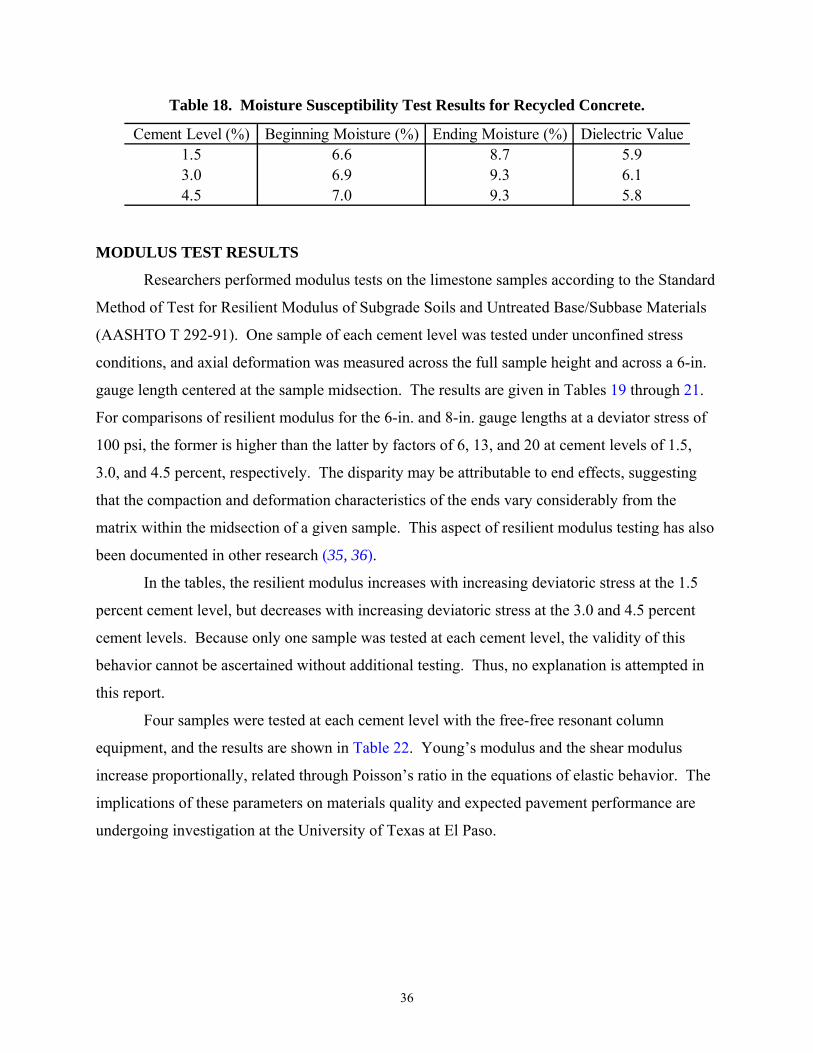
MODULUS TEST RESULTS
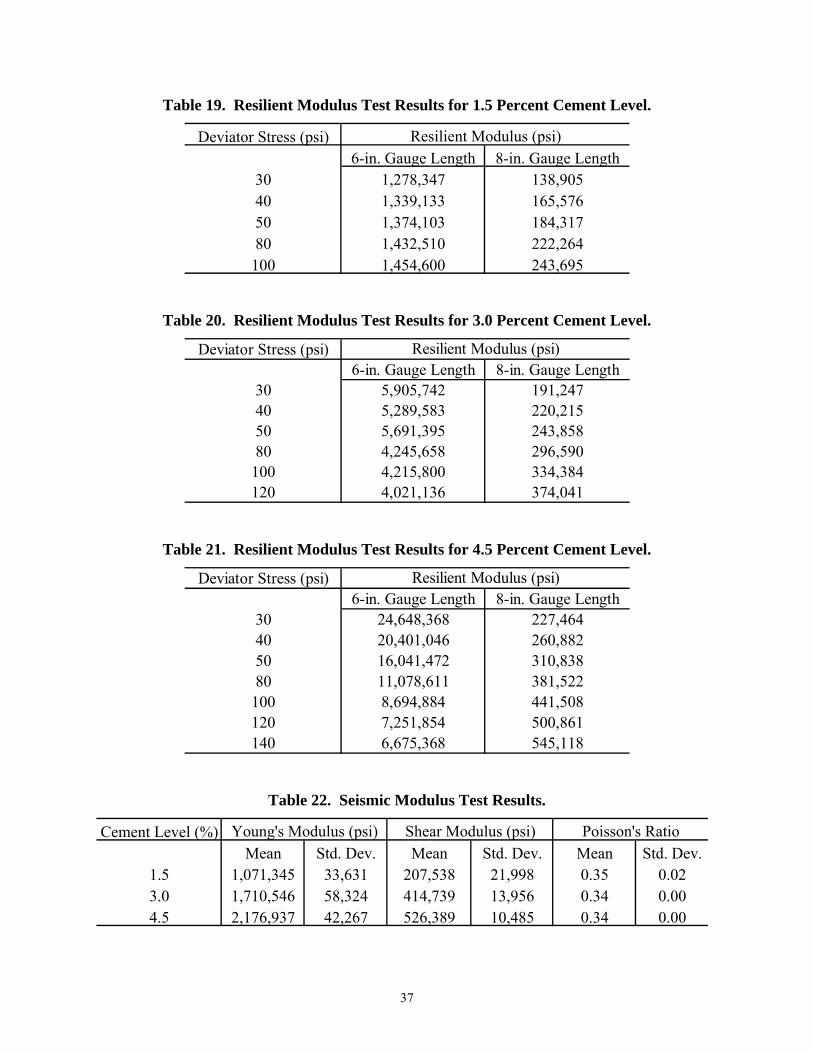
Researchers performed modulus tests on the limestone samples according to the Standard
Method of Test for Resilient Modulus of Subgrade Soils and Untreated Base/Subbase Materials
(AASHTO T 292-91). One sample of each cement level was tested under unconfined stress
conditions, and axial deformation was measured across the full sample height and across a 6-in.
gauge length centered at the sample midsection. The results are given in Tables 19 through 21.
For comparisons of resilient modulus for the 6-in. and 8-in. gauge lengths at a deviator stress of
100 psi, the former is higher than the latter by factors of 6, 13, and 20 at cement levels of 1.5,
3.0, and 4.5 percent, respectively. The disparity may be attributable to end effects, suggesting
that the compaction and deformation characteristics of the ends vary considerably from the
matrix within the midsection of a given sample. This aspect of resilient modulus testing has also
been documented in other research (35, 36).
In the tables, the resilient modulus increases with increasing deviatoric stress at the 1.5
percent cement level, but decreases with increasing deviatoric stress at the 3.0 and 4.5 percent
cement levels. Because only one sample was tested at each cement level, the validity of this
behavior cannot be ascertained without additional testing. Thus, no explanation is attempted in
this report.
Four samples were tested at each cement level with the free-free resonant column
equipment, and the results are shown in Table 22. Young’s modulus and the shear modulus
increase proportionally, related through Poisson’s ratio in the equations of elastic behavior. The
implications of these parameters on materials quality and expected pavement performance are
undergoing investigation at the University of Texas at El Paso.
37
Table 19. Resilient Modulus Test Results for 1.5 Percent Cement Level.
Deviator Stress (psi)6-in. Gauge Length 8-in. Gauge Length
30 1,278,347 138,90540 1,339,133 165,57650 1,374,103 184,31780 1,432,510 222,264100 1,454,600 243,695
Resilient Modulus (psi)
Table 20. Resilient Modulus Test Results for 3.0 Percent Cement Level.
Deviator Stress (psi)6-in. Gauge Length 8-in. Gauge Length
30 5,905,742 191,24740 5,289,583 220,21550 5,691,395 243,85880 4,245,658 296,590
100 4,215,800 334,384120 4,021,136 374,041
Resilient Modulus (psi)
Table 21. Resilient Modulus Test Results for 4.5 Percent Cement Level.
Deviator Stress (psi)6-in. Gauge Length 8-in. Gauge Length
30 24,648,368 227,46440 20,401,046 260,88250 16,041,472 310,83880 11,078,611 381,522
100 8,694,884 441,508120 7,251,854 500,861140 6,675,368 545,118
Resilient Modulus (psi)
Table 22. Seismic Modulus Test Results.
Cement Level (%)Mean Std. Dev. Mean Std. Dev. Mean Std. Dev.
1.5 1,071,345 33,631 207,538 21,998 0.35 0.023.0 1,710,546 58,324 414,739 13,956 0.34 0.004.5 2,176,937 42,267 526,389 10,485 0.34 0.00
Young's Modulus (psi) Shear Modulus (psi) Poisson's Ratio

39
CHAPTER 5. CONCLUSION
SUMMARY
The task of selecting the type and amount of stabilizer in upgrading a marginal base
material requires evaluation of multiple factors. Strength-based design procedures, which
require a minimum unconfined compressive strength after a specified curing time, frequently
result in very stiff bases that shrink and crack. Every district within the Texas Department of
Transportation can identify over-stabilized projects that have performed poorly. The trend in
recent years has been to lower strength requirements, thus reducing the amount of stabilizer
required. However, several case studies have shown that in many instances the stabilizer
disappeared after only a few years in service, suggesting that a higher percentage should have
been used. The optimum stabilizer content for an aggregate must provide sufficient strength for
carrying the imposed traffic loads, as well as provide adequate durability so that its properties are
not severely impacted by environmental effects.
In this project, researchers designed a laboratory test sequence to identify the optimum
amounts of portland type I cement for stabilizing two aggregates, limestone and recycled
concrete, typically used in the Houston District. The mineralogy of each material was
investigated, and the performance of the aggregates in their untreated condition was documented
to study the impacts of three levels of cement stabilization. Samples treated with 1.5, 3.0, and
4.5 percent cement were tested for strength, shrinkage, durability, and moisture susceptibility in
the laboratory, and performance characteristics were compared to specifications proposed for
each test.
Strength was determined with the Soil Cement Compressive Strength Test (TxDOT Test
Method Tex-120-E), and a linear shrinkage test was developed to assess shrinkage
characteristics. Durability was evaluated in the SAWTET, and moisture susceptibility was
assessed in the TST. Modulus values for the limestone were obtained through the Standard
Method of Test for Resilient Modulus of Subgrade Soils and Untreated Base/Subbase Materials
(AASHTO T 292-91) and the free-free resonant column method developed at the University of
Texas at El Paso.
40
FINDINGS
Both the limestone and recycled concrete aggregates were comprised of some percentage
of smectite, which, even in small quantities, can govern the overall behavior of these materials.
Preliminary moisture susceptibility testing of the aggregates in their untreated condition yielded
poor performance, requiring stabilization of the aggregates to achieve acceptable properties
necessary for use as base materials. Unconfined compressive strength testing following the TST
showed that only the recycled concrete met the requirement of 45 psi for the Triaxial Class 1
specification in its untreated condition.
The required test specifications for strength, durability, and moisture susceptibility were
satisfied with the addition of 3.0 percent cement for the limestone and 1.5 percent cement for the
recycled concrete. For the limestone stabilized at 1.5 percent, samples yielded unconfined
compressive strengths straddling the specified minimum value, and large variability in the
SAWTET data resulted in the inclusion of the specified maximum allowable erosion value
within one standard deviation above the mean. Furthermore, while the dielectric value of
limestone specimens stabilized at the 1.5 percent cement level was adequately reduced, the
moisture ingress was not significantly impeded compared to the moisture ingress experienced by
untreated limestone samples. Specifications for maximum allowable shrinkage were exceeded
by both aggregates at all cement levels, however, with one exception discussed in Chapter 4 that
could have been due to unusually high sample density. Overall, instrumentation and
measurement difficulties and possible variations in material constituents produced relatively high
variability in results obtained in both the shrinkage and durability tests.
Modulus values obtained with the Standard Method of Test for Resilient Modulus of
Subgrade Soils and Untreated Base/Subbase Materials (AASHTO T 292-91) were apparently
influenced by end effects, where the modulus values computed from 6-in. gauge lengths were 6,
13, and 20 times higher than those computed from measurements over 8-in. gauge lengths at
cement levels of 1.5, 3.0, and 4.5 percent, respectively. The seismic method was also used to
measure Young’s modulus and the shear modulus of elasticity for the limestone samples, the
application of which is subject to ongoing research at the University of Texas at El Paso.
41
RECOMMENDATIONS
The recommendations of this report address selection of optimum cement contents for the
limestone and recycled concrete evaluated in this project, laboratory procedures proposed for
design of cement-treated materials, and a field measure for inhibiting the development of
reflection cracking in surface layers placed over cement-treated bases.
Selection of Optimum Cement Contents
Based on the results of this project, 3.0 percent cement should be used for stabilizing the
limestone aggregate, and 1.5 percent cement should be adequate for the recycled concrete. This
selection satisfies the specifications required for unconfined compressive strength, durability,
and moisture susceptibility testing. These recommendations are based on laboratory data
presented in this report and should be valid as long as variations in mineralogy, gradations, or
other important physical or chemical properties are not significant between samples tested in this
project and aggregates proposed for use in actual highway construction.
Proposed Laboratory Procedures
For future testing of aggregate base materials to determine optimum cement contents, the
joint utilization of the Soil Cement Compressive Strength Test (TxDOT Test Method Tex-120-E)
and the TST is recommended. Sufficient quantities of cement should be added to tested samples
to obtain minimum seven-day unconfined compressive strengths of 300 psi in the former and
maximum average surface dielectric values of 10 in the latter. The minimum amount of cement
necessary to satisfy both criteria should be recommended for pavement construction. For
reasons cited earlier, this report does not at this time recommend the use of the linear shrinkage
test or the SAWTET used in this project.
Proposed Field Procedure
As discussed earlier in this report, pre-cracking is a viable method for reducing reflection
cracking through surface layers placed over cement-treated bases. In conjunction with proper
laboratory testing conducted to determine optimum cement contents as described above, pre-
cracking can be used in the field during construction to enhance the performance of cement-
treated base layers. Pre-cracking of cement-treated materials should occur within one to three
42
days after placement, where heavy traffic or vibratory rollers can be used to create networks of
microcracks within the base layer that eliminate the development of large shrinkage cracks. As
part of a separate project, a provisional pre-cracking specification was developed based on
experimental techniques employed during new construction of a residential subdivision in
College Station, Texas. Several issues potentially affecting this proposed specification, which is
given in the appendix of this report, are recommended for further evaluation. Additional
research is needed to determine the necessity of potential adjustments in the methodology to
accommodate construction of base layers of different thicknesses and varying unconfined
compressive strengths. The effects of ambient temperature on the curing of cement-treated
materials and the subsequent efficacy of pre-cracking should also be investigated for different
seasons.
43
REFERENCES
1. Scullion, T., S. Sebesta, J. P. Harris, and I. Syed. A Balanced Approach to Selecting the
Optimal Cement Content for Soil-Cement Bases. Report 404611-1. Texas Transportation
Institute, Texas A&M University System, College Station, TX, 2000.
2. Scullion, T., and P. Harris. Forensic Evaluation of Three Failed Cement Treated Base
Pavements. In Transportation Research Record 1611, TRB, National Research Council,
Washington, D.C., 1998, pp. 10-18.
3. Guthrie, W. S., S. Sebesta, and T. Scullion. Design Considerations for Cement Stabilization
of Aggregate Base Materials. Report 4920-1. Texas Transportation Institute, Texas A&M
University System, College Station, TX, 2001.
4. Dixon, J. B., and S. B. Weed. Minerals in Soil Environments, Second Edition. Soil Science
Society of America, Madison, WI, 1989.
5. Dixon, J. B., and G. N. White. Soil Mineralogy Laboratory Manual. Texas A&M University
Department of Soil and Crop Sciences, College Station, TX, 1999.
6. Syed, I., T. Scullion, and R. E. Smith. Relating Tube Suction Characteristics of Granular
Base Materials to Mineralogical Components. Paper presented at Transportation Research Board
Meeting, Washington, D.C., 1999.
7. Soil-Cement Laboratory Handbook. PCA Publications, Chicago, 1971.
8. ACI Committee 230. State-of-the-Art Report on Soil Cement. ACI Materials Journal, Vol.
87, No. 4, 1990, pp. 395-417.
9. George, K. P. Minimizing Cracking in Soil Cement for Improved Performance. Final Report,
Hitek Engineering Consultants, Inc., Oxford, MS, 1999.
44
10. Neville, A. M. Properties of Concrete. John Wiley and Sons, Inc., New York, 1997.
11. Caltabiano, M. A., and R. E. Rawlings. Treatment of Reflection Cracks in Queensland. In
Proceedings of the Seventh International Conference on Asphalt Pavements, Nottingham,
England, 1992, pp. 1-21.
12. Barksdale, R. D., and R. R. Vergnolle. Expansive Cement Stabilization of Bases. In
Highway Research Record 255, HRB, Washington, D.C., 1968, pp. 30-41.
13. Kuhlman, R. H. Cracking in Soil Cement—Cause, Effect, Control. Concrete International,
Vol. 16, No. 8, 1994, pp. 56-59.
14. Norling, L. T. Minimizing Reflective Cracks in Soil-Cement Pavements—A Status Report
of Laboratory Studies and Field Practices. In Highway Research Record 442, HRB,
Washington, D.C., 1973, pp. 22-23.
15. Williams, R. I. T. Cement Treated Bases—Materials, Design, and Construction. Elsevier
Publishers, Ltd., London, 1986.
16. Pretorius, P. C. Design Considerations for Pavements Containing Soil Cement Bases. Ph.D.
Dissertation, The University of California at Berkeley, 1970.
17. Litzka, J., and W. Haslehner. Cold In-Place Recycling on Low Volume Roads in Austria.
In Proceedings of the Sixth International Conference on Low Volume Roads, Minneapolis, MN,
1995, pp. 189-194.
18. Scullion, T. Field Investigation: Pre-Cracking of Soil-Cement Bases to Reduce Reflection
Cracking. Submitted for publication in Transportation Research Record, TRB, National
Research Council, Washington, D.C., 2002.
45
19. De Beer, M. Aspects of Erodibility of Lightly Cementitious Materials. Report DPVT 39.
Roads and Transport Technology, CSIR, South Africa, 1989.
20. Van Blerk, P. G., and T. Scullion. Evaluation of Stabilized Base Durability Using a
Modified South African Wheel Tracking Device. Report 2919-1. Texas Transportation Institute,
Texas A&M University System, College Station, TX, 1995.
21. Syed, I., and T. Scullion. Performance Indicator for Moisture Susceptible Stabilized Base
Material in Pavements. In Proceedings of the Texas Section, American Society of Civil
Engineers, Fall Meeting, Dallas, 1998, pp. 213-222.
22. Scullion, T., and T. Saarenketo. Using Suction and Dielectric Measurements as
Performance Indicators for Aggregate Base Materials. In Transportation Research Record 1577,
TRB, National Research Council, Washington, D.C., 1996, pp. 37-44.
23. Carpenter, S. H., and R. L. Lytton. Thermal Pavement Cracking in West Texas. Report 18-
4F. Texas Transportation Institute, Texas A&M University System, College Station, TX, 1977.
24. Mitchell, J. K. Fundamentals of Soil Behavior. John Wiley and Sons, Inc., New York,
1976.
25. Saarenketo, T., and T. Scullion. Using Electrical Properties to Clarify the Strength
Properties of Base Course Aggregates. Report 1341-2. Texas Transportation Institute, Texas
A&M University System, College Station, TX, 1995.
26. Guthrie, W. S., and T. Scullion. Assessing Aggregate Strength and Frost Susceptibility
Characteristics with the Tube Suction Test. In Proceedings of the Texas Section, American
Society of Civil Engineers, Fall Meeting, El Paso, TX, 2000, pp. 197-206.
46
27. Scullion, T., and C. Lau. Modeling GPR Wave Propagation in Pavement Systems. Report
1233-2. Texas Transportation Institute, Texas A&M University System, College Station, TX,
1992.
28. Huang, Y. H. Pavement Analysis and Design. Prentice Hall, Englewood Cliffs, NJ, 1993.
29. Nazarian, S., D. Yuan, and V. Tandon. Specifications for Tools Used in Structural Field
Testing of Flexible Pavement Layers. Report 1735-1. Center for Highway Materials Research,
University of Texas at El Paso, El Paso, TX, 1998.
30. Sharma, P. Environmental and Engineering Geophysics. Cambridge University Press,
Cambridge, England, 1997.
31. Little, D. N. Handbook for Stabilization of Pavement Subgrades and Base Courses with
Lime. Kendall/Hunt Publishing Company, Dubuque, IA, 1995.
32. Albers, H. Materials Laboratory Supervisor, Texas Department of Transportation, Austin,
TX, Personal Communication, August 1999.
33. Syed, I. Moisture Movement in Stabilized Materials. Ph.D. Dissertation, Texas A&M
University System, College Station, TX, 2000.
34. White, G. N. Research Associate, Department of Soil and Crop Sciences, Texas A&M
University System, College Station, TX, Personal Communication, November 1999.
35. Moore, W. M., S. C. Britton, and F. H. Scrivner. A Laboratory Study of the Relation of
Stress to Strain for a Crushed Limestone Base Material. Report 99-5F. Texas Transportation
Institute, Texas A&M University System, College Station, TX, 1970.
47
36. Pezo, R., M. Picornell, and S. Nazarian. Evaluation of Strain Variation Within a Triaxial
Specimen Due to End Effects. In Transportation Research Record 1614, TRB, National
Research Council, Washington, D.C., 1998, pp. 35-42.

49
APPENDIX:
PROVISIONAL PRE-CRACKING SPECIFICATION

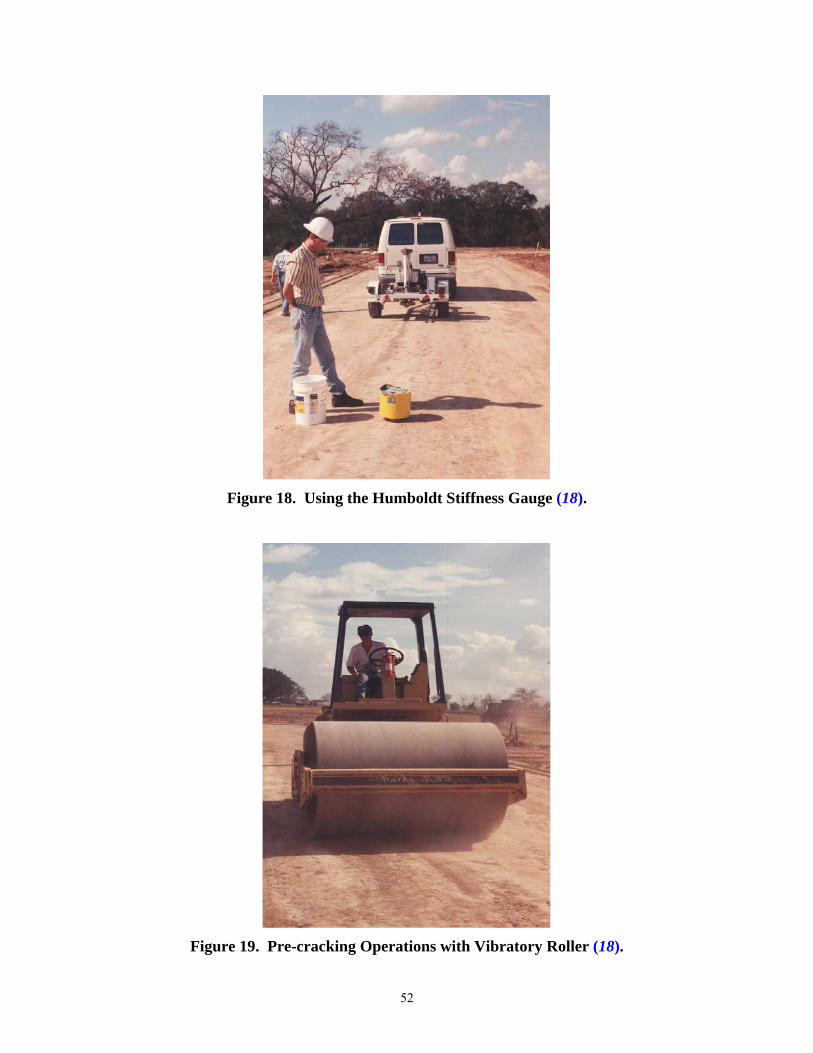
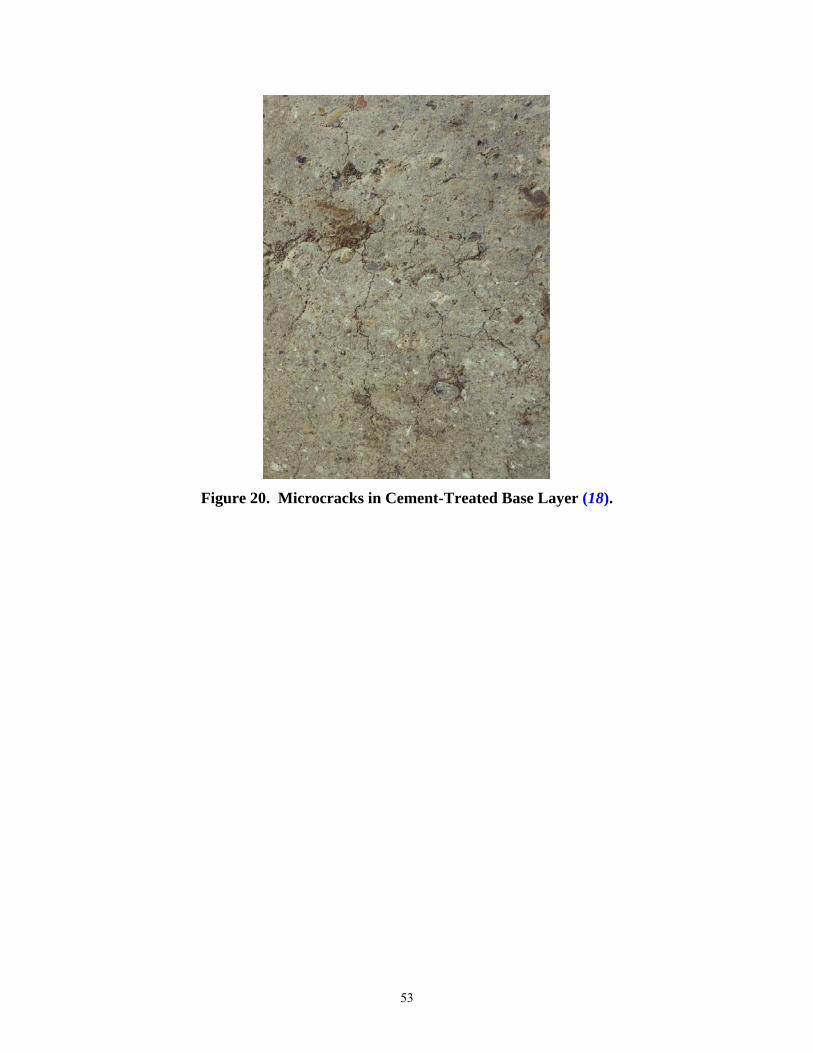


![arXiv:1512.05461v1 [cond-mat.mtrl-sci] 17 Dec 2015 out the signi cance of well-graded aggregate in obtaining optimum strength [4, 5]. When elemental sulfur and aggregate are hot-mixed,](https://static.fdocuments.net/doc/165x107/5b0107037f8b9a84338d8aac/arxiv151205461v1-cond-matmtrl-sci-17-dec-2015-out-the-signi-cance-of-well-graded.jpg)