Selected Socio-Economic Data Millen city,...
32
www.fairdata2000.com 7-May-03 Selected Socio-Economic Data Millen city, Georgia African American and White, Not Hispanic Data Set: Census 2000 Summary File 3 (SF 3) - Sample Data
Transcript of Selected Socio-Economic Data Millen city,...

www.fairdata2000.com
7-May-03
Selected Socio-Economic Data
Millen city, Georgia
African American and White, Not Hispanic
Data Set: Census 2000 Summary File 3 (SF 3) - Sample Data
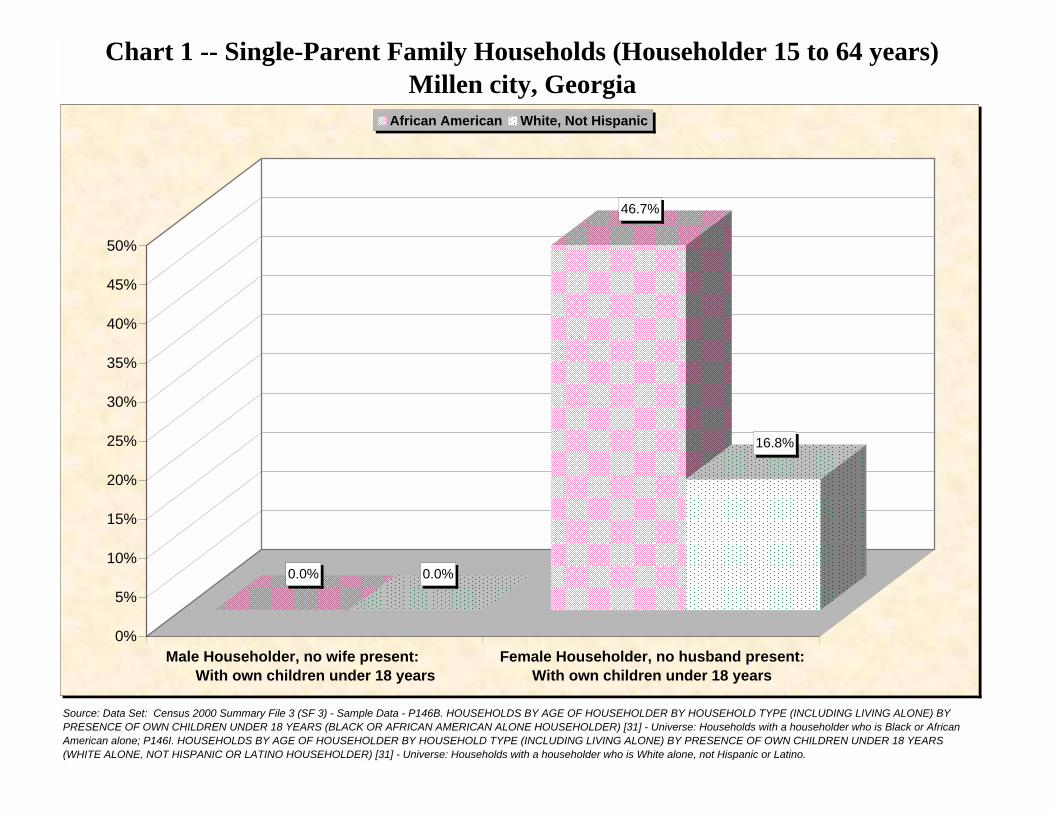
Chart 1 -- Single-Parent Family Households (Householder 15 to 64 years)
Source: Data Set: Census 2000 Summary File 3 (SF 3) - Sample Data - P146B. HOUSEHOLDS BY AGE OF HOUSEHOLDER BY HOUSEHOLD TYPE (INCLUDING LIVING ALONE) BY PRESENCE OF OWN CHILDREN UNDER 18 YEARS (BLACK OR AFRICAN AMERICAN ALONE HOUSEHOLDER) [31] - Universe: Households with a householder who is Black or African American alone; P146I. HOUSEHOLDS BY AGE OF HOUSEHOLDER BY HOUSEHOLD TYPE (INCLUDING LIVING ALONE) BY PRESENCE OF OWN CHILDREN UNDER 18 YEARS (WHITE ALONE, NOT HISPANIC OR LATINO HOUSEHOLDER) [31] - Universe: Households with a householder who is White alone, not Hispanic or Latino.
Millen city, Georgia
0.0% 0.0%
46.7%
16.8%
0%
5%
10%
15%
20%
25%
30%
35%
40%
45%
50%
Male Householder, no wife present: With own children under 18 years
Female Householder, no husband present:With own children under 18 years
African American White, Not Hispanic

Chart 2 -- Private School Enrollment (3 years and over)Millen city, Georgia
Source: Data Set: Census 2000 Summary File 3 (SF 3) - Sample Data -- P147B. SCHOOL ENROLLMENT BY LEVEL OF SCHOOL BY TYPE OF SCHOOL FOR THE POPULATION 3 YEARS AND OVER (BLACK OR AFRICAN AMERICAN ALONE) [17] - Universe: Black or African American alone 3 years and over; P147I. SCHOOL ENROLLMENT BY LEVEL OF SCHOOL BY TYPE OF SCHOOL FOR THE POPULATION 3 YEARS AND OVER (WHITE ALONE, NOT HISPANIC OR LATINO) [17] - Universe: White alone, not Hispanic or Latino population 3 years and over.
0.0%
31.6%
0.0% 0.0% 0.0% 0.0% 0.0%
8.8%
0.0%
12.5%
0%
5%
10%
15%
20%
25%
30%
35%
Private schoolnursery school
Private schoolkindergarten
Private schoolgrade 1 to 8
Private schoolgrade 9 to 12
Private College
African American White, Not Hispanic
Millen city, Georgia
Source: Data Set: Census 2000 Summary File 3 (SF 3) - Sample Data -- P148B. SEX BY EDUCATIONAL ATTAINMENT FOR THE POPULATION 25 YEARS AND OVER (BLACK OR AFRICAN AMERICAN ALONE) [17] - Universe: Black or African American alone 25 years and over; P148I. SEX BY EDUCATIONAL ATTAINMENT FOR THE POPULATION 25 YEARS AND OVER (WHITE ALONE, NOT HISPANIC OR LATINO) [17] - Universe: White alone, not Hispanic or Latino population 25 years and over.
Chart 3 -- Educational Attainment (25 years and over)
28.4%
11.8%
22.8%23.7%
38.7%
27.1%
5.5%
20.1%
1.7%
5.8%
2.3%3.1%
0.6%
8.4%
0%
5%
10%
15%
20%
25%
30%
35%
40%
Less than 9thgrade
9th to 12thgrade, nodiploma
High schoolgraduate(includes
equivalency)
Some college,no degree
Associatedegree
Bachelor'sdegree
Graduate orprofessional
degree
African American White, Not Hispanic
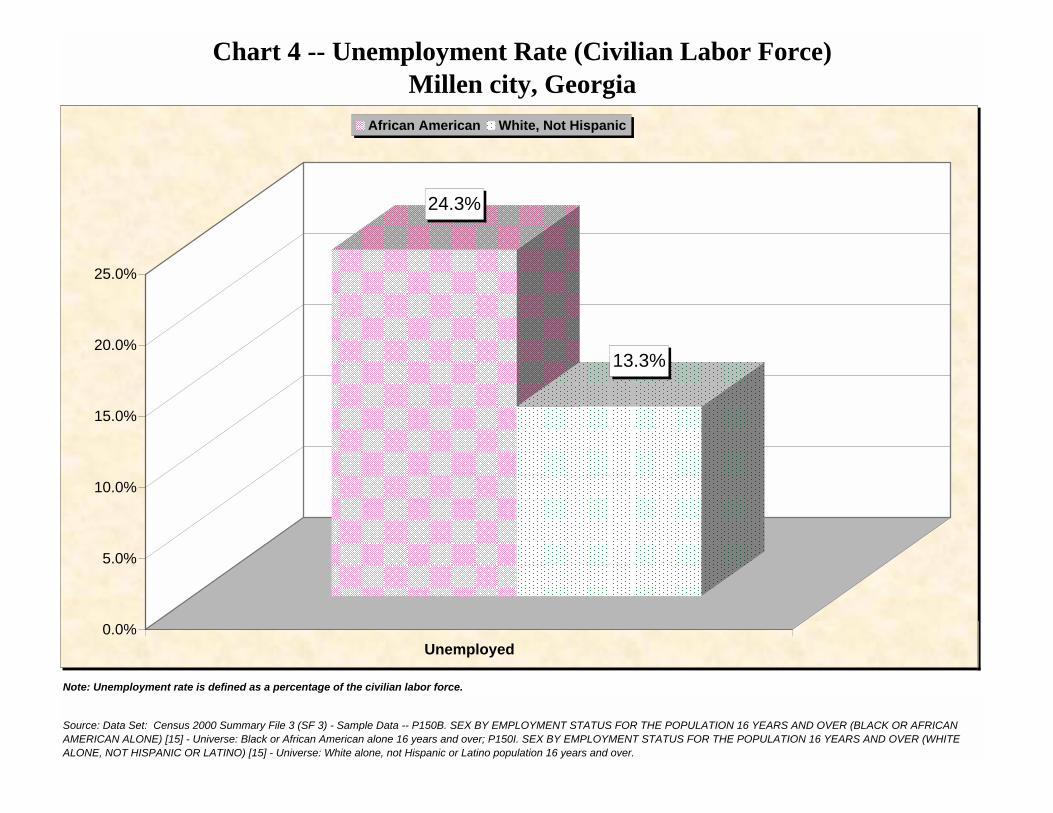
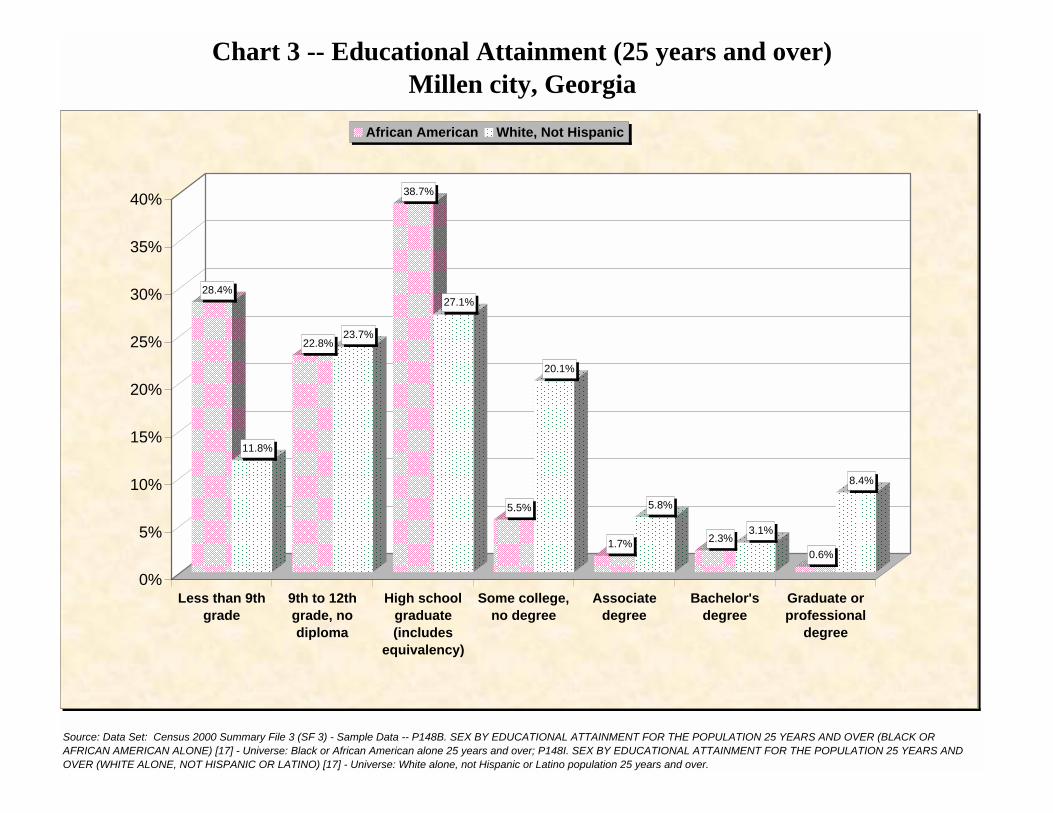
Note: Unemployment rate is defined as a percentage of the civilian labor force.
Chart 4 -- Unemployment Rate (Civilian Labor Force)Millen city, Georgia
Source: Data Set: Census 2000 Summary File 3 (SF 3) - Sample Data -- P150B. SEX BY EMPLOYMENT STATUS FOR THE POPULATION 16 YEARS AND OVER (BLACK OR AFRICAN AMERICAN ALONE) [15] - Universe: Black or African American alone 16 years and over; P150I. SEX BY EMPLOYMENT STATUS FOR THE POPULATION 16 YEARS AND OVER (WHITE ALONE, NOT HISPANIC OR LATINO) [15] - Universe: White alone, not Hispanic or Latino population 16 years and over.
24.3%
13.3%
0.0%
5.0%
10.0%
15.0%
20.0%
25.0%
Unemployed
African American White, Not Hispanic

Note: Labor force participation rate is defined as a percentage of the civilian population over 16.
Millen city, GeorgiaChart 5 -- Labor Force Participation (Civilian Labor Force)
Source: Data Set: Census 2000 Summary File 3 (SF 3) - Sample Data -- P150B. SEX BY EMPLOYMENT STATUS FOR THE POPULATION 16 YEARS AND OVER (BLACK OR AFRICAN AMERICAN ALONE) [15] - Universe: Black or African American alone 16 years and over; P150I. SEX BY EMPLOYMENT STATUS FOR THE POPULATION 16 YEARS AND OVER (WHITE ALONE, NOT HISPANIC OR LATINO) [15] - Universe: White alone, not Hispanic or Latino population 16 years and over.
53.1%56.1%
0%
10%
20%
30%
40%
50%
60%
Civilian Labor Force
African American White, Not Hispanic
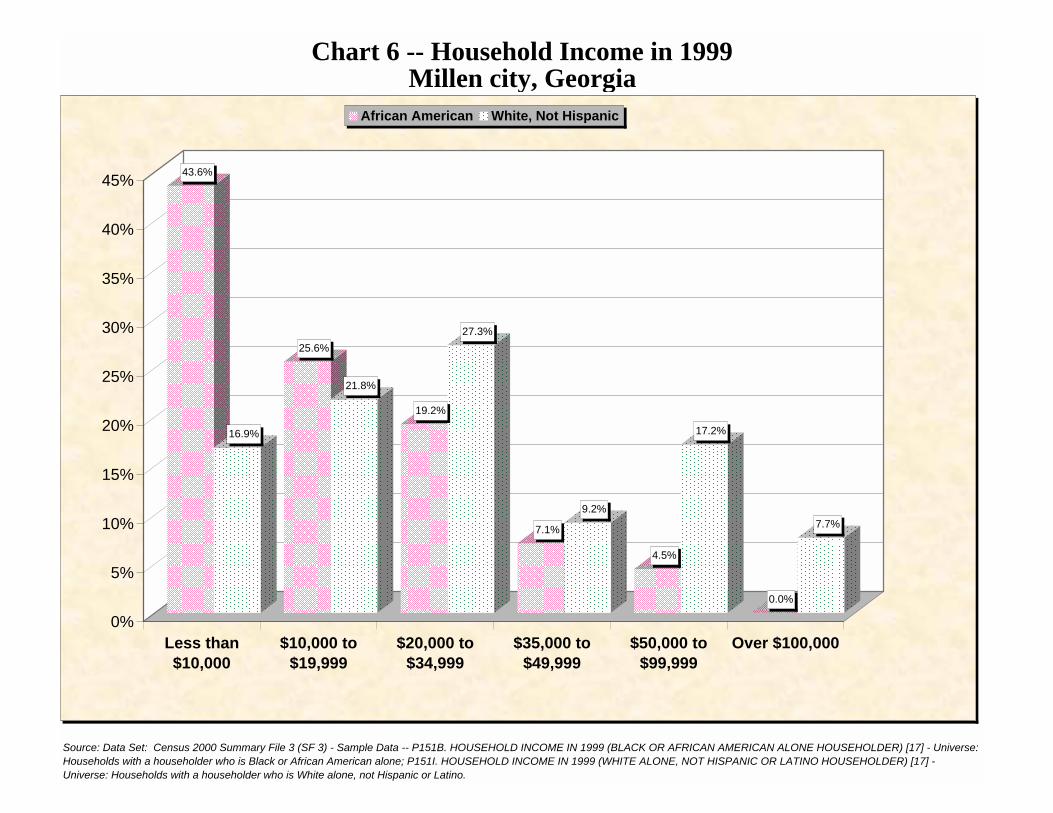
Millen city, GeorgiaChart 6 -- Household Income in 1999
Source: Data Set: Census 2000 Summary File 3 (SF 3) - Sample Data -- P151B. HOUSEHOLD INCOME IN 1999 (BLACK OR AFRICAN AMERICAN ALONE HOUSEHOLDER) [17] - Universe: Households with a householder who is Black or African American alone; P151I. HOUSEHOLD INCOME IN 1999 (WHITE ALONE, NOT HISPANIC OR LATINO HOUSEHOLDER) [17] - Universe: Households with a householder who is White alone, not Hispanic or Latino.
43.6%
16.9%
25.6%
21.8%
19.2%
27.3%
7.1%
9.2%
4.5%
17.2%
0.0%
7.7%
0%
5%
10%
15%
20%
25%
30%
35%
40%
45%
Less than$10,000
$10,000 to$19,999
$20,000 to$34,999
$35,000 to$49,999
$50,000 to$99,999
Over $100,000
African American White, Not Hispanic
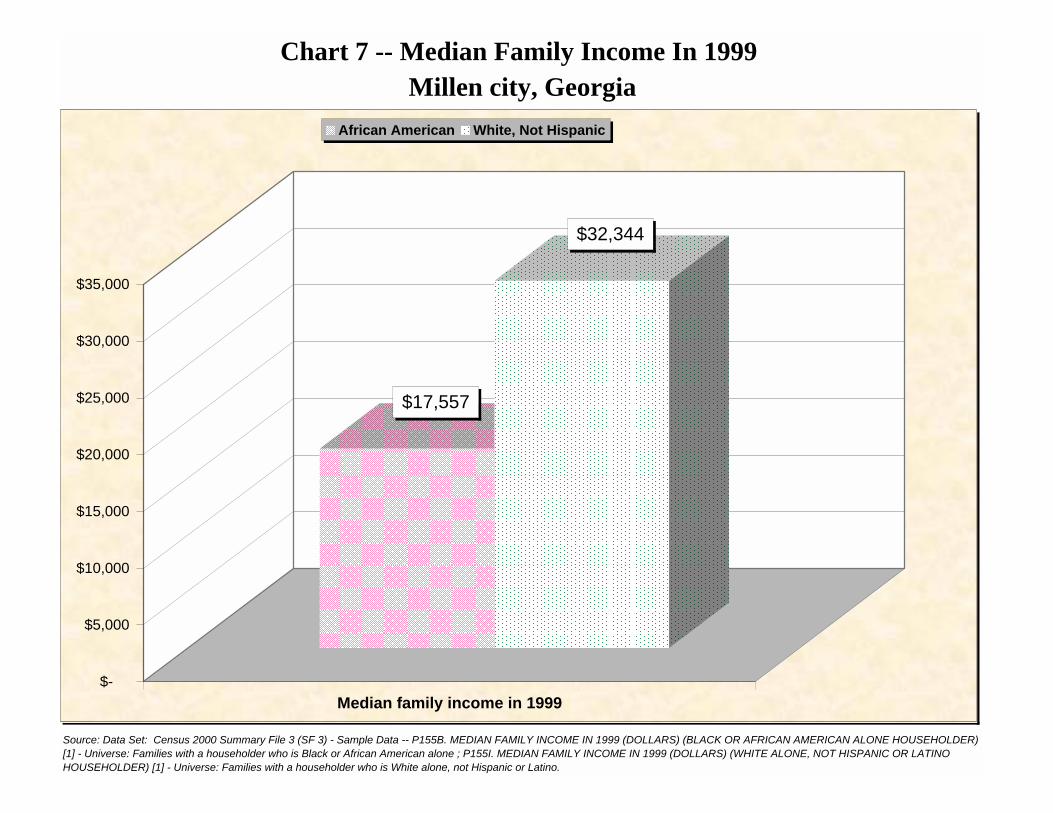
Chart 7 -- Median Family Income In 1999 Millen city, Georgia
Source: Data Set: Census 2000 Summary File 3 (SF 3) - Sample Data -- P155B. MEDIAN FAMILY INCOME IN 1999 (DOLLARS) (BLACK OR AFRICAN AMERICAN ALONE HOUSEHOLDER) [1] - Universe: Families with a householder who is Black or African American alone ; P155I. MEDIAN FAMILY INCOME IN 1999 (DOLLARS) (WHITE ALONE, NOT HISPANIC OR LATINO HOUSEHOLDER) [1] - Universe: Families with a householder who is White alone, not Hispanic or Latino.
$17,557
$32,344
$-
$5,000
$10,000
$15,000
$20,000
$25,000
$30,000
$35,000
Median family income in 1999
African American White, Not Hispanic
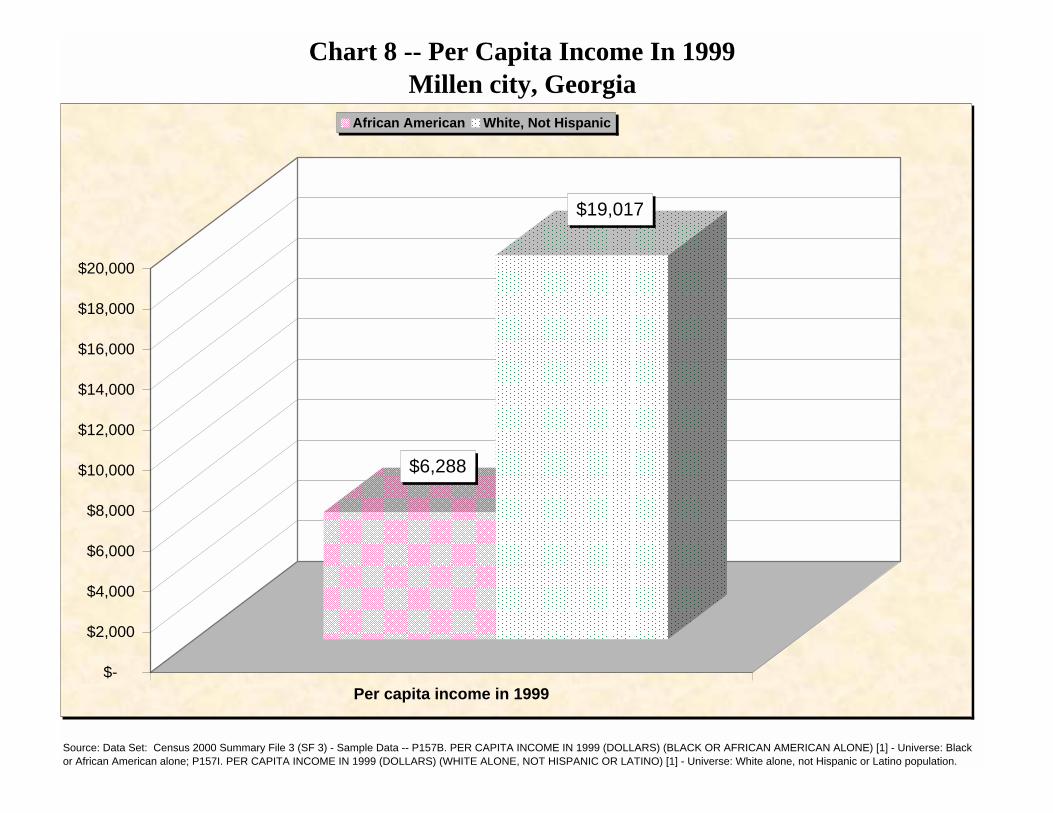
Millen city, GeorgiaChart 8 -- Per Capita Income In 1999
Source: Data Set: Census 2000 Summary File 3 (SF 3) - Sample Data -- P157B. PER CAPITA INCOME IN 1999 (DOLLARS) (BLACK OR AFRICAN AMERICAN ALONE) [1] - Universe: Black or African American alone; P157I. PER CAPITA INCOME IN 1999 (DOLLARS) (WHITE ALONE, NOT HISPANIC OR LATINO) [1] - Universe: White alone, not Hispanic or Latino population.
$6,288
$19,017
$-
$2,000
$4,000
$6,000
$8,000
$10,000
$12,000
$14,000
$16,000
$18,000
$20,000
Per capita income in 1999
African American White, Not Hispanic

Chart 9 -- Income in 1999 Below Poverty Level by Age Millen city, Georgia
Source: Data Set: Census 2000 Summary File 3 (SF 3) - Sample Data -- P159B. POVERTY STATUS IN 1999 BY AGE (BLACK OR AFRICAN AMERICAN ALONE) [17] - Universe: Black or African American alone for whom poverty status is determined;P159I. POVERTY STATUS IN 1999 BY AGE (WHITE ALONE, NOT HISPANIC OR LATINO) [17] - Universe: White alone, not Hispanic or Latino population for whom poverty status is determined.
52.1%
13.7%
82.4%
20.4%
100.0%
0.0%
45.2%
8.5%
54.1%
10.6%
48.3%
12.9%
47.0%
8.9%
47.6%
22.8%
0%
10%
20%
30%
40%
50%
60%
70%
80%
90%
100%
All ages belowpoverty level
Under 5 years 5 years 6 to 11 years 12 to 17 years 18 to 64 years 65 to 74 years 75 years andover
African American White, Not Hispanic

Millen city, Georgia
Source: Data Set: Census 2000 Summary File 3 (SF 3) - Sample Data -- PCT74B. MEDIAN EARNINGS IN 1999 (DOLLARS) BY WORK EXPERIENCE IN 1999 BY SEX FOR THE POPULATION 16 YEARS AND OVER WITH EARNINGS (BLACK OR AFRICAN AMERICAN ALONE) [6] - Universe: Black or African American alone 16 years and over with earnings in 1999; PCT74I. MEDIAN EARNINGS IN 1999 (DOLLARS) BY WORK EXPERIENCE IN 1999 BY SEX FOR THE POPULATION 16 YEARS AND OVER WITH EARNINGS (WHITE ALONE, NOT HISPANIC OR LATINO) [6] - Universe: White alone, not Hispanic or Latino population 16 years and over with earnings in 1999.
Chart 10 -- Median Earnings in 1999
$17,798
$26,778
$-
$5,000
$10,000
$15,000
$20,000
$25,000
$30,000
Worked full-time, year-round in 1999
African American White, Not Hispanic
Millen city, Georgia
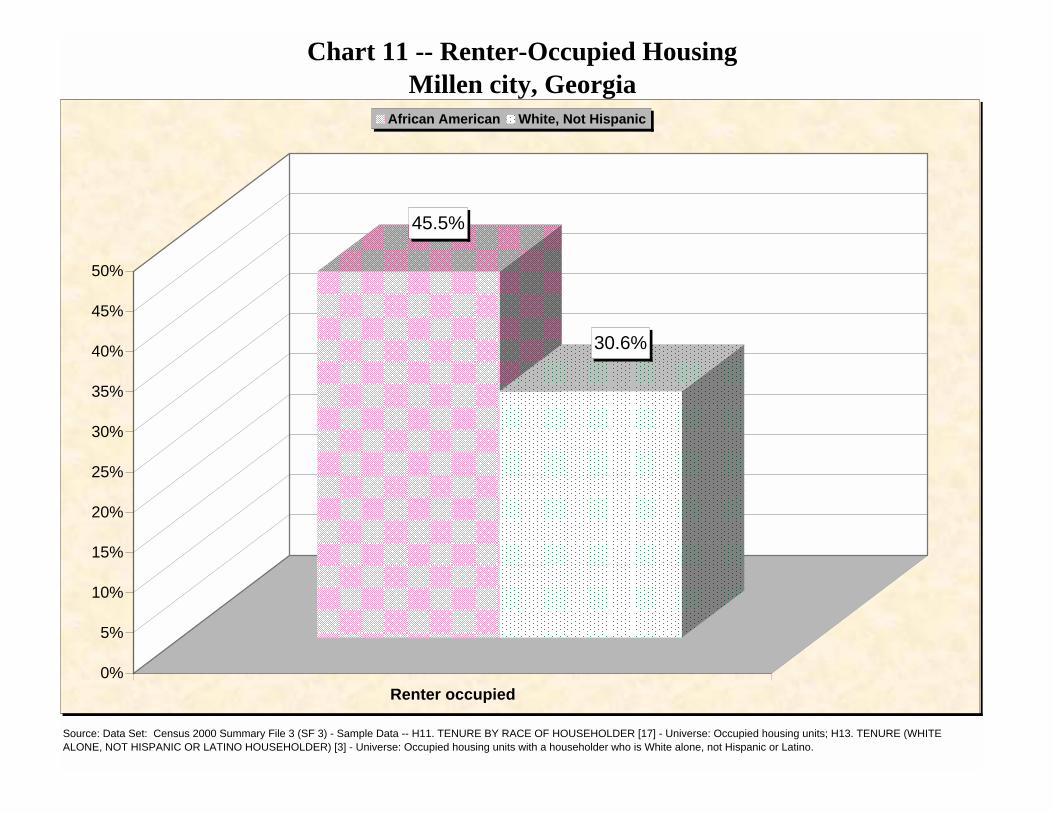
Source: Data Set: Census 2000 Summary File 3 (SF 3) - Sample Data -- H11. TENURE BY RACE OF HOUSEHOLDER [17] - Universe: Occupied housing units; H13. TENURE (WHITE ALONE, NOT HISPANIC OR LATINO HOUSEHOLDER) [3] - Universe: Occupied housing units with a householder who is White alone, not Hispanic or Latino.
Chart 11 -- Renter-Occupied Housing
45.5%
30.6%
0%
5%
10%
15%
20%
25%
30%
35%
40%
45%
50%
Renter occupied
African American White, Not Hispanic
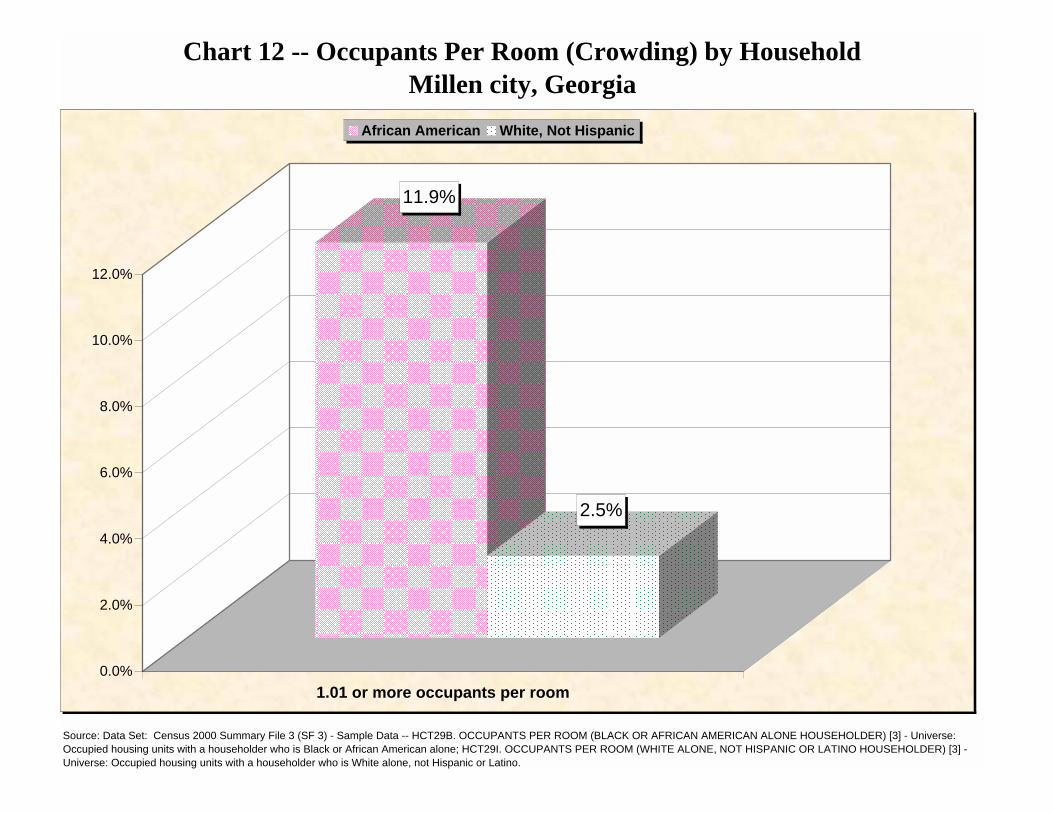
Chart 12 -- Occupants Per Room (Crowding) by HouseholdMillen city, Georgia
Source: Data Set: Census 2000 Summary File 3 (SF 3) - Sample Data -- HCT29B. OCCUPANTS PER ROOM (BLACK OR AFRICAN AMERICAN ALONE HOUSEHOLDER) [3] - Universe: Occupied housing units with a householder who is Black or African American alone; HCT29I. OCCUPANTS PER ROOM (WHITE ALONE, NOT HISPANIC OR LATINO HOUSEHOLDER) [3] - Universe: Occupied housing units with a householder who is White alone, not Hispanic or Latino.
11.9%
2.5%
0.0%
2.0%
4.0%
6.0%
8.0%
10.0%
12.0%
1.01 or more occupants per room
African American White, Not Hispanic
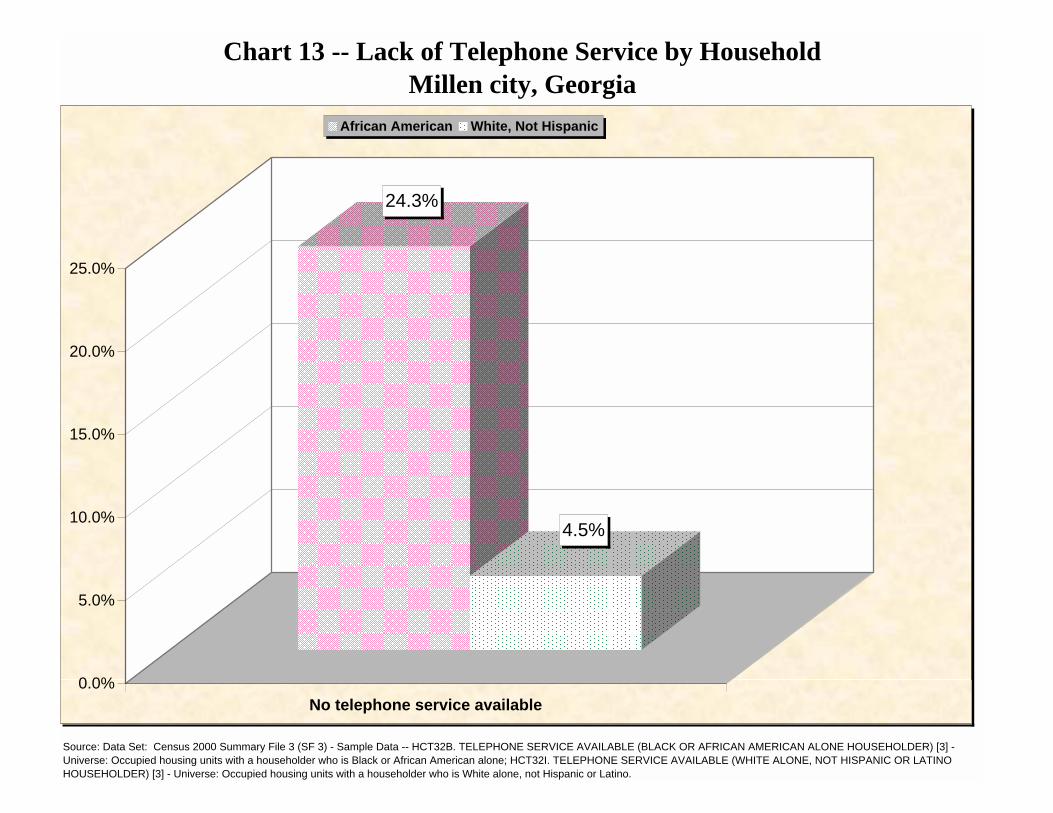
Chart 13 -- Lack of Telephone Service by Household
Source: Data Set: Census 2000 Summary File 3 (SF 3) - Sample Data -- HCT32B. TELEPHONE SERVICE AVAILABLE (BLACK OR AFRICAN AMERICAN ALONE HOUSEHOLDER) [3] - Universe: Occupied housing units with a householder who is Black or African American alone; HCT32I. TELEPHONE SERVICE AVAILABLE (WHITE ALONE, NOT HISPANIC OR LATINO HOUSEHOLDER) [3] - Universe: Occupied housing units with a householder who is White alone, not Hispanic or Latino.
Millen city, Georgia
24.3%
4.5%
0.0%
5.0%
10.0%
15.0%
20.0%
25.0%
No telephone service available
African American White, Not Hispanic
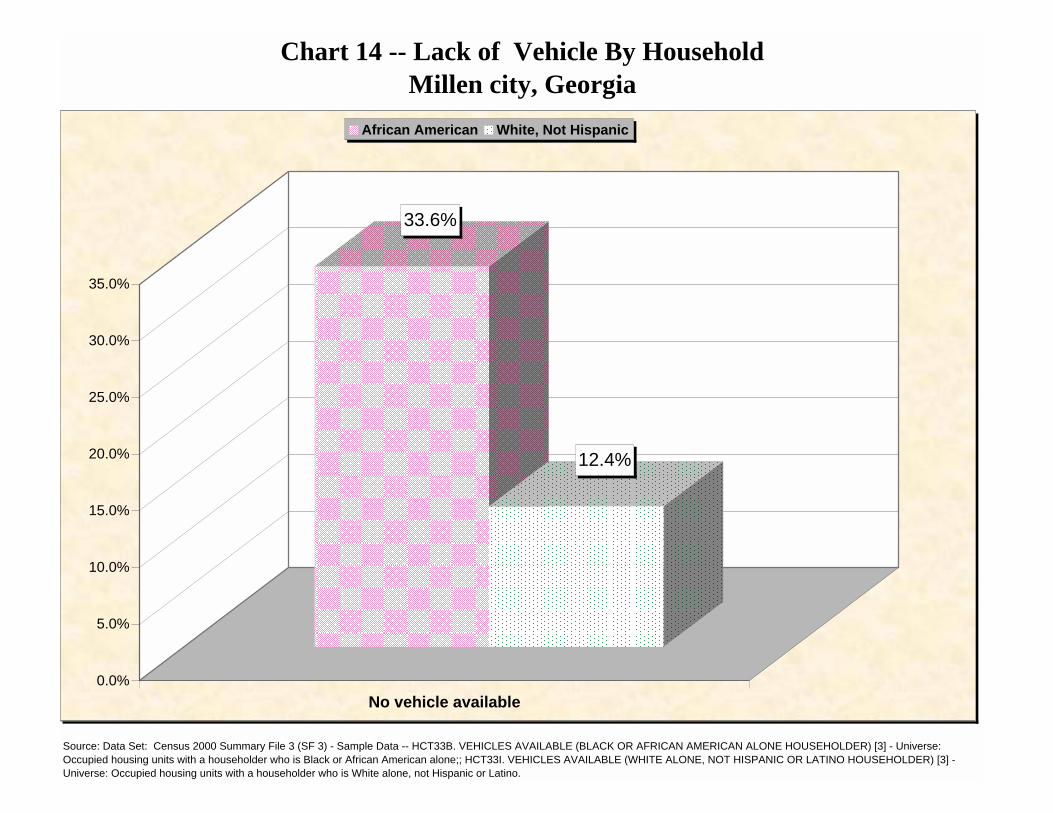
Millen city, GeorgiaChart 14 -- Lack of Vehicle By Household
Source: Data Set: Census 2000 Summary File 3 (SF 3) - Sample Data -- HCT33B. VEHICLES AVAILABLE (BLACK OR AFRICAN AMERICAN ALONE HOUSEHOLDER) [3] - Universe: Occupied housing units with a householder who is Black or African American alone;; HCT33I. VEHICLES AVAILABLE (WHITE ALONE, NOT HISPANIC OR LATINO HOUSEHOLDER) [3] - Universe: Occupied housing units with a householder who is White alone, not Hispanic or Latino.
33.6%
12.4%
0.0%
5.0%
10.0%
15.0%
20.0%
25.0%
30.0%
35.0%
No vehicle available
African American White, Not Hispanic

Chart 15 -- Lack of Plumbing By HouseholdMillen city, Georgia
Source: Data Set: Census 2000 Summary File 3 (SF 3) - Sample Data -- HCT34B. PLUMBING FACILITIES (BLACK OR AFRICAN AMERICAN ALONE HOUSEHOLDER) [3] - Universe: Occupied housing units with a householder who is Black or African American alone; HCT34I. PLUMBING FACILITIES (WHITE ALONE, NOT HISPANIC OR LATINO HOUSEHOLDER) [3] - Universe: Occupied housing units with a householder who is White alone, not Hispanic or Latino.
2.13%
0.00%
0.00%
0.50%
1.00%
1.50%
2.00%
2.50%
Lacking complete plumbing facilities
African American White, Not Hispanic
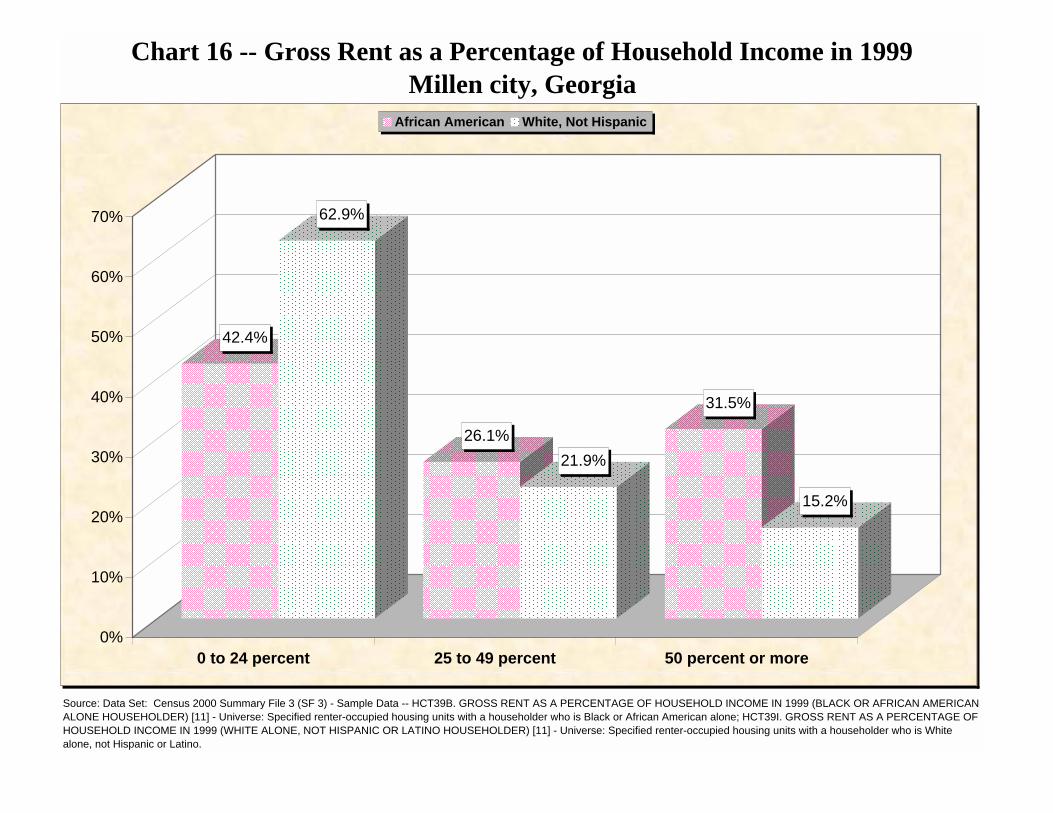
Chart 16 -- Gross Rent as a Percentage of Household Income in 1999Millen city, Georgia
Source: Data Set: Census 2000 Summary File 3 (SF 3) - Sample Data -- HCT39B. GROSS RENT AS A PERCENTAGE OF HOUSEHOLD INCOME IN 1999 (BLACK OR AFRICAN AMERICAN ALONE HOUSEHOLDER) [11] - Universe: Specified renter-occupied housing units with a householder who is Black or African American alone; HCT39I. GROSS RENT AS A PERCENTAGE OF HOUSEHOLD INCOME IN 1999 (WHITE ALONE, NOT HISPANIC OR LATINO HOUSEHOLDER) [11] - Universe: Specified renter-occupied housing units with a householder who is White alone, not Hispanic or Latino.
42.4%
62.9%
26.1%21.9%
31.5%
15.2%
0%
10%
20%
30%
40%
50%
60%
70%
0 to 24 percent 25 to 49 percent 50 percent or more
African American White, Not Hispanic

Chart 17 -- Median Gross Rent By Household
Source: Data Set: Census 2000 Summary File 3 (SF 3) - Sample Data -- HCT37B. MEDIAN GROSS RENT (DOLLARS) (BLACK OR AFRICAN AMERICAN ALONE HOUSEHOLDER) [1] - Universe: Specified renter-occupied housing units paying cash rent with a householder who is Black or African American alone; HCT37I. MEDIAN GROSS RENT (DOLLARS) (WHITE ALONE, NOT HISPANIC OR LATINO HOUSEHOLDER) [1] - Universe: Specified renter-occupied housing units paying cash rent with a householder who is White alone, not Hispanic or Latino.
Millen city, Georgia
$279
$422
$-
$50
$100
$150
$200
$250
$300
$350
$400
$450
Median gross rent
African American White, Not Hispanic
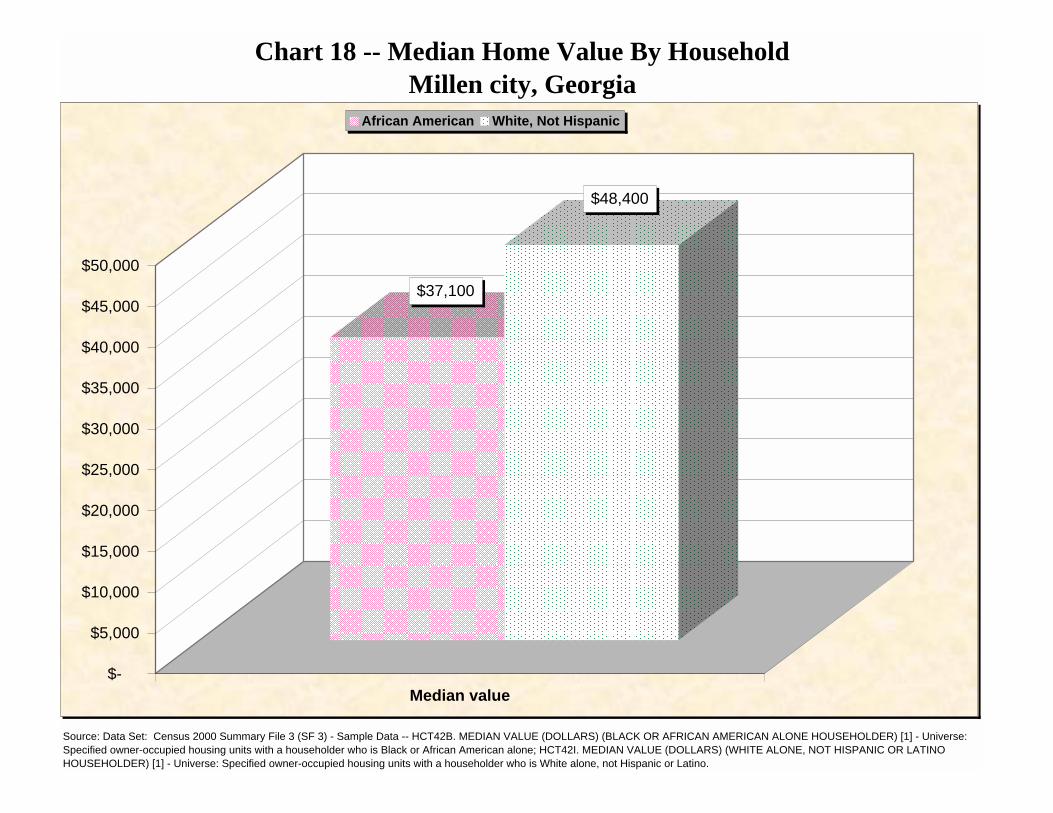
Chart 18 -- Median Home Value By HouseholdMillen city, Georgia
Source: Data Set: Census 2000 Summary File 3 (SF 3) - Sample Data -- HCT42B. MEDIAN VALUE (DOLLARS) (BLACK OR AFRICAN AMERICAN ALONE HOUSEHOLDER) [1] - Universe: Specified owner-occupied housing units with a householder who is Black or African American alone; HCT42I. MEDIAN VALUE (DOLLARS) (WHITE ALONE, NOT HISPANIC OR LATINO HOUSEHOLDER) [1] - Universe: Specified owner-occupied housing units with a householder who is White alone, not Hispanic or Latino.
$37,100
$48,400
$-
$5,000
$10,000
$15,000
$20,000
$25,000
$30,000
$35,000
$40,000
$45,000
$50,000
Median value
African American White, Not Hispanic
African American White, Not Hispanic
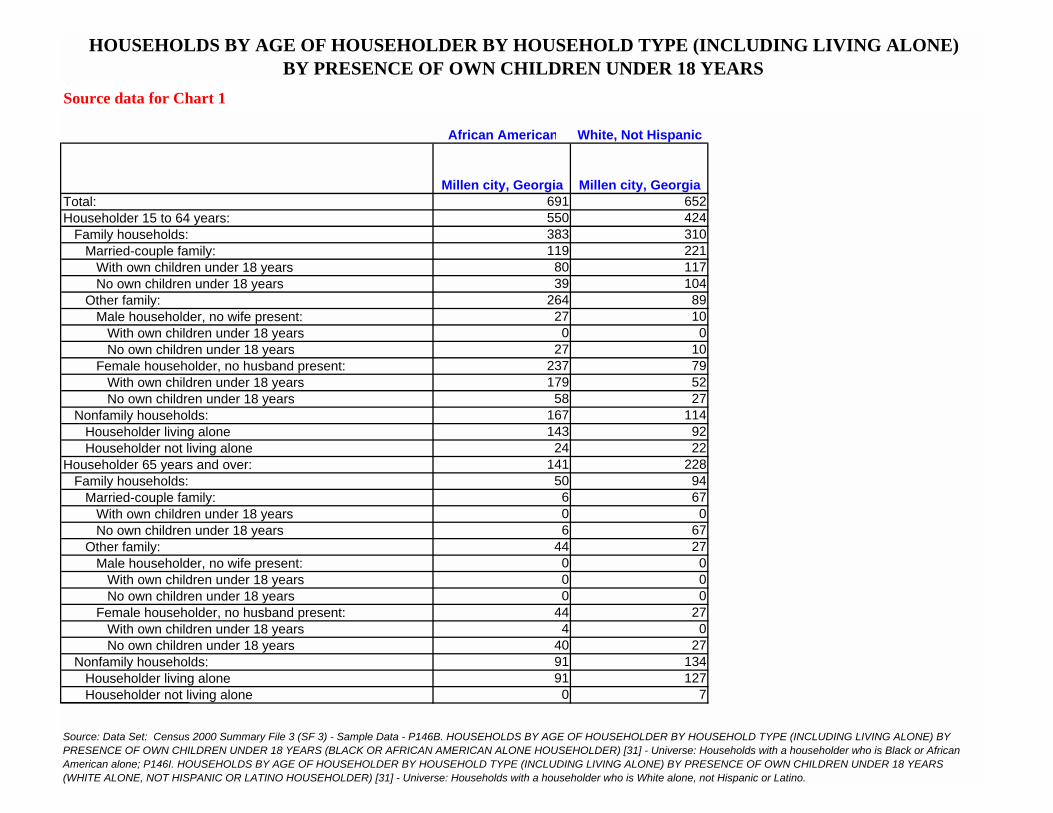
Millen city, Georgia Millen city, GeorgiaTotal: 691 652Householder 15 to 64 years: 550 424
Family households: 383 310Married-couple family: 119 221
With own children under 18 years 80 117No own children under 18 years 39 104
Other family: 264 89Male householder, no wife present: 27 10
With own children under 18 years 0 0No own children under 18 years 27 10
Female householder, no husband present: 237 79With own children under 18 years 179 52No own children under 18 years 58 27
Nonfamily households: 167 114Householder living alone 143 92Householder not living alone 24 22
Householder 65 years and over: 141 228Family households: 50 94
Married-couple family: 6 67With own children under 18 years 0 0No own children under 18 years 6 67
Other family: 44 27Male householder, no wife present: 0 0
With own children under 18 years 0 0No own children under 18 years 0 0
Female householder, no husband present: 44 27With own children under 18 years 4 0No own children under 18 years 40 27
Nonfamily households: 91 134Householder living alone 91 127Householder not living alone 0 7
Source: Data Set: Census 2000 Summary File 3 (SF 3) - Sample Data - P146B. HOUSEHOLDS BY AGE OF HOUSEHOLDER BY HOUSEHOLD TYPE (INCLUDING LIVING ALONE) BY PRESENCE OF OWN CHILDREN UNDER 18 YEARS (BLACK OR AFRICAN AMERICAN ALONE HOUSEHOLDER) [31] - Universe: Households with a householder who is Black or African American alone; P146I. HOUSEHOLDS BY AGE OF HOUSEHOLDER BY HOUSEHOLD TYPE (INCLUDING LIVING ALONE) BY PRESENCE OF OWN CHILDREN UNDER 18 YEARS (WHITE ALONE, NOT HISPANIC OR LATINO HOUSEHOLDER) [31] - Universe: Households with a householder who is White alone, not Hispanic or Latino.
HOUSEHOLDS BY AGE OF HOUSEHOLDER BY HOUSEHOLD TYPE (INCLUDING LIVING ALONE) BY PRESENCE OF OWN CHILDREN UNDER 18 YEARS
Source data for Chart 1
African American White, Not Hispanic
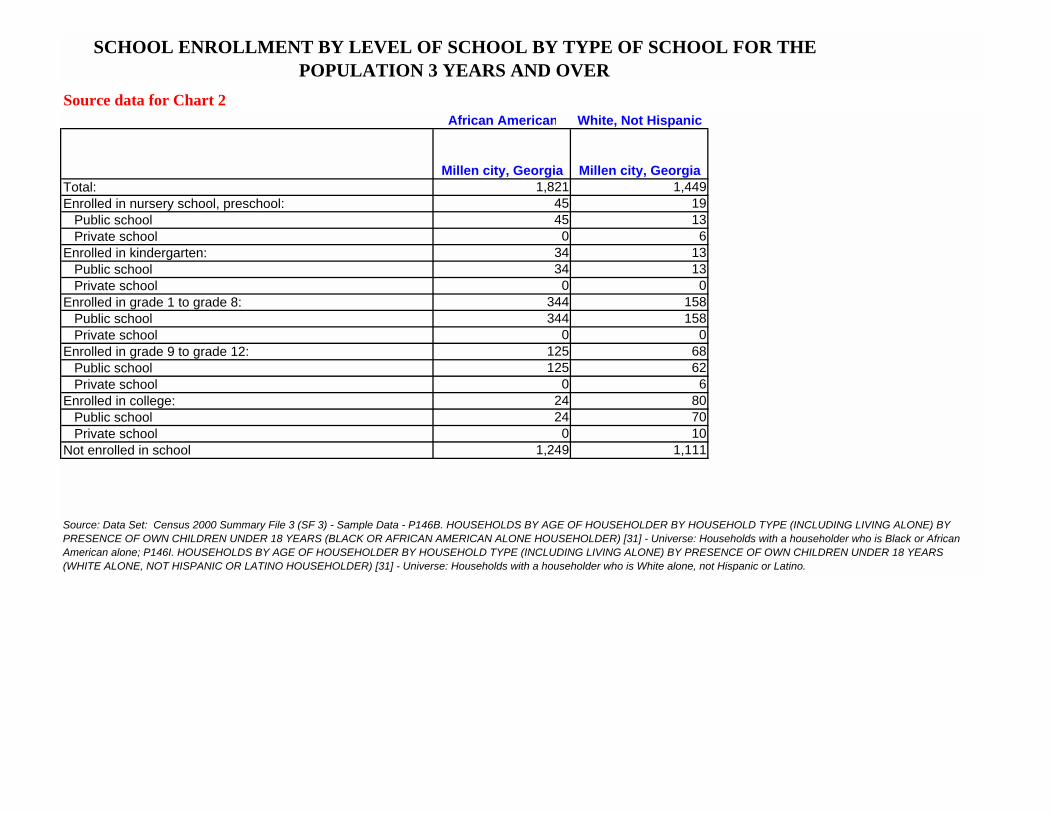
Millen city, Georgia Millen city, GeorgiaTotal: 1,821 1,449Enrolled in nursery school, preschool: 45 19
Public school 45 13Private school 0 6
Enrolled in kindergarten: 34 13Public school 34 13Private school 0 0
Enrolled in grade 1 to grade 8: 344 158Public school 344 158Private school 0 0
Enrolled in grade 9 to grade 12: 125 68Public school 125 62Private school 0 6
Enrolled in college: 24 80Public school 24 70Private school 0 10
Not enrolled in school 1,249 1,111
Source data for Chart 2
SCHOOL ENROLLMENT BY LEVEL OF SCHOOL BY TYPE OF SCHOOL FOR THE POPULATION 3 YEARS AND OVER
Source: Data Set: Census 2000 Summary File 3 (SF 3) - Sample Data - P146B. HOUSEHOLDS BY AGE OF HOUSEHOLDER BY HOUSEHOLD TYPE (INCLUDING LIVING ALONE) BY PRESENCE OF OWN CHILDREN UNDER 18 YEARS (BLACK OR AFRICAN AMERICAN ALONE HOUSEHOLDER) [31] - Universe: Households with a householder who is Black or African American alone; P146I. HOUSEHOLDS BY AGE OF HOUSEHOLDER BY HOUSEHOLD TYPE (INCLUDING LIVING ALONE) BY PRESENCE OF OWN CHILDREN UNDER 18 YEARS (WHITE ALONE, NOT HISPANIC OR LATINO HOUSEHOLDER) [31] - Universe: Households with a householder who is White alone, not Hispanic or Latino.
African American White, Not Hispanic
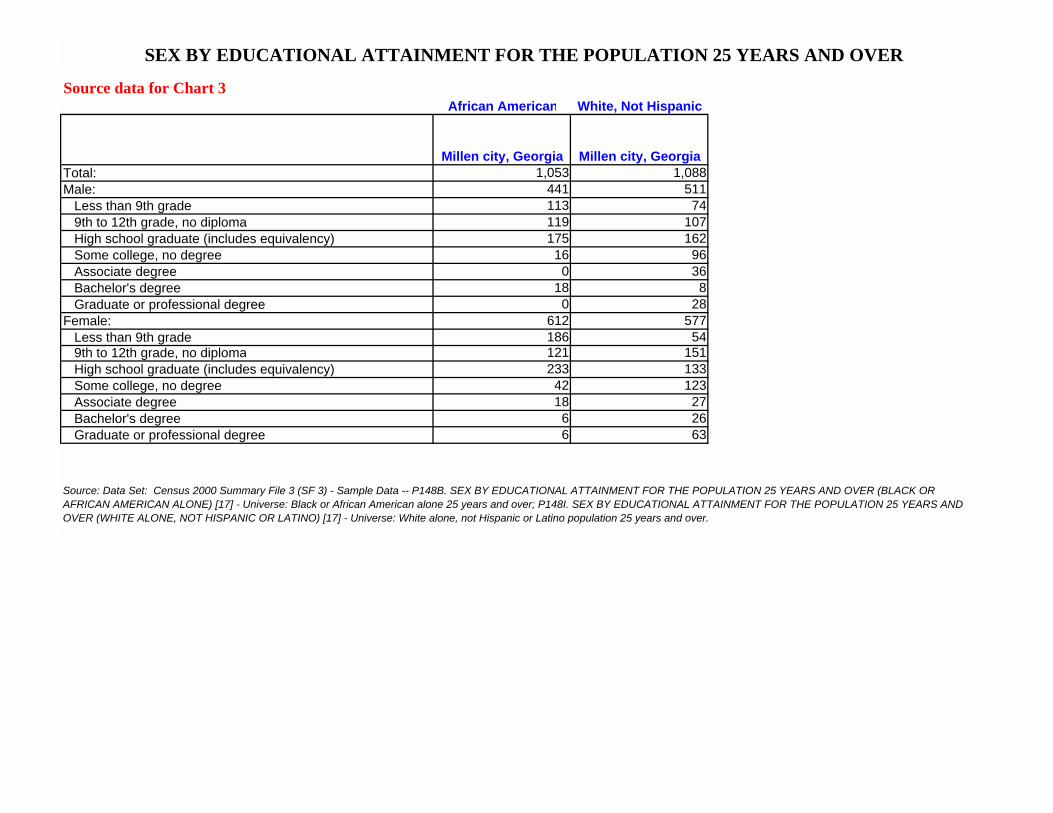
Millen city, Georgia Millen city, GeorgiaTotal: 1,053 1,088Male: 441 511
Less than 9th grade 113 749th to 12th grade, no diploma 119 107High school graduate (includes equivalency) 175 162Some college, no degree 16 96Associate degree 0 36Bachelor's degree 18 8Graduate or professional degree 0 28
Female: 612 577Less than 9th grade 186 549th to 12th grade, no diploma 121 151High school graduate (includes equivalency) 233 133Some college, no degree 42 123Associate degree 18 27Bachelor's degree 6 26Graduate or professional degree 6 63
Source: Data Set: Census 2000 Summary File 3 (SF 3) - Sample Data -- P148B. SEX BY EDUCATIONAL ATTAINMENT FOR THE POPULATION 25 YEARS AND OVER (BLACK OR AFRICAN AMERICAN ALONE) [17] - Universe: Black or African American alone 25 years and over; P148I. SEX BY EDUCATIONAL ATTAINMENT FOR THE POPULATION 25 YEARS AND OVER (WHITE ALONE, NOT HISPANIC OR LATINO) [17] - Universe: White alone, not Hispanic or Latino population 25 years and over.
SEX BY EDUCATIONAL ATTAINMENT FOR THE POPULATION 25 YEARS AND OVER
Source data for Chart 3
African American White, Not Hispanic
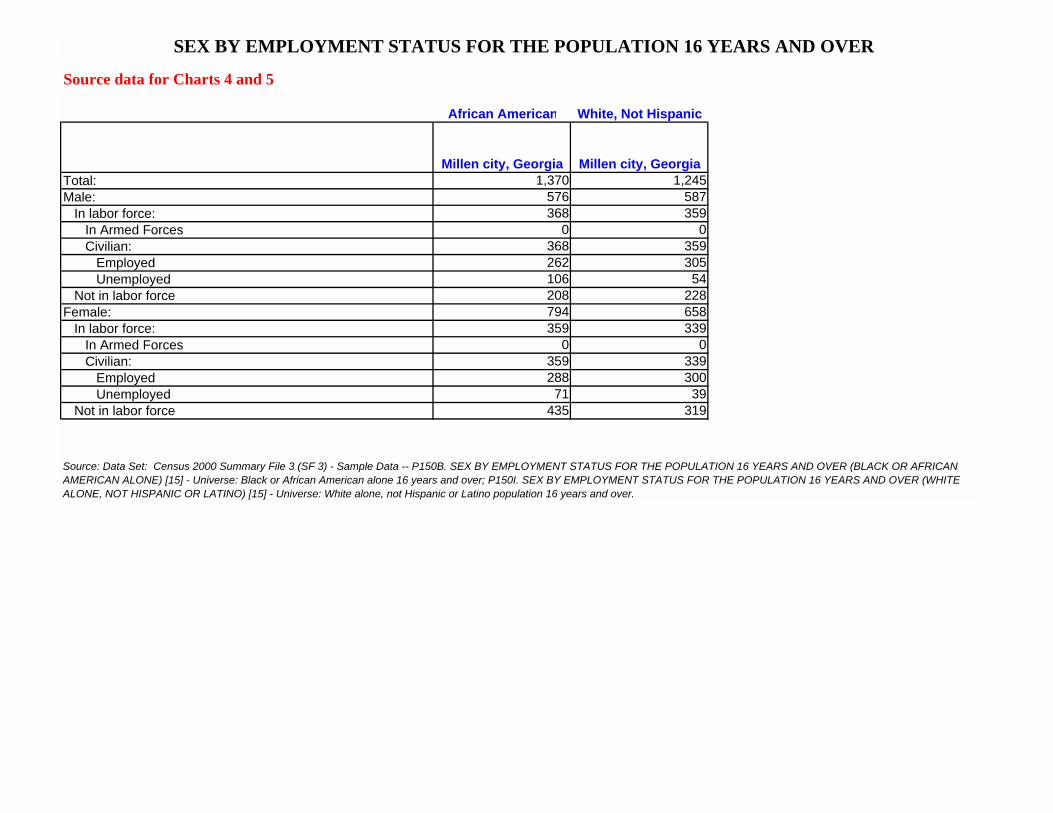
Millen city, Georgia Millen city, GeorgiaTotal: 1,370 1,245Male: 576 587
In labor force: 368 359In Armed Forces 0 0Civilian: 368 359
Employed 262 305Unemployed 106 54
Not in labor force 208 228Female: 794 658
In labor force: 359 339In Armed Forces 0 0Civilian: 359 339
Employed 288 300Unemployed 71 39
Not in labor force 435 319
SEX BY EMPLOYMENT STATUS FOR THE POPULATION 16 YEARS AND OVER
Source data for Charts 4 and 5
Source: Data Set: Census 2000 Summary File 3 (SF 3) - Sample Data -- P150B. SEX BY EMPLOYMENT STATUS FOR THE POPULATION 16 YEARS AND OVER (BLACK OR AFRICAN AMERICAN ALONE) [15] - Universe: Black or African American alone 16 years and over; P150I. SEX BY EMPLOYMENT STATUS FOR THE POPULATION 16 YEARS AND OVER (WHITE ALONE, NOT HISPANIC OR LATINO) [15] - Universe: White alone, not Hispanic or Latino population 16 years and over.
African American White, Not Hispanic
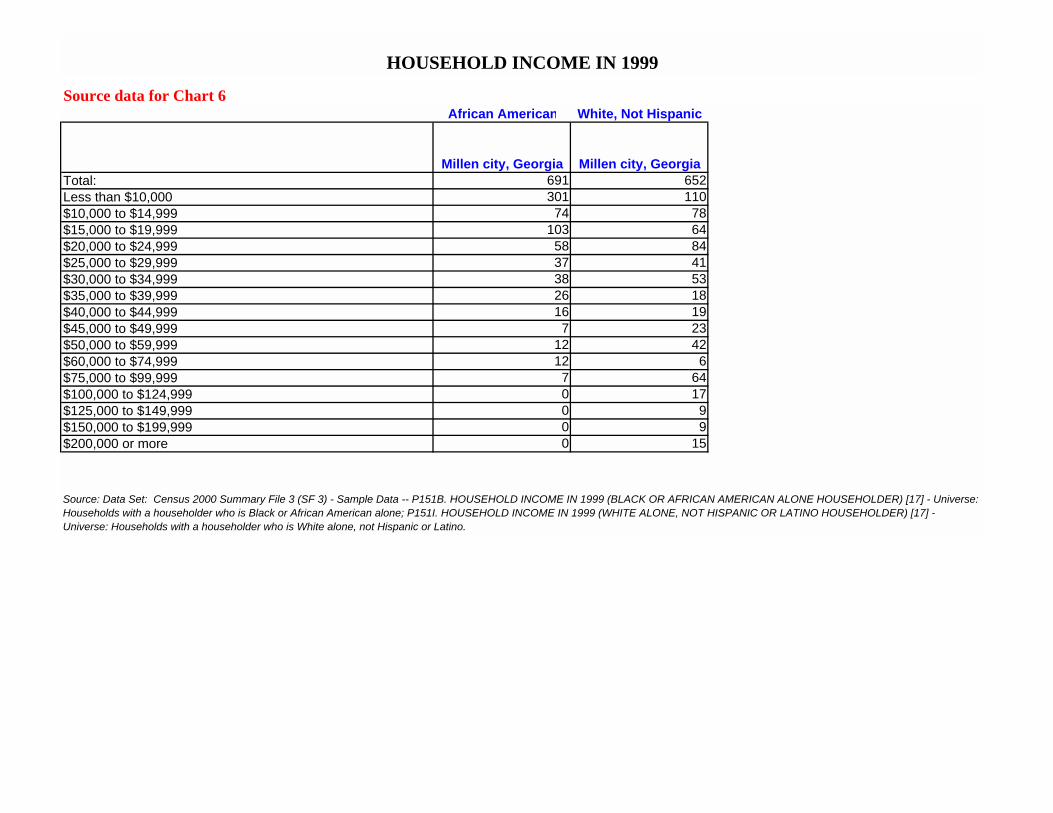
Millen city, Georgia Millen city, GeorgiaTotal: 691 652Less than $10,000 301 110$10,000 to $14,999 74 78$15,000 to $19,999 103 64$20,000 to $24,999 58 84$25,000 to $29,999 37 41$30,000 to $34,999 38 53$35,000 to $39,999 26 18$40,000 to $44,999 16 19$45,000 to $49,999 7 23$50,000 to $59,999 12 42$60,000 to $74,999 12 6$75,000 to $99,999 7 64$100,000 to $124,999 0 17$125,000 to $149,999 0 9$150,000 to $199,999 0 9$200,000 or more 0 15
HOUSEHOLD INCOME IN 1999
Source data for Chart 6
Source: Data Set: Census 2000 Summary File 3 (SF 3) - Sample Data -- P151B. HOUSEHOLD INCOME IN 1999 (BLACK OR AFRICAN AMERICAN ALONE HOUSEHOLDER) [17] - Universe: Households with a householder who is Black or African American alone; P151I. HOUSEHOLD INCOME IN 1999 (WHITE ALONE, NOT HISPANIC OR LATINO HOUSEHOLDER) [17] - Universe: Households with a householder who is White alone, not Hispanic or Latino.
African American White, Not Hispanic
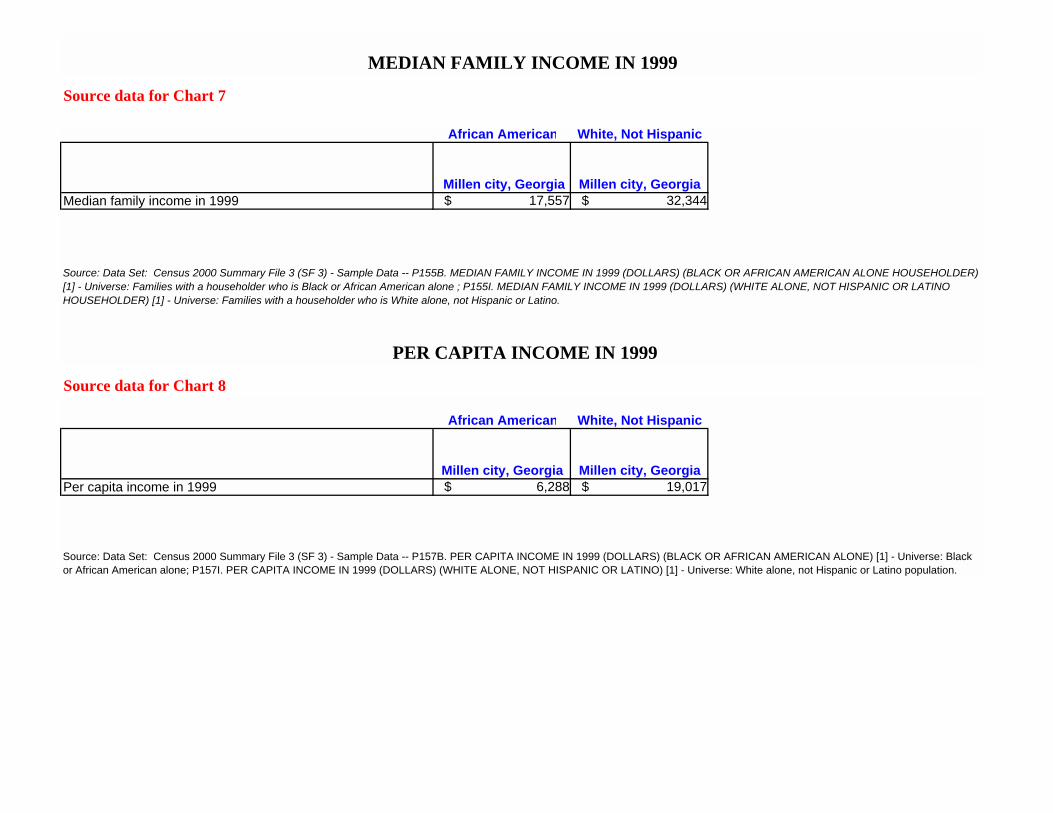
Millen city, Georgia Millen city, GeorgiaMedian family income in 1999 $ 17,557 $ 32,344
African American White, Not Hispanic
Millen city, Georgia Millen city, GeorgiaPer capita income in 1999 $ 6,288 $ 19,017
Source data for Chart 8
Source: Data Set: Census 2000 Summary File 3 (SF 3) - Sample Data -- P157B. PER CAPITA INCOME IN 1999 (DOLLARS) (BLACK OR AFRICAN AMERICAN ALONE) [1] - Universe: Black or African American alone; P157I. PER CAPITA INCOME IN 1999 (DOLLARS) (WHITE ALONE, NOT HISPANIC OR LATINO) [1] - Universe: White alone, not Hispanic or Latino population.
PER CAPITA INCOME IN 1999
MEDIAN FAMILY INCOME IN 1999
Source data for Chart 7
Source: Data Set: Census 2000 Summary File 3 (SF 3) - Sample Data -- P155B. MEDIAN FAMILY INCOME IN 1999 (DOLLARS) (BLACK OR AFRICAN AMERICAN ALONE HOUSEHOLDER) [1] - Universe: Families with a householder who is Black or African American alone ; P155I. MEDIAN FAMILY INCOME IN 1999 (DOLLARS) (WHITE ALONE, NOT HISPANIC OR LATINO HOUSEHOLDER) [1] - Universe: Families with a householder who is White alone, not Hispanic or Latino.
African American White, Not Hispanic
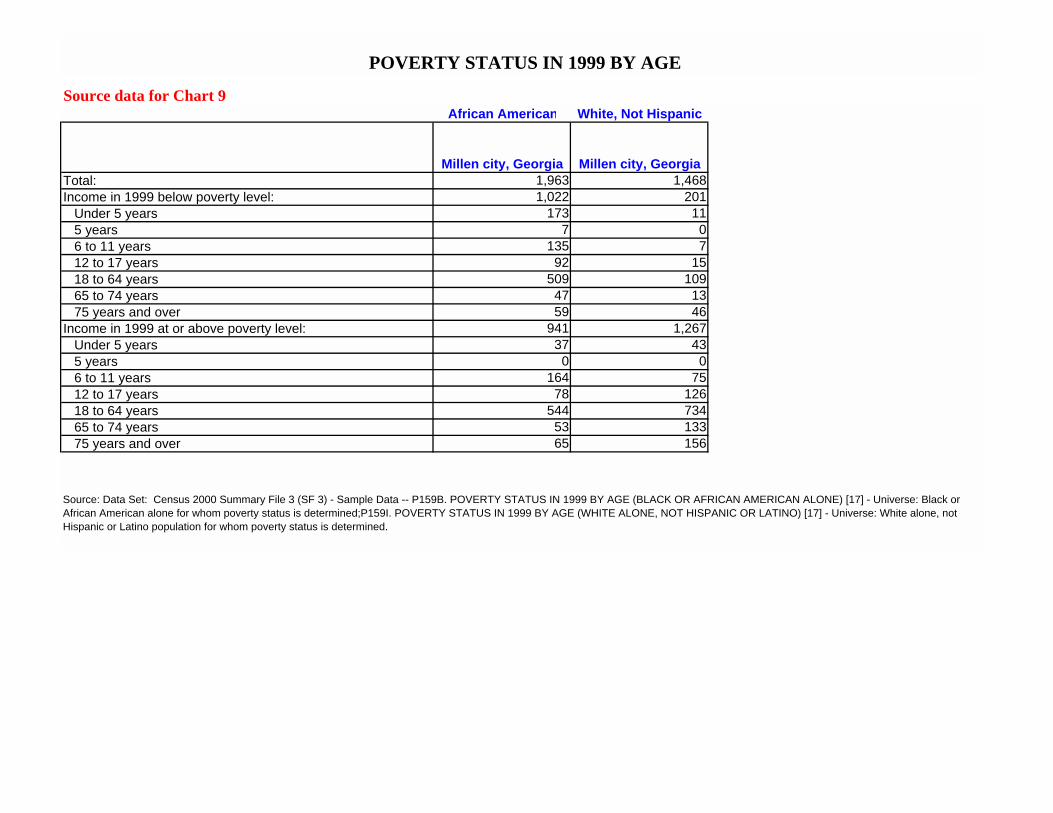
Millen city, Georgia Millen city, GeorgiaTotal: 1,963 1,468Income in 1999 below poverty level: 1,022 201
Under 5 years 173 115 years 7 06 to 11 years 135 712 to 17 years 92 1518 to 64 years 509 10965 to 74 years 47 1375 years and over 59 46
Income in 1999 at or above poverty level: 941 1,267Under 5 years 37 435 years 0 06 to 11 years 164 7512 to 17 years 78 12618 to 64 years 544 73465 to 74 years 53 13375 years and over 65 156
Source: Data Set: Census 2000 Summary File 3 (SF 3) - Sample Data -- P159B. POVERTY STATUS IN 1999 BY AGE (BLACK OR AFRICAN AMERICAN ALONE) [17] - Universe: Black or African American alone for whom poverty status is determined;P159I. POVERTY STATUS IN 1999 BY AGE (WHITE ALONE, NOT HISPANIC OR LATINO) [17] - Universe: White alone, not Hispanic or Latino population for whom poverty status is determined.
POVERTY STATUS IN 1999 BY AGE
Source data for Chart 9
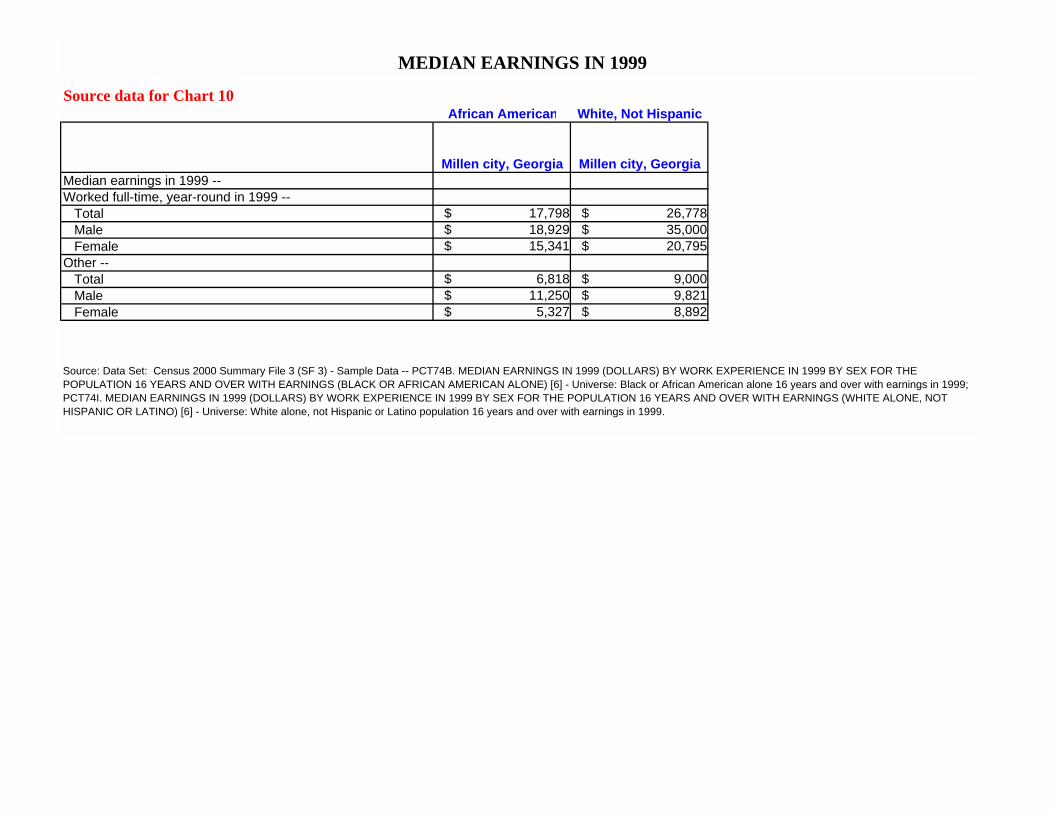
African American White, Not Hispanic
Millen city, Georgia Millen city, GeorgiaMedian earnings in 1999 --Worked full-time, year-round in 1999 --
Total $ 17,798 $ 26,778 Male $ 18,929 $ 35,000 Female $ 15,341 $ 20,795
Other --Total $ 6,818 $ 9,000 Male $ 11,250 $ 9,821 Female $ 5,327 $ 8,892
MEDIAN EARNINGS IN 1999
Source data for Chart 10
Source: Data Set: Census 2000 Summary File 3 (SF 3) - Sample Data -- PCT74B. MEDIAN EARNINGS IN 1999 (DOLLARS) BY WORK EXPERIENCE IN 1999 BY SEX FOR THE POPULATION 16 YEARS AND OVER WITH EARNINGS (BLACK OR AFRICAN AMERICAN ALONE) [6] - Universe: Black or African American alone 16 years and over with earnings in 1999; PCT74I. MEDIAN EARNINGS IN 1999 (DOLLARS) BY WORK EXPERIENCE IN 1999 BY SEX FOR THE POPULATION 16 YEARS AND OVER WITH EARNINGS (WHITE ALONE, NOT HISPANIC OR LATINO) [6] - Universe: White alone, not Hispanic or Latino population 16 years and over with earnings in 1999.
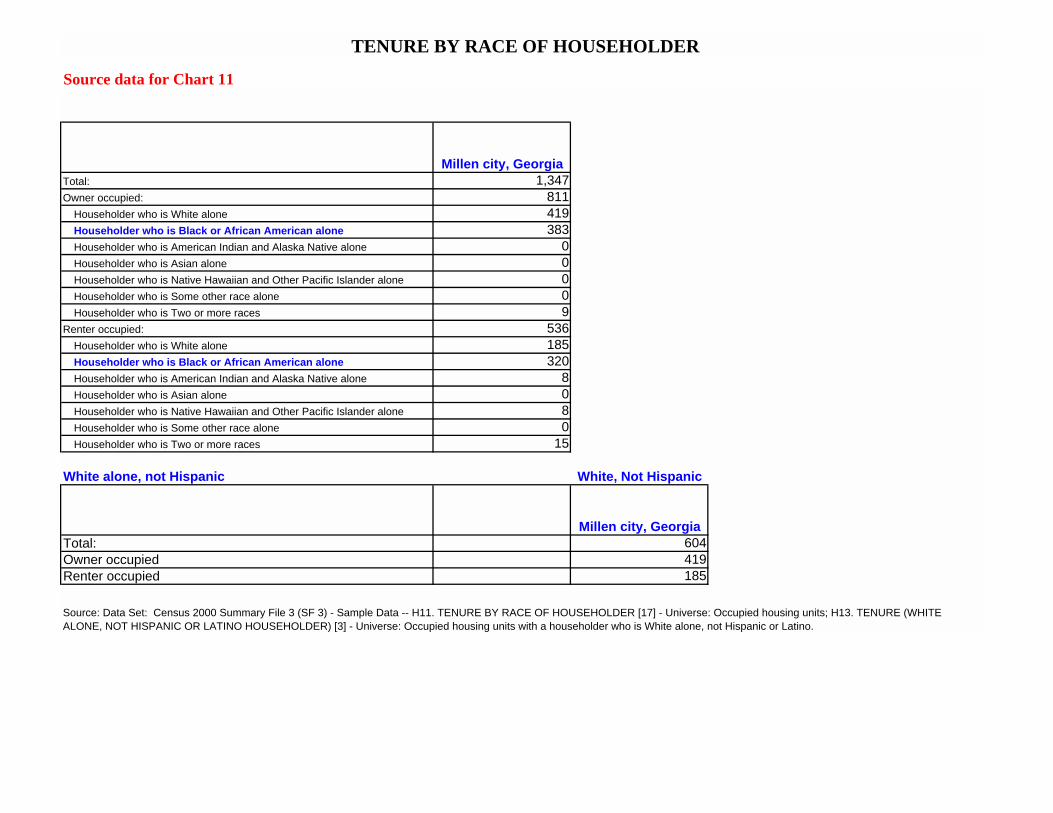
Millen city, GeorgiaTotal: 1,347Owner occupied: 811
Householder who is White alone 419Householder who is Black or African American alone 383Householder who is American Indian and Alaska Native alone 0Householder who is Asian alone 0Householder who is Native Hawaiian and Other Pacific Islander alone 0Householder who is Some other race alone 0Householder who is Two or more races 9
Renter occupied: 536Householder who is White alone 185Householder who is Black or African American alone 320Householder who is American Indian and Alaska Native alone 8Householder who is Asian alone 0Householder who is Native Hawaiian and Other Pacific Islander alone 8Householder who is Some other race alone 0Householder who is Two or more races 15
White alone, not Hispanic White, Not Hispanic
Millen city, GeorgiaTotal: 604Owner occupied 419Renter occupied 185
TENURE BY RACE OF HOUSEHOLDER
Source data for Chart 11
Source: Data Set: Census 2000 Summary File 3 (SF 3) - Sample Data -- H11. TENURE BY RACE OF HOUSEHOLDER [17] - Universe: Occupied housing units; H13. TENURE (WHITE ALONE, NOT HISPANIC OR LATINO HOUSEHOLDER) [3] - Universe: Occupied housing units with a householder who is White alone, not Hispanic or Latino.

African American White, Not Hispanic
Millen city, Georgia Millen city, GeorgiaTotal: 703 6041.00 or less occupants per room 619 5891.01 or more occupants per room 84 15
African American White, Not Hispanic
Millen city, Georgia Millen city, GeorgiaTotal: 703 604With telephone service available 532 577No telephone service available 171 27
OCCUPANTS PER ROOM
Source data for Chart 12
Source: Data Set: Census 2000 Summary File 3 (SF 3) - Sample Data -- HCT29B. OCCUPANTS PER ROOM (BLACK OR AFRICAN AMERICAN ALONE HOUSEHOLDER) [3] - Universe: Occupied housing units with a householder who is Black or African American alone; HCT29I. OCCUPANTS PER ROOM (WHITE ALONE, NOT HISPANIC OR LATINO HOUSEHOLDER) [3] - Universe: Occupied housing units with a householder who is White alone, not Hispanic or Latino.
Source: Data Set: Census 2000 Summary File 3 (SF 3) - Sample Data -- HCT32B. TELEPHONE SERVICE AVAILABLE (BLACK OR AFRICAN AMERICAN ALONE HOUSEHOLDER) [3] - Universe: Occupied housing units with a householder who is Black or African American alone; HCT32I. TELEPHONE SERVICE AVAILABLE (WHITE ALONE, NOT HISPANIC OR LATINO HOUSEHOLDER) [3] - Universe: Occupied housing units with a householder who is White alone, not Hispanic or Latino.
TELEPHONE SERVICE AVAILABLE
Source data for Chart 13
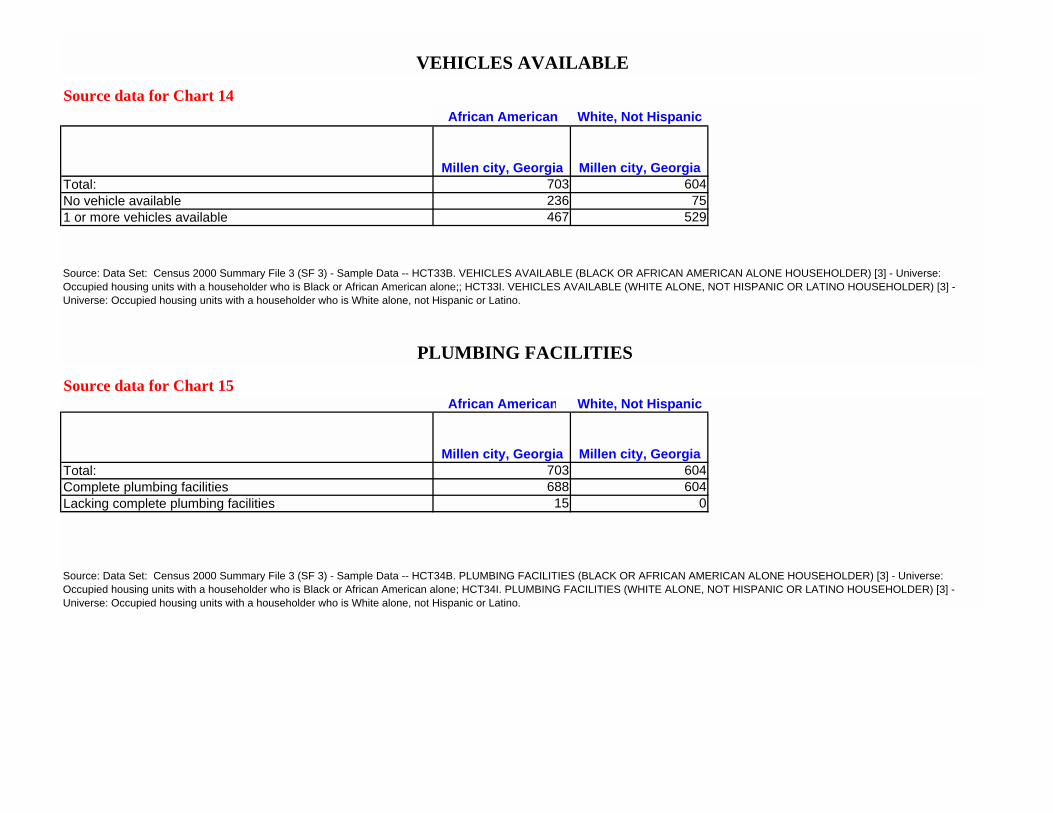
African American White, Not Hispanic
Millen city, Georgia Millen city, GeorgiaTotal: 703 604No vehicle available 236 751 or more vehicles available 467 529
African American White, Not Hispanic
Millen city, Georgia Millen city, GeorgiaTotal: 703 604Complete plumbing facilities 688 604Lacking complete plumbing facilities 15 0
Source data for Chart 15
Source: Data Set: Census 2000 Summary File 3 (SF 3) - Sample Data -- HCT34B. PLUMBING FACILITIES (BLACK OR AFRICAN AMERICAN ALONE HOUSEHOLDER) [3] - Universe: Occupied housing units with a householder who is Black or African American alone; HCT34I. PLUMBING FACILITIES (WHITE ALONE, NOT HISPANIC OR LATINO HOUSEHOLDER) [3] - Universe: Occupied housing units with a householder who is White alone, not Hispanic or Latino.
VEHICLES AVAILABLE
Source data for Chart 14
Source: Data Set: Census 2000 Summary File 3 (SF 3) - Sample Data -- HCT33B. VEHICLES AVAILABLE (BLACK OR AFRICAN AMERICAN ALONE HOUSEHOLDER) [3] - Universe: Occupied housing units with a householder who is Black or African American alone;; HCT33I. VEHICLES AVAILABLE (WHITE ALONE, NOT HISPANIC OR LATINO HOUSEHOLDER) [3] - Universe: Occupied housing units with a householder who is White alone, not Hispanic or Latino.
PLUMBING FACILITIES

African American White, Not Hispanic
Millen city, Georgia Millen city, GeorgiaTotal: 312 178Less than 10 percent 16 3510 to 14 percent 28 2715 to 19 percent 27 3720 to 24 percent 38 1325 to 29 percent 31 2830 to 34 percent 19 535 to 39 percent 7 640 to 49 percent 10 050 percent or more 81 27Not computed 55 0
Source data for Chart 16
Source: Data Set: Census 2000 Summary File 3 (SF 3) - Sample Data -- HCT39B. GROSS RENT AS A PERCENTAGE OF HOUSEHOLD INCOME IN 1999 (BLACK OR AFRICAN AMERICAN ALONE HOUSEHOLDER) [11] - Universe: Specified renter-occupied housing units with a householder who is Black or African American alone; HCT39I. GROSS RENT AS A PERCENTAGE OF HOUSEHOLD INCOME IN 1999 (WHITE ALONE, NOT HISPANIC OR LATINO HOUSEHOLDER) [11] - Universe: Specified renter-occupied housing units with a householder who is White alone, not Hispanic or Latino.
GROSS RENT AS A PERCENTAGE OF HOUSEHOLD INCOME IN 1999
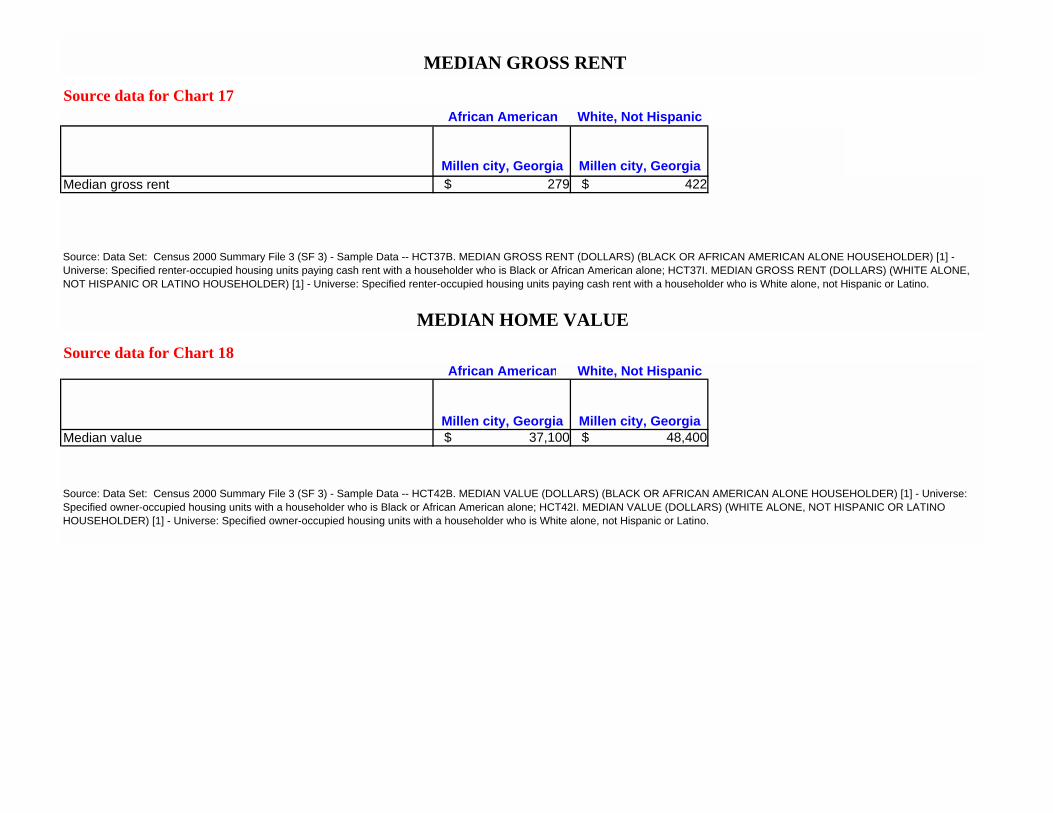
African American White, Not Hispanic
Millen city, Georgia Millen city, GeorgiaMedian gross rent $ 279 $ 422
African American White, Not Hispanic
Millen city, Georgia Millen city, GeorgiaMedian value $ 37,100 $ 48,400
Source: Data Set: Census 2000 Summary File 3 (SF 3) - Sample Data -- HCT42B. MEDIAN VALUE (DOLLARS) (BLACK OR AFRICAN AMERICAN ALONE HOUSEHOLDER) [1] - Universe: Specified owner-occupied housing units with a householder who is Black or African American alone; HCT42I. MEDIAN VALUE (DOLLARS) (WHITE ALONE, NOT HISPANIC OR LATINO HOUSEHOLDER) [1] - Universe: Specified owner-occupied housing units with a householder who is White alone, not Hispanic or Latino.
MEDIAN HOME VALUE
Source data for Chart 18
Source: Data Set: Census 2000 Summary File 3 (SF 3) - Sample Data -- HCT37B. MEDIAN GROSS RENT (DOLLARS) (BLACK OR AFRICAN AMERICAN ALONE HOUSEHOLDER) [1] - Universe: Specified renter-occupied housing units paying cash rent with a householder who is Black or African American alone; HCT37I. MEDIAN GROSS RENT (DOLLARS) (WHITE ALONE, NOT HISPANIC OR LATINO HOUSEHOLDER) [1] - Universe: Specified renter-occupied housing units paying cash rent with a householder who is White alone, not Hispanic or Latino.
MEDIAN GROSS RENT
Source data for Chart 17