Select Trends in High Skilled Migration: Human Mobility in ... · PDF fileSelect Trends in...
21
Select Trends in High Skilled Migration: Human Mobility in a Regional and Australian Context Lesleyanne Hawthorne Professor – International Workforce Mobility Symposium 2016 Australian National University Canberra 21-22 March 2016
Transcript of Select Trends in High Skilled Migration: Human Mobility in ... · PDF fileSelect Trends in...
Select Trends in High Skilled Migration:
Human Mobility in a Regional and Australian Context
Lesleyanne Hawthorne
Professor – International Workforce
Mobility Symposium 2016
Australian National University
Canberra
21-22 March 2016
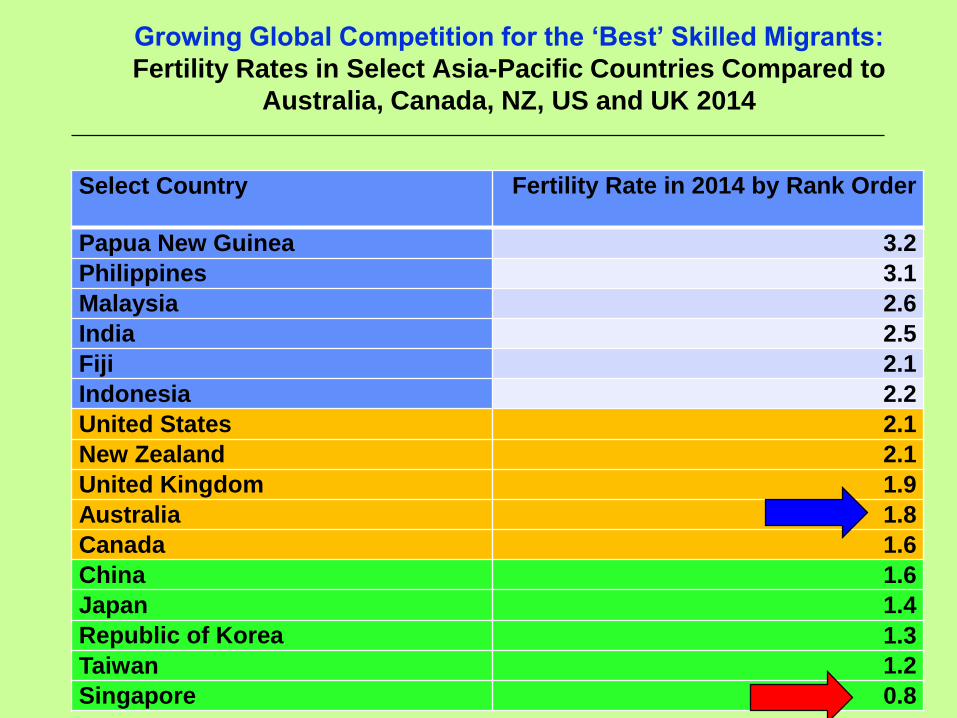
Growing Global Competition for the ‘Best’ Skilled Migrants:
Fertility Rates in Select Asia-Pacific Countries Compared to
Australia, Canada, NZ, US and UK 2014
Select Country Fertility Rate in 2014 by Rank Order
Papua New Guinea 3.2
Philippines 3.1
Malaysia 2.6
India 2.5
Fiji 2.1
Indonesia 2.2
United States 2.1
New Zealand 2.1
United Kingdom 1.9
Australia 1.8
Canada 1.6
China 1.6
Japan 1.4
Republic of Korea 1.3
Taiwan 1.2
Singapore 0.8
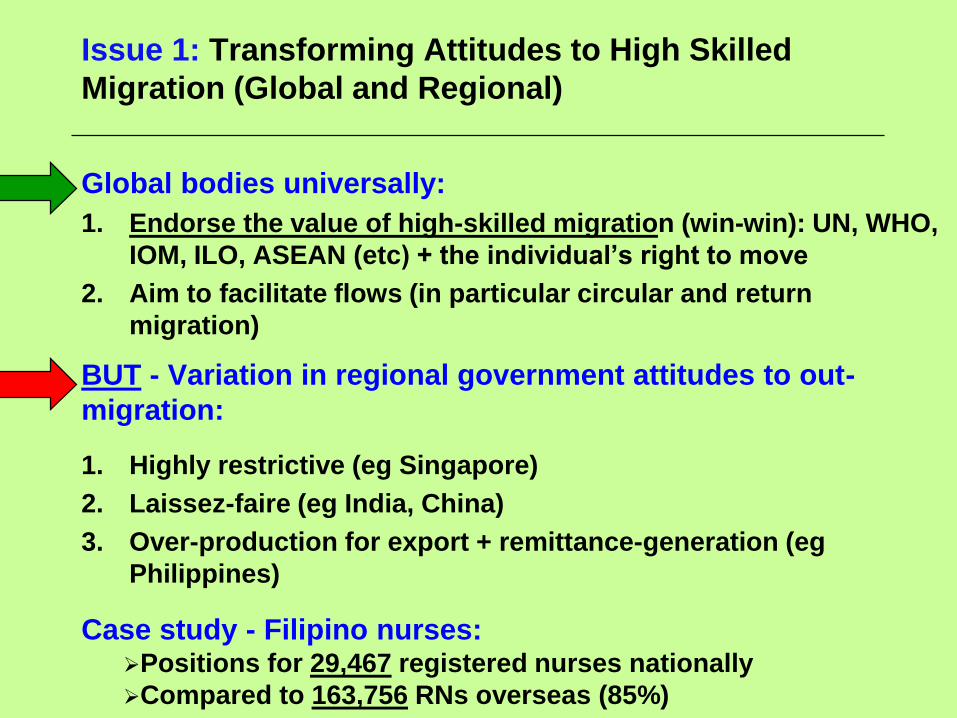
Issue 1: Transforming Attitudes to High Skilled
Migration (Global and Regional)
Global bodies universally:
1. Endorse the value of high-skilled migration (win-win): UN, WHO,
IOM, ILO, ASEAN (etc) + the individual’s right to move
2. Aim to facilitate flows (in particular circular and return
migration)
BUT - Variation in regional government attitudes to out-
migration:
1. Highly restrictive (eg Singapore)
2. Laissez-faire (eg India, China)
3. Over-production for export + remittance-generation (eg
Philippines)
Case study - Filipino nurses: Positions for 29,467 registered nurses nationally
Compared to 163,756 RNs overseas (85%)
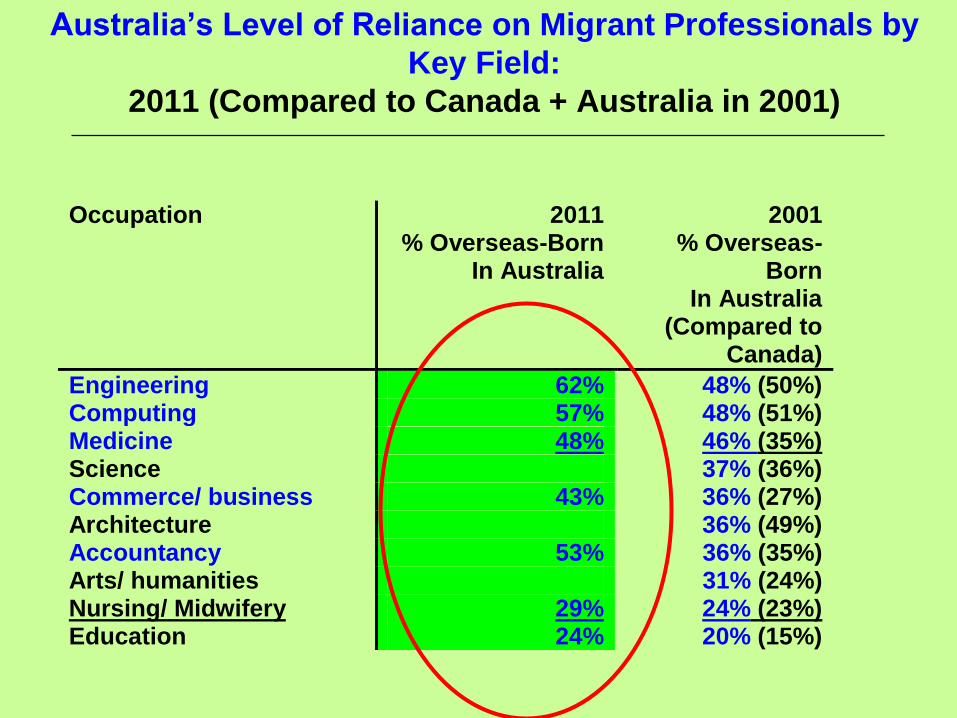
Australia’s Level of Reliance on Migrant Professionals by
Key Field:
2011 (Compared to Canada + Australia in 2001)
Occupation 2011 % Overseas-Born
In Australia
2001 % Overseas-
Born In Australia
(Compared to Canada)
Engineering 62% 48% (50%) Computing 57% 48% (51%) Medicine 48% 46% (35%) Science 37% (36%) Commerce/ business 43% 36% (27%) Architecture 36% (49%) Accountancy 53% 36% (35%) Arts/ humanities 31% (24%) Nursing/ Midwifery 29% 24% (23%) Education 24% 20% (15%)
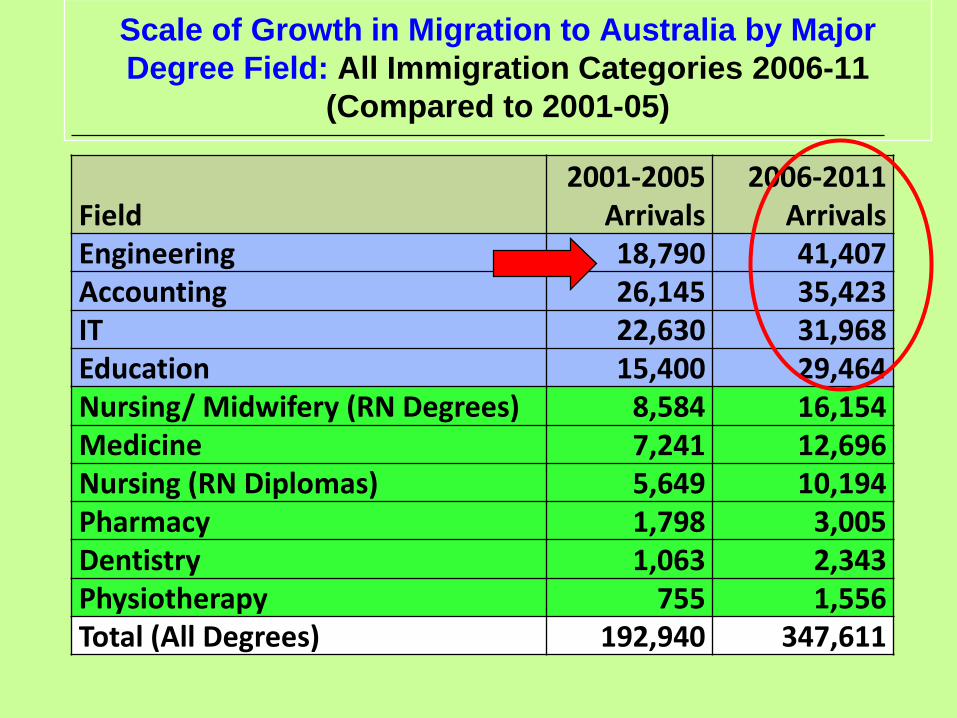
Scale of Growth in Migration to Australia by Major
Degree Field: All Immigration Categories 2006-11
(Compared to 2001-05)
Field2001-2005
Arrivals2006-2011
ArrivalsEngineering 18,790 41,407Accounting 26,145 35,423IT 22,630 31,968Education 15,400 29,464Nursing/ Midwifery (RN Degrees) 8,584 16,154Medicine 7,241 12,696Nursing (RN Diplomas) 5,649 10,194Pharmacy 1,798 3,005Dentistry 1,063 2,343Physiotherapy 755 1,556Total (All Degrees) 192,940 347,611
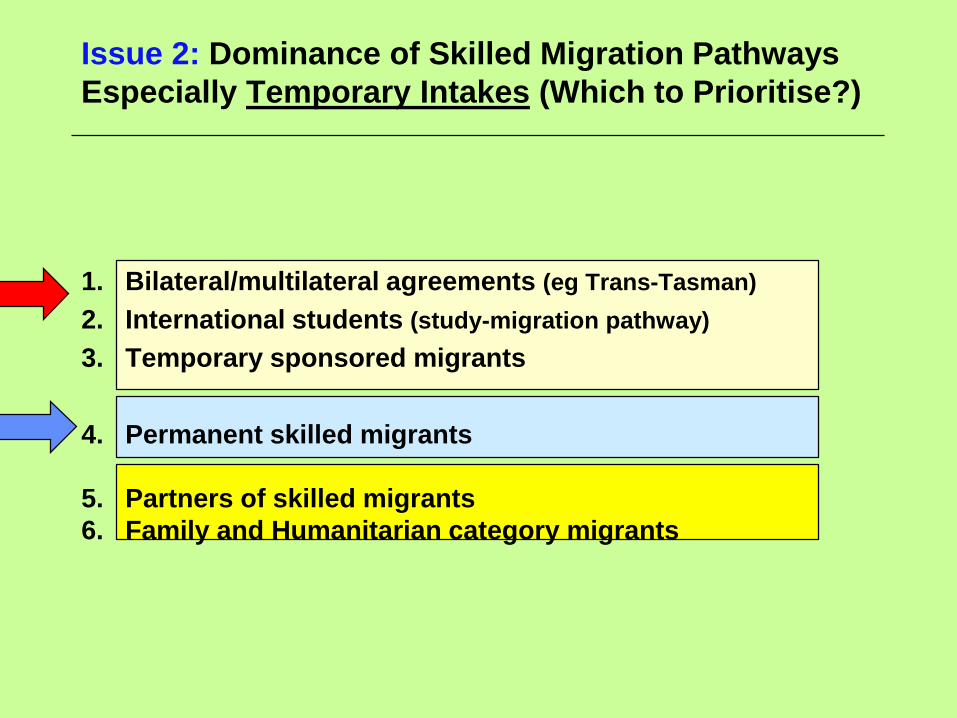
1. Bilateral/multilateral agreements (eg Trans-Tasman)
2. International students (study-migration pathway)
3. Temporary sponsored migrants
4. Permanent skilled migrants
5. Partners of skilled migrants
6. Family and Humanitarian category migrants
Issue 2: Dominance of Skilled Migration Pathways
Especially Temporary Intakes (Which to Prioritise?)
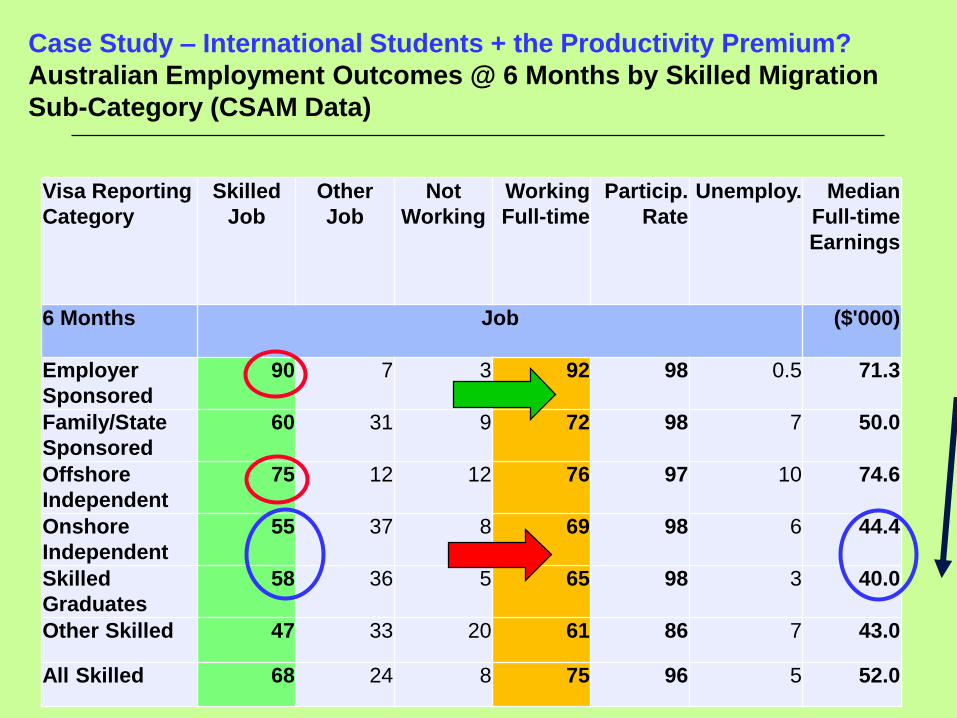
Case Study – International Students + the Productivity Premium?
Australian Employment Outcomes @ 6 Months by Skilled Migration
Sub-Category (CSAM Data)
Visa Reporting
Category
Skilled
Job
Other
Job
Not
Working
Working
Full-time
Particip.
Rate
Unemploy. Median
Full-time
Earnings
6 Months Job ($'000)
Employer
Sponsored
90 7 3 92 98 0.5 71.3
Family/State
Sponsored
60 31 9 72 98 7 50.0
Offshore
Independent
75 12 12 76 97 10 74.6
Onshore
Independent
55 37 8 69 98 6 44.4
Skilled
Graduates
58 36 5 65 98 3 40.0
Other Skilled 47 33 20 61 86 7 43.0
All Skilled 68 24 8 75 96 5 52.0
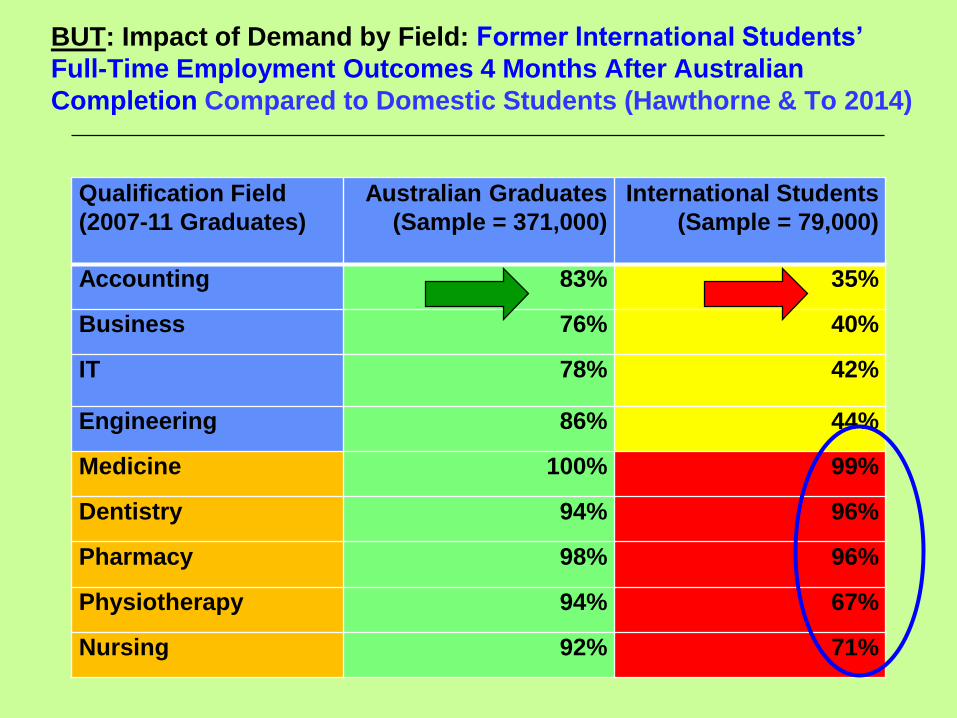
BUT: Impact of Demand by Field: Former International Students’
Full-Time Employment Outcomes 4 Months After Australian
Completion Compared to Domestic Students (Hawthorne & To 2014)
Qualification Field
(2007-11 Graduates)
Australian Graduates
(Sample = 371,000)
International Students
(Sample = 79,000)
Accounting 83% 35%
Business 76% 40%
IT 78% 42%
Engineering 86% 44%
Medicine 100% 99%
Dentistry 94% 96%
Pharmacy 98% 96%
Physiotherapy 94% 67%
Nursing 92% 71%
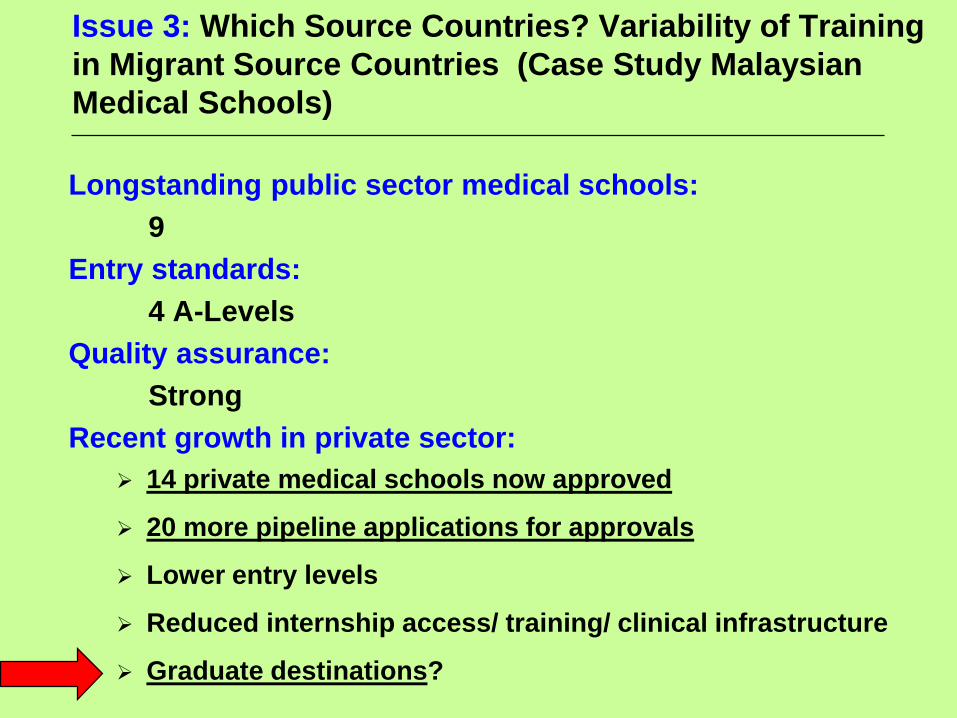
Issue 3: Which Source Countries? Variability of Training
in Migrant Source Countries (Case Study Malaysian
Medical Schools)
Longstanding public sector medical schools:
9
Entry standards:
4 A-Levels
Quality assurance:
Strong
Recent growth in private sector:
14 private medical schools now approved
20 more pipeline applications for approvals
Lower entry levels
Reduced internship access/ training/ clinical infrastructure
Graduate destinations?
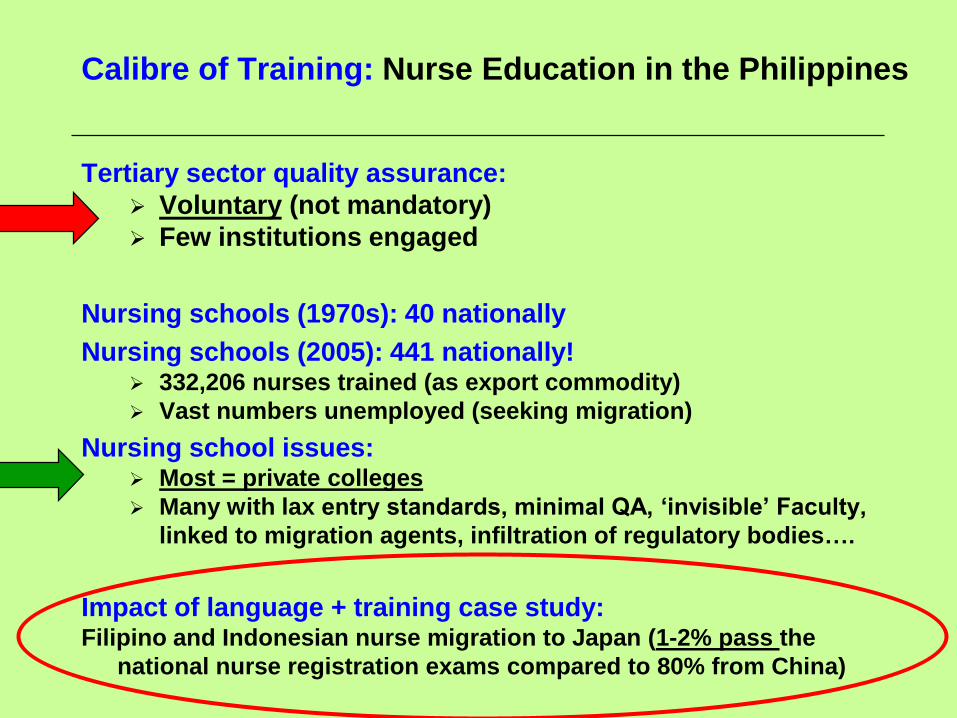
Calibre of Training: Nurse Education in the Philippines
Tertiary sector quality assurance:
Voluntary (not mandatory)
Few institutions engaged
Nursing schools (1970s): 40 nationally
Nursing schools (2005): 441 nationally! 332,206 nurses trained (as export commodity)
Vast numbers unemployed (seeking migration)
Nursing school issues: Most = private colleges
Many with lax entry standards, minimal QA, ‘invisible’ Faculty,
linked to migration agents, infiltration of regulatory bodies….
Impact of language + training case study: Filipino and Indonesian nurse migration to Japan (1-2% pass the
national nurse registration exams compared to 80% from China)
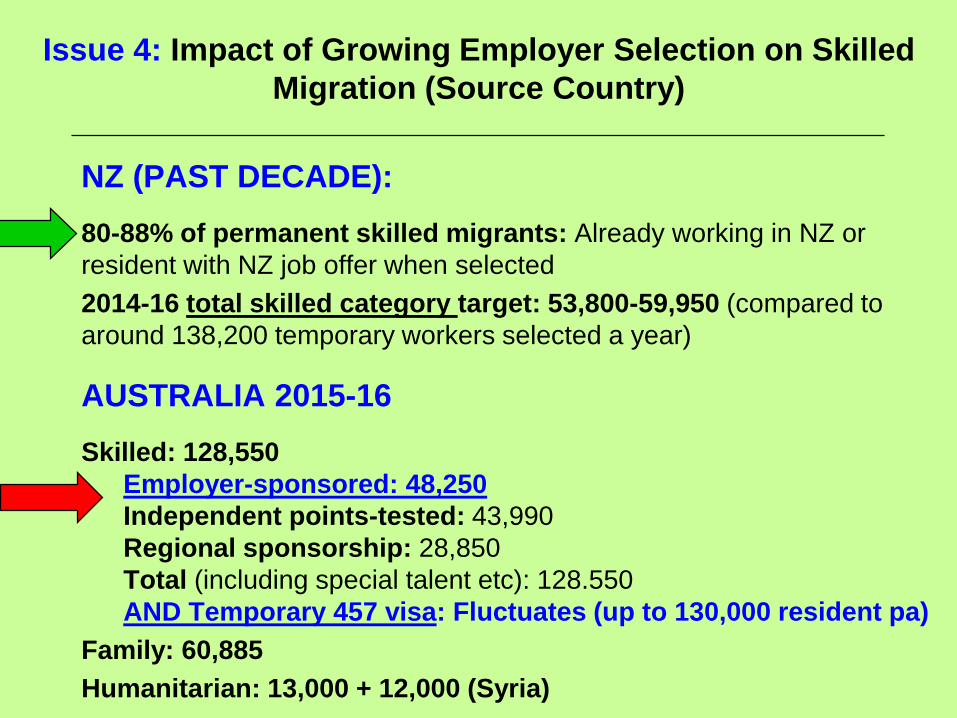
Issue 4: Impact of Growing Employer Selection on Skilled
Migration (Source Country)
NZ (PAST DECADE):
80-88% of permanent skilled migrants: Already working in NZ or
resident with NZ job offer when selected
2014-16 total skilled category target: 53,800-59,950 (compared to
around 138,200 temporary workers selected a year)
AUSTRALIA 2015-16
Skilled: 128,550
Employer-sponsored: 48,250
Independent points-tested: 43,990
Regional sponsorship: 28,850
Total (including special talent etc): 128.550
AND Temporary 457 visa: Fluctuates (up to 130,000 resident pa)
Family: 60,885
Humanitarian: 13,000 + 12,000 (Syria)
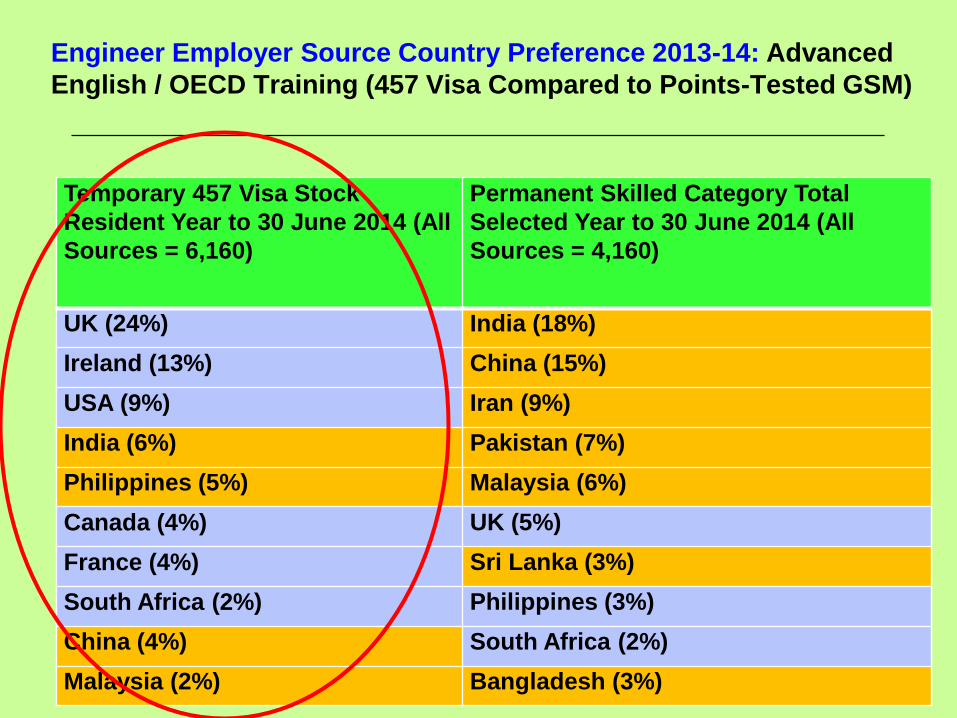
Engineer Employer Source Country Preference 2013-14: Advanced
English / OECD Training (457 Visa Compared to Points-Tested GSM)
Temporary 457 Visa Stock
Resident Year to 30 June 2014 (All
Sources = 6,160)
Permanent Skilled Category Total
Selected Year to 30 June 2014 (All
Sources = 4,160)
UK (24%) India (18%)
Ireland (13%) China (15%)
USA (9%) Iran (9%)
India (6%) Pakistan (7%)
Philippines (5%) Malaysia (6%)
Canada (4%) UK (5%)
France (4%) Sri Lanka (3%)
South Africa (2%) Philippines (3%)
China (4%) South Africa (2%)
Malaysia (2%) Bangladesh (3%)
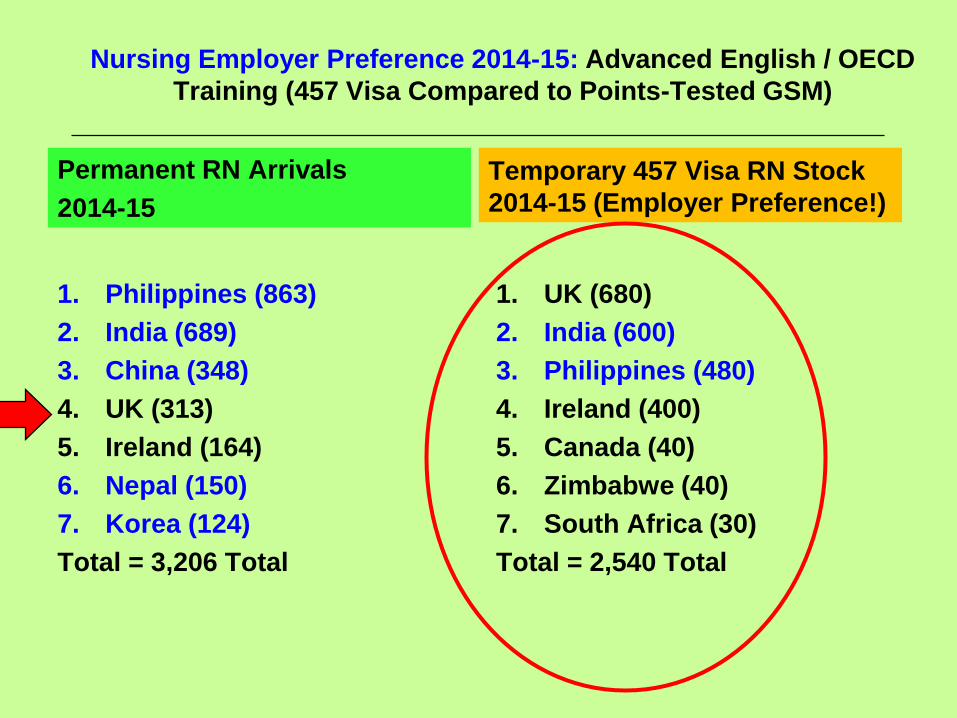
Nursing Employer Preference 2014-15: Advanced English / OECD
Training (457 Visa Compared to Points-Tested GSM)
Permanent RN Arrivals
2014-15
1. Philippines (863)
2. India (689)
3. China (348)
4. UK (313)
5. Ireland (164)
6. Nepal (150)
7. Korea (124)
Total = 3,206 Total
Temporary 457 Visa RN Stock
2014-15 (Employer Preference!)
1. UK (680)
2. India (600)
3. Philippines (480)
4. Ireland (400)
5. Canada (40)
6. Zimbabwe (40)
7. South Africa (30)
Total = 2,540 Total
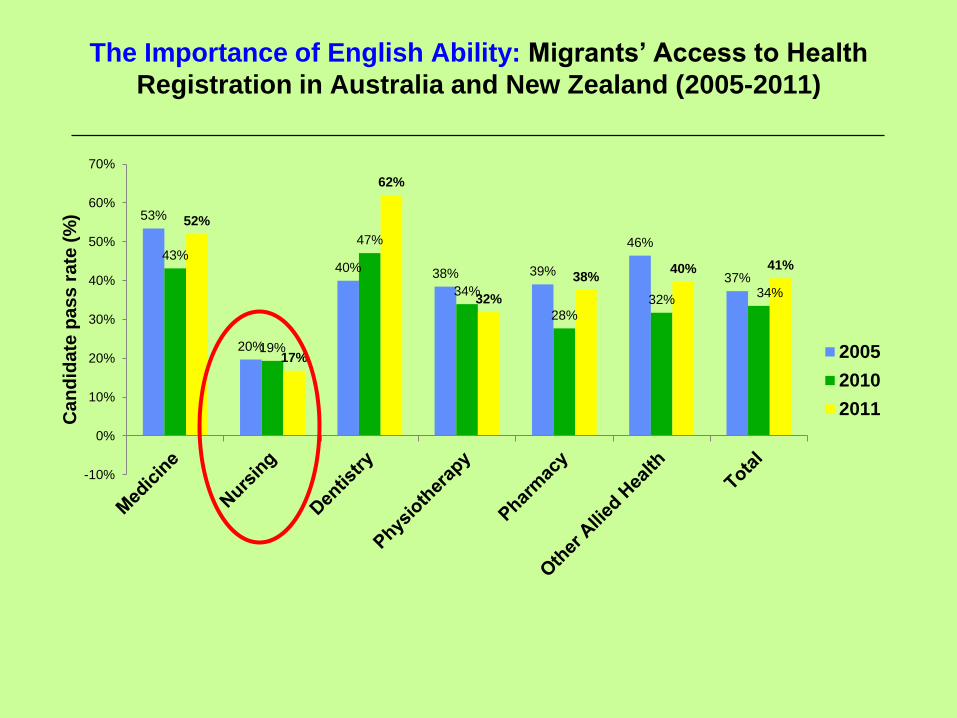
The Importance of English Ability: Migrants’ Access to Health
Registration in Australia and New Zealand (2005-2011)
53%
20%
40% 38% 39%
46%
37%
43%
19%
47%
34%
28%
32%34%
52%
17%
62%
32%
38%40% 41%
-10%
0%
10%
20%
30%
40%
50%
60%
70%
Ca
nd
ida
te p
as
s r
ate
(%
)
2005
2010
2011
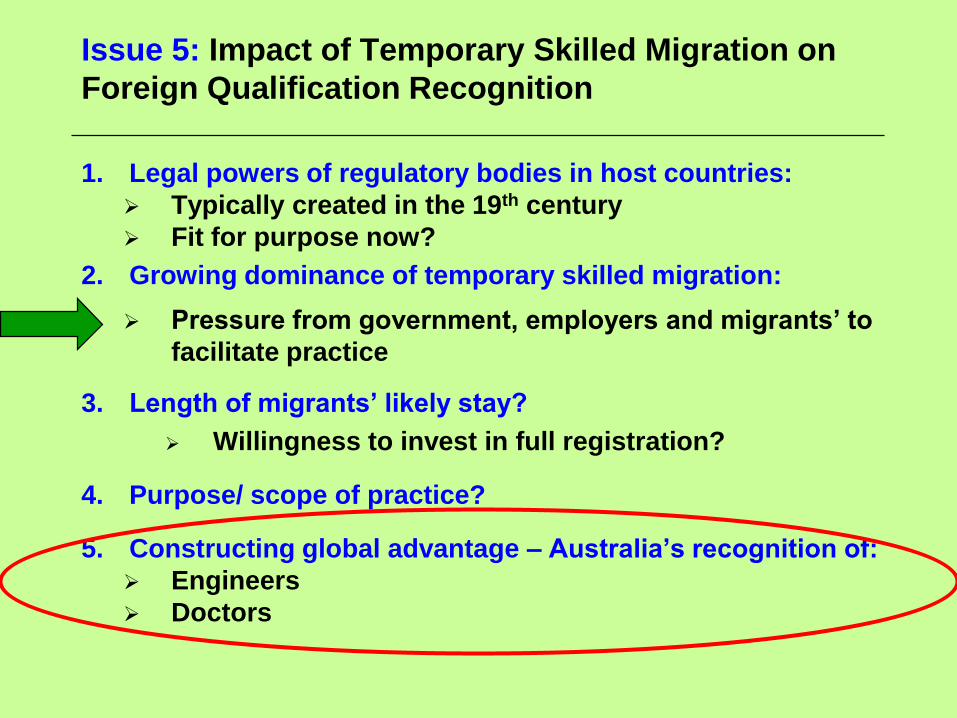
Issue 5: Impact of Temporary Skilled Migration on
Foreign Qualification Recognition
1. Legal powers of regulatory bodies in host countries:
Typically created in the 19th century
Fit for purpose now?
2. Growing dominance of temporary skilled migration:
Pressure from government, employers and migrants’ to
facilitate practice
3. Length of migrants’ likely stay?
Willingness to invest in full registration?
4. Purpose/ scope of practice?
5. Constructing global advantage – Australia’s recognition of:
Engineers
Doctors
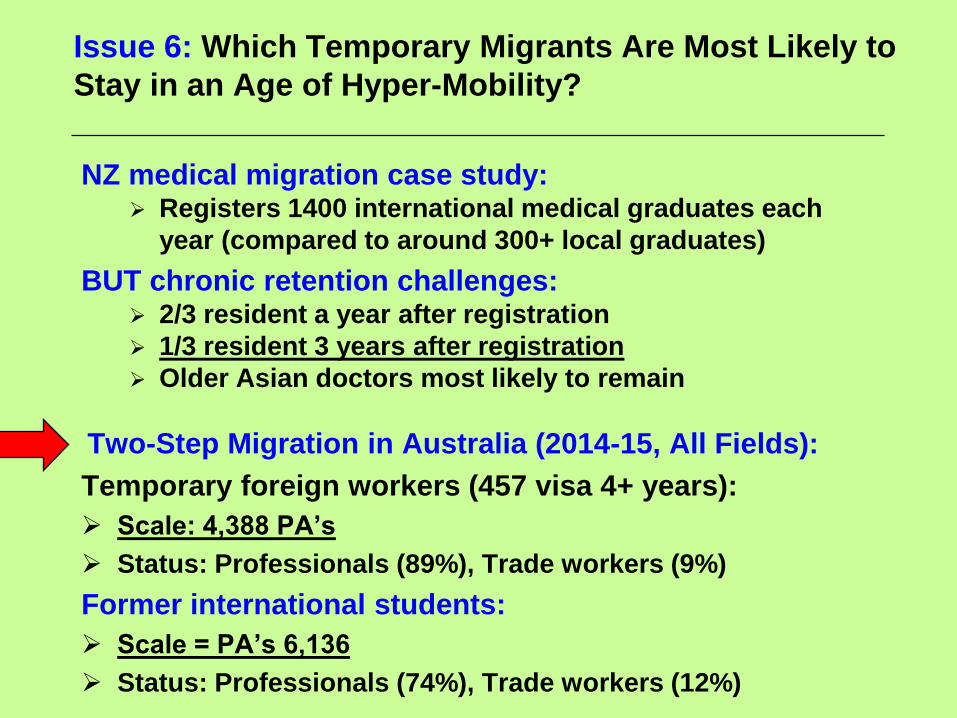
Issue 6: Which Temporary Migrants Are Most Likely to
Stay in an Age of Hyper-Mobility?
NZ medical migration case study: Registers 1400 international medical graduates each
year (compared to around 300+ local graduates)
BUT chronic retention challenges: 2/3 resident a year after registration
1/3 resident 3 years after registration
Older Asian doctors most likely to remain
Two-Step Migration in Australia (2014-15, All Fields):
Temporary foreign workers (457 visa 4+ years):
Scale: 4,388 PA’s
Status: Professionals (89%), Trade workers (9%)
Former international students:
Scale = PA’s 6,136
Status: Professionals (74%), Trade workers (12%)
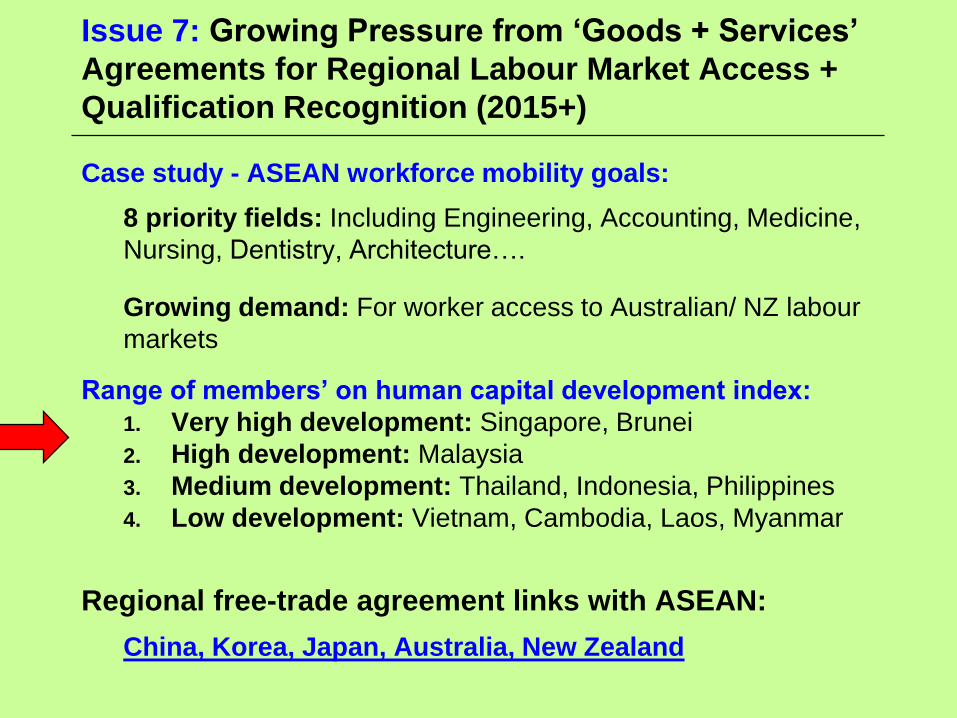
Issue 7: Growing Pressure from ‘Goods + Services’
Agreements for Regional Labour Market Access +
Qualification Recognition (2015+)
Case study - ASEAN workforce mobility goals:
8 priority fields: Including Engineering, Accounting, Medicine,
Nursing, Dentistry, Architecture….
Growing demand: For worker access to Australian/ NZ labour
markets
Range of members’ on human capital development index:
1. Very high development: Singapore, Brunei
2. High development: Malaysia
3. Medium development: Thailand, Indonesia, Philippines
4. Low development: Vietnam, Cambodia, Laos, Myanmar
Regional free-trade agreement links with ASEAN:
China, Korea, Japan, Australia, New Zealand
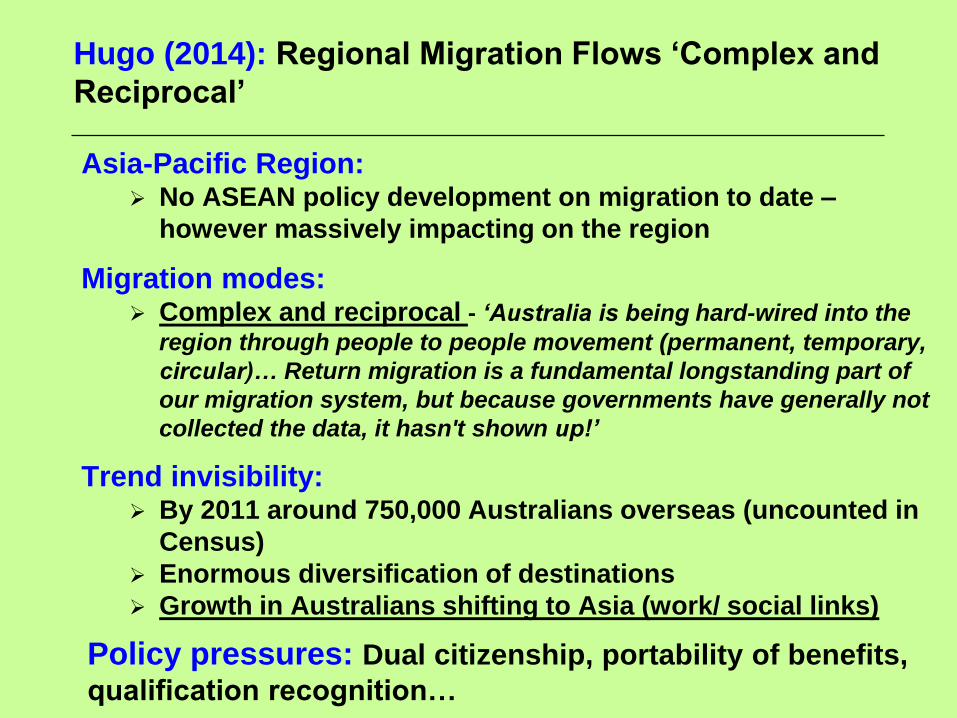
Hugo (2014): Regional Migration Flows ‘Complex and
Reciprocal’
Asia-Pacific Region: No ASEAN policy development on migration to date –
however massively impacting on the region
Migration modes: Complex and reciprocal - ‘Australia is being hard-wired into the
region through people to people movement (permanent, temporary,
circular)… Return migration is a fundamental longstanding part of
our migration system, but because governments have generally not
collected the data, it hasn't shown up!’
Trend invisibility: By 2011 around 750,000 Australians overseas (uncounted in
Census)
Enormous diversification of destinations
Growth in Australians shifting to Asia (work/ social links)
Policy pressures: Dual citizenship, portability of benefits,
qualification recognition…
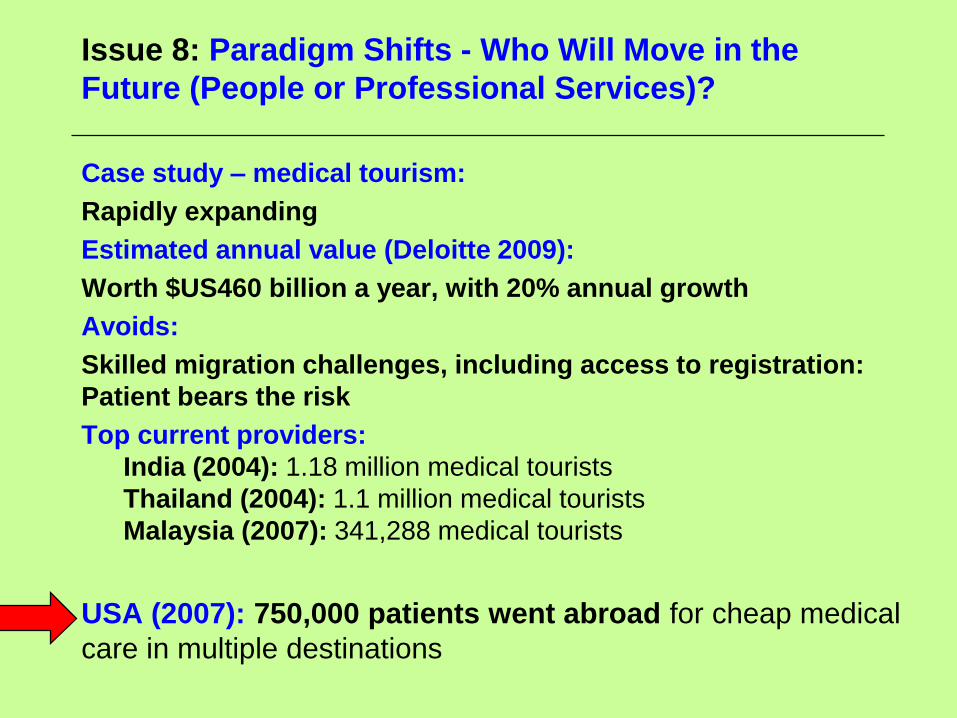
Issue 8: Paradigm Shifts - Who Will Move in the
Future (People or Professional Services)?
Case study – medical tourism:
Rapidly expanding
Estimated annual value (Deloitte 2009):
Worth $US460 billion a year, with 20% annual growth
Avoids:
Skilled migration challenges, including access to registration:
Patient bears the risk
Top current providers:
India (2004): 1.18 million medical tourists
Thailand (2004): 1.1 million medical tourists
Malaysia (2007): 341,288 medical tourists
USA (2007): 750,000 patients went abroad for cheap medical
care in multiple destinations
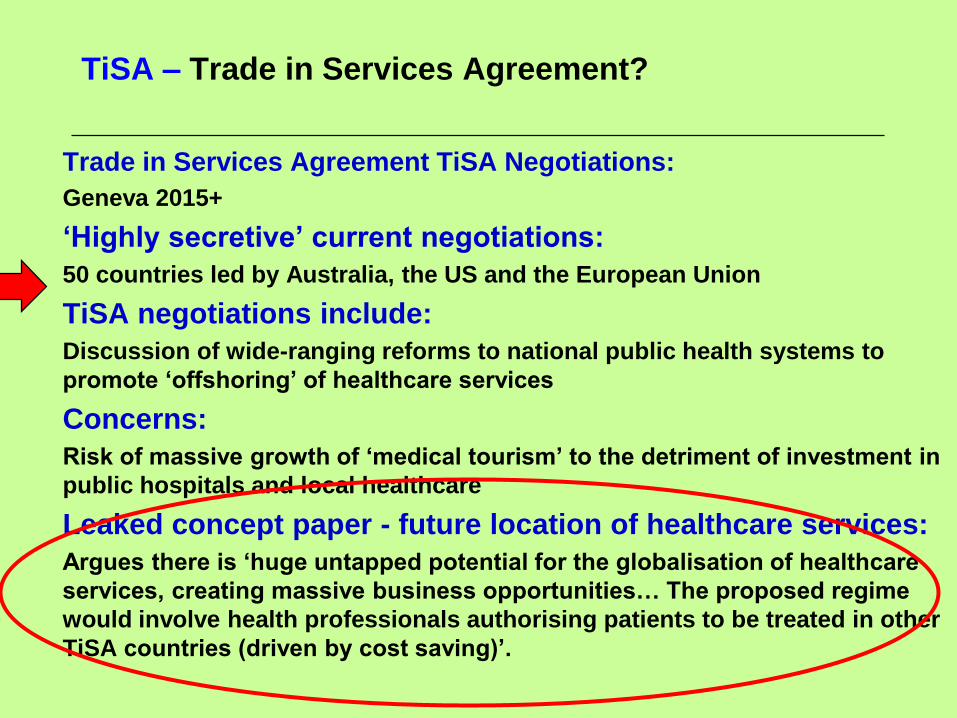
TiSA – Trade in Services Agreement?
Trade in Services Agreement TiSA Negotiations:
Geneva 2015+
‘Highly secretive’ current negotiations:
50 countries led by Australia, the US and the European Union
TiSA negotiations include:
Discussion of wide-ranging reforms to national public health systems to
promote ‘offshoring’ of healthcare services
Concerns:
Risk of massive growth of ‘medical tourism’ to the detriment of investment in
public hospitals and local healthcare
Leaked concept paper - future location of healthcare services:
Argues there is ‘huge untapped potential for the globalisation of healthcare
services, creating massive business opportunities… The proposed regime
would involve health professionals authorising patients to be treated in other
TiSA countries (driven by cost saving)’.
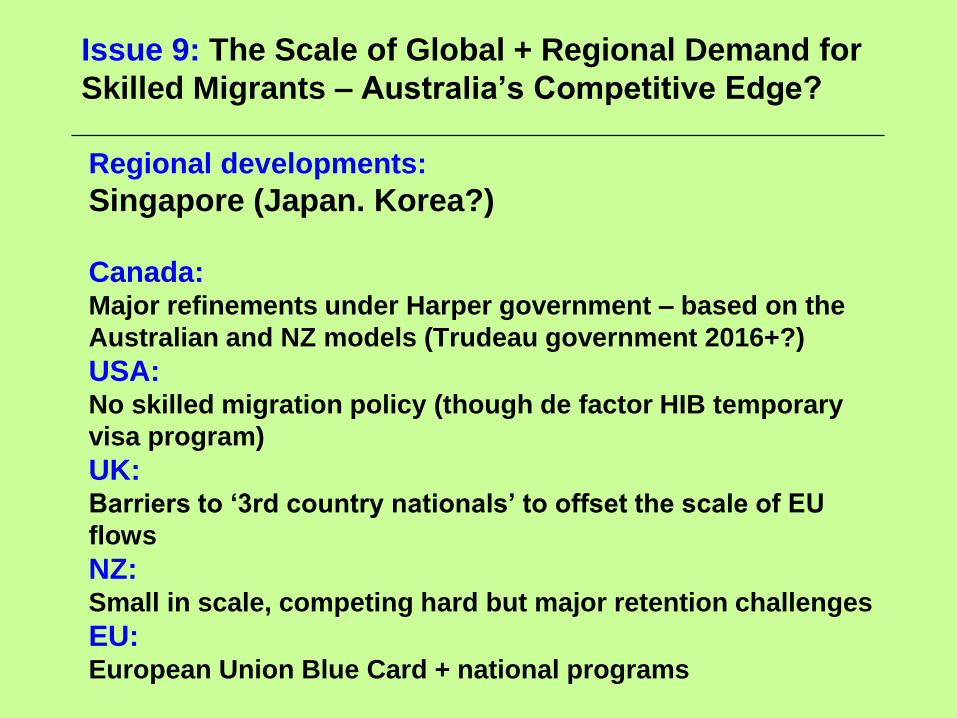
Issue 9: The Scale of Global + Regional Demand for
Skilled Migrants – Australia’s Competitive Edge?
Regional developments:
Singapore (Japan. Korea?)
Canada:Major refinements under Harper government – based on the
Australian and NZ models (Trudeau government 2016+?)
USA: No skilled migration policy (though de factor HIB temporary
visa program)
UK: Barriers to ‘3rd country nationals’ to offset the scale of EU
flows
NZ:Small in scale, competing hard but major retention challenges
EU:European Union Blue Card + national programs


![]Global Migration of the Highly Skilled](https://static.fdocuments.net/doc/165x107/5695d1931a28ab9b029714fb/global-migration-of-the-highly-skilled.jpg)