SE_Lec 12_ Project Planning
70
1 Chapter 22 Project management
-
Upload
amr-e-mohamed -
Category
Software
-
view
136 -
download
1
Transcript of SE_Lec 12_ Project Planning

1Chapter 22 Project management

Software pricing
Plan-driven development
Project scheduling
Agile planning
Estimation techniques

Project planning involves breaking down the work into
parts and assign these to project team members,
anticipate problems that might arise and prepare
tentative solutions to those problems.
The project plan, which is created at the start of a
project, is used to communicate how the work will be
done to the project team and customers, and to help
assess progress on the project.

At the proposal stage, when you are bidding for a
contract to develop or provide a software system.
During the project startup phase, when you have to plan
who will work on the project, how the project will be
broken down into increments, how resources will be
allocated across your company, etc.
Periodically throughout the project, when you modify
your plan in the light of experience gained and
information from monitoring the progress of the work.

Planning may be necessary with only outline software
requirements.
The aim of planning at this stage is to provide
information that will be used in setting a price for the
system to customers.
Chapter 22 Project management 6
Estimates are made to discover the cost, to the
developer, of producing a software system.
You take into account, hardware, software, travel, training
and effort costs.
There is not a simple relationship between the
development cost and the price charged to the customer.
Broader organisational, economic, political and business
considerations influence the price charged.
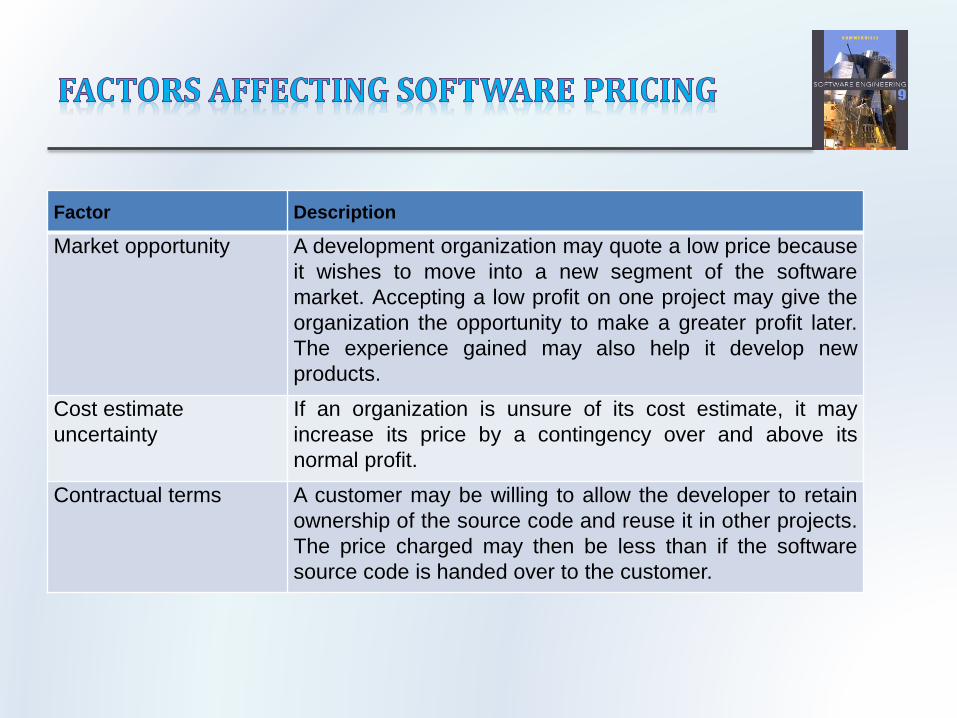
Factor Description
Market opportunity A development organization may quote a low price because
it wishes to move into a new segment of the software
market. Accepting a low profit on one project may give the
organization the opportunity to make a greater profit later.
The experience gained may also help it develop new
products.
Cost estimate
uncertainty
If an organization is unsure of its cost estimate, it may
increase its price by a contingency over and above its
normal profit.
Contractual terms A customer may be willing to allow the developer to retain
ownership of the source code and reuse it in other projects.
The price charged may then be less than if the software
source code is handed over to the customer.

Factor Description
Requirements volatility If the requirements are likely to change, an organization
may lower its price to win a contract. After the contract is
awarded, high prices can be charged for changes to the
requirements.
Financial health Developers in financial difficulty may lower their price to
gain a contract. It is better to make a smaller than normal
profit or break even than to go out of business. Cash flow
is more important than profit in difficult economic times.

Chapter 22 Project management 10
Plan-driven or plan-based development is an approach
to software engineering where the development process
is planned in detail.
Plan-driven development is based on engineering project
management techniques and is the ‘traditional’ way of
managing large software development projects.
A project plan is created that records the work to be
done, who will do it, the development schedule and the
work products.
Managers use the plan to support project decision
making and as a way of measuring progress.

The arguments in favor of a plan-driven approach are
that early planning allows organizational issues
(availability of staff, other projects, etc.) to be closely
taken into account, and that potential problems and
dependencies are discovered before the project starts,
rather than once the project is underway.
The principal argument against plan-driven development
is that many early decisions have to be revised because
of changes to the environment in which the software is to
be developed and used.

In a plan-driven development project, a project plan sets
out the resources available to the project, the work
breakdown and a schedule for carrying out the work.
Plan sections
Introduction
Project organization
Risk analysis
Hardware and software resource requirements
Work breakdown
Project schedule
Monitoring and reporting mechanisms

Plan Description
Quality plan Describes the quality procedures and standards that
will be used in a project.
Validation plan Describes the approach, resources, and schedule used
for system validation.
Configuration management plan Describes the configuration management procedures
and structures to be used.
Maintenance plan Predicts the maintenance requirements, costs, and
effort.
Staff development plan Describes how the skills and experience of the project
team members will be developed.

Project planning is an iterative process that starts when
you create an initial project plan during the project
startup phase.
Plan changes are inevitable.
As more information about the system and the project
team becomes available during the project, you should
regularly revise the plan to reflect requirements, schedule
and risk changes.
Changing business goals also leads to changes in project
plans. As business goals change, this could affect all
projects, which may then have to be re-planned.


Chapter 22 Project management 17

Project scheduling is the process of deciding how the
work in a project will be organized as separate tasks,
and when and how these tasks will be executed.
You estimate the calendar time needed to complete each
task, the effort required and who will work on the tasks
that have been identified.
You also have to estimate the resources needed to
complete each task, such as the disk space required on
a server, the time required on specialized hardware,
such as a simulator, and what the travel budget will be.

Split project into tasks and estimate time and resources
required to complete each task.
Organize tasks concurrently to make optimal
use of workforce.
Minimize task dependencies to avoid delays
caused by one task waiting for another to complete.
Dependent on project managers intuition and
experience.

Milestones are points in the schedule against which you
can assess progress, for example, the handover of the
system for testing.
Deliverables are work products that are delivered to the
customer, e.g. a requirements document for the system.

Estimating the difficulty of problems and hence the cost
of developing a solution is hard.
Productivity is not proportional to the number of people
working on a task.
Adding people to a late project makes it later because of
communication overheads.
The unexpected always happens. Always allow
contingency in planning.

Graphical notations are normally used to illustrate the
project schedule.
These show the project breakdown into tasks. Tasks
should not be too small. They should take about a week
or two.
Bar charts are the most commonly used representation
for project schedules. They show the schedule as
activities or resources against time.

Task Effort (person-
days)
Duration (days) Dependencies
T1 15 10
T2 8 15
T3 20 15 T1 (M1)
T4 5 10
T5 5 10 T2, T4 (M3)
T6 10 5 T1, T2 (M4)
T7 25 20 T1 (M1)
T8 75 25 T4 (M2)
T9 10 15 T3, T6 (M5)
T10 20 15 T7, T8 (M6)
T11 10 10 T9 (M7)
T12 20 10 T10, T11 (M8)


Chapter 22 Project management 27

Agile methods of software development are iterative
approaches where the software is developed and
delivered to customers in increments.
Unlike plan-driven approaches, the functionality of these
increments is not planned in advance but is decided
during the development.
The decision on what to include in an increment depends
on progress and on the customer’s priorities.
The customer’s priorities and requirements change so it
makes sense to have a flexible plan that can
accommodate these changes.

Release planning, which looks ahead for several months
and decides on the features that should be included in a
release of a system.
Iteration planning, which has a shorter term outlook, and
focuses on planning the next increment of a system. This
is typically 2-4 weeks of work for the team.


The system specification in XP is based on user stories that reflect
the features that should be included in the system.
The project team read and discuss the stories and rank them in
order of the amount of time they think it will take to implement the
story.
Release planning involves selecting and refining the stories that will
reflect the features to be implemented in a release of a system and
the order in which the stories should be implemented.
Stories to be implemented in each iteration are chosen, with the
number of stories reflecting the time to deliver an iteration (usually 2
or 3 weeks).
The price charged for a system does not just depend on its
estimated development costs; it may be adjusted depending on the
market and organizational priorities.
Plan-driven development is organized around a complete project
plan that defines the project activities, the planned effort, the activity
schedule and who is responsible for each activity.
Project scheduling involves the creation of graphical representations
the project plan. Bar charts show the activity duration and staffing
timelines, are the most commonly used schedule representations.
The XP planning game involves the whole team in project planning.
The plan is developed incrementally and, if problems arise, is
adjusted. Software functionality is reduced instead of delaying
delivery of an increment.

Chapter 22 Project management 33

Process Measures
Time, effort, cost
Productivity
Earned value
Fault, failure, change
Product Measures
Functionality (FP)
Size
Price
Modularity
Other ..

Software System (Functions & Quality)
Calendar time Cost
No notion of unpredictable events here
Failure, Fault
LOC, FP
Days, weeks, months, on calendar
Virtual, from project start
Month1, month2, … etc
Typically used in planning
Actual
September 12
Typically used in controlling

Time taken by staff to complete a task
Depends on calendar time and on people employed
Measured in person hours (IEEE 1045)
person day, person month, person year depend on
national and corporation parameters
Converts in cost
Staff cost = person hours * cost per hour

1 person works 6 hours 6 ph
2 persons work 3 hour 6 ph
6 persons work 1 hour 6ph

Always linked
Mathematical link. 6 ph can last
6 calendar hours if 1 person works
3 calendar hours if 2 persons work in parallel
1 calendar hour if 6 persons work in parallel
Practical constraint
Is it feasible?
One woman makes a baby in 9 months
9 women make a baby in one month?

Cost to user
acquisition, maintenance, normal operation, initial
operation (training, overheads)
Cost to vendor
Staff
• Person hour * cost per hour
W / wout overheads
hardware, software
offices, telephone, ...

Upfront costs
market analysis, feasibility studies
development costs
maintenance costs

Hardware (target platform)
Hardware (development platform)
Personnel (by far main cost in most cases)
salaries, office space, travel ..
Technical
administrative

Estimates are made to discover the cost, to the
developer, of producing a software system
There is not a simple relationship between the
development cost and the price charged to the customer
Broader organizational, economic, political and business
considerations influence the price charged

Of source code
LOC (Lines of Code)
Of documents
Number of pages
Number of words, characters, figures, tables

Of entire project
Function points (see later)
LOC
• In this case LOCs virtually include all documents (non code)
produced in the application
• Ex. project produces 10 documents (1000 pages) and 1000
LOCs. By convention project size is 1000 LOCs
What to count
w/wout comments
w/wout declarations
w/wout blank lines
What to include or exclude
Libraries, calls to services etc
Reused components
Comparison for different languages not meaningful
C vs Java? Java vs C++? C vs ASM?

Output/effort
What is output in software?
Size/effort = LOC / effort
Functionality/effort = FP/effort
Object Points / effort

The lower level the language, the more productive the
programmer
The same functionality takes more code to implement in a
lower-level language than in a high-level language
The more verbose the programmer, the higher the
productivity
Measures of productivity based on lines of code suggest
that programmers who write verbose code are more
productive than programmers who write compact code


Real-time embedded systems, 40- 160 LOC/P-month
Systems programs , 150-400 LOC / P-month
Commercial applications, 200-800 LOC/P-month
Source: Sommerville

All metrics based on size/effort are flawed because they
do not take quality into account
Productivity may generally be increased at the cost of
quality
It is not clear how productivity/quality metrics are related
If change is constant then an approach based on
counting lines of code is not meaningful

Failure
malfunction perceived by the user
Fault
Defect in the system, may cause failure or not

Data to collect
calendar time, project time, execution time
effect (bad data, loss of data, ...)
location (product type, id)
gravity (human injury, economic loss, ..)
user profile
related fault(s)
Measures
classification, count per class
average time intervals
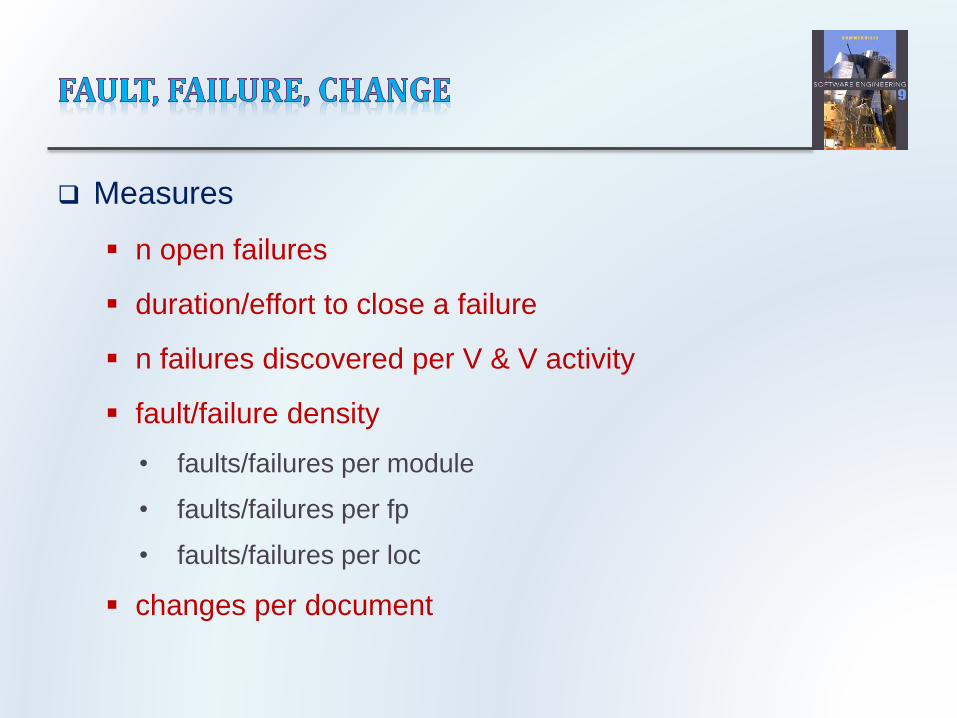
Measures
n open failures
duration/effort to close a failure
n failures discovered per V & V activity
fault/failure density
• faults/failures per module
• faults/failures per fp
• faults/failures per loc
changes per document

Good: <1fault/1KLOC
Bad: >10fault/1KLOC
Faults found in operation, 12 months after release
Prerelease:
10-30 fault/1KLOC
Factor 10 between pre and post release

Chapter 22 Project management 57
Once a process model is finalized for a software development,
software project management begins with a set of activities that are
collectively called Project Planning.
Project planning encompasses five major activities
Estimation
Scheduling
Risk analysis
Quality Management planning
Change Management planning
Before the project can begin, the software team should estimate
Cost for the work to be done
Resources required,
Time that will elapse from start to finish
Chapter 22 Project management 58

Estimation for a software engineering requires
Experience
Access to good historical information (metrics from past
projects)
Courage to commit to quantitative predictions when
qualitative information exists.
Factors that affect reliability of estimation
Project Complexity
Project Size
Degree of structural uncertainty
Chapter 22 Project management 59

Past (Similar) project experience
Base estimation on similar previous projects if the customer
business conditions, the software engineering environment,
deadlines are roughly equivalent.
Conventional estimation – Decomposition Techniques
Task breakdown and effort estimates
Size (e.g. of Code (LOC), Function Point (FP)) estimates.
Empirical Models
Uses empirically derived formulas to predict effort as a function
of Lines of Codes or Function Point or Object Point
Automated Tools
Used to implement a specific empirical model
Chapter 22 Project management 60

Since EEM reflects the population of projects from which it
has been derived, this model is domain sensitive.
Structure of Estimation Models
𝑬 = 𝑨 + 𝑩 ∗ 𝒆𝒗𝑪
Where 𝐴, 𝐵, 𝐶 are empirically derived constants
𝐸: is effort in Person-Months
𝑒𝑣: is the estimation variable (either LOC or FP or OP)
Majority of estimation models have some form of project
adjustment component that enables E to be adjusted by other
project characteristics (e.g., Problems Complexity, Staff
Experience, development environment)
Chapter 22 Project management 62

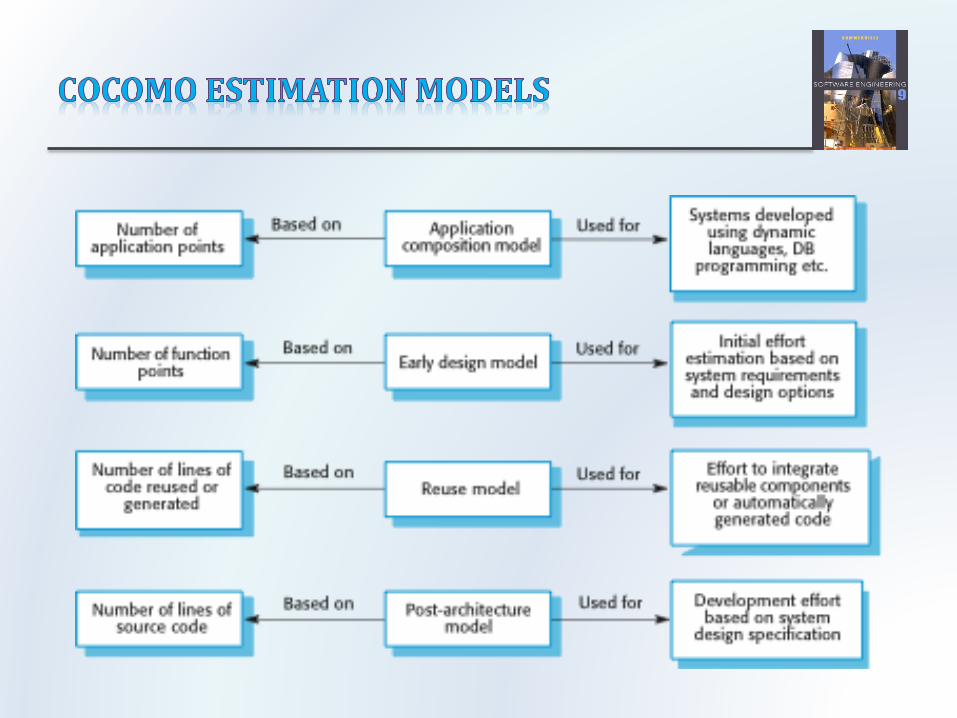
COnstructive COst MOdel – II by Barry Boehm
Application Composition model: used during the early
stages software engineering.
Early design stage model: used once requirements have
been stabilized and basic software architecture has been
established.
Post-Architecture-stage model: used during the
construction of the software.
The sizing information followed by this model is the
indirect software measure object points.
Chapter 22 Project management 63

Object Points is computed using counts of the number of
Screens (at the user interface)
Reports
Components likely to be required to build the application.
Each object instance (e.g., a screen or report) is classified into
one of three complexity levels (i.e., Simple, Medium, or Difficult).
In essence, complexity is a function of
Number and source of the client and server data tables that are
required to generate the screen or report.
Number of views or sections presented as part of the screen or
report.
Chapter 22 Project management 64
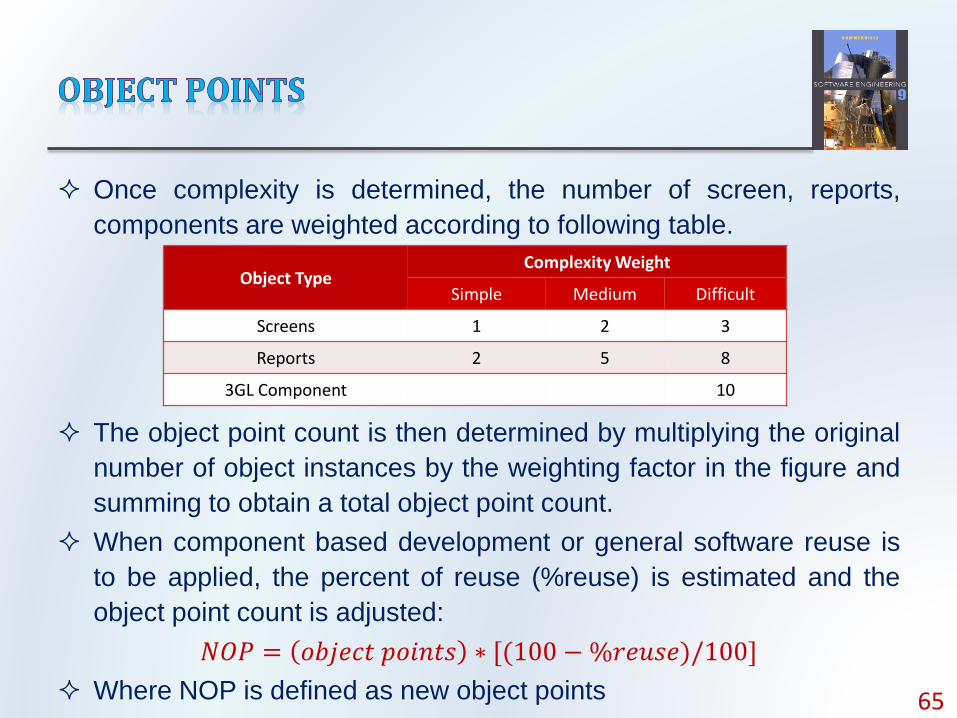
Once complexity is determined, the number of screen, reports,
components are weighted according to following table.
The object point count is then determined by multiplying the original
number of object instances by the weighting factor in the figure and
summing to obtain a total object point count.
When component based development or general software reuse is
to be applied, the percent of reuse (%reuse) is estimated and the
object point count is adjusted:
𝑁𝑂𝑃 = 𝑜𝑏𝑗𝑒𝑐𝑡 𝑝𝑜𝑖𝑛𝑡𝑠 ∗ [(100 −%𝑟𝑒𝑢𝑠𝑒)/100]
Where NOP is defined as new object points 65
Object TypeComplexity Weight
Simple Medium Difficult
Screens 1 2 3
Reports 2 5 8
3GL Component 10

Now the estimate of project effort is computed as follows
𝑬𝒔𝒕𝒊𝒎𝒂𝒕𝒆𝒅 𝑬𝒇𝒇𝒐𝒓𝒕 =𝑵𝑶𝑷
𝑷𝑹𝑶𝑫
Productivity rate can be derived from following table based on
developer experience and organization maturity:
Chapter 22 Project management 66
Developer’s Experience/capability Very low Low Normal High Very High
Environment maturity/capability Very low Low Normal High Very High
PROD 4 7 13 25 50

Use COCOMO-II model to estimate the effort required to build
software for a simple ATM that produces 12 screen, 10
reports, and will require approximately 80% as new software
components. Assume average complexity and average
developer/environment maturity. Use the application
composition model with object point
Given
Chapter 22 Project management 67
Object Count Complexity Weight Factor Total Objects
Screen 12 Simple 1 12
Report 10 Simple 2 20
3GL Components 0 N/A N/A 0
Total Objects Points: 32

It is given that 80% of components have to be newly
developed. So remaining 20% can be reused.
Now compute new object points as
𝑵𝑶𝑷 = 𝒐𝒃𝒋𝒆𝒄𝒕 𝒑𝒐𝒊𝒏𝒕𝒔 ∗ [(𝟏𝟎𝟎 −%𝒓𝒆𝒖𝒔𝒆)/𝟏𝟎𝟎]
𝑵𝑶𝑷 = 𝟑𝟐 ∗ [(𝟏𝟎𝟎 − 𝟐𝟎)/𝟏𝟎𝟎]
𝑵𝑶𝑷 = 𝟐𝟓. 𝟔 𝒐𝒃𝒋𝒆𝒄𝒕 𝒑𝒐𝒊𝒏𝒕𝒔
Since productivity is average, we can assume PROD = 13
Hence,
effort = NOP/PROD = 25.6 / 13 = 1.96 person-months
Chapter 22 Project management 68
Estimation techniques for software may be experience-
based, where managers judge the effort required, or
algorithmic, where the effort required is computed from
other estimated project parameters.
The COCOMO II costing model is an algorithmic cost
model that uses project, product, hardware and
personnel attributes as well as product size and
complexity attributes to derive a cost estimate.
Chapter 22 Project management 70