SEIZING THE MEASUREMENT MOMENT: - College Summit
24
Why NoW is the time for states to help high schools get the postsecoNdary data they Need aNd WaNt J.B. schramm and e. Kinn ey Zalesne | oct ober 2011 Seizing the MeaSureMent MoMent:
Transcript of SEIZING THE MEASUREMENT MOMENT: - College Summit
Why NoW is the time for states to help high schools
get the postsecoNdary data they Need aNd WaNt
J.B. schramm and e. K inney Za lesne | october 2011
Seizing the MeaSureMent MoMent:

Published in 2011 by College SummitTo download a copy of this paper, visit www.collegesummit.org
Executive Summary 1
I. The Big Unknown for High Schools: 2 How Do Students Fare After They Graduate?
II. The States Have the Answer 3
III. Stakeholders Want the Data 4The Philadelphia Story
A Mile-High Challenge: Denver Data Collection
Eureka! Mining Data in the Golden State
IV. Leveraging Investments in 11 Statewide Data Systems
V. Recommendations for State Action 12Action #1: Improve the ability to measurestudents’ postsecondary success
Action #2: Make the postsecondary successdata available statewide
Action #3: Provide technical assistance to helpdistricts translate data and reports into action
Action #4: Reward districts and schools that improve
students’ enrollment and postsecondary performance
Conclusion 16
Why NoW is the time for states to help high schools
get the postsecoNdary data they Need aNd WaNt
Seizing the MeaSureMent MoMent:
1
Se
izin
g t
he
Me
aS
ur
eM
en
t M
oM
en
t
executive summaryParticularly in rough economic times, states must make hard choices about resources. But there is one targeted investment that mayors, business leaders, educators, and parents are crying out for, and that states have already initiated. It is reports for high schools on their students’ postsecondary performance, answering the critical questions: Do students enroll in a postsecondary institution? Do they pass their non-remedial courses? In which academic areas are they thriving, or struggling? These data will enable high schools everywhere in a state to find out how their graduates are doing anywhere in the state. Without this information, high schools are handicapped in their ability to prepare students for college and career.
Indeed, too many students, especially low-income students, are not prepared. In the last decade, Americans have enrolled in college in record numbers. But once there, they are stumbling at alarming rates and at enormous cost to themselves, their families, and their city and state tax bases. By one estimate, the lost personal income for one year of one class of these students is $3.8 billion; the federal government loses $566 million and the states lose $164 million in taxes from this cohort of college students who should have graduated and the numbers multiply each year. 1
Superintendents and principals are desperate to know what went wrong. Business leaders anx-iously hope for employees who are ready for 21st century work. Governors, too, know that above all they need an educated workforce to compete in the national and global marketplace.
States are making progress toward producing the high school postsecondary performance data these stakeholders need. But in the meantime, the stakeholders are restless.
Across the nation, in the absence of strong state systems and support, mayors, business leaders, local administrators, and educators are twisting themselves into pretzels to come up with tempo-rary, patchwork solutions to track how their high school graduates are doing in college. But it is states that have the incentive, means, impartiality, and standing to collect and truly activate this data in the most effective, efficient, and fair way.
This paper calls on states to take four definitive steps to unlock the power of high school postsec-ondary performance data:
Action #1: Improve the ability to measure students’ postsecondary success
Action #2: Make the postsecondary suc-cess data available statewide
Action #3: Provide technical assistance to help districts translate data and reports into action
Action #4: Reward districts and schools that improve students’ enrollment and postsecondary performance
Rarely do problems and solutions line up so nicely. Stakeholders are begging states to take the lead. States have already begun the effort. Just now, we are starting to see the power of the data to help students - illustrated here both through the stories about local demand and the “Making a Difference” vignettes.
Robust use of high school postsecondary perfor-mance data will improve high schools, relieve colleges, and fortify the workforce. All that remains is to finish the infrastructure and activate the data so educators can help students succeed.

2
Se
izin
g t
he
Me
aS
ur
eM
en
t M
oM
en
t
i. the Big Unknown for high schools: how do students fare after they graduate?
A generation or so ago, a high school diploma was sufficient to generate a living wage. Now, success in America needs college. In 1970, almost 60 percent of high school graduates were in the middle-income class; by 2007, only 45 percent were. And this gap is expected to widen. By 2018, more than 60 percent of jobs in the United States will require at least some postsecondary education. 2
Frankly, we’re heading in the wrong direction. Globally, America now ranks 16th in the percentage of 25 to 34 year-olds who hold a college degree; 3 that’s down from the #1 spot just 20 years ago. 4
The problem is most acute for low-income students. In recent years, America has made gains in the college enrollment of low-income students, but the gap between low- and higher-income students has persisted for decades.5 Once in college, low-income students are failing at alarming rates: even though they appeared college-ready at admission time, too many were unprepared for the rigor of college-level work.6 As a result, ensuring actual college readiness has become the primary goal of K-12 education.
In order to improve college students’ readiness, high schools need to know what is working, and what is not. In fact, they have almost no information about this. Ask superintendents, principals, or teachers in most communities, whether their students are thriving in college, and at best, they will guess. They will draw on anecdotal reports or qualitative estimations, but they will have no systematic information as to whether their students in fact were ready for college or not.
Why were such mechanisms never created? Because when the goal of high school was merely graduation, high school success could be measured in diplomas. Now that the goal is postsecondary success, new strategies are needed.
What is High School Postsecondary Performance Data?Recommended measures for the most useful, relevant, feasible, and objective postsecondary data to support achievement in high school are:
College Enrollment Rate: Percentage of graduates who enroll in postsecondary education the fall after graduation.
Credit Accumulation Rate: Percentage of enrollees who complete one year of college coursework beyond remediation within two years.
Current Status: All 50 states, the District of Columbia and Puerto Rico committed to build state longitudinal data systems to report college enrollment and credit accumulation rates for every high school in 2011 to meet State Fiscal Stabilization Fund (SFSF) requirements.
College Remediation Rate: The percentage of enrollees who take at least one remedial class during their first year in college.
Current Status: While “remediation” is not as objective a measure as “credit accumulation” (definitions of remediation differ from institution to institution), the measure offers valuable information to educators. 27 states affirmed in their initial SFSF reports that they have information about whether their high school graduates enroll in remedial coursework.7

3
Se
izin
g t
he
Me
aS
ur
eM
en
t M
oM
en
t
ii. the states have the answer Only states have the incentive, the means, the impartiality, and the standing to provide all their schools with the high school postsec-ondary performance data of all their gradu-ates, wherever they may have enrolled.
THE InCEnTIvE. More than any other priority, governors must cultivate a competitive work-force that is prepared to drive 21st century economic growth. As discussed above, such work increasingly requires higher education. It is in states’ highest self-interest to ensure that all its high schools are graduating college-ready youth.
THE MEAnS. States already collect the K-12 student data that needs to be matched with postsecondary student data. Rather than asking districts to shoulder the burden of more data collection, analysis, and reporting, states can do the matching and analysis in a far more efficient, cost-saving way.
Similarly, only states can serve as a single point of contact for sharing in-state and out-of-state data with other states and their postsecondary institutions. Without that single point of con-tact, college and university systems will have to share data with multiple entities, working through thorny political, legal, and technical issues with numerous individual districts.
THE IMPARTIAlITy. Only states have the ca-pacity to develop standardized metrics and reports, making the resulting information com-parable across districts, statewide.
THE STAnDIng. Only states can provide feedback reports to all educators regardless of local capacity, ensuring equal access to the critical data.
By examining postsecondary outcome data, Denver Public Schools (DPS) learned that its graduates were disproportionally struggling in college math courses. DPS identified a key problem: the district required students to take only two years of math to graduate. Moreover, students who passed Algebra in the 8th grade were required to take only one year of high school math. With too little time learning math in high school, it wasn’t such a surprise that students struggled with math in college. After adjusting and raising requirements and expectations, DPS saw student achievement on the ACT Math subscore rise dramatically from 15.4 to 18.02 between 2006 and 2011.8
Making a Difference for Students

4
Se
izin
g t
he
Me
aS
ur
eM
en
t M
oM
en
t
iii. stakeholders Want the data Early on, when education data strategies were being developed, there was some concern that stakeholders would consider high school postsecondary performance data intrusive, superfluous, or just plain unnecessary. That is clearly not the case.
EDuCAToRS WAnT THE DATA. From high-profile urban reformers to small-town principals to teachers across the country, America’s educators yearn for information about how their students perform after they graduate from high school.
In a 2010 survey conducted by the professional services organization Deloitte, fully 92 percent of high school educators said that having data on students’ academic performance in college was critical for evaluating the effectiveness of high school curriculum and instruction.9 Moreover, 83 percent said that having that data would help them decide which subjects to improve. By contrast, only 13 percent of high school educators said they actually received information from school-wide reports; to the extent educators received any feedback on student performance, it was anecdotal and from former students or parents.10
STuDEnTS WAnT THE DATA. Academic researchers have known for some time that if high schools value and track postsecondary success, their students are more likely to succeed in high school – regardless of their post-graduation plans. Indeed, teaching all students to connect their current work to their future plans, navigate financial aid systems, and choose suitable postsecondary programs helps them re-commit to the rigors of high school and also results in dramatically higher rates of college persistence and success.11
PAREnTS WAnT THE DATA. America’s parents – many of whom came of age when a high school diploma was sufficient to earn a living wage – now say the main purpose of high school is to prepare their children for college. In Deloitte’s 2009 education survey, parents ranked preparing students for college the #1 priority for a high school.12 In other words, parents’ top concern about high school is how their children fare afterwards.
“Putting postsecondary feedback data in the hands of our educators helps us increase expectations for what adults and students can accomplish and for what high schools can deliver.”
– John Deasy, Superintendent,Los Angeles Unified School District, CA
“With postsecondary data, we have the ability to work backwards, improving or revising our practices to provide targeted instruction and services, addressing the varying needs of each of our students.”
– Camille Jacobs, Assistant Principal,Pathways College Preparatory High School, Queens, NY
“It made a tremendous difference for my son, and his classmates, when our principal made reforms based on how recent graduates had done in college.”
– Pamela Stewart, the mother of astudent enrolled at Crossland High School,
Prince George’s County Public Schools, MD

5
Se
izin
g t
he
Me
aS
ur
eM
en
t M
oM
en
t
PAGE 6
The Philadelphia Story
PAGE 8
A Mile-High Challenge:Denver Data Collection
PAGE 10
Eureka! Mining Datain the Golden State
When educators at McAllen Memorial High School in Texas began to examine postsecondary outcome data, the connections between high school and college performance came into sharp focus. Melvin Benford, dean of instruction at McAllen, found a clear correlation between both ninth grade attendance and math course selection with postsecondary success. The revelation led the school to rigorously track ninth grade attendance and direct students toward taking specific math courses.13
Making a Difference for Students
PolICyMAkERS WAnT THE DATA. During the last decade, the value of education data to local, state, and federal policymakers has significantly increased. Policymakers use data to make the very tough choices regarding how to allocate fewer education dollars while still meeting the demands of parents and businesses to improve education outcomes. Without data to inform deliberations in state legislatures and school boards, decisions are made in a political vacuum lacking objective information.
loCAl lEADERS WAnT THE DATA. Significantly, local leaders want the data so badly that they are pursuing it with time, money, and creativity that they might otherwise spend engaging students and supporting educators.
THREE of THEIR SToRIES. The following three stories show how strong the local demand is for high school postsecondary performance data, how unreplicable ad hoc solutions can be, and how strong the call is for state leadership.
“Parents measure the success of our schools not only by how their kids perform in high school, but how our schools prepare their children to compete and succeed in college.”
– Mayor John DeStefano, New Haven, CT

6
Se
izin
g t
he
Me
aS
ur
eM
en
t M
oM
en
t
The Philadelphia Story At Mayor Michael Nutter’s inaugural speech in Philadelphia in January 2008, he called for a halving of high school dropout rates by 2015 and a doubling of college attainment rates by 2018.14
Thus, Nutter’s Chief Education Officer, Dr. Lori Shorr, had her agenda. Like most cities in Amer-ica, Philadelphia didn’t even know its current college enrollment rate. There was no systemat-ic way to know what happened to Philadelphia’s graduates after high school.
Shorr proceeded on two fronts. First, she en-gaged the National Student Clearinghouse (NSC), a Virginia-based nonprofit organization that tracks the college enrollment and persis-tence of students district-wide. But those were just snapshots. Shorr also wanted remediation rates. It wasn’t enough to find out a year later that students had failed; she wanted to know in real time which subjects students were succeeding or struggling in. Only then could teachers make useful improvements.
Shorr knew the state of Pennsylvania was working on its K-16 database, which would ultimately match individual student records to higher education registries to provide high school “feedback reports” by school and dis-trict. But the effort was stalled. Private Pennsyl-vania colleges were balking at what they called over-intrusive data requests, and Nutter and Shorr thought they’d lose at least another year. “We’ll do this ourselves,” the Mayor said.

7
Se
izin
g t
he
Me
aS
ur
eM
en
t M
oM
en
t
Shorr convened nearly two doz-en local college and university presidents, and together they created a system for tracking Philadelphia students’ college performance. During the next few months, Shorr and her col-league Terri White conducted hundreds of hours of meetings, phone calls, data-field debates, spread sheet revisions, regis-trar consultations, and one-on-one guidance of the 21 higher education institutions. (Some of the work was funded by grants cobbled together from local businesses). The resulting spreadsheet, completed by all 21 institutions in June of 2010, is now being analyzed in antici-pation of a fall 2011 report.
When the report is issued, Phil-adelphia will know for the first time how well its high schools are actually preparing students for postsecondary work. Princi-pals will know which instruc-tional areas were most success-ful. Businesses will be able to target support to areas proven to need attention. And there will be a first-time baseline against which all future postsecondary progress can be compared.
Yet for all the tenacity and cre-ativity demonstrated by Mayor Nutter and his team, their ef-
fort is ultimately incomplete and not scalable. If students at-tend an institution outside the 21 that joined the effort, their postsecondary progress is lost. Even worse, when Harrisburg, Pittsburgh, Allentown, and Scranton want to boost their college-going – tracking their students’ postsecondary per-formance – they will have to start from scratch, asking many of the same colleges and uni-versities to start new partner-ships; fill out the identical – or worse, totally different – fields; and recreate the process over and over.
“As much as we cherish the ca-maraderie that has been built up among our Philadelphia partners,” Shorr reflects, “this is no way to do business. We scraped and scrambled to build the database because it’s that important,” she said. ”But if ever there were a sensible role for the state in education, it is gath-ering this data across counties and colleges in a uniform way.”
Meanwhile, progress has been made at the state level. David Volkman, Executive Assistant in the Office of Elementary and Secondary Education at the Pennsylvania Department of Education, says the state is
poised to provide high school feedback reports to all 500 of the state’s school districts, in-cluding Philadelphia, in Janu-ary 2012. The Department has made thoughtful investments in making the reports user-friendly for educators state-wide. The reports will include data on enrollment and reme-diation from the state’s public institutions and community colleges, and by linking to NSC data will include information from private postsecondary institutions as well. Volkman sees the data provided by high school feedback reporting as “another tool, another measure that would allow schools and districts to help students be more successful.”

8
Se
izin
g t
he
Me
aS
ur
eM
en
t M
oM
en
t
A Mile-High Challenge: Denver Data CollectionIn Denver, the driving force was a business leader, Timothy Marquez. Tim grew up in Denver, the son of a Denver Public Schools (DPS) teacher. He attended Abraham Lincoln High School and then studied petroleum en-gineering on a partial scholarship at the Colo-rado School of Mines. He went on to found the oil company Venoco, which he took public in 2006, raising some $200 million. Tim and his wife Bernadette (Bernie) used half their share of the profits to create the Denver Scholarship Foundation (DSF), whose mission is to im-prove Denver students’ rates of college access and completion. Like Mayor Nutter, Marquez began with big goals. He wanted 90 percent college attain-ment among DPS graduates, he told Louise Myrland, one of DSF’s first staff members, in 2007. Myrland set out to determine: what was Denver’s current college attainment rate? No one knew.
To find out, DSF contracted with Denver’s Piton Foundation and the Washington, DC-based Pell Institute for the Study of Opportu-nity in Higher Education. In 2009, these insti-tutions announced their findings. Among all DPS graduates between 2002 and 2007, only 56 percent had enrolled in college (a good 6 or 7 points below the national average). Of the DPS graduates who had entered college within 12 months of graduating from high school, only 60 percent had completed a degree or certificate or were still enrolled after six years. And of DPS graduates overall, just 39 percent had earned degrees or certificates.

9
Se
izin
g t
he
Me
aS
ur
eM
en
t M
oM
en
t
DSF created an ambitious re-sponse, involving “Future Cen-ters” in DPS high schools, need-based college scholarships for DPS graduates, and collabora-tive Student Services efforts in the 13 Colorado colleges and universities where most DSF Scholars were enrolling. But still, Myrland said, they needed that database. “We couldn’t know whether our dollars were mak-ing a difference if we couldn’t track where students applied, who got which scholarships, and how well they did,” she said.
And, the state-level efforts were plodding. “DSF couldn’t lose another year waiting for the state,” Myrland recalled. DSF assigned more than 20 employ-ees to retrofit some fundraising software to track thousands of students, hundreds of scholar-ships, and dozens of colleges and universities.
The effort helped DSF launch its fund. But like the Phila-delphia effort, it was neither comprehensive nor scalable. It tracked only students who applied for DSF scholarships. It was not integrated with DPS’ own college tracking sys-tem. And, it could not be use-fully extended across the state. Denver is the second-largest
school district in Colorado, but there are 178 others – and when they, too, want to track their students’ postsecondary performance, they will need to start from scratch, asking those same university partners to be-gin all over again with new stu-dents (and without the benefit of a benefactor’s $50 million). According to DSF’s Deputy Director, Nate Easley, there is another reason that a neutral, galvanizing force like the state needs to collect postsecond-ary performance data for high schools. He says:
“We were lucky to have he-roes here among the princi-pals and higher ed leaders,” he explains. “But in general, no one wants to go first to spotlight postsecondary per-formance. Superintendents don’t want to be embar-rassed by low college suc-cess rates – unless there are rewards for improvement, which there aren’t. Colleges don’t want to draw attention to the high rates at which they fail students from cer-tain districts. And principals, many of whose students are dealing with non-academic obstacles to college like lim-ited funds, documentation,
and family issues, don’t want to be punished for trying to help students overcome these challenges. “In Denver, we had a Super-man and Superwoman in the form of Tim and Bernie Marquez,” Easley adds. “But as they say, we shouldn’t be waiting for Superman. States can and should gather and share this data for districts across the nation.”
Rich Wenning, until recently the Associate Commissioner at the Colorado Department of Education, acknowledges as much. “Denver has been a great partner in moving Colorado forward in postsecondary data collection,” Wenning says. “The inefficiencies across districts, and between districts and the state, are painful to see. We are working very hard to cre-ate uniform systems that will do for all of Colorado what DSF has done for Denver.”

10
Se
izin
g t
he
Me
aS
ur
eM
en
t M
oM
en
t
Eureka!Mining Data in the Golden StateThe third story involves the initiative of higher education leaders themselves.
In 1998, faculty from the Grossmont-Cuyamaca Community College District (GCCCD) outside San Diego asked their Director of Institutional Research to find out how their graduates were doing once they went four miles down the road to San Diego State University. The administrators at San Diego State were intrigued by the question. But the GCCCD students could just as well have come from across the world; no one they even knew had linked student performance information to another institution’s.
GCCCD faculty member Brad Phillips spent the next year designing a database that would do just that, and working through privacy concerns. At last he hatched the first data exchange: 140,000 anonymous student records. GCCCD economics instructor Larry Smith studied what happened to the GCCCD economics pre-majors at San Diego State. None of them was majoring in economics – but two-thirds had chosen Money and Banking. GCCCD professors adjusted their curriculum to better match what students needed. Over the next eight years, Phillips’ database, now called Cal-PASS, has grown to include more than 8,200 institutions, including 97 percent of the public colleges and universities in California and two-thirds of the school districts with high schools.
But for all its strengths, Cal-PASS lacks coordination with the state. Since it is voluntary, it is not complete; and because it is a private nonprofit effort, the state doesn’t regard it as a core planning tool. “What we share with teachers could really help state policymakers,” Phillips says. “High school postsecondary performance data is at the core of making schools work. Only data breaks down the silos between K-12, community colleges, and universities.”
11
Se
izin
g t
he
Me
aS
ur
eM
en
t M
oM
en
t
iV. leveraging investments in statewide data systems
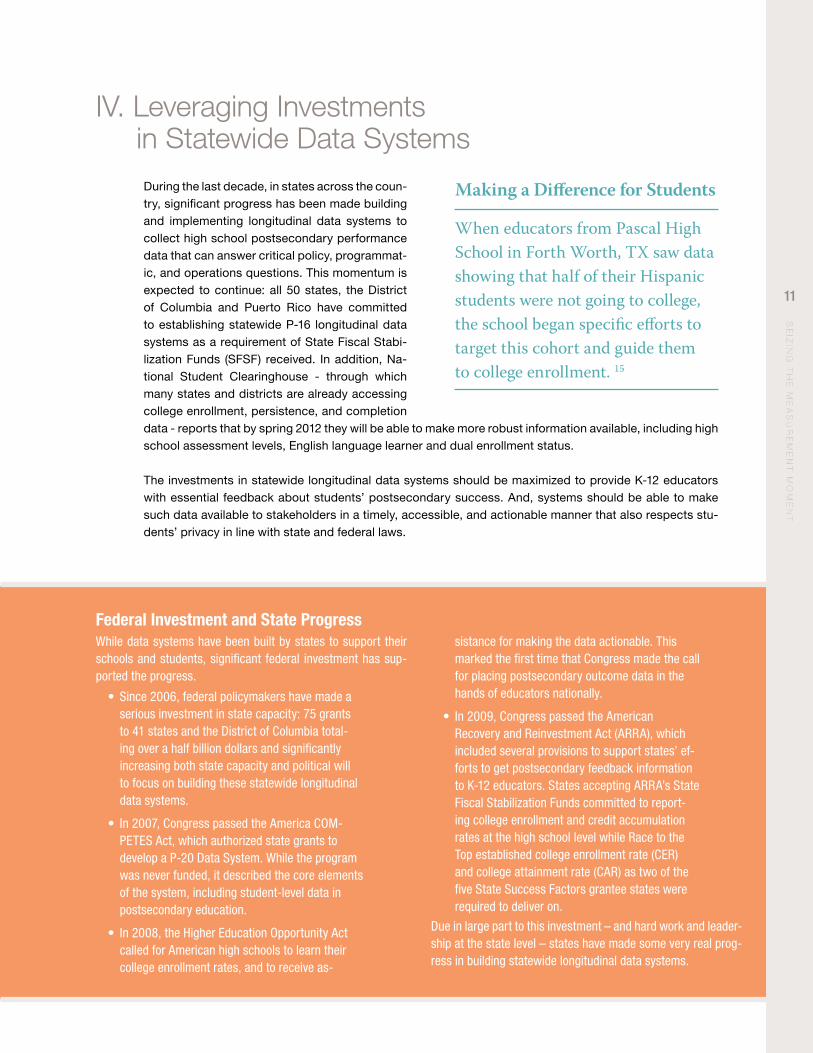
During the last decade, in states across the coun-try, significant progress has been made building and implementing longitudinal data systems to collect high school postsecondary performance data that can answer critical policy, programmat-ic, and operations questions. This momentum is expected to continue: all 50 states, the District of Columbia and Puerto Rico have committed to establishing statewide P-16 longitudinal data systems as a requirement of State Fiscal Stabi-lization Funds (SFSF) received. In addition, Na-tional Student Clearinghouse - through which many states and districts are already accessing college enrollment, persistence, and completion data - reports that by spring 2012 they will be able to make more robust information available, including high school assessment levels, English language learner and dual enrollment status.
The investments in statewide longitudinal data systems should be maximized to provide K-12 educators with essential feedback about students’ postsecondary success. And, systems should be able to make such data available to stakeholders in a timely, accessible, and actionable manner that also respects stu-dents’ privacy in line with state and federal laws.
federal Investment and State Progress While data systems have been built by states to support their schools and students, significant federal investment has sup-ported the progress.
• Since 2006, federal policymakers have made a serious investment in state capacity: 75 grants to 41 states and the District of Columbia total-ing over a half billion dollars and significantly increasing both state capacity and political will to focus on building these statewide longitudinal data systems.
• In 2007, Congress passed the America COM-PETES Act, which authorized state grants to develop a P-20 Data System. While the program was never funded, it described the core elements of the system, including student-level data in postsecondary education.
• In 2008, the Higher Education Opportunity Act called for American high schools to learn their college enrollment rates, and to receive as-
sistance for making the data actionable. This marked the first time that Congress made the call for placing postsecondary outcome data in the hands of educators nationally.
• In 2009, Congress passed the American Recovery and Reinvestment Act (ARRA), which included several provisions to support states’ ef-forts to get postsecondary feedback information to K-12 educators. States accepting ARRA’s State Fiscal Stabilization Funds committed to report-ing college enrollment and credit accumulation rates at the high school level while Race to the Top established college enrollment rate (CER) and college attainment rate (CAR) as two of the five State Success Factors grantee states were required to deliver on.
Due in large part to this investment – and hard work and leader-ship at the state level – states have made some very real prog-ress in building statewide longitudinal data systems.
When educators from Pascal High School in Forth Worth, TX saw data showing that half of their Hispanic students were not going to college, the school began specific efforts to target this cohort and guide them to college enrollment. 15
Making a Difference for Students

12
Se
izin
g t
he
Me
aS
ur
eM
en
t M
oM
en
t
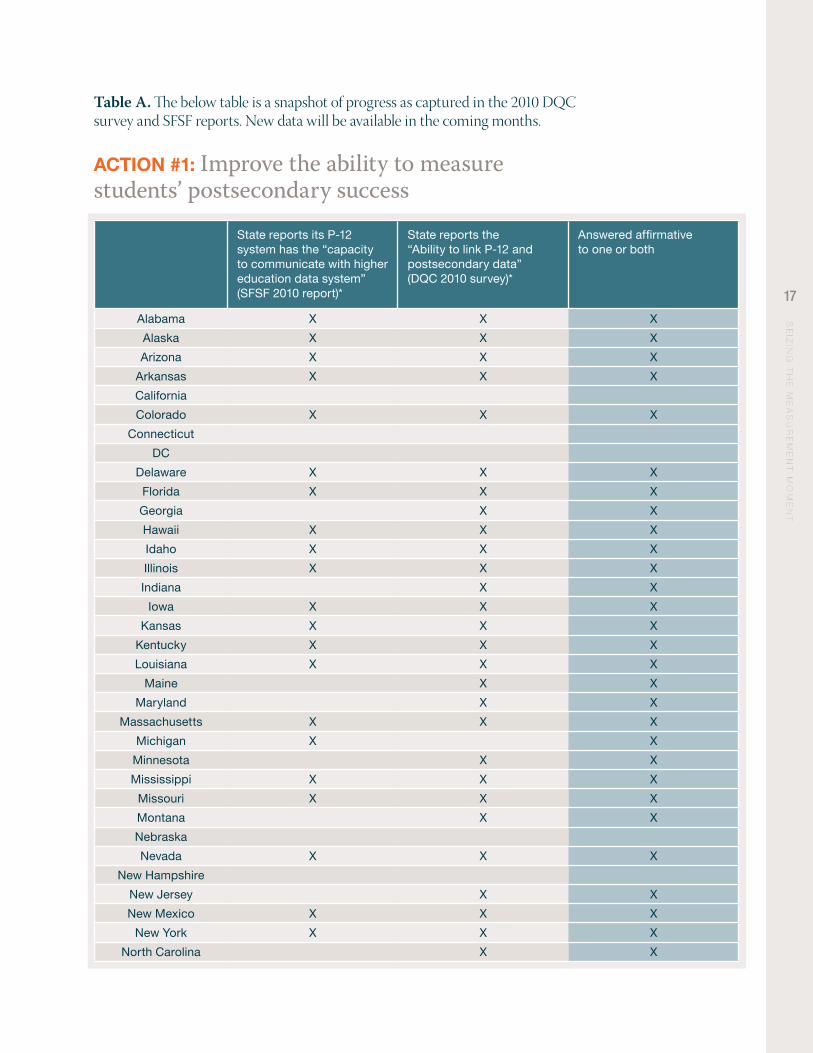
ACtion #1: Improve the ability to measure students’ postsecondary success In 2005, only 12 states reported the capacity to link student-level K-12 and postsecondary data.16 Forty-four states reported on either DQC’s 2010 survey or in their 2010 SFSF Initial Annual Report 17 that they now have this technical ability. (See appendix Table A charting individual state responses on both the DQC survey and the SFSF reports.) In many respects, the progress in building these systems has been breathtaking. But there is work still to be done. For most states, their ability to link is limited to their in-state public institutions. While schools would get a more complete picture of their efforts to prepare students for college and careers if this information included data about all students’ postsecondary outcomes, for most schools and districts even this limited outcome data would be very informative.
* The data is a snapshot of progress as captured in the 2010 DQC survey and SFSF reports. 2011 data will be available in the coming months.
Sources:State Fiscal Stabilization Fund Annual Reports: Initial Annual Report (Feb 2009 through September 2010). U.S. Department of Education, 2011. <http://www2.ed.gov/programs/statestabilization/annual-reports.html>.
“State Analysis By Essential Element: Element 9, The Ability to Match Student-Level P-12 and Higher Education Data.” Data for Action 2010.The Data Quality Campaign, 2010. <http://dataqualitycampaign.org/stateanalysis/elements/9/>.
** U.S. Department of Education has proposed extending this deadline.
States should take four actions to make this possible.
States Reporting the Capacity to Measure Postsecondary Success*
V. recommendations for state action
next steps
9 The six states, plus the District of Columbia and Puerto Rico (for a total of eight state entities) that reported not having the technical capacity to connect students’ K-12 and postsecondary information should prioritize cross-agency efforts to build it. In fact, all 50 states committed to establishing this capacity – as a requirement of receiving SFSF funding – by September 2011.**
9 All states should continue to work with all their institutions and those in other states so over time they have the ability to link information about students’ K-12 and postsecondary pursuits, regardless of whether they enroll in public, private, or out-of-state institutions.
2005 2010
13
Se
izin
g t
he
Me
aS
ur
eM
en
t M
oM
en
t
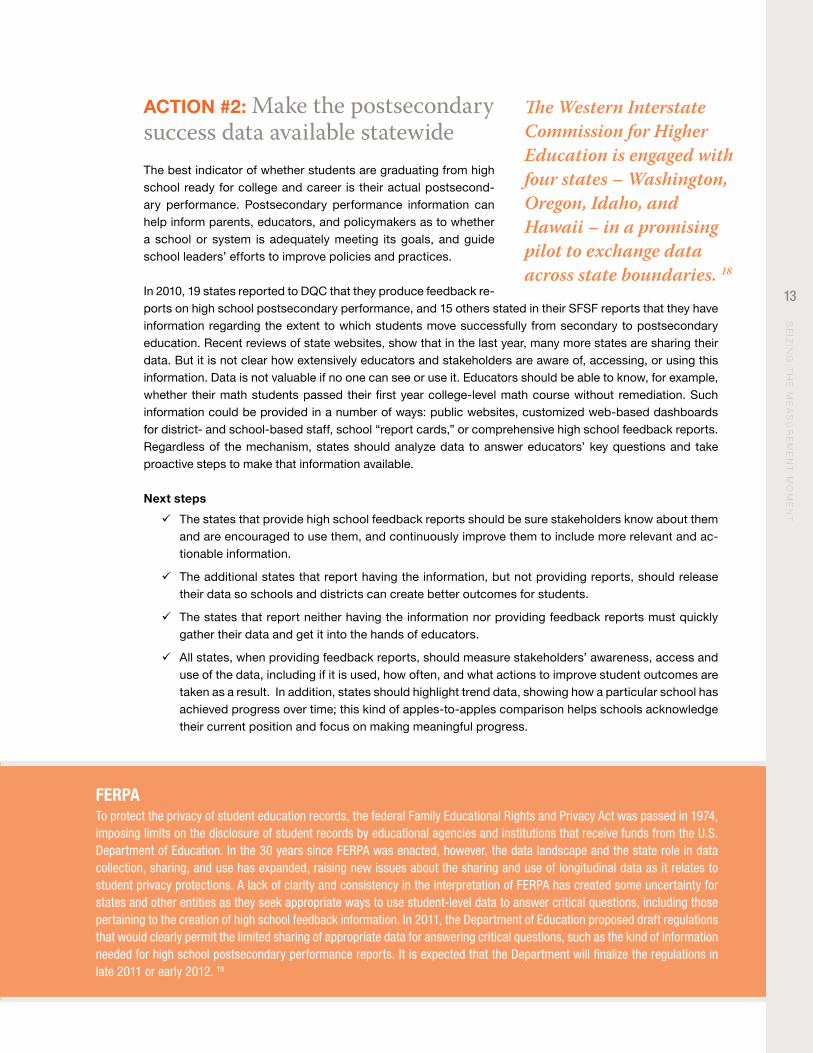
ACtion #2: Make the postsecondary success data available statewide The best indicator of whether students are graduating from high school ready for college and career is their actual postsecond-ary performance. Postsecondary performance information can help inform parents, educators, and policymakers as to whether a school or system is adequately meeting its goals, and guide school leaders’ efforts to improve policies and practices.
In 2010, 19 states reported to DQC that they produce feedback re-ports on high school postsecondary performance, and 15 others stated in their SFSF reports that they have information regarding the extent to which students move successfully from secondary to postsecondary education. Recent reviews of state websites, show that in the last year, many more states are sharing their data. But it is not clear how extensively educators and stakeholders are aware of, accessing, or using this information. Data is not valuable if no one can see or use it. Educators should be able to know, for example, whether their math students passed their first year college-level math course without remediation. Such information could be provided in a number of ways: public websites, customized web-based dashboards for district- and school-based staff, school “report cards,” or comprehensive high school feedback reports. Regardless of the mechanism, states should analyze data to answer educators’ key questions and take proactive steps to make that information available.
next steps
9 The states that provide high school feedback reports should be sure stakeholders know about them and are encouraged to use them, and continuously improve them to include more relevant and ac-tionable information.
9 The additional states that report having the information, but not providing reports, should release their data so schools and districts can create better outcomes for students.
9 The states that report neither having the information nor providing feedback reports must quickly gather their data and get it into the hands of educators.
9 All states, when providing feedback reports, should measure stakeholders’ awareness, access and use of the data, including if it is used, how often, and what actions to improve student outcomes are taken as a result. In addition, states should highlight trend data, showing how a particular school has achieved progress over time; this kind of apples-to-apples comparison helps schools acknowledge their current position and focus on making meaningful progress.
The Western Interstate Commission for Higher Education is engaged with four states – Washington, Oregon, Idaho, and Hawaii – in a promising pilot to exchange data across state boundaries. 18
fERPATo protect the privacy of student education records, the federal Family Educational Rights and Privacy Act was passed in 1974, imposing limits on the disclosure of student records by educational agencies and institutions that receive funds from the U.S. Department of Education. In the 30 years since FERPA was enacted, however, the data landscape and the state role in data collection, sharing, and use has expanded, raising new issues about the sharing and use of longitudinal data as it relates to student privacy protections. A lack of clarity and consistency in the interpretation of FERPA has created some uncertainty for states and other entities as they seek appropriate ways to use student-level data to answer critical questions, including those pertaining to the creation of high school feedback information. In 2011, the Department of Education proposed draft regulations that would clearly permit the limited sharing of appropriate data for answering critical questions, such as the kind of information needed for high school postsecondary performance reports. It is expected that the Department will finalize the regulations in late 2011 or early 2012. 19

14
Se
izin
g t
he
Me
aS
ur
eM
en
t M
oM
en
t
ACtion #3: Provide technical assistance to help districts translate data and reports into action High school feedback reports can offer highly valuable infor-mation. But district and school leaders, educators, and school staff need to be able to quickly cull the findings relevant to them, find the “ahas” within, and implement strategic changes. States need to provide technical assistance to school districts to build the capacity of educators to translate the data reports into successful instructional strategies.
In 2010, 45 states reported to DQC that they provide role-based training to educators on state-created longitudinal re-ports (e.g. feedback or growth reports).20 Nearly every state reported that it proactively communicates the availability of data to stakeholders, but more than half the states reported a lack of capacity (time, staff, resources) to provide training for them to use it.
next steps
9 States must have strategies in place to ensure their educators and other stakeholders have the skills and resources to use postsecondary outcome data for school improvement. State departments of education should work with local districts to identify school data teams that include principals, counselors, and teach-ers. Professional development should focus on helping these teams coordinate to bring lessons from data into the classroom. The most effective training will involve data teams working with the actual postsecondary data from their school.
9 State higher education coordinating boards and state departments of education must play a critical leader-ship role in emphasizing the importance of postsec-ondary attainment for their state’s long term stability and can lead the way in creating and maintaining valid, reliable, and useable data systems. Stakeholders, including external partners, can support the imple-mentation of the training and reinforce messaging around the value of college and career achievement.
Supporting educators
“Data is necessary but not sufficient,” says Brad Phillips of Cal-PASS. “You can have very accurate findings but still be wrong about what they mean. It takes focused review and strategic planning to use the data effectively.”
• Cal-PASS’s organized teams of faculty that meet once a month to review and respond to the data. Phillips explains, “This is where individual teachers re-alize their own students are struggling more than they’d thought, and they get a fire lit under them. Without that per-sonal realization, reform is very slow to come.” As of fall 2011, there are 1,000 faculty members participating on the review teams and sharing their find-ings with thousands more.
• Through a joint initiative by the Bill & Melinda Gates Foundation, MPR As-sociates, Inc., NSC, and the Strate-gic Data Project at Harvard, College Summit is delivering “Actionable Data Workshops” to teach school-based data teams how to use postsecond-ary outcome reports to continually plan and improve. Piloting the effort in Georgia, Texas, and Florida, the ini-tiative’s partners will conduct nearly 50 workshops in 23 districts by No-vember 2011.
• In the summer and fall of 2011, the American Association of School Ad-ministrators, College Summit, and NSC, with the support of the Bill & Melinda Gates Foundation, offered full-day workshops across the coun-try to school superintendents and other district leaders representing 225 school districts about how to interpret and act on the postsecondary out-come data for high schools that states will be reporting for SFSF. The work-shops included a careful study of the new policy, training on how to interpret and communicate data, and how to create college-going cultures in public high schools.

15
Se
izin
g t
he
Me
aS
ur
eM
en
t M
oM
en
t
ACtion #4: Reward districts and schools that improve students’ enrollment and postsecondary performance States should offer rewards and incentives to schools and districts that improve student postsecondary performance. Already states and districts are beginning to help educators focus on their students’ postsec-ondary outcomes, and to help parents and community members see which schools are making progress.
Race to the Top offered rewards. The program set college enrollment rate (CER) and credit accumulation rate (CAR) as success factors for grant funding. Of the 19 Race to the Top Phase Two finalists, all of them set concrete ambitious goals for increasing their CER, while 16 out of 19 articulated tangible CAR goals in their final applications.21
Oklahoma considers college remediation rates in reading and mathematics in calculating its high schools’ Academic Performance Index.22 In New York City, school progress reports use College Enrollment Rate and a College Readiness Index as scored metrics.23 Meanwhile the state of Missouri has identified college enrollment as one of the 14 standards required for state accreditation. 24
There are a host of ways that states can incentivize use of high school postsecondary performance data, but the key is that they draw attention to the data and steer attention and resources to its use.
next steps
9 To inform parents and educators, states should prominently publish CER and CAR rate trends by high school.
9 States should highlight and reward the schools that make the most progress achieving the largest CER and CAR trend improvements.
9 State policy makers should require CER and CAR as success measures for competitive grant and reward programs for high schools.
9 Each state department of education should include postsecondary outcome data, especially CER and CAR, in their high school performance reports.
Elementary and Secondary Education Act RecommendationsWhen reauthorizing the Elementary and Secondary Education Act, Congress has the opportunity to support state and district efforts to leverage postsecondary data to improve student achievement. In addition to continued support for the develop-ment of state longitudinal data systems, Congress should respond to community and parent demand for postsecondary outcome data.
Recommendation #1: Parent-Centered Measures Place in the hands of parents and communities a top-tier set of reporting measures on the issues parents care most about – easy to understand, meaningful outcome mea-sures that inform parents and communities on the prog-ress of their children’s schools:
• Math / English Achievement
• High School Graduation
• College Enrollment
• Credit Accumulation
Recommendation #2: Reward HighSchools for Postsecondary ProgressThrough competitive grant programs and incentive/reward programs, reward states and K-12 districts that improve students’ postsecondary achievement. In addition, allow states to select “postsecondary outcomes” as one of the required categories of improvement/diagnoses indicators for school improvement.

16
Se
izin
g t
he
Me
aS
ur
eM
en
t M
oM
en
t
It is rare that community stakeholders call so unani-mously for state action in an environment where states are so well-positioned to deliver. Educators, parents, and students want high school postsecondary performance data. Mayors, business leaders, and higher education in-stitutions are twisting themselves into pretzels to get it. But states are the ones who will benefit from the data the most, and can deliver it most effectively, efficiently, and fairly. Moreover, thanks to federal support, most states have already begun the hard work of building the infra-structure. All that remains is to finish the systems and share, translate, and reward smart use of the data.
If states do that, America’s high schools can once again prepare students for the challenges and opportunities they will face. Colleges and universities can then confer truly higher education, and employers can once again hire ready workers. At that point, states will be able to compete as they must, fostering strong communities and generating sufficient resources to invest wisely again for the future.
V. conclusionState Spotlight
The Kentucky Council on Postsecondary Education has linked statewide data to measure postsecondary performance and create “College And Career Readiness High School Feedback Reports.” The re-ports, available to the public on the Coun-cil’s website, provide graduation rates, ACT test score averages, AP test results, and postsecondary enrollment data by high school, with quick and easy compari-sons to district and state averages. The most recent data on the website is for the graduating class of 2008, with historical data from the classes of 2000, 2002, and 2004. State educators and policymakers have used the report to track progress and identify needs, especially in academic readiness. The report includes the rate at which students must take remedial cours-es upon postsecondary enrollment.
The latest report showed that 63 percent of Kentucky’s 2008 high school graduates enrolled in postsecondary education, up from 51 percent in 2004. Among those who enrolled, 38 percent needed remedial help, down from 45 percent. At that rate of improvement, local education policy ex-perts noted, it will take decades to elimi-nate the need for remedial courses in col-lege. Upon release of the last report, Bob King, President of the Kentucky Council on Postsecondary Education, said: “We are pleased with these gains, but we know that serious challenges remain. This report will help us identify where and how to make changes necessary to improve student success in the future.” 25
For expanded profiles of the progress Kentucky and other leading states are making, see DQC’s “Profiles from the Field” at: www.dataqualitycampaign.org/resources/field_profiles
Teams of faculty – known as Professional Learning Councils (PLCs) – examine Cal-PASS data and use findings to identify areas of improvement. For example, in California, English Language Arts frequently involves a wide range of curricula and expectations for different levels: it is often literature-based in K-12, grammar-based in community college, and rhetoric-based at the university level. A team trained postsecondary mentors to work with high school faculty on effective integration of the teaching of nonfiction, thus better preparing students for postsecondary success while still meeting the state K-12 standards.26
Making a Difference for Students
17
Se
izin
g t
he
Me
aS
ur
eM
en
t M
oM
en
t
Table A. The below table is a snapshot of progress as captured in the 2010 DQC survey and SFSF reports. New data will be available in the coming months.
ACtion #1: Improve the ability to measurestudents’ postsecondary success
State reports its P-12 system has the “capacityto communicate with higher education data system” (SFSF 2010 report)*
State reports the “Ability to link P-12 and postsecondary data” (DQC 2010 survey)*
Answered affirmative to one or both
Alabama X X X
Alaska X X X
Arizona X X X
Arkansas X X X
California
Colorado X X X
Connecticut
DC
Delaware X X X
Florida X X X
Georgia X X
Hawaii X X X
Idaho X X X
Illinois X X X
Indiana X X
Iowa X X X
Kansas X X X
Kentucky X X X
Louisiana X X X
Maine X X
Maryland X X
Massachusetts X X X
Michigan X X
Minnesota X X
Mississippi X X X
Missouri X X X
Montana X X
Nebraska
Nevada X X X
New Hampshire
New Jersey X X
New Mexico X X X
New York X X X
North Carolina X X

18
Se
izin
g t
he
Me
aS
ur
eM
en
t M
oM
en
t
State reports its P-12 system has the “capacity to communicate with higher education data system” (SFSF 2010 report)*
State reports the “Ability to link P-12 and postsecondary data” (DQC 2010 survey)*
Answered affirmative to one or both
North Dakota X X X
Ohio
Oklahoma X X
Oregon X X X
Pennsylvania X X X
Puerto Rico
Rhode Island X X X
South Carolina X X
South Dakota X X
Tennessee X X X
Texas X X X
Utah X X
Vermont X X X
Virginia X X X
Washington X X X
West Virginia
Wisconsin X X
Wyoming X X X
totAlS*** 33 41 44
* State Fiscal Stabilization Fund Annual Reports: Initial Annual Report (Feb 2009 through September 2010).
U.S. Department of Education, 2011. <http://www2.ed.gov/programs/statestabilization/annual-reports.html>.
** “State Analysis By Essential Element: Element 9, The Ability to Match Student-Level P-12 and Higher Education Data.”
Data for Action 2010. The Data Quality Campaign, 2010. <http://dataqualitycampaign.org/stateanalysis/elements/9/>.
***Several factors may lead to apparent discrepancies in responses: variations in the way survey and report questions
are worded, variations in respondents’ interpretations of questions, and ongoing state progress in implementation.

19
Se
izin
g t
he
Me
aS
ur
eM
en
t M
oM
en
t
endnotes1 Schneider, Mark and Lu (Michelle) Yin. “The High Cost
of Low Graduation Rates.” The American Institutes for Research, August 2011. <www.air.org/focus-area/education/index.cfm?fa=viewContent&content_id=1404>.
2 Carnevale, Anthony P., Nicole Smith and Jeff Strohl. Help Wanted: Projections of Jobs and Education Requirements through 2018. Georgetown University Center on Education and the Workforce, June 2010.
3 “The Output of Educational Institutions and the Impact of Learning.” Education at a Glance 2011: OECD Indicators. OECD, 2011. <www.oecd.org/dataoecd/61/47/48630299.pdf>.
4 Lewin, Tamar. “Once a Leader, U.S. Lags in College Degrees.” The New York Times. July 23, 2010. <www.nytimes.com/2010/07/23/education/23college.html>.
5 The Condition of Education 2011. National Center for Education Statistics, May 2011. <http://nces.ed.gov/pubs2011/2011033.pdf>.
6 “The Diploma to Nowhere.” Strong American Schools, 2008. <www.deltacostproject.org/resources/pdf/DiplomaToNowhere.pdf>.
7 State Fiscal Stabilization Fund Annual Reports: Initial Annual Report (Feb 2009 through September 2010). U.S. Department of Education, 2011. <www2.ed.gov/programs/statestabilization/annual-reports.html>.
8 Office of the Superintendent, Denver Public Schools. September 10, 2011. E-mail.
9 As used in this document, “Deloitte” means Deloitte LLP and its subsidiaries. Please see www.deloitte.com/us/about for a detailed description of the legal structure of Deloitte LLP and its subsidiaries.
10 “Key findings: Deloitte 2010 education survey.” Deloitte, 2010. <www.deloitte.com/assets/Dcom-UnitedStates/Local%20Assets/Documents/us_cr_deloitteeducationsurvey2010.pdf>.
11 Roderick, Melissa, Jenny Nagaoka, Vanessa Coca, and Eliza Moeller. “From High School to the Future: Potholes on the Road to College.” Consortium on Chicago School Research, 2008.
12 “Deloitte 2009 Education Survey Overview: Redefining High School as a Launch Pad.” Deloitte, 2009. <www.deloitte.com/assets/Dcom-UnitedStates/Local%20Assets/Documents/us_leadership_EducationSurvey120109.pdf>.
13 “College Summit provides data for high schools.” YourValleyVoice.com. September 8, 2011. <www.yourvalleyvoice.com/schools/news/article_b4ecfc86-cf42-11e0-a78e-001871e39d26.html>.
14 “Mayor Nutter’s Inaugural Speech.” philly.com. January 7, 2008. <http://media.philly.com/documents/NutterInauguralSpeechFinal.pdf in April 2011>.
15 Mossige, Terri. Personal interview. September 12, 2011.
16 “State Analysis by Essential Element: Element 9, The Ability to Match Student-level P-12 and Higher Education Data.” Data for Action 2010. The Data Quality Campaign, 2010. <http://dataqualitycampaign.org/stateanalysis/elements/9/>.
17 State Fiscal Stabilization Fund Annual Reports: Initial Annual Report (Feb 2009 through September 2010). U.S. Department of Education, 2011. <www2.ed.gov/programs/statestabilization/annual-reports.html>.
18 “Facilitating Development of a Multistate Longitudinal Data Exchange: Project Overview.” Western Interstate Commission for Higher Education. <www.wiche.edu/longitudinalDataExchange>.
19 EducationCounsel, LLC. “U.S. Department of Education’s Proposed FERPA Regulations: Overview and Initial Analysis.” Data Quality Campaign, April 12, 2011. <http://dataqualitycampaign.org/files/U.S.%20Department%20of%20Education’s%20Proposed%20FERPA%20Regulations_Overview%20and%20Initial%20Analysis.pdf>.
20 “State Analysis by Action: Action 9, Promote Educator Professional Development and Credentialing.” Data for Action 2010. The Data Quality Campaign, 2010. <http://www.dataqualitycampaign.org/stateanalysis/actions/9/>.
21 “Race to the Top and Postsecondary Outcomes: States’ Goals, Growth, and Game-plans.” College Summit, September 2010.
22 “Academic Performance Index (API).” Oklahoma State Department of Education. <http://sde.state.ok.us/acctassess/API.html>.
23 “Final Changes to High School Progress Reports for 2010-11.” New York City Department of Education, August 10, 2011. <http://schools.nyc.gov/NR/rdonlyres/598AC213-7C37-4257-9647-AA06570B3D18/0/201011FinalChangesHS2011_08_10.pdf>.
24 Understanding Your Annual Performance Report. Missouri Department of Elementary and Secondary Education, July 2011. <http://dese.mo.gov/divimprove/sia/dar/documents/qs-apr-understanding-your-apr-2011-2012.pdf>.
25 “Profiles from the Field: Measuring Readiness and Performance in Kentucky Postsecondary Education.” The Data Quality Campaign, 2010. <www.dataqualitycampaign.org/resources/field_profiles/KYccr>.
26 Phillips, Brad. July 26, 2011. E-mail.
20
Se
izin
g t
he
Me
aS
ur
eM
en
t M
oM
en
t
E. Kinney Zalesne is the co-author of the New York Times bestseller Microtrends and the Wall Street Journal column of the same name. From 2000 to 2004 she was president of College Summit. She is also the co-author of College Summit’s 2009 white paper, “The Promise of Proficiency: How College Proficiency Information Can Help High Schools Drive Student Success.”
J.B. Schramm is founder and CEO of College Summit. He was recognized at the World Economic Forum in Davos, Switzerland as the 2008 United States Social Entrepreneur of the Year by the Schwab Foundation. J.B. is the recipient of Honorary Doctorates of Public Service from Regis University and the Université catholique de Louvain. He serves as an Aspen Institute – New Schools Education Fellow, and as a member of the Kennedy School of Government’s Executive Session on Transforming Cities Through Civic Entrepreneurship. He is a graduate of Denver Public Schools, Yale University, and Harvard Divinity School.
acknowledgements
about the authors
The conclusions and recommendations presented in this report are those of College Summit and do not necessarily represent the views of the funders, reviewers, or original researchers.
College Summit would like to thank the individuals and organizations who contributed to this report: The Data Quality Campaign has done comprehensive work, capturing and disseminating data about state progress on these issues. A special thank you goes to Lyndsay Pinkus and Laura Sonn for their many hours of dedicated study of the data for this paper and their thoughtful insights on translating it into recom-mended actions.
College Summit is deeply appreciative of not only the time these data pioneers committed to be interviewed for this project, but for their dedication to using postesecondary to make a difference for students in their communities: Dr. Lori Shorr and Terri White, Philadelphia Mayor’s Office of Education; Dr. Nate Easley and Louise Myrland, Denver Scholarship Foundation; Dr. Brad Phillips and Dr. Shelly Valdez, Cal-PASS.
Thank you to the following leaders in the field who offered feedback about initial drafts: Maria Ferguson and Tara Tucci, Alliance for Excellent Education; Bryan Joffee and Noelle Ellerson, American Association of School Administrators; Rick Hess, American Enterprise Institute; Bob Campbell, Deloitte LLP; Ryan Reyna, National Governors Association; Rich Tafel, Public Squared.
And finally, thank you to Cassius Johnson who helped initiate this project at College Summit, and to Meg Steele and Vanessa Lillie who guided it to publication.
College Summit is grateful to Deloitte for their generous support of this initiative.


About College Summit and Deloitte. Through education and workforce research, and
on-the-ground work in communities with students and schools, Deloitte and College
Summit have built a case for elevating the purpose of high school. The momentum for
that shift will come when every parent and educator in America knows how effectively
their high school is sending students to college who succeed in their coursework, and
when high schools receive rewards for their students’ postsecondary progress.
About College Summit. College Summit is the national organization that partners with low-income high schools, districts, and states to strengthen college-going culture and increase college enrollment and success rates. The organization trains principals, teachers and the most influential students in the school to put every student on the college-ready path. College Summit works in partnership with 170 high schools in 12 states.
About Deloitte. As used in this document, “Deloitte” means Deloitte LLP and its subsidiaries. Please see www.deloitte.com/us/about for a detailed description of the legal structure of Deloitte LLP and its subsidiaries.
College Summit | 1763 Columbia Rd., NW | Washington, DC 20009 | www.collegesummit.org