SEISMIC VULNERABILITY OF PRE-NORTHRIDGE COLUM N SPLICES … · ons in steel -repaired co he pre-Nor...
12
SE Carm ABSTR The M 6 connecti then, un events. T feature l the regio elevated Th above th through through exceedin framewo fracture. INTRO Fracture professio fractures Subsequ 96-01, 1 result of sharp fla Beam to demands connecti construc Joint Ve as well attention connecti 1 Lecturer 2 Undergr 3 Graduat 4 Associa EISMIC V mine Galasso RACT 6.7 1994 No ions in steel -repaired co The pre-Nor ow-toughnes on of low m d seismic haz his paper ex hree factors a sophisticate probabilistic ng various ork. The ana ODUCTION in Welded onal and rese s were disc uently, coordi 996) includi f low toughn aws into high o Column (W s (i.e. near t ions has been ction (e.g., A enture, 2000) (e.g. Welde n afforded to ions. r, Newcastle U raduate Resear te Research As ate Professor, U VULNER SPLICE o 1 , Christian orthridge ear moment fram lumn splice rthridge splic ss welds (2) material toug ard due to lo xplores the fr and consider ed fracture-m c seismic de fracture-rela lysis indicat N d Steel Mom earch commu covered in s inated resear ing experime ness material hly stressed r WBC) conne the plastic h n the focus AISC 341-10; ). These guid ed Column S o these othe University, Ne rch Assistant, U ssistant, Unive University of C RABILITY ES IN STE n ELTIT 2 , K rthquake rev mes. While m connections ce connectio they have P ghness, and ow-magnitud racture fragi ring a 4-story mechanics fi emand analy ated outcom es that splice ment Resist unities since several SMR rch efforts (e ental and ana ls used in co regions. A la ections, whic hinge region of intensive AISC 2010 delines have Splice – WC er connectio wcastle upon Universidad Té ersity of Califo California, Dav 1 Y OF PRE EEL MOM Kimberly ST vealed defici many of the s in these fra ons are espe artial Joint P (3) being fo de, frequent e lity of these y case-study inite elemen ysis in order mes, in a P es in pre-No ting Frames the M 6.7 19 RFs in the e.g. the SAC alytical studi ombination w arge majority ch are locat of the beam study, culm ), as well as impacted the CS, and base ns has been Tyne, carmine écnica Federic ornia, Davis, C vis, CA, USA E-NORTH MENT F TILLMAKE iencies in W WBC conne ames may be ecially conce Penetration ( orce-controll events. splices thro y building. T nt simulation to compute Performance- orthridge fram s (WSMFs) 994 Northrid Los Angel Steel Projec ies determin with poor de y of these frac ed in the ar ms). As a res minating in m guidelines f e design of o e plate conn n relatively m e.galasso@ncl o Santa María CA, USA, kstı A, kanvinde@u HRIDGE RAMES ER 3 and Am Welded Beam ections have e susceptible erning for th PJP) welds, led, they exp ough a rigoro he first two ns. The third the mean a -Based Eart mes may be has been dge earthquak les region ( ct, Kaufman ed that the th tailing pract ctures were d rea of high i sult, fracture more stringen or retrofit (e other seismic nections). Ho modest, in c l.ac.uk , Valparaiso, C ıllmaker@ucd ucdavis.edu E COLUM mit KANVI m to Column been retrofit e to fracture hree reasons introducing perience a s ous evaluatio factors are e d factor is e annual frequ thquake Eng highly susce a major co ke, after whi (e.g., Mahin & Fisher, 19 hese fracture tice which in discovered in inelastic def e mitigation nt guidelines .g., FEMA 3 c WSMF con owever, the comparison Chile, celtit@g avis.edu MN NDE 4 n (WBC) tted since in future (1) they a flaw in omewhat on of the examined examined encies of gineering eptible to ncern of ich brittle n, 1998). 995; SAC es were a ntroduced n Welded formation in WBC s for new 354: SAC nnections research to WBC gmail.com
Transcript of SEISMIC VULNERABILITY OF PRE-NORTHRIDGE COLUM N SPLICES … · ons in steel -repaired co he pre-Nor...

SE
Carm
ABSTR
The M 6connectithen, unevents. Tfeature lthe regioelevated
Thabove ththrough through exceedinframewofracture.
INTRO
Fracture professiofracturesSubsequ96-01, 1result ofsharp flaBeam todemandsconnecticonstrucJoint Veas well attentionconnecti
1 Lecturer2 Undergr3 Graduat4 Associa
EISMIC V
mine Galasso
RACT
6.7 1994 Noions in steel -repaired coThe pre-Norow-toughneson of low m
d seismic hazhis paper exhree factors a
sophisticateprobabilistic
ng various ork. The ana
ODUCTION
in Weldedonal and reses were discuently, coordi
996) includif low toughnaws into higho Column (Ws (i.e. near tions has beenction (e.g., Aenture, 2000)(e.g. Welde
n afforded toions.
r, Newcastle Uraduate Researte Research Asate Professor, U
VULNERSPLICE
o1, Christian
orthridge earmoment framlumn splice rthridge splicss welds (2)
material tougard due to lo
xplores the frand considered fracture-mc seismic defracture-relalysis indicat
N
d Steel Momearch commucovered in sinated researing experimeness materialhly stressed rWBC) connethe plastic hn the focus
AISC 341-10;). These guided Column So these othe
University, Nerch Assistant, Ussistant, UniveUniversity of C
RABILITYES IN STE
n ELTIT2, K
rthquake revmes. While mconnectionsce connectiothey have P
ghness, and ow-magnitudracture fragiring a 4-storymechanics fiemand analyated outcomes that splice
ment Resistunities since several SMRrch efforts (eental and anals used in coregions. A laections, whic
hinge region of intensive AISC 2010
delines have Splice – WCer connectio
wcastle upon Universidad Téersity of CalifoCalifornia, Dav
1
Y OF PREEEL MOM
Kimberly ST
vealed deficimany of the s in these fraons are espeartial Joint P(3) being fo
de, frequent elity of thesey case-studyinite elemenysis in order mes, in a P
es in pre-No
ting Framesthe M 6.7 19
RFs in the e.g. the SAC alytical studiombination warge majoritych are locatof the beamstudy, culm
), as well as impacted the
CS, and basens has been
Tyne, carmineécnica Federicornia, Davis, Cvis, CA, USA
E-NORTHMENT F
TILLMAKE
iencies in WWBC conne
ames may beecially concePenetration (orce-controllevents. splices thro
y building. Tnt simulation
to compute Performance-orthridge fram
s (WSMFs) 994 Northrid
Los AngelSteel Projec
ies determinwith poor dey of these fraced in the ar
ms). As a resminating in m
guidelines fe design of oe plate conn
n relatively m
e.galasso@nclo Santa María
CA, USA, kstıA, kanvinde@u
HRIDGERAMES
ER3 and Am
Welded Beamections have e susceptibleerning for thPJP) welds,
led, they exp
ough a rigorohe first two
ns. The thirdthe mean a
-Based Eartmes may be
has been dge earthquakles region (ct, Kaufman ed that the thtailing practctures were drea of high isult, fracture
more stringenfor retrofit (eother seismicnections). Homodest, in c
l.ac.uk , Valparaiso, Cı[email protected]
E COLUM
mit KANVI
m to Columnbeen retrofit
e to fracture hree reasons introducing
perience a s
ous evaluatiofactors are e
d factor is eannual frequthquake Enghighly susce
a major coke, after whi(e.g., Mahin& Fisher, 19hese fracture
tice which indiscovered ininelastic defe mitigation nt guidelines.g., FEMA 3c WSMF conowever, the comparison
Chile, [email protected]
MN
NDE4
n (WBC) tted since in future (1) they
a flaw in omewhat
on of the examined examined encies of gineering eptible to
ncern of ich brittle n, 1998). 995; SAC es were a ntroduced n Welded formation
in WBC s for new 354: SAC nnections
research to WBC
gmail.com

C. Galasso, C. Eltit, K. Stillmaker and A. Kanvinde 2
The study presented in this paper focuses on Welded Column Splice (WCS) connections, which are commonly used in WSMFs owing to length/transportation constraints or downsizing of the columns in higher stories of the structure. Figure 1 illustrates a pre-Northridge WCS connection and its function within a MRF structure subjected to dynamic excitation. The pre-Northridge connections used Partial Joint Penetration (PJP) welds, with weld penetration in the range of 40-60% of the smaller connected flange. Previous experimental studies by Bruneau and Mahin (1991) and fracture mechanics Finite Element (FE) simulation studies (Nuttayasakul, 2000) suggest that (1) WCS connections (especially those with PJP welds such as shown in Figure 1) are susceptible to fracture due to the presence of the crack-like flaw in the unfused region of the flange weld, and (2) the connections may be considered “force controlled” (Shen et al., 2010), such that their fracture is controlled by the tensile stress in the flange. The singular study investigating demands in column splices was conducted by Shen et al., (2010). Shaw et al., (2014) subsequently adapted the findings of the Shen et al., (2010) study to develop a loading protocol for experiments on WCS connections. The focus of this study is similar to the Shen et al., (2010) study, i.e. it seeks to provide a characterization of demands in the splices. However, the distinguishing the current study aims (1) to develop a rigorous, probabilistic assessment of seismic demand (expressed in terms of local flange stress) in the WCS flanges, within the established framework for Performance-Based Earthquake Engineering (or PBEE, e.g., Cornell and Krawinkler, 2000; Deierlein et al., 2003; among others), and (2) to evaluate the estimated demands in the context of splice capacities implied by experimental and computational fracture mechanics research (Shaw et al., 2014; Stillmaker et al., 2014), resulting in the development of fracture fragilities for various WCS configurations.
Figure 1. The problem of fracture in pre-Northridge column splices
In the context of WCS connections, probabilistic seismic demand hazard is particularly useful,
since commonly used indicators of seismic intensity, such as the (pseudo) spectral acceleration at or near the fundamental period of the structure and for a damping ratio of 5%, 1TSa may not be effective predictors of forces in these components, as also shown for braced frame connections (Victorsson et al., 2011). Despite the additional effort to perform seismic response analyses at multiple intensity-levels, the probabilistic assessment conducted in this study rigorously may resolve this, by convolving the uncertainty in the estimates of expected seismic intensity, along with the uncertainty in structural response conditional on this intensity, resulting in improved and robust estimates of local stress hazard. More in general, the seismic demand hazard is a more robust measure for quantifying seismic performance, where seismic hazard is represented in a probabilistic format where all ground motion intensity values in its domain can occur (although obviously some with a greater likelihood than others), than intensity-based assessment, which remain prevalent in seismic design codes (Bradley, 2013).
Per points (2) and (3), the current study also benefits from recent experimental and computational work by Shaw et al., (2014) and Stillmaker et al. (2014), which has resulted in methods to characterize the strength capacity of splices and to account for the different sources of uncertainty involved in such a capacity model. The implication is that the probabilistic demand assessments (as
Shaking moment frame
Upper Column
Lower Column
PJP detail Sharp crack
Weld
Column flange
C. Galasso, C. Eltit, K. Stillmaker and A. Kanvinde 3
outlined above) are not merely academic, but provide the opportunity for realistic characterization of component fragilities with the ultimate objective of providing guidelines for design and retrofit.
Probabilistic seismic demand analysis
Referring to prior discussion, the demand assessment for the WCS connections is carried out by probabilistic seismic demand analysis (PSDA; e.g., Shome, 1999). PSDA is an approach within the overall framework of PBEE, for computing the mean annual frequency (or annual probability) of exceeding a specified seismic demand, or Engineering Demand Parameter - EDP (such as a force, stress, or displacement), for a given structure (or a structural component) at a designated site. Analogous to a ground motion hazard curve computed by Probabilistic Seismic Hazard Analysis (PSHA; e.g., McGuire 2004), the principal result of PSDA is a structural demand hazard curve for multiple levels of seismic response (i.e., from elastic to collapse behavior).This is especially useful for multi-objective structural performance evaluation. In short, PSDA combines a ground motion hazard curve in terms of an Intensity Measure - IM (e.g., spectral acceleration) for the designated site, typically computed via PSHA, with the demand results from nonlinear dynamic analysis (NLDA for short) of the given structure under a suite of earthquake ground motion records, accounting for the Record-To-Record (RTR) variability. The approach is an application of the "total probability theorem", which is also at the foundation of PSHA. PSDA is expressed mathematically in Eq. (1) (e.g., Cornell & Krawinkler 2000).
xdxyGy IMIMEDPEDP || (1)
The mean annual frequency (MAF for short) of EDP exceeding the value y, or the EDP hazard, is denoted yEDP ; likewise, xIM is the ground motion hazard in terms of IM (evaluated at x), and
xd IM denotes its differential with respect to IM (also evaluated at x). In simplistic terms, xd IM
is the (annual) probability of observing a particular ground motion intensity. The term xyG IMEDP ||
which is customarily estimated using NLDA results for a suite of earthquake records, denotes the probability of EDP exceeding the value y given (i.e., conditioned on knowing) that IM equals x, i.e., s the Complementary Cumulative Distribution Function (CCDF) of EDP|IM. xyG IMEDP || accounts
for the variability of structural demand given the level of ground motion intensity, which is due to differences among ground motions. A structural demand hazard curve computed via Eq. (1) can be used in a performance-based design or evaluation, for example, to make decisions about the adequacy of a structural design or the need to retrofit an existing structure. Yet another notable application of PSDA is structure-specific expected-loss estimation, which can be accomplished by combining a demand hazard curve with demand-to-damage and damage-to-cost relationships.
The framework equation of PSDA, adapted to the specific situation of WCS connections and converting the integral into a discrete summation (for numerical calculation), is given in Eq. (2) below:
i
aD
xiSiaD xxSyPy
all
| (2)
The assumed EDP is the estimated stress in each tension flange based on sectional analysis, D
, while 1TSa , simply aS hereafter, is the assumed IM. Similarly to Eq. (1), in Eq. (2) zD is the
annual frequency of exceeding a given D value y, iS xa
is the annual frequency of exceedance of
a given aS value xi, i.e., the ground motion hazard curve, and 1 iSiSiS xxxaaa
is
approximately the annual frequency of ia xS . The final element of this equation is

C. Galasso, C. Eltit, K. Stillmaker and A. Kanvinde 4
iaD xSzP | , analogous to xyG IMEDP || , i.e., the probability of exceeding a specified D level,
given a level of aS . T As per current design provisions (i.e. AISC 341; AISC, 2010), WCS connections in IMFs and
SMFs are prescriptively designed to have CJP welds with overmatched filler materials, thereby forcing yielding in the column flange. The implication is that they need not be explicitly designed for a given stress or force. However, as discussed earlier, recent research by Shaw et al. (2014) suggests the possibility of PJP welded splices, which are not (by default) stronger than the attached column flanges, implying that design thresholds must be explicitly articulated. For example, the design stress value,
design , corresponding to a suitable MAF of exceedance may be determined from the results of Eq. (2).
In contrast to arbitrary design thresholds (such as requiring the splice to yield the smaller column), this approach ensures a consistent level of hazard (i.e., probability of exceedance associated with design )
across all splice configurations. For example, as shown by Shen et al., (2010) and subsequently by Shaw et al., (2014), WCS flange stresses in low-rise (4-story) buildings are fairly low (< 50% of yield), even under extreme (i.e. 2/50, 2% probability of exceedance in 50 years) levels of shaking; perhaps it is excessively stringent to require WCS connections in these buildings to develop yielding in the smaller column.
The results of PSDA (i.e., yD ) can be used to compute the MAF of exceeding a specified
limit state, often referred to as an "annual limit-state frequency" (e.g., Luco, 2002). The term limit state refers to any undesired condition, which may lead to some unacceptable situation, e.g., the fracture limit state for a given splice or splice flange. Similar to y
D , this type of information may
be used to make informed judgments about appropriate design loads and retrofit approaches, especially for existing buildings/WCS connections. However, the preliminary investigation discussed in this paper simply focuses on the estimation of the conditional probability of exceeding the fracture threshold (i.e., the structural capacity) for a given value of IM. This quantity is known as structural fragility and its computation requires in general the characterization of a random valued capacity with the same units as EDP (i.e., flange stress). Probabilistic estimation of structural capacity is not within the scope of this paper; therefore, fragility is simply defined here by deterministic values the stress capacity, C , derived from the work of Stillmaker et al., (2014). These capacity values, which are specific to each splice configuration (i.e. flange sizes, weld penetration) are based, on a series of full-scale experiments on column splices (Shaw et al., 2014), as well as a set of fracture mechanics FE simulations, coupled with a plain Monte Carlo simulation, to incorporate randomness in material toughness, constitutive response and model-fitting. This allows the integration of results from hi-fidelity fracture mechanics modeling and experiments with the PBEE framework to provide meaningful (and realistic) estimates of component fragility.
The next two sections in this paper roughly follow the modular structure of the framework Equation, one describes the NLDA simulations (including the building models and ground motions), while another describes the fragility calculation and capacity model.
NONLINEAR DYNAMIC ANALYSIS SIMULATIONS
The first step in assessing fracture fragility by using the PBEE approach described above is the estimation of the probability distribution of structural response at a given IM level, i.e., xyG IMEDP ||
in Eq. (1) and iaD xSyP | in Eq. (2). This conditional probability can be predicted through alternative nonlinear-dynamic analysis procedures (Jalayer and Cornell, 2009). In particular, seismic demand for the case-study building is evaluated here through incremental dynamic analysis (IDA; Vamvatsikos and Cornell, 2002). In IDA, the building analytical model is subjected to a selected ground motion set while tracking the response of the structure, particularly the flange tensile stress,
D . Each input ground motion is scaled to increasing levels of intensity until collapse occurs, as
indicated by runway interstory drifts. In this study the ground motion intensity is scaled by aS

(selectedresponse
Buildin
A generithis studthe SACmodel bushorter bconstrucCalifornReductioShaw (2locationsinterior W14X25
Th
Simulatiseveral p Th
inwseofasan
Fiar
G Se
inelastic the locatthe contebending
d IM); scaline to severe gr
ng Models
ic 4-story frady. This strucC model build
uilding was rbuildings). T
cted for a ginia region, aon Program 2013). Figures of the splisplices con
57 to W14X3
Figu
he simulatioion (OpenSephysical aspehe use of fib
nteraction andith kinemati
et of plastic hf the modulussumed equand the post-yinite joint sizre sensitive toeometric non
everal EDP rotations aretions of the sext of this stuand axial fo
C. Gala
ng ground mround motion
ame (from a cture is identdings (Guptareplaced by aThe frame hiven seismicassuming fir- site catego
e 2 shows thices (located
nnect W14X342.
ure 2. Schema
ons were conees, http://opects of structber sections d the spread c hardening.
hinge responus of elastic
al to 55 ksi toyield (i.e. harzes were modo its distancenlinearity, i.e
were monite of interest splices (specudy and usedorce (due to
asso, C. Eltit,
motion recordns for which
larger set oftical to the fia and Krawina 4-story buihas fundamecity (and typrm soil conory D). Morhe building ud 4 feet from
X342 section
atic illustration
nducted by mpensees.berkural responsfor simulatioof plasticity. Material pase compiled
city of steel,o account fodening) slopdeled. This ise from the ene. − and
tored during for many strifically in thd in the fractoverturning
K. Stillmaker
ds to increas there are a l
f three generirst frame usenkler, 1999), ilding to accoental periodpical gravitynditions (i.ee details reg
used for the m the top suns to W14X
n of 4-Story S
means of thkeley.edu/inde. The specifon of the be. The fiber searameters wepreviously b E, is equal
or material ope is assumeds especially i
nd of the colu−Δ effects w
the NLDAructural systehe flange regiture risk analeffects) con
r and A. Kanv
ing aS levelimited numb
ric frames wied by Shen ewith the onl
ommodate thds of 0.93s. y loading) c., NEHRP
garding the bNTH simulaurface of the
X426, where
MRF (arrow i
he Open Sysdex.php/) sofic modelingeams and colections utilizere calibratedby Lignos et l to 29,000 verstrength w
d equal to 1.7important sinumn (at the bwere modeled
A simulationsems, the timeions) are detlysis discussentribute to th
vinde
els allows usber of record
ith 4-, 9- andet al., (2010)ly differencehe splice (wh
The frame onsistent wi- National
building desations in thise beam in theas the exte
indicates splic
stem for Earftware whic
g consideratiolumns to rep
zed a bilineard to match aal., (2011). ksi while thwith respect7% of the inince flexural beam face). d.
s. While thee histories oftermined to bed above. In
he longitudin
to simulate dings.
d 20- story) i), and is adape that the 3-sthich is uncom
was assumith the Los Earthquake igns can be s study, incluhe lower sto
erior splices
ce locations)
rthquake Engch is able tons includedpresent axialr steel materia comprehenThe calibrate
he yield stret to specifieditial elastic mdemands at t
e interstory f longitudinalbe the most cparticular, s
nal stress, eac
5
building
is used in pted from tory SAC mmon for
med to be Angeles, Hazards found in
uding the ory). The
connect
gineering to model
d: l-moment ial model
nsive data ed values ss, Fy, is
d strength modulus. the splice
drift and l stress at critical in ince both ch flange

C. Galasso, C. Eltit, K. Stillmaker and A. Kanvinde 6
within each splice is subjected to a different stress history. Recognizing this, the time history of the longitudinal stresses at the extreme fiber of the splices (in the smaller connected column) was monitored for each flange within each splice, for each of the NLDA runs.
Ground Motions
This study utilizes a set of 35 ordinary ground motions from the Pacific Earthquake Engineering Research (PEER) database (http://peer.berkeley.edu/peer_ground_motion_database). In particular, the set used in this study is based on the FEMA P695 (ATC, 2009) far-field ground motion set, which includes 22 record pair, each with two horizontal components for a total of 44 ground motions. As the wavelet classification algorithm by Baker (2007) showed that nine of these ground motion records have pulses in the velocity history (Champion and Liel, 2012), these pulse-like record were then removed from the far-field database since investigating the effect of near-fault directivity on seismic demand is outside the scope of this study.
Figure 3. IDA results for 4-story building and thei summarization into 16, 50, 84% fractile IDA curves: interior splices

C. Galasso, C. Eltit, K. Stillmaker and A. Kanvinde 7
Results of NLDA
As an example, Figure 3 shows IDA results for the 4-story building subject to the suite of ground motions described above; only results for the interior splices are shows in the Figure 3 for brevity but similar trends were observed for the exterior splices. IDA results are presented as D values versus
aS for each record (grey circles) and can be further summarized into the 16, 50 (i.e., the median), 84%
fractile IDA curves by estimating the respective percentile values given the range of aS values (refer to the legend). In particular, multiple stripes of data are shown in Figure 3 using the suite of 35 ground motions scaled to 25 spectral acceleration levels between 0.1g and 2.5g (step 0.1g), i.e., a total of 875 runs was carried out. It is interesting noting that the IDA curves saturate rapidly as the intensity measure increases, suggesting that yielding in the structure (i.e. in the ductile beams) limits the maximum stress in the splices. Also shown on the curves, via dashed horizontal lines, are the anticipated critical or failure stresses (i.e., the capacity), C ; these have been determined through fracture mechanics analysis and form the focus of a subsequent section.
To estimate the conditional distribution of D for a given aS value from this data, one can estimate the sample mean and standard deviation of the responses first (e.g., Baker, 2005) and use these values to fit a distribution (method of moments). For example, a common assumption is to fit a normal distribution to lnEDP values, i.e., assuming a lognormal model for the conditional distribution of aD S| . It is apparent visually that the standard deviation of lnEDP is not constant over the range of IM considered here. Similarly, it can also be shown that the mean value of lnEDP is not a linear function of lnIM (as usually assumed for example in the cloud method; Jalayer and Cornell, 2009).
Alternatively, one can simply fit an empirical Cumulative Distribution Function (CDF) to represent the data distribution, i.e., the probability of exceeding an EDP level y is estimated by simply counting the fraction of records that cause a response larger than y. This latter method has the desirable property that that no assumptions are made regarding distributions or functional relationships between EDP and IM—the data provides all of the information. The eliminated assumptions have a cost, however: more data are typically needed to characterize well the conditional distributions. In addition, empirical distributions have can have difficulties estimating extreme values. For example, an empirical distribution estimates zero probability of exceeding the largest response value observed, while we might expect larger values to in fact be possible (Baker, 2005).
Results from IDA will be used to derive fragility curves (next section), defining the probability of fracture as a function of the spectral intensity.
FRAGILITY ANALYSIS
In PBEE assessment, a fragility function generally specifies the probability of collapse, or some other limit state of interest, of a structure (or a structural/nonstructural component) as a function of some ground motion intensity measure, IM (Baker, 2014). The parameter IM is often quantified by spectral acceleration with a specified period and damping (as in this study), though any measure of ground motion intensity can be used. Fragility functions obtained from structural analysis results are increasingly popular in structural assessment procedures; as discussed in the introduction, an estimated fragility function can also be combined with a ground motion hazard curve to compute the mean annual limit-state frequency.
Once the seismic demand (and its statistics) has been characterized from NLDA results, as described in the previous section, it is possible to compute the fracture fragility for a given splice/splice flange. In the case of a deterministic value for C , as in this study, one can assume a
lognormal distribution for aD S| and assuming C independent of aS - these are common assumptions that have been confirmed as reasonable in many past studies. The structural fragility can then be calculated as in Eq. (3):

C. Galasso, C. Eltit, K. Stillmaker and A. Kanvinde 8
a
aCaCD S
SSP
lnln
1| (3)
where is the standardized Gaussian CDF, and are conditional median and standard
deviation (dispersion) of the natural logarithm of D given aS and can be computed from the IDA results as discussed in the previous section. It is worth noting that one should also account for records that cause collapse of the structure, for example by first estimating the probability of collapse as the fraction of records in a stripe that cause collapse, and then fitting a parametric (e.g., lognormal) distribution only to the remaining records that do not collapse. However, this issue has not been addressed in the preliminary investigation discussed here.
As an example, the fragility calculation is graphically illustrated in Figure 4 for the top flange of splice no. 2. The figures shows the fitted lognormal Probability Density Functons (PDFs) of the demand (black solid lines), based on the IDA results (grey circles), for four aS levels equal to 0.5g ,
1g , 2g and 2.5g. By definition of PDF, the probability aCD SP | for each of the four aS levels,
is given by the yellow area below those PDFs from the deterministic capacity C value (equal to 15.442 ksi for interior splices; next sub-section for details) to infinity. The values of this area range from 0.0278 (when aS = 0.5g) to 0.9841 (when aS = 2.5g), as expected by visually inspecting Figure 4.
If C is a random variable, the probability term aCD SP | in Eq. (3) can be derived as (Pinto et al., 2004), Eq. (4):
0
|1| dxxfxFSPCaD saCD (4)
Figure 4. Example of fragility calculation; splice no. 2 - top flange
aD sF | is the CDF of D given aS , assumed lognormal as in the case of deterministic capacity
and with parameters derived from the IDA results for each intensity level. The CDF (and the corresponding PDF) of C ,
Cf , may be parameterized in terms of their moments, such as the mean
and coefficient of variation, and associated to a given distribution model. In turn, these may be derived from experimental data and fracture mechanics analysis. The derivation of these is outside the scope of this paper (for details, refer Stillmaker et al., 2014). However, the basic process is briefly described here for context and completeness.
0 5 10 150
0.1
0.2
0.3
σD
|Sa(T
1)
PD
F
Sa(T
1) = 0.5 g
5 10 15 20 250
0.1
0.2
0.3
σD
|Sa(T
1)
PD
F
Sa(T
1) = 1 g
P(σD
>σC
|Sa)
10 20 30 40 500
0.1
0.2
σD
|Sa(T
1)
PD
F
Sa(T
1) = 2 g
P(σD
>σC
|Sa)
10 20 30 40 50 600
0.1
0.2
σD
|Sa(T
1)
PD
F
Sa(T
1) = 2.5 g
P(σD
>σC
|Sa)

C. Galasso, C. Eltit, K. Stillmaker and A. Kanvinde 9
Capacity characterization
A criterion for splice fracture may be derived from fracture mechanics (Anderson, 1995), which requires that, for fracture to occur, the fracture toughness demand must exceed the corresponding fracture toughness capacity. A relationship between the applied stress and the local fracture toughness demand (such as the stress-intensity factor IK may be established by fitting functional forms (outlined by Rooke and Cartwright, 1976; Kumar et al., 1981) to data from parametric FE simulations. Such FE simulations have been conducted by Stillmaker et al., (2014). The capacity, on the other hand, may be correlated with the Charpy V-Notch (CVN) toughness value (Barsom and Rolfe, 1999), or determined from a review of literature (Nuttayasakul, 2000). The resulting failure criterion (Eq. (3) and Eq. (4)), may be expressed in the generic form shown below, i.e. –
CVNtt
w
a bottomflange
topflangeCCD ,,, (5)
where ,w
a top
flanget , and bottomflanget are respectively the ratio of flaw dimension to flange width, and the
thickness of the flanges in the top and bottom columns. The right hand side of Eq. (5), i.e., C , may be interpreted as the “available” stress capacity of the flange, given the material toughness, crack length, and other geometric characteristics. The following relationship (based on FE simulations and fracture mechanics analysis by Stillmaker et al., 2014) may be used for the determination of C –
bottomflange
topflange
bottomflange
topflange
ICbottomflange
topflangeCC
t
tj
w
ah
t
tg
w
afa
KCVNntt
w
a
,,,, (6)
In Eq. (6):
12.125.03.42
w
a
w
a
w
af (7)
1192.0114.6
2
bottomflange
topflange
bottomflange
topflange
bottomflange
topflange
t
t
t
t
t
tg (8)
10003.00021.0003.0 222
2
ICICIC Kw
aK
w
aK
w
ah (9)
175.2063.0004.0
22
2
bottomflange
topflange
bottomflange
topflange
ICbottomflange
topflange
ICbottomflange
topflange
t
t
t
tK
t
tK
t
tj (10)
The derivation of the above formulas is beyond the scope of this paper. However, it suffices to
say that rigorous and well-established methods for fracture mechanics simulations, as well as parametric fitting (refer Anderson, 1995) have been employed to derive them. Moreover, these have been validated against component-scale experimental data by Shaw et al., (2014). Thus, given the values of all the parameters on the right hand side (including columns geometry), an estimate of the available stress capacity for a given splice detail may be computed. In particular, a review of contemporaneous literature (Nuttayasakul, 2000) was used to establish the toughness values; a value
of inksi 70IK was selected. This results in ksi 4.15C and ksi 5.20C for interior and
C. Galasso, C. Eltit, K. Stillmaker and A. Kanvinde 10
exterior splices respectively, as anticipated in the previous sections. Once determined, these values provide a basis for assessment of the demands characterized in the previous section, and ultimately for the assessment of fracture probabilities of the splices. This is now discussed.
RESULTS AND DISCUSSION
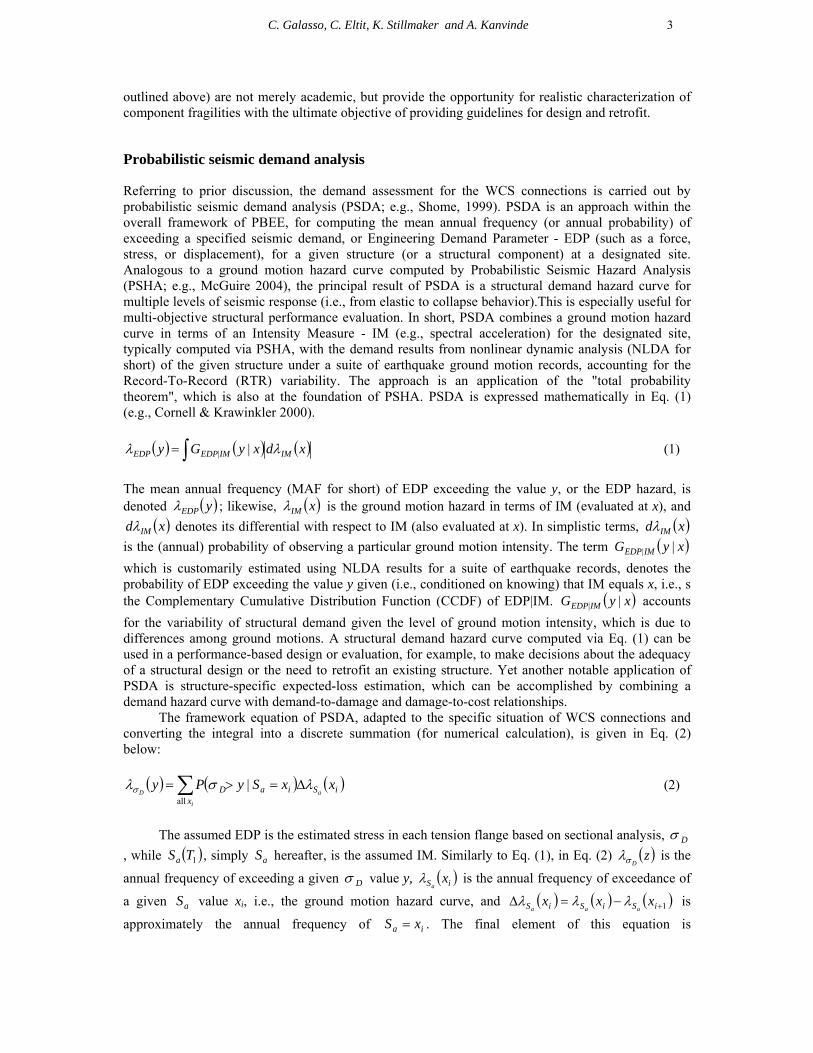
Combining all the results discussed above, i.e., the probabilistic characterization of the stress demands in each splice flange (from IDA results) and the capacity values for interior and exterior splices derived in the previous section, one can use Eq. (4) to compute the fracture fragility for each splice flange, i.e., aCD SP | for each aS value between 0.1g and 2.5g, eventually interpolating for intermediate values of interest. This results in the fragility curves shown in Figure 5, where the left panel refers to exterior splices and the right panel to interior splices. Since exterior and interior splices are characterized by similar values of the stress demand (i.e., similar distributions for aD S| ), the difference in their capacities results in high fracture vulnerability for the interior splices, i.e. those characterized by a lower value of C .
For instance, a probabilistic performance objective can be expressed - in terms of these fragility curves - by ensuring that the probability of structural demand reaching or exceeding structural capacity is smaller than or equal to a tolerable probability, P0.
Figure 5. Fracture fragility curves for exterior splices (left) and interior splices (right)
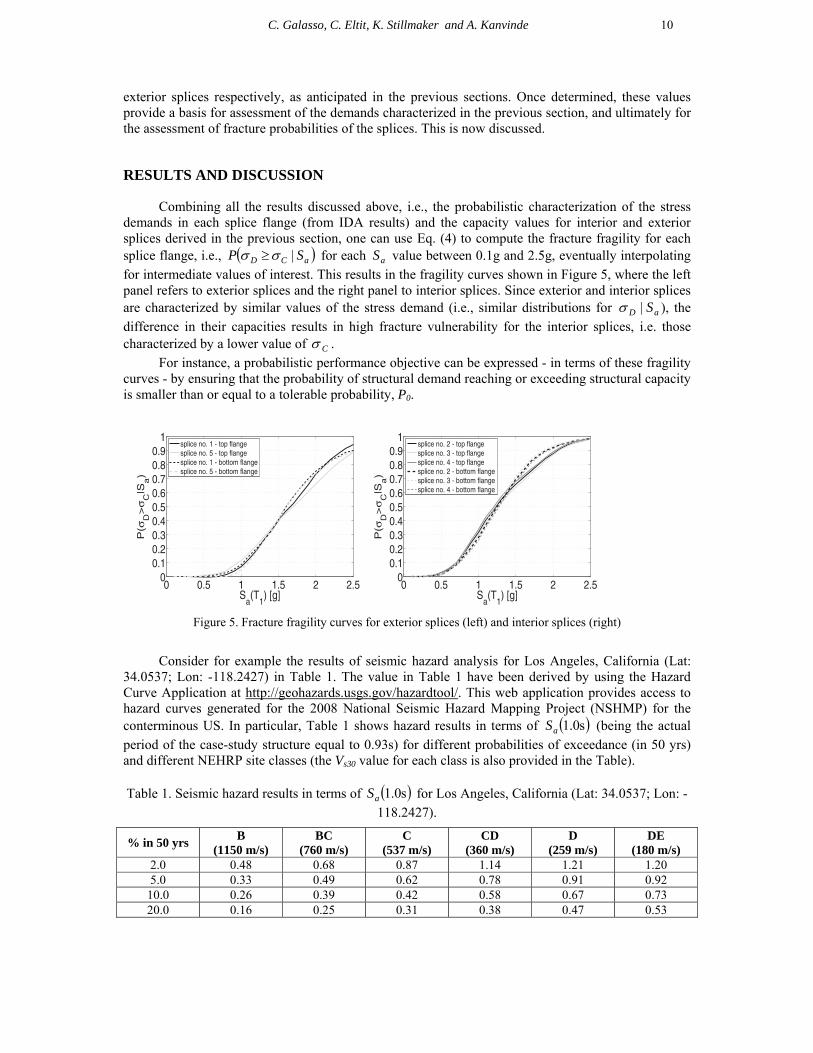
Consider for example the results of seismic hazard analysis for Los Angeles, California (Lat:
34.0537; Lon: -118.2427) in Table 1. The value in Table 1 have been derived by using the Hazard Curve Application at http://geohazards.usgs.gov/hazardtool/. This web application provides access to hazard curves generated for the 2008 National Seismic Hazard Mapping Project (NSHMP) for the conterminous US. In particular, Table 1 shows hazard results in terms of s0.1aS (being the actual period of the case-study structure equal to 0.93s) for different probabilities of exceedance (in 50 yrs) and different NEHRP site classes (the Vs30 value for each class is also provided in the Table). Table 1. Seismic hazard results in terms of s0.1aS for Los Angeles, California (Lat: 34.0537; Lon: -
118.2427).
% in 50 yrs B
(1150 m/s) BC
(760 m/s) C
(537 m/s) CD
(360 m/s) D
(259 m/s) DE
(180 m/s) 2.0 0.48 0.68 0.87 1.14 1.21 1.20 5.0 0.33 0.49 0.62 0.78 0.91 0.92
10.0 0.26 0.39 0.42 0.58 0.67 0.73 20.0 0.16 0.25 0.31 0.38 0.47 0.53

C. Galasso, C. Eltit, K. Stillmaker and A. Kanvinde 11
It is easy noting, by combining Figure 5 and Table 1, that the interior splices are particularly vulnerable to fracture, with values of aCD SP | in the range 40-50% for high return periods and
stiff and soft soils. The value of aCD SP | are much lower in the case of exterior splices and generally within (or around) 20% but these values may still be unacceptable in practice. This indicates that splices in pre-Northridge frames may be highly susceptible to fracture, emphasizing the urgent need for their retrofitting by means of effective guidelines. The information provided by this type of fragility curves may be used to make informed judgments about appropriate retrofit approaches.
CONCLUSIONS
This paper presented preliminary results of a larger and more ambitious investigation aiming at probabilistic demand assessment in steel column splices to gain implications for design of new structures and retrofit of existing structures. For this purpose, a case-study existing 4-story frame building typical of Los Angeles, California region has been considered. The main objectives of this paper were (1) to develop a rigorous probabilistic assessment of seismic demand (expressed in terms of local flange stress) in the WCS flanges, within the established framework for Performance-Based Earthquake Engineering and (2) to evaluate the estimated demand in the context of splice capacities implied by experimental and computational fracture mechanics research, resulting in the development of fracture fragilities for various WCS configurations. Results of this investigation indicate that splices in pre-Northridge frames may be highly susceptible to fracture, emphasizing the urgent need for their retrofitting by means of effective guidelines. Ongoing studies in this area are focused on the following problems (1) further development of hazard-consistent demands for splices in SMRF structures, and their sensitivity to various factors such as building height, splice location, column material properties, and other factors, and (2) development of design methods for flaw-tolerant splices which may utilize tougher materials than the ones used pre-Northridge. These design methods will leverage the fracture mechanics simulations used for this study, along with the PSDA to develop approaches that result in reliable and economical WCS connections. Studies by Shaw et al. (2014) have already made significant progress towards acceptance of these flaw-tolerant splices.
REFERENCES
AISC - American Institute of Steel Construction (2010) Seismic provisions for structural steel buildings (AISC 341-10), Chicago, IL, USA.
Anderson TL (1995) Fracture Mechanics, 2nd Ed., CRC Press, Boca Raton, FL, USA. ATC - Applied Technology Council (2009) Quantification of Building Seismic Performance Factors (FEMA
P695), Redwood City, CA, USA. Baker JW (2005) Vector-Valued Ground Motion Intensity Measures for Probabilistic Seismic Demand Analysis,
PhD Thesis, Stanford University, Stanford, CA, USA. Baker JW (2007) "Quantitative classification of near-fault ground motions using wavelet analysis," Bulletin of
the Seismological Society of America, 97(5):1486-1501. Baker JW (2014) “Efficient analytical fragility function fitting using dynamic structural analysis,” Earthquake
Spectra (in press). Barsom JM and Rolfe ST (1999) Fracture and Fatigue Control in Structures, Third Edition: Applications of
Fracture Mechanics (MNL41-3RD), ASTM Press, USA. Bradley BA (2013) “A comparison of intensity-based demand distributions and the seismic demand hazard for
seismic performance assessment,” Earthquake Engineering and Structural Dynamics, 42(15):2235-2253.
Bruneau M and Mahin SA (1991) “Full-scale tests of Butt-Welded Splices in Heavy-Rolled Steel Sections Subjected to Primary Tensile Stresses,” Engineering Journal, American Institute of Steel Construction, 28(1):1-17.
Champion C and Liel A (2012) “The effect of near-fault directivity on building seismic collapse risk,” Earthquake Engineering and Structural Dynamics, 41(10):1391-1409.

C. Galasso, C. Eltit, K. Stillmaker and A. Kanvinde 12
Cornell CA and Krawinkler H (2000) “Progress and challenges in seismic performance assessment,” PEER Center News, 3(2):1–3.
Deierlein GG, Krawinkler H, Cornell CA (2003) “A framework for performance-based earthquake engineering,” Proceedings of the 2003 Pacific Conference on Earthquake Engineering, Christchurch, New Zealand, 13-15 February.
Gupta A and Krawinkler H (1999) Seismic Demands for Performance Evaluation of Steel Moment Resisting Frame Structures (SAC Task 5.4.3), Blume Center Technical Report #132, Stanford University, Stanford, California, USA.
Jalayer F and Cornell CA (2009) "Alternative nonlinear demand estimation methods for probability-based seismic assessments," Earthquake Engineering and Structural Dynamics, 38(8): 951-972.
Kaufman E and Fisher J (1995) A Study of the Effects of Materials and Welding Factors on Moment Frame Weld Joint Performance Using a Small-scale Tension Specimen, Technical Report 95-08, SAC Joint Venture, Sacramento, CA, USA.
Kumar V, German MD, Shih CF (1981) An engineering approach for elastic–plastic fracture analysis, EPRI-NP-1931, Project 1287-1, Topical Report, Electric Power Research Institute, Palo Alto, CA, USA.
Lignos DG, Krawinkler H, Whittaker AS (2011) “Prediction and Validation of Sidesway Collapse of Two Scale Models of a 4-Story Steel Moment Frame,” Earthquake Engineering and Structural Dynamics, 40(7):807-825.
Luco N (2002) Probabilistic seismic demand analysis, SMRF connection fractures, and near-source effects, PhD Thesis, Stanford University, Stanford, CA, USA.
Mahin SA (1998) "Lessons from damage to steel buildings during the Northridge earthquake," Engineering Structures, 20(4–6):261-270.
McGuire RK (2008) "Probabilistic seismic hazard analysis: early history," Earthquake Engineering and Structural Dynamics, 37(3):329–338.
Nuttaysakul N (2000) Finite element fracture mechanics study of partial penetration welded splices, PhD Thesis, Stanford University, Stanford, CA, USA.
Pinto PE, Giannini R, Franchin P (2004) Methods for Seismic Reliability Analysis of Structures, IUSS Press, Pavia, Italy.
Rooke DP and Cartwright DJ (1976) Compendium of Stress Intensity Factors, HMSO, London, UK. SAC Joint Venture (1996) Selected Results from the SAC Phase 1 Beam-Column Connection Pre-Test Analyses,
Technical Report 96-01, Sacramento, CA, USA. SAC Joint Venture (2000) A Policy Guide to Steel Moment-Frame Construction (FEMA 354), Federal
Emergency Management Agency, Washington, DC, USA. Shaw SM (2013) Seismic Performance of Partial Joint Penetration Welds in Special Moment Resisting Frames,
PhD Thesis, University of California, Davis, CA, USA. Shaw SM, Stillmaker K, Kanvinde, AM (2014) “Seismic response of partial joint penetration welded column
splices in moment resisting frames,” Engineering Journal, American Institute of Steel Construction (under review).
Shen J, Sabol T, Akbas B, Sutchiewcharn C. (2010) "Seismic demand of column splices in special moment frames," Engineering Journal, American Institute of Steel Construction, Fourth Quarter 2010.
Shome N (1999) Probabilistic seismic demand analysis of nonlinear structures, PhD Thesis, Stanford University, Stanford, CA, USA.
Stillmaker K, Kanvinde AM, and Galasso C (2014) “Fracture-mechanics based design of column splices: simulations and reliability analysis,” ASCE Journal of Structural Engineering (to be submitted).
Vamvatsikos D, Cornell CA (2002) "Incremental Dynamic Analysis," Earthquake Engineering and Structural Dynamics, 31(3):491–514.
Victorsson V, Deierlein, GG, Baker JW (2011) “Capacity design in seismic resistant steel buildings: a reliability-based methodology to establish capacity-design factors,.” Proceedings of EUROSTEEL 2011, Budapest, Hungary, 31 August - 2 September.