Seismic tomography of Taiwan: Improved constraints from a
14
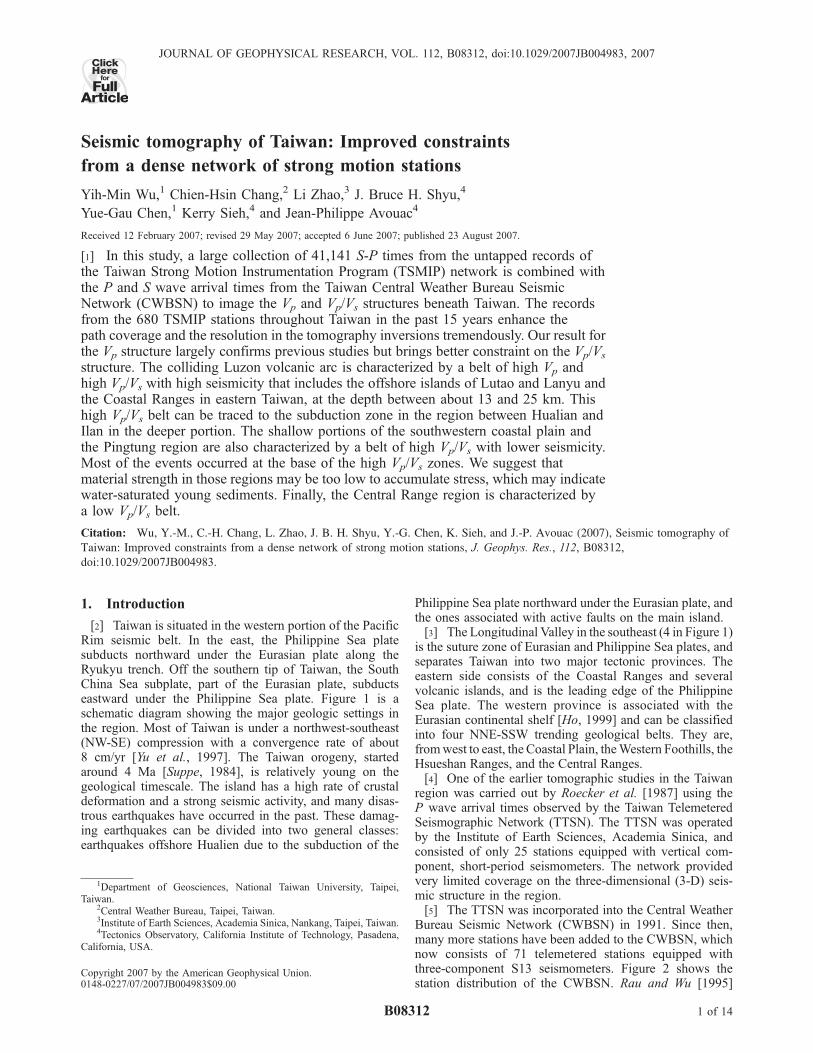
Seismic tomography of Taiwan: Improved constraints from a dense network of strong motion stations Yih-Min Wu, 1 Chien-Hsin Chang, 2 Li Zhao, 3 J. Bruce H. Shyu, 4 Yue-Gau Chen, 1 Kerry Sieh, 4 and Jean-Philippe Avouac 4 Received 12 February 2007; revised 29 May 2007; accepted 6 June 2007; published 23 August 2007. [1] In this study, a large collection of 41,141 S-P times from the untapped records of the Taiwan Strong Motion Instrumentation Program (TSMIP) network is combined with the P and S wave arrival times from the Taiwan Central Weather Bureau Seismic Network (CWBSN) to image the V p and V p /V s structures beneath Taiwan. The records from the 680 TSMIP stations throughout Taiwan in the past 15 years enhance the path coverage and the resolution in the tomography inversions tremendously. Our result for the V p structure largely confirms previous studies but brings better constraint on the V p /V s structure. The colliding Luzon volcanic arc is characterized by a belt of high V p and high V p /V s with high seismicity that includes the offshore islands of Lutao and Lanyu and the Coastal Ranges in eastern Taiwan, at the depth between about 13 and 25 km. This high V p /V s belt can be traced to the subduction zone in the region between Hualian and Ilan in the deeper portion. The shallow portions of the southwestern coastal plain and the Pingtung region are also characterized by a belt of high V p /V s with lower seismicity. Most of the events occurred at the base of the high V p /V s zones. We suggest that material strength in those regions may be too low to accumulate stress, which may indicate water-saturated young sediments. Finally, the Central Range region is characterized by a low V p /V s belt. Citation: Wu, Y.-M., C.-H. Chang, L. Zhao, J. B. H. Shyu, Y.-G. Chen, K. Sieh, and J.-P. Avouac (2007), Seismic tomography of Taiwan: Improved constraints from a dense network of strong motion stations, J. Geophys. Res., 112, B08312, doi:10.1029/2007JB004983. 1. Introduction [2] Taiwan is situated in the western portion of the Pacific Rim seismic belt. In the east, the Philippine Sea plate subducts northward under the Eurasian plate along the Ryukyu trench. Off the southern tip of Taiwan, the South China Sea subplate, part of the Eurasian plate, subducts eastward under the Philippine Sea plate. Figure 1 is a schematic diagram showing the major geologic settings in the region. Most of Taiwan is under a northwest-southeast (NW-SE) compression with a convergence rate of about 8 cm/yr [Yu et al., 1997]. The Taiwan orogeny, started around 4 Ma [Suppe, 1984], is relatively young on the geological timescale. The island has a high rate of crustal deformation and a strong seismic activity, and many disas- trous earthquakes have occurred in the past. These damag- ing earthquakes can be divided into two general classes: earthquakes offshore Hualien due to the subduction of the Philippine Sea plate northward under the Eurasian plate, and the ones associated with active faults on the main island. [3] The Longitudinal Valley in the southeast (4 in Figure 1) is the suture zone of Eurasian and Philippine Sea plates, and separates Taiwan into two major tectonic provinces. The eastern side consists of the Coastal Ranges and several volcanic islands, and is the leading edge of the Philippine Sea plate. The western province is associated with the Eurasian continental shelf [Ho, 1999] and can be classified into four NNE-SSW trending geological belts. They are, from west to east, the Coastal Plain, the Western Foothills, the Hsueshan Ranges, and the Central Ranges. [4] One of the earlier tomographic studies in the Taiwan region was carried out by Roecker et al. [1987] using the P wave arrival times observed by the Taiwan Telemetered Seismographic Network (TTSN). The TTSN was operated by the Institute of Earth Sciences, Academia Sinica, and consisted of only 25 stations equipped with vertical com- ponent, short-period seismometers. The network provided very limited coverage on the three-dimensional (3-D) seis- mic structure in the region. [5] The TTSN was incorporated into the Central Weather Bureau Seismic Network (CWBSN) in 1991. Since then, many more stations have been added to the CWBSN, which now consists of 71 telemetered stations equipped with three-component S13 seismometers. Figure 2 shows the station distribution of the CWBSN. Rau and Wu [1995] JOURNAL OF GEOPHYSICAL RESEARCH, VOL. 112, B08312, doi:10.1029/2007JB004983, 2007 Click Here for Full Articl e 1 Department of Geosciences, National Taiwan University, Taipei, Taiwan. 2 Central Weather Bureau, Taipei, Taiwan. 3 Institute of Earth Sciences, Academia Sinica, Nankang, Taipei, Taiwan. 4 Tectonics Observatory, California Institute of Technology, Pasadena, California, USA. Copyright 2007 by the American Geophysical Union. 0148-0227/07/2007JB004983$09.00 B08312 1 of 14
Transcript of Seismic tomography of Taiwan: Improved constraints from a
Seismic tomography of Taiwan: Improved constraints
from a dense network of strong motion stations
Yih-Min Wu,1 Chien-Hsin Chang,2 Li Zhao,3 J. Bruce H. Shyu,4
Yue-Gau Chen,1 Kerry Sieh,4 and Jean-Philippe Avouac4
Received 12 February 2007; revised 29 May 2007; accepted 6 June 2007; published 23 August 2007.
[1] In this study, a large collection of 41,141 S-P times from the untapped records ofthe Taiwan Strong Motion Instrumentation Program (TSMIP) network is combined withthe P and S wave arrival times from the Taiwan Central Weather Bureau SeismicNetwork (CWBSN) to image the Vp and Vp/Vs structures beneath Taiwan. The recordsfrom the 680 TSMIP stations throughout Taiwan in the past 15 years enhance thepath coverage and the resolution in the tomography inversions tremendously. Our result forthe Vp structure largely confirms previous studies but brings better constraint on the Vp/Vs
structure. The colliding Luzon volcanic arc is characterized by a belt of high Vp andhigh Vp/Vs with high seismicity that includes the offshore islands of Lutao and Lanyu andthe Coastal Ranges in eastern Taiwan, at the depth between about 13 and 25 km. Thishigh Vp/Vs belt can be traced to the subduction zone in the region between Hualian andIlan in the deeper portion. The shallow portions of the southwestern coastal plain andthe Pingtung region are also characterized by a belt of high Vp/Vs with lower seismicity.Most of the events occurred at the base of the high Vp/Vs zones. We suggest thatmaterial strength in those regions may be too low to accumulate stress, which may indicatewater-saturated young sediments. Finally, the Central Range region is characterized bya low Vp/Vs belt.
Citation: Wu, Y.-M., C.-H. Chang, L. Zhao, J. B. H. Shyu, Y.-G. Chen, K. Sieh, and J.-P. Avouac (2007), Seismic tomography of
Taiwan: Improved constraints from a dense network of strong motion stations, J. Geophys. Res., 112, B08312,
doi:10.1029/2007JB004983.
1. Introduction
[2] Taiwan is situated in the western portion of the PacificRim seismic belt. In the east, the Philippine Sea platesubducts northward under the Eurasian plate along theRyukyu trench. Off the southern tip of Taiwan, the SouthChina Sea subplate, part of the Eurasian plate, subductseastward under the Philippine Sea plate. Figure 1 is aschematic diagram showing the major geologic settings inthe region. Most of Taiwan is under a northwest-southeast(NW-SE) compression with a convergence rate of about8 cm/yr [Yu et al., 1997]. The Taiwan orogeny, startedaround 4 Ma [Suppe, 1984], is relatively young on thegeological timescale. The island has a high rate of crustaldeformation and a strong seismic activity, and many disas-trous earthquakes have occurred in the past. These damag-ing earthquakes can be divided into two general classes:earthquakes offshore Hualien due to the subduction of the
Philippine Sea plate northward under the Eurasian plate, andthe ones associated with active faults on the main island.[3] The Longitudinal Valley in the southeast (4 in Figure 1)
is the suture zone of Eurasian and Philippine Sea plates, andseparates Taiwan into two major tectonic provinces. Theeastern side consists of the Coastal Ranges and severalvolcanic islands, and is the leading edge of the PhilippineSea plate. The western province is associated with theEurasian continental shelf [Ho, 1999] and can be classifiedinto four NNE-SSW trending geological belts. They are,fromwest to east, the Coastal Plain, theWestern Foothills, theHsueshan Ranges, and the Central Ranges.[4] One of the earlier tomographic studies in the Taiwan
region was carried out by Roecker et al. [1987] using theP wave arrival times observed by the Taiwan TelemeteredSeismographic Network (TTSN). The TTSN was operatedby the Institute of Earth Sciences, Academia Sinica, andconsisted of only 25 stations equipped with vertical com-ponent, short-period seismometers. The network providedvery limited coverage on the three-dimensional (3-D) seis-mic structure in the region.[5] The TTSN was incorporated into the Central Weather
Bureau Seismic Network (CWBSN) in 1991. Since then,many more stations have been added to the CWBSN, whichnow consists of 71 telemetered stations equipped withthree-component S13 seismometers. Figure 2 shows thestation distribution of the CWBSN. Rau and Wu [1995]
JOURNAL OF GEOPHYSICAL RESEARCH, VOL. 112, B08312, doi:10.1029/2007JB004983, 2007ClickHere
for
FullArticle
1Department of Geosciences, National Taiwan University, Taipei,Taiwan.
2Central Weather Bureau, Taipei, Taiwan.3Institute of Earth Sciences, Academia Sinica, Nankang, Taipei, Taiwan.4Tectonics Observatory, California Institute of Technology, Pasadena,
California, USA.
Copyright 2007 by the American Geophysical Union.0148-0227/07/2007JB004983$09.00
B08312 1 of 14

used the P wave arrival times from the CWBSN to invert fora 3-D P wave velocity structure. Using both P and S wavearrival times from the CWBSN, Ma et al. [1996] and Shinand Chen [1988] determined the P and S wave velocitymodels. More recently, Kim et al. [2005] conducted atomography study for 3-D P and S wave velocity structuresby jointly using data sets from the CWBSN and twotemporary seismic arrays in Hualien and Pingtung [Chen,1995, 1998]. In a more recent study by Wang et al. [2006],arrival times from both local and teleseismic events wereused to achieve a good resolution at greater depths.[6] There is yet another huge untapped reservoir of
seismic records. In 1991, Taiwan’s Central Weather Bureauundertook a major effort to establish the TSMIP, which has680 digital accelerographs in free field sites [Shin et al.,2003]. Apart from the unpopulated high mountain areas, theTSMIP stations have achieved an average station spacing ofa few kilometers. Figure 2 also shows the station distribu-
tion of the TSMIP network. During the past 15 years, alarge number of high-quality digital accelerograms havebeen recorded from tens of thousands of earthquakes ofmagnitudes M = 2 to M = 7. These waveform records,combined with the seismograms recorded by the CWBSN,provide an excellent database for seismological studies.[7] Previous 3-D P and S wave velocity structure inver-
sions [e.g., Rau and Wu, 1995; Ma et al., 1996; Shin andChen, 1988; Kim et al., 2005] have only used the CWBSNstations and therefore have not taken advantage of the vastamount of information provided by the TSMIP stations. Wehave conducted the very first tomographic study using the15 years worth of information contained in the TSMIPseismograms. An almost tenfold increase in station distri-bution provided by the 680 TSMIP stations over theCWBSN network enables us to achieve unprecedentedhigh-resolution and reliable images of the 3-D seismicstructure beneath Taiwan. Even though most of the earlier
Figure 1. Topography and geological settings of the Taiwan region.
B08312 WU ET AL.: TAIWAN VP/VS TOMOGRAPHY
2 of 14
B08312

TSMIP stations were not equipped with absolute timingsystems, the S-P times can still be effectively used to obtainthe 3-D Vp/Vsmodel and to improve the earthquake locations.
2. Data and Method
[8] The hypocentral distribution of the events used in thisstudy is shown in Figure 3. The selection of the earthquakeswas based on the following criteria: (1) earthquakesoccurred in the period from 1 January 1992 to 31 December2005 and inside the box shown in Figure 3; (2) in each 0.1��0.1� � 10 km cubic cell, we selected three events recordedby the largest number of CWBSN stations; (3) events forwhich the TSMIP network offered at least one good qualityreading of S-P time. In the end a total of 299,104 P wavearrival times and 133,062 S-P times from the CWBSN, and41,141 S-P times from the TSMIP were obtained from17,206 regional earthquakes. The P and S wave arrivaltimes at the CWBSN stations are available from the CentralWeather Bureau (CWB) catalog. We used the S wave arrivaltimes in the inversions only in the form of S-P times. TheS-P times from the TSMIP network were picked manuallyfrom the strong motion waveforms. Large earthquakes may
be recorded by many strong motion stations. Small eventscan only be recorded by stations very close to the epicentersbecause of the triggering threshold of the strong motionseismometers. Thus the S-P times for most events wereobtained from a few stations. However, the dense distribu-tion of the 680 strong motion stations provides a greatenhancement in path coverage in the tomography inver-sions. The P and S arrivals from the CWBSN were alsorepicked and only data with weightings 0, 1, 2 and 3 wereused in this study. The arrivals weighting is the standardscheme used in HYPO71 [Lee and Lahr, 1975].[9] The velocity model is specified on a set of 3-D spatial
grid points, and a linear interpolation is adopted between thegrid points. Figure 2 also shows the distribution of the 28 �32 grid points on a horizontal plane. In depth, a total of17 grid points are distributed at depths of 0, 2, 4, 6, 9, 13,17, 21, 25, 30, 35, 50, 70, 90, 110, 140, and 200 km. Thegrid spacings in NWW-SEE and NNE-SWW directions are7.5 km and 12.5 km for most of the Taiwan region,respectively. The grid spacing for offshore region is20 km. The given of different grid spacing is consideringthe stations coverage and geological settings of Taiwan.
Figure 2. Station distributions of the CWBSN and TSMIP. Also shown are the grid setting used in thisstudy for tomography inversions and the locations for A-A0 to J-J0 profiles in Figure 6 and the e-e0 profilein Figure 8.
B08312 WU ET AL.: TAIWAN VP/VS TOMOGRAPHY
3 of 14
B08312

[10] We applied the algorithms SIMULPS12 [Evans et al.,1994] based on the inversion method by Thurber [1983,1993], Eberhart-Phillips [1990], and Thurber and Eberhart-Phillips [1999]. Ray tracing is accomplished using anapproximate 3-D algorithm with curved nonplanar raypaths[Um and Thurber, 1987]. We used the damped least squaresinversion based on the parameter separation techniques ofPavlis and Booker [1980].[11] The damping values of 35 for Vp and 40 for Vp/Vs
were chosen empirically by running a series of single-iteration inversions with a range of damping values, andfinding the tradeoff between data misfits and the modelvariances [Eberhart-Phillips, 1986, 1993]. The units for theVp and Vp/Vs dampings are s2 and unitless [Evans et al.,1994], respectively. A consistent damping was used in theentire iterative inversion process. Each iteration consists oftwo steps: event relocation and then structural inversion. Inorder to achieve numerical stability, we have imposed themaximum velocity perturbations of 0.5 km/s for Vp and 0.25for Vp/Vs. The velocity structural inversion reached conver-gence after three iterations.[12] The initial 3-D velocity models were constructed
based on a one-dimensional (1-D) horizontally layered
P wave velocity model and a reference Vp/Vs ratio deter-mined using the VELEST program [Kissling et al., 1994].The initial models (Table 1) generally agree with the 1-Dhorizontally layered P and S wave velocity models that
Figure 3. Hypocenter distribution of the 17,206 events used in this study.
Table 1. Initial Models of Vp and Vp/Vs Ratio Used in This Study
Depth, km Vp, km/s Vp/Vs Ratio
0 3.90 1.872 4.64 1.764 5.17 1.726 5.22 1.719 5.64 1.7113 6.02 1.7317 6.30 1.7421 6.58 1.7425 6.74 1.7430 7.11 1.7435 7.52 1.7450 7.98 1.7370 8.25 1.7590 8.28 1.72110 8.38 1.73140 8.40 1.74200 8.70 1.74700 9.00 1.73
B08312 WU ET AL.: TAIWAN VP/VS TOMOGRAPHY
4 of 14
B08312

were proposed by Shin and Chen [1988] and used currentlyby the CWB for routine event locations.
3. Resolution Test
[13] We used the checkerboard resolution test (CRT) andthe restoring resolution test (RRT) proposed by Zhao et al.[1992] and Hole et al. [2000] to examine how well of thevelocity structure on heterogeneities can be retrieved fromthe inversions. The CRT method can be used to investigatethe spatial resolution provided by the existing ray coverage.
We constructed the checkerboard velocity models by adding±10% of velocity variation to our initial models with about22.5 � 37.5 � 8 km block (Figures 4a and 4b), leading to20% velocity discontinuity across the boundary of checker-board boxes. Synthetic traveltimes were calculated fromeach selected hypocenter to the recording stations throughthe checkerboard velocity models. Then the synthetic datawere inverted for the velocity perturbations from the initialmodels. We used the same procedures and parameters in theCRT inversions as those used in the inversions of real data.
Figure 4a. Input and recovered models in Vp checkerboard resolution test. Input model is shown in (topleft) map view and two profiles A-A0 and C-C0 (second row). All the other panels are recovered model.(top) Map views are plotted at three depths, and profiles are provided for A-A0 to E-E0 whose locationsare indicated in the top left.
B08312 WU ET AL.: TAIWAN VP/VS TOMOGRAPHY
5 of 14
B08312

[14] Figure 4a shows a few horizontal and vertical slicesof the CRT input and recovered models for the P wavevelocity structures. Since most of the stations are located onland, a good P wave structure recovery underneath Taiwanis achieved. The region of good recovery extends into theeastern offshore region at a greater depth because ofoccurrence of deeper earthquakes there. In western Taiwanthe resolution is excellent at depths down to about 60 km(e.g., profile AA0 in Figure 4a). In contrast, in easternTaiwan a similar resolution can be achieved at a greater
depth down to about 100 km (e.g., profile BB0 in Figure 4a),and still deeper in the subduction zone regions in north-eastern and southeastern Taiwan.[15] Figure 4b shows several horizontal and vertical slices
for the CRT input and recovered models for the Vp/Vs
structure. Determining the S wave arrival times is generallymore difficult than for the P wave. Therefore the recoveryof Vp/Vs structure is not as good as that seen in Figure 4a forthe resolution of P wave structure. The CRT results showthat a good Vp/Vs resolution can be obtained down to 40-km
Figure 4b. Input and recovered models in Vp/Vs checkerboard resolution test. Input model is shown in(top left) map view and two profiles A-A0 and C-C0 (second row). All the other panels are recoveredmodel. (top) Map views are plotted at three depths, and profiles are provided for A-A0 to E-E0 whoselocations are indicated in the top left.
B08312 WU ET AL.: TAIWAN VP/VS TOMOGRAPHY
6 of 14
B08312

depth in western Taiwan and 80-km depth in eastern Taiwan(e.g., profiles AA0 and BB0 in the Figure 4b). However, abetter resolution for Vp /Vs structure than for P wavestructure can be seen at shallow depth in the westernmostpart of the island of Taiwan (e.g., the slice for 4-km depth inFigures 4a and 4b). This is because we used a large numberof S-P times from the TSMIP network.
4. Results and Tectonic Interpretations
4.1. Vp and Vp /Vs Structures
[16] Figures 5a and 5b presents the map views at severaldepths for the results of Vp and Vp/Vs structures determinedin this study. The 3-D Vp structure from our inversionlargely agree with that obtained in previous studies [e.g.,Roecker et al., 1987; Rau and Wu, 1995; Ma et al., 1996;Shin and Chen, 1998; Kim et al., 2005]. However, the 3-DVp/Vs structure we derived with the help of enhanced stationcoverage provided by the TSMIP network provides addi-tional insights into the first-order structures of the Taiwanorogeny. In shallow (<10 km deep) layers, there are Vp andVp/Vs anomalies that are associated with near-surface geo-logic units. Most notably are the areas of low Vp and highVp/Vs that reflect the water-saturated young sediments of thecoastal basins in western Taiwan. Smaller areas with similarsignals near both the northern and southern ends of theLongitudinal Valley may correspond to large amount ofyoung sediments there. Neogene sedimentary rocks in theWestern Foothills are characterized by low Vp and low Vp/Vs.Farther east, high Vp coincides with the high mountain rangesof Taiwan, including the Hsueshan and Central Ranges.[17] At about 10-km depth, most of the sedimentary
basins have bottomed out, with a clear exception of thePingtung Plain, where low Vp and high Vp/Vs signals arepresent down to a depth of 17 km. The rapidly subsidingPingtung Plain is likely to be the surface manifestation ofthe subducting oceanic lithosphere, just prior to the collisionof the fore-arc ridge and the continental margin [e.g., Shyuet al., 2005a], since the northern boundary of the basin iscoincident with the northern edge of the Wadati-Benioffzone of the Manila trench [e.g., Huang et al., 1992; Kao etal., 2000]. The large depth of sediments in the basin is alsoconsistent with this hypothesis.[18] Another interesting feature that is visible at the depth
between 9 and 17 km is the high Vp and high Vp/Vs signalextending from the Penghu Islands into the westernmostcoastal plain of Taiwan. This feature appears to be consis-tent with the proposed Peikang Basement High (PKH [e.g.,Mouthereau et al., 2002]). However, its signal is alsoconsistent with the presence of mafic rocks, such as thebasaltic outcrops in the Penghu Islands.[19] A very sharp boundary between high and low Vp
coincides with the Longitudinal Valley in eastern Taiwanbelow about 17-km depth. High Vp to the east of thisboundary clearly reflects the oceanic crust of the PhilippineSea plate. The Central Ranges west of this boundary,however, has much lower Vp. This indicates clearly that afundamental material difference exists between the oceanicPhilippine Sea plate and the basement of the CentralRanges. The significant difference in Vp across the Longi-tudinal Valley supports the notion that the valley is a majorsuture zone. The moderately low Vp/Vs below the Central
Ranges belt is, in fact, consistent with the hypothesizedgranitic continental rocks that form the basement of theCentral Ranges belt. If the Central Ranges belt was formedby accretionary prism, it would have a high Vp/Vs ratio fromwater saturation. Recently, it has been proposed that theCentral Ranges of Taiwan and its southern extension in theHengchun Peninsula and the submarine Hengchun Ridgemay be a continental sliver, and that the Taiwan orogeny isproduced by a tandem suturing between the Eurasiancontinental margin, the Luzon volcanic arc, and this inter-vening continental sliver [Shyu et al., 2005b]. The fact thatvirtually no major discontinuity in Vp structure can be seenbetween the Central Ranges and the Hengchun Peninsulasupports the idea that they may belong to a continuous belt.[20] The colliding Luzon volcanic arc is also character-
ized by a belt of high Vp/Vs that includes the offshore islandsof Lutao and Lanyu, and the Coastal Ranges in easternTaiwan, at the depth between about 13 and 25 km. This highVp/Vs belt may indicate fluids in the crust at depth, possiblyalong the major fault zones of the suture.
4.2. Vp and Vp/Vs Profiles
[21] Profiles of Vp and Vp/Vs, augmented by relocatedseismicity, provide further constraints on the crustal struc-tures across the Taiwan orogeny. Figures 6a and 6b presentsome of the profiles with the locations of the profilesdepicted in Figure 2. Also indicated in Figures 6a and 6bis the topography of a reference Moho boundarycorresponding to Vp = 7.8 km/s (thin white line in the Vp
profiles). The Moho appears to be the deepest below thecentral to eastern Central Ranges, down to about 60-kmdepth, in agreement with previous estimates by Yeh et al.[1998] and Kim et al. [2005]. This indicates that significantcrustal thickening has occurred in the Central Ranges belt.In the northernmost profile (A-A0), the crustal thickness ismuch smaller. Profiles E-E0, F-F0, and J-J0 show relativelydeep boundary of Vp = 7.8 km/s in the eastern Taiwan andoffshore region, beneath the Luzon volcanic arc. Thevolcanic activity may be involved. Because of possibleinvolvement of the volcanic activity in this region, theMoho interface there may be more complex.[22] In most of the profiles, western Taiwan is characterized
by a thick wedge of either sedimentary rocks or youngsediments of low Vp. Thick piles of young sediments aremore prominent as high Vp/Vs wedges in southwesternTaiwan between profiles D-D0 and F-F0. This young sedi-ment wedge appears to hamper the occurrence of back-ground seismicity. This is clearly illustrated in the longi-tudinal profile H-H0, in which almost no earthquake ofM > 3.0 occurred in the high Vp/Vs wedge. However, manyearthquakes occur at the base of this wedge. This indicatesthat many of the active structures in southwestern Taiwanhave extended farther into the coastal plain as blind faultsbeneath the young coastal plain sediments.[23] Few earthquakes and a low Vp/Vs occur below the
Central Ranges, except at shallow (<10 km) depths. Thelow seismicity under the Backbone Range Belt can beattributed to the high thermal gradient [Wu et al., 1997] orsimply that material in this region is ductile. Anotherconsideration for low seismicity is the intrusion of fluid[Chen and Chen, 1998], but this viewpoint may not agreewith the low Vp/Vs result.
B08312 WU ET AL.: TAIWAN VP/VS TOMOGRAPHY
7 of 14
B08312

Figure 5a. Vp perturbation maps at nine different depths. Blue and red show high and low velocity,respectively. The dots show the relocated events for M > 3 within ±3 km of each layer. The depth and thereference P wave velocity are given for each plot.
B08312 WU ET AL.: TAIWAN VP/VS TOMOGRAPHY
8 of 14
B08312
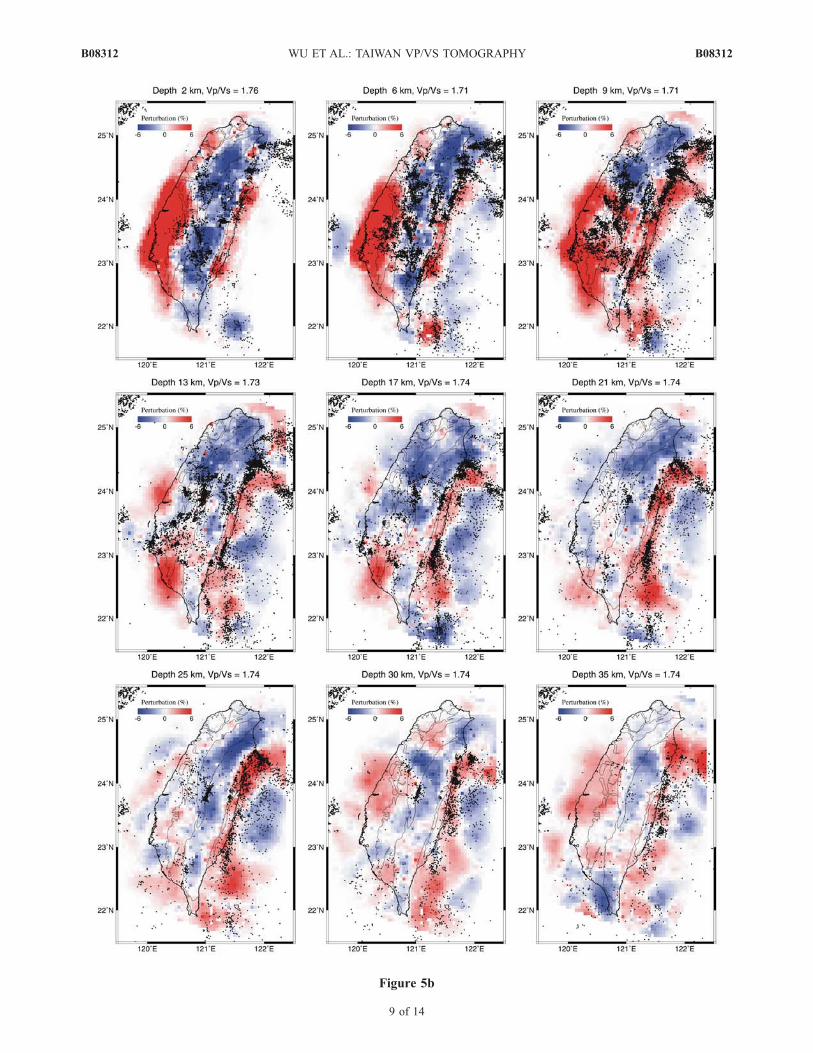
Figure 5b
B08312 WU ET AL.: TAIWAN VP/VS TOMOGRAPHY
9 of 14
B08312
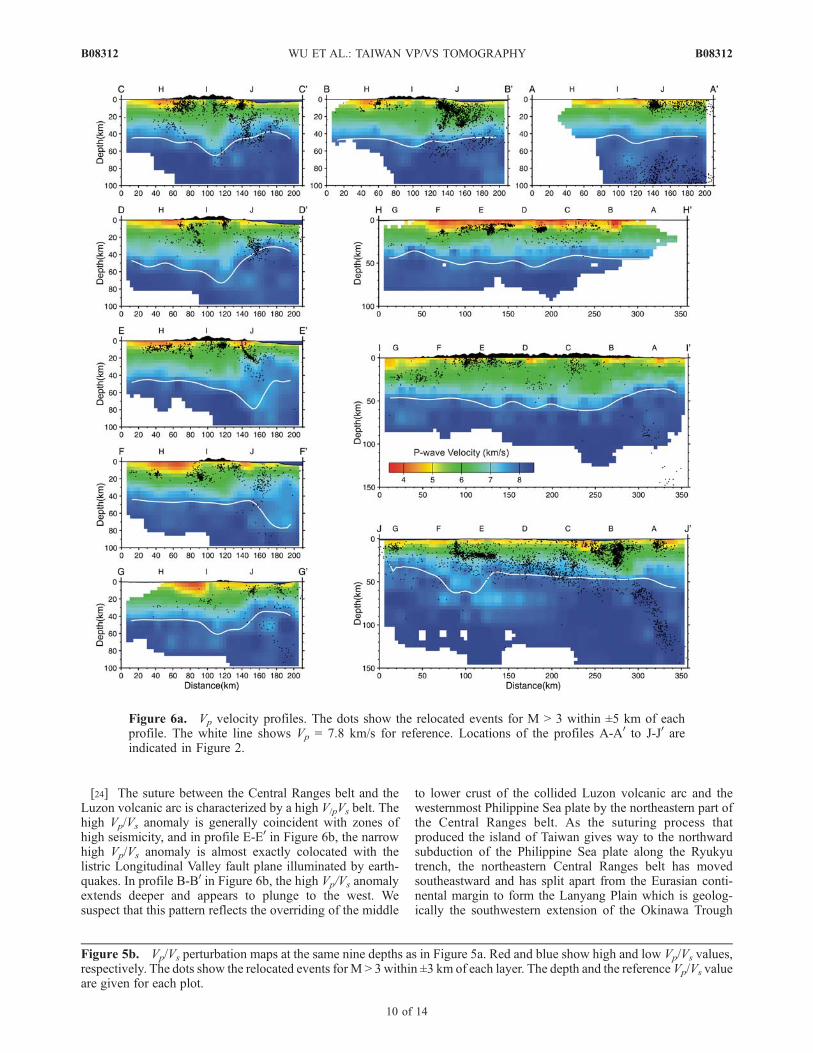
[24] The suture between the Central Ranges belt and theLuzon volcanic arc is characterized by a high V/pVs belt. Thehigh Vp/Vs anomaly is generally coincident with zones ofhigh seismicity, and in profile E-E0 in Figure 6b, the narrowhigh Vp/Vs anomaly is almost exactly colocated with thelistric Longitudinal Valley fault plane illuminated by earth-quakes. In profile B-B0 in Figure 6b, the high Vp/Vs anomalyextends deeper and appears to plunge to the west. Wesuspect that this pattern reflects the overriding of the middle
to lower crust of the collided Luzon volcanic arc and thewesternmost Philippine Sea plate by the northeastern part ofthe Central Ranges belt. As the suturing process thatproduced the island of Taiwan gives way to the northwardsubduction of the Philippine Sea plate along the Ryukyutrench, the northeastern Central Ranges belt has movedsoutheastward and has split apart from the Eurasian conti-nental margin to form the Lanyang Plain which is geolog-ically the southwestern extension of the Okinawa Trough
Figure 5b. Vp/Vs perturbation maps at the same nine depths as in Figure 5a. Red and blue show high and low Vp/Vs values,respectively. The dots show the relocated events forM > 3within ±3 km of each layer. The depth and the reference Vp/Vs valueare given for each plot.
Figure 6a. Vp velocity profiles. The dots show the relocated events for M > 3 within ±5 km of eachprofile. The white line shows Vp = 7.8 km/s for reference. Locations of the profiles A-A0 to J-J0 areindicated in Figure 2.
B08312 WU ET AL.: TAIWAN VP/VS TOMOGRAPHY
10 of 14
B08312

[e.g., Shyu et al., 2005a, 2005b]. We believe that this hascaused the northeastern Central Ranges belt to override themiddle to lower crust of the collided Luzon volcanic arc.Westward bending and possible underthrusting of the western-most Philippine Sea plate is also observed from relocatedseismicity in eastern Taiwan [Kuochen et al., 2004].
5. Relocation of Seismicity
[25] We have used the new 3-D model obtained in thisstudy to relocate a total of 35,530 events of M > 3 from1990 to 2006. Figures 7a and 7b show the traveltimeresiduals before and after the relocation, respectively.Yellow 3 and blue dots show readings of high and lowweightings, respectively. A total of 455,272 P wave arrivaltimes, 178,382 S wave arrival times from the CWBSN, and49,693 S-P times from the TSMIP stations are compiledhere. For the CWBSN locations using 1-D model, thetraveltime residuals have the means and standard deviationsof 0.043 ± 0.500, �0.119 ± 0.631, and 0.023 ± 0.479 s forP, S, and S-P data, respectively. Figure 7a clearly shows that
the traveltime residuals for 1-D locations do not have a zeromean. In particular, P wave residuals tend to be slightlypositive in the epicentral distance range from 150 to 250 km.S wave residuals are biased toward negative in the epicen-tral distance range from 30 to 100 km and positive from 110to 280 km. S-P residuals are mostly negative in theepicentral distance range from 80 to 130 km. After therelocation using our 3-D model, the traveltime residualshave the means and standard deviations of �0.000 ± 0.358,�0.001 ± 0.536, and 0.012 ± 0.277 s for P, S, and S-P data,respectively. In particular, the standard deviation of theS-P residuals decreased by about 0.2 s, a 42% drop, sincemost of the S-P timeswas used in velocity inversion. Figure 7bclearly shows that the traveltime residuals after the 3-Drelocation concentrate closely at zero especially for higherweighting samples (yellow dots). Also, the systematic shiftswith distance have been removed.[26] Carena et al. [2002] proposed an active detachment
of Taiwan. The detachment subsurface at about 10-kmdepth runs from western Taiwan continuously to easternTaiwan shown by the seismicity. In our relocated hypocenter
Figure 6b. Vp/Vs ratio profiles. The dots show the relocated events for M > 3 within ±5 km of eachprofile. Locations of the profiles A-A0 to J-J0 are indicated in Figure 2.
B08312 WU ET AL.: TAIWAN VP/VS TOMOGRAPHY
11 of 14
B08312

distribution in Figures 5a and 5b, there is no continuousseismicity from western to eastern Taiwan. However, ourdata set only selected the events of M > 3.0 whereas Carenaet al. [2002] used the events ofM > 1.0.We suggest that smallevents may play an important role in such study. The Vp/Vs
plot at depth 9 km (Figure 5b), the Chi-Chi earthquake sourceregion and beneath the Central Ranges shows a high Vp/Vs
pattern. It may be a signal of detachment to support theCarena et al. [2002]. However, this issue may warrant furtherinvestigation.
6. Discussion
[27] The only previous tomography study in the Taiwanregion that presented both Vp and Vs models was that of Kimet al. [2005]. In that study, 6285 events from Taiwan Island
and the surrounding region were used to obtain 88,260 Pand 63,522 S arrival times. Our model for the Vp structure islargely similar to that of Kim et al. [2005]. In addition, Kimet al. [2005] has a better resolution in the Hualien andPingtung regions because of the two local dense networksthey used in their tomography inversions. On the otherhand, the events in this study are located in a larger region,and we used 3 times as many traveltime data. We also havea better constraint on the V/pVs structure due to (1) theincorporation of the island-wide dense distribution of the680 TSMIP stations from which we derived the S-P times,and (2) the inversion of the Vp/Vs model directly from theS-P times, which effectively eliminates the possible errorsin earthquake origin times.[28] Figure 8 shows Vp velocity and Vp/Vs ratio profiles in
eastern Taiwan with the same location of profile FF’ inFigure 13 of Kim et al. [2005], the dots show the relocatedevents for M > 3 within a 5-km zone on either side of eachprofile. The location of the profile is indicated by e-e’ in
Figure 7. Residuals versus epicentral distances for the P,S, and S-P times predicted by the CWBSN locations using1-D model and our locations using the 3-D model from thisstudy.
Figure 8. Vp velocity and Vp/Vs ratio profiles in easternTaiwan. The dots show the relocated events for M > 3within ±5 km of each profile. Location for the e-e’ profile isshown in Figure 2. LV marks the location of LongitudinalValley.
B08312 WU ET AL.: TAIWAN VP/VS TOMOGRAPHY
12 of 14
B08312

Figure 2. In comparison with Kim et al. [2005] the Vp
patterns are similar with a large velocity contrast across theLongitudinal Valley. However, the results are very differentin Vp/Vs ratio and the relocated seismicity. The events usedare different but the seismicity pattern is similar. Kim et al.[2005] related the high seismicity to high Vp/Vs. In ourresult, however, the relocated seismicity concentrates abovethe curved zone dipping to the east delineated by the highVp/Vs pattern. The relocated hypocenters are not situated onthe high Vp/Vs as by Kim et al. [2005]. In contrast, they arelocated in between high and low Vp/Vs zones. We suggestthat the high VpVs correlates to the suture zone and theseismicity above is related to the Coastal Ranges fault aspropose in our previous study [Wu et al., 2006a]. In profileF-F0 in Figure 6b, the high Vp/Vs zone in the Taitung regiondips to the west with high angle. This pattern is consistentwith our recent observation [Wu et al., 2006b] that in theTaitung region there may be a boundary fault dipping to thewest with a high angle in association with the CentralRanges fault. This fault is recently proposed as anothermajor active structure along the Longitudinal Valley sutureon the basis of geomorphic observations [Shyu et al., 2006].
7. Conclusions
[29] In this study, we combined a large data set of S-P timesfrom the TSMIP records with the P and S wave arrivaltimes from the CWBSN network in imaging the regional 3-DP wave and Vp/Vs structures in Taiwan. The TSMIP data setimproves the source-station path coverage tremendously andprovides much better constraints and resolution in velocitystructure determination. The new 3-D Vp and Vp/Vs
structures and the relocated seismicity provide several newinsights for Taiwan’s regional seismotectonics. The plateboundary can be identified clearly by the Vp structures. Asseen in Figure 5a, Vp structure is clearly divided into threehigh-low-high zones from west to east at the depth of 25 km.The western high-Vp zone represents the foreland of theEurasian plate. The middle low-Vp zone under the CentralRanges represents the basement of the Central Ranges belt,which has high Vp at shallow depths and low Vp at greaterdepths. This is typical of mountain roots. The Vp profiles inFigure 6a show that the Moho interface may reach down to60-km depth under the Central Ranges. The eastern high-Vp
structures clearly show the western boundary of the PhilippineSea Plate, with the Longitudinal Valley as the suture zone.On the eastern side of the Longitudinal Valley are zones ofhigh Vp and Vp/Vs structures with a high seismicity. Theyrepresent the island arc collision zone. The high Vp/Vs mayindicate a fracture zone and may reflect the existence offluids. This zone subducts under the Eurasian Plate in theN20�E direction and also plunges to the west under theCentral Ranges from Hualien to Ilan region.
[30] Acknowledgments. Y.-M. Wu wishes to thank Ta-liang Teng forencouragements and very constructive comments. Critical comments andsuggestions by Honn Kao, an anonymous reviewer, and the AE helpedimprove the manuscript. This research was supported by the NationalScience Council (NSC95-2625-Z-002-028, NSC95-2119-M-002-043-MY3 and NSC95-2119-M-001-063) with TEC contribution 00004, theCentral Weather Bureau of the Republic of China, and Caltech TectonicsObservatory with contribution 71.
ReferencesCarena, S., J. Suppe, and H. Kao (2002), Active detachment of Taiwanilluminated by small earthquakes and its control of first-order topography,Geology, 30, 935–938.
Chen, C. C., and C. S. Chen (1998), Preliminary result of magnetotelluricsoundings in the fold-thrust belt of Taiwan and possible detection ofdehydration, Tectonophysics, 292, 101–117.
Chen, K.-C. (1995), Earthquake studies using the PANDA and PANDAIIseismic array, Ph.D. thesis, CERI/Dep. of Geol. Sci., Univ. of Memphis,Memphis, Tenn.
Chen, K.-P. (1998), Study of shallow structure beneath Kaoshiung–Pingtungregion using local earthquake data, Ph.D. thesis, Inst. of Geophys., Natl.Central Univ., Jungli, Taiwan.
Eberhart-Phillips, D. (1986), Three-dimensional P and S velocity structurein northern California Coast ranges from inversion of local earthquakearrival times, Bull. Seismol. Soc. Am., 76, 1025–1052.
Eberhart-Phillips, D. (1990), Three-dimensional P and S velocity structurein the Coalinga region, California, J. Geophys. Res., 95, 15,343–15,363.
Eberhart-Phillips, D. (1993), Local earthquake tomography: Earthquakesource regions, in Seismic Tomography: Theory and Practice, edited byH. M. Iyer and K. Hirahara, pp. 613–643, Chapman and Hall, New York.
Evans, J. R., D. Eberhart-Philips, and C. H. Thurber (1994), User’s manualfor SIMULPS12 for imaging Vp and Vp/Vs: A derivative of the ‘‘Thurber’’tomography inversion SIMUL3 for local earthquakes and explosions,U.S. Geol. Surv. Open File Rep., 94-431, 100 pp.
Ho, C. S. (1999), An Introduction to the Geology of Taiwan. ExplanatoryText of the Geologic Map of Taiwan, Central Geol. Surv., Minist. of Econ.Affairs, Taipei, Taiwan.
Hole, J. A., T. M. Brocher, S. L. Klemperer, T. E. Parsons, H. M. Benz, andK. P. Furlong (2000), Three-dimensional seismic velocity structure of theSan Francisco Bay area, J. Geophys. Res., 105, 13,859–13,874.
Huang, C. Y., C. T. Shyu, S. B. Lin, T. Q. Lee, and D. D. Sheu (1992), Marinegeology in the arc-continent collision zone off southeastern Taiwan:Implications for Late Neogene evolution of the Coastal Range,Mar. Geol.,107, 183–212.
Kao, H., G.-C. Huang, and C.-S. Liu (2000), Transition from oblique sub-duction to collision in the northern Luzon arc-Taiwan region: Constraintsfrom bathymetry and seismic observations, J. Geophys. Res., 105, 3059–3079.
Kim, K. H., J. M. Chiu, J. Pujol, K. C. Chen, B. S. Huang, Y. H. Yeh, andP. Shen (2005), Three-dimensional Vp and Vs structural model associatedwith the active subduction and collision tectonics in the Taiwan region,Geophys. J. Int., 162, 204–220.
Kissling, E., W. L. Ellsworth, D. Eberhart-Phillips, and U. Kradolfer(1994), Initial reference models in local earthquake tomography, J. Geo-phys. Res., 99, 19,635–19,646.
Kuochen, H., Y. M. Wu, C. H. Chang, J. C. Hu, and W. S. Chen (2004),Relocation of the eastern Taiwan earthquakes and its tectonic implica-tions, Terr. Atmos. Oceanic Sci., 15, 647–666.
Lee, W. H. K., and J. C. Lahr (1975), HYPO71 (revised): A computerprogram for determining hypocenter, magnitude and first motion patternof local earthquakes, U.S. Geol. Surv. Open File Rep., 75-311.
Ma, K. F., J. H. Wang, and D. Zhao (1996), Three-dimensional seismicvelocity structure of the crust and uppermost mantle beneath Taiwan,J. Phys. Earth, 44, 85–105.
Mouthereau, F., B. Deffontaines, O. Lacombe, and J. Angelier (2002),Variations along the strike of the Taiwan thrust belt: Basement controlon structural style, wedge geometry, and kinematics, in Geology andGeophysics of an Arc-Continent Collision, edited by T. B. Byrne andC.-S. Liu, Spec. Pap. Geol. Soc. Am., 358, 31–54.
Pavlis, G. L., and J. R. Booker (1980), The mixed discrete-continuousinverse problem: Application to the simultaneous determination of earth-quake hypocenters and velocity structure, J. Geophys. Res., 85, 4801–4810.
Rau, R.-J., and F. T. Wu (1995), Tomographic imaging of lithosphericstructures under Taiwan, Earth Planet. Sci. Lett., 133, 517–532.
Roecker, S. W., Y. H. Yeh, and Y. B. Tsai (1987), Three-dimensional P andS wave velocity structures beneath Taiwan; deep structure beneath an arc-continent collision, J. Geophys. Res., 92, 10,547–10,570.
Shin, T. C., and Y. L. Chen (1988), Study on the earthquake location of 3-Dvelocity structure in the Taiwan area, Meteorol. Bull., 42, 135–169.
Shin, T. C., Y. B. Tsai, Y. T. Yeh, C. C. Liu, and Y. M. Wu (2003), Strong-motion instrumentation programs in Taiwan, in Handbook of Earthquakeand Engineering Seismology, edited by W. H. K. Lee et al., pp.1057–1062, Academic, San Diego, Calif.
Shyu, J. B. H., K. Sieh, Y.-G. Chen, and C.-S. Liu (2005a), Neotectonicarchitecture of Taiwan and its implications for future large earthquakes,J. Geophys. Res., 110, B08402, doi:10.1029/2004JB003251.
B08312 WU ET AL.: TAIWAN VP/VS TOMOGRAPHY
13 of 14
B08312

Shyu, J. B. H., K. Sieh, and Y. G. Chen (2005b), Tandem suturing anddisarticulation of the Taiwan orogen revealed by its neotectonic elements,Earth Planet. Sci. Lett., 233, 167–177.
Shyu, J. B. H., K. Sieh, Y. G. Chen, and L. H. Chung (2006), Geomorphicanalysis of the Central Range fault, the second major active structure ofthe Longitudinal Valley suture, eastern Taiwan, Geol. Soc. Am. Bull., 118,1447–1462.
Suppe, J. (1984), Kinematics of arc-continent collision, flipping of subduc-tion, and back-arc spreading near Taiwan,Mem. Geol. Soc. China, 6, 21–33.
Thurber, C. H. (1983), Earthquake locations and three-dimensional crustalstructure in the Coyote Lake area, central California, J. Geophys. Res.,88, 8226–8236.
Thurber, C. H. (1993), Local earthquake tomography: Velocities and Vp/Vs—Theory, in Seismic Tomography: Theory and Practice, edited byH. M. Iyer and K. Hirahara, pp. 563–583, Chapman and Hall, London.
Thurber, C., and D. Eberhart-Phillips (1999), Local earthquake tomographywith flexible gridding, Comput. Geosci., 25, 809–818.
Um, J., and C. H. Thurber (1987), A fast algorithm for two-point seismicray tracing, Bull. Seism. Soc. Am., 77, 972–986.
Wang, Z., D. Zhao, J. Wang, and H. Kao (2006), Tomographic evidence forthe Eurasian lithosphere subducting beneath south Taiwan, Geophys. Res.Lett., 33, L18306, doi:10.1029/2006GL027166.
Wu, F. T., R. J. Rau, and D. Salzberg (1997), Taiwan orogeny: Thin-skinned or lithospheric collision?, Tectonophysics, 274, 191–220.
Wu, Y. M., Y. G. Chen, T. C. Shin, H. Kuochen, C. S. Hou, J. C. Hu, C. H.Chang, C. F. Wu, and T. L. Teng (2006a), Coseismic versus interseismicground deformations, fault rupture inversion and segmentation revealed
by 2003Mw 6.8 Chengkung earthquake in eastern Taiwan, Geophys. Res.Lett., 33, L02312, doi:10.1029/2005GL024711.
Wu, Y.-M., Y.-G. Chen, C.-H. Chang, L.-H. Chung, T.-L. Teng, F. T. Wu,and C.-F. Wu (2006b), Seismogenic structure in a tectonic suture zone:With new constraints from 2006 Mw 6.1 Taitung earthquake, Geophys.Res. Lett., 33, L22305, doi:10.1029/2006GL027572.
Yeh, Y. H., R. C. Shih, C. H. Lin, C. C. Liu, H. Y. Yen, B. S. Huang, C. S.Liu, and F. T. Wu (1998), Onshore/offshore wide-angle deep seismicprofiling in Taiwan, Terr. Atmos. Oceans, 9, 301–316.
Yu, S. B., H. Y. Chen, L. C. Kuo, S. E. Lallemand, and H. H. Tsien (1997),Velocity field of GPS stations in the Taiwan area, Tectonophysics, 274,41–59.
Zhao, D., A. Hasegawa, and S. Horiuchi (1992), Tomographic imaging of Pand S wave velocity structure beneath northeastern Japan, J. Geophys.Res., 97, 19,909–19,928.
�����������������������J.-P. Avouac, J. B. H. Shyu, and K. Sieh, Tectonics Observatory,
California Institute of Technology, Pasadena, CA 91125, USA.C.-H. Chang, Central Weather Bureau, 64 Kung Yuan Road, Taipei,
Taiwan.Y.-G. Chen and Y.-M. Wu, No. 1, Sec. 4th, Roosevelt Road, Department
of Geosciences, National Taiwan University, Taipei, Taiwan. ([email protected])L. Zhao, Institute of Earth Sciences, Academia Sinica, Nankang, Taipei
115, Taiwan.
B08312 WU ET AL.: TAIWAN VP/VS TOMOGRAPHY
14 of 14
B08312