
eprints.whiterose.ac.ukeprints.whiterose.ac.uk/80987/1/Fzzy Seismic Risk Asses… · Web...
37
Fuzzy Risk Assessment of Retrofitting School Projects in High Seismic Area Kamran Vahdat 1 , Nigel J. Smith 2 , Gholamreza G. Amiri 3 1 School of Civil Engineering, University of Leeds, Woodhouse Lane, Leeds LS2 9JT, UK, [email protected] 2 School of Civil Engineering, University of Leeds, Woodhouse Lane, Leeds LS2 9JT, UK, [email protected] 3 School of Civil Engineering, University of Science and Technology (IUST) , Narmak, Tehran, Iran, [email protected] Abstract Seismic mitigation program has been a major challenge in many earthquake prone countries. School retrofitting projects are usually considered as high priority within the program to be managed as soon as possible. However due to extent and large number of this group of projects the process of decision making is does not have satisfactory pace comparing with other vital infrastructure and state buildings. This paper proposes an integrated economic risk-based model for evaluating competing school projects in high seismic area. The methodology is conceptually based on fuzzy logic which handles the integration of uncertain subjective elements. The application of the model is examined for the case of ongoing group of retrofitting school projects in Iran. The findings suggest that an early seismic risk assessment is required prior to any go/no go decisions, and greater attention should be given to the efficacy of seismic mitigation measures based on cost per people saved (CER). Key words: seismic risk assessment, fuzzy expert system, economic assessment , cost effective ratio(CER) 1
-
Upload
truongkhue -
Category
Documents
-
view
218 -
download
0
Transcript of eprints.whiterose.ac.ukeprints.whiterose.ac.uk/80987/1/Fzzy Seismic Risk Asses… · Web...

Fuzzy Risk Assessment of Retrofitting School Projects in High Seismic Area
Kamran Vahdat 1, Nigel J. Smith2, Gholamreza G. Amiri 3
1 School of Civil Engineering, University of Leeds, Woodhouse Lane, Leeds LS2 9JT, UK, [email protected] School of Civil Engineering, University of Leeds, Woodhouse Lane, Leeds LS2 9JT, UK, [email protected]
3 School of Civil Engineering, University of Science and Technology (IUST) , Narmak, Tehran, Iran, [email protected]
Abstract
Seismic mitigation program has been a major challenge in many earthquake prone countries. School retrofitting projects are usually considered as high priority within the program to be managed as soon as possible. However due to extent and large number of this group of projects the process of decision making is does not have satisfactory pace comparing with other vital infrastructure and state buildings. This paper proposes an integrated economic risk-based model for evaluating competing school projects in high seismic area. The methodology is conceptually based on fuzzy logic which handles the integration of uncertain subjective elements. The application of the model is examined for the case of ongoing group of retrofitting school projects in Iran. The findings suggest that an early seismic risk assessment is required prior to any go/no go decisions, and greater attention should be given to the efficacy of seismic mitigation measures based on cost per people saved (CER).
Key words: seismic risk assessment, fuzzy expert system, economic assessment , cost effective ratio(CER)
1. Introduction
Schools are key nodes in any educational network and essential for regional and/or national economic development. Historical reports have shown that major earthquakes could cause enormous direct and indirect losses such as physical damages, human losses, degradation of educational system and productivity in regional economic activities. In particular, the implementation of seismic rehabilitation of seismic prone buildings can significantly reduce earthquake damage to buildings and infrastructure (Dowrick, 2003). Traditionally, economical criterions have been the sole governing factors in evaluating, prioritizing and selecting alternative projects; however these approaches are suitable for neutral risk situation where investment is not threatened by any disaster risk. In early works, some researchers have presented a
1

probabilistic approach for evaluating building projects in seismic areas. (Smyth et al 2004; Ergonul 2006; Cardona, O. et al 2008; Tesfamariam and Sanchez 2011). Most of those have rather focused on sophisticated structural analysis combined with probabilistic seismic hazard estimates to select the best retrofitting options. However, this method still has some limitations due to great uncertainties associated within the process. For instance, seismic hazard estimation requires of some extreme earthquake to develop distribution functions which are incomplete, vague or even not available in many regions. Traditional probabilistic approaches requires large amount of data pertaining to loss of life and properties which are not readily available in most of the regions. Furthermore, these approaches are unable to completely take into account the socio-economic factors particularly in its application for large group of projects. According to Hewings and Mahidhara (1996) disaster impact analysis is ‘inexact science’ and since the more complex risk models become, the more precise numerical data will be required, while imprecise measurements of the damages and losses of a disaster are often the major issue of probabilistic approaches. The impreciseness and vagueness are often characterized by the use of natural linguistic term such as high, medium and low. In addition, risk assessment process usually involves expert opinion, experience analysis and rule of thumbs that are vague or ill-defined due to limited historical data. It is more reliable to express the risk factors in a linguistic scale while conventional probabilistic variables have limited ability to represent (or map) this linguistic or descriptive information (Mir lavasani et al 2011).Moreover, the main challenge of risk assessment process is to handle non-precise subjective values for evaluating criteria that characterize the risk. Therefore, there is a need for new method to characterize the risk by relying on subjective values that are not subject to precise measurement. Alternatively, fuzzy set theory introduced by Zadeh (1965) is able to deal with imprecise, vague and ill-defined information by using such linguistic terms which are based for subjective judgment. Previous studies, presented the use of fuzzy set in risk-based evaluating and prioritizing the utility degree of alternative projects (Xu et al 2010 ; Tesfamariam et al 2010; Zeng et al 2007); However these methods still have limitation, particularly difficulty in applying in a similar situation and incorporating risk attributes along with economical factors. Fuzzy expert system provides a simply way of dealing with fuzzy set theory that allow human thinking, reasoning and perception process. These types of experiencing can rarely be measured and addressed using probability theory. Fuzzy expert system is an expert system that uses linguistic scales and rule base (If-Then rules) to reason about data. This method is easy to develop, understanding and application (Idris et al 2011). In this research, a novel fuzzy based methodology is developed that address the seismic risk impact on business decision making of seismic rehabilitation projects within a framework. The proposed methodology is examined for determining the optimal group of school projects in Iran including seismic retrofitting projects and reconstructing projects (demolish and rebuild). The novel feature of the proposed methodology is to contribute the fuzzy seismic risk assessment (FSRA), taking into account socio-economic factors by using a multidisciplinary hierarchical approach. The rest of the paper is organized as follows:
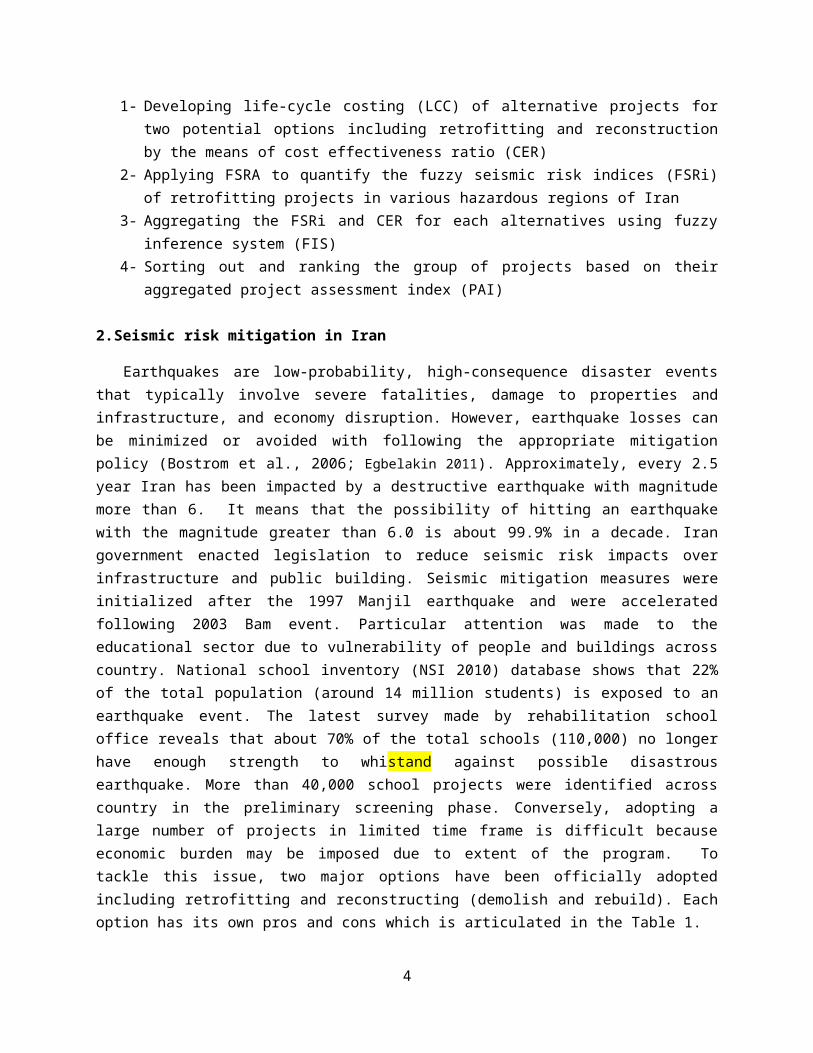
1- Developing life-cycle costing (LCC) of alternative projects for two potential options including retrofitting and reconstruction by the means of cost effectiveness ratio (CER)
2

2- Applying FSRA to quantify the fuzzy seismic risk indices (FSRi) of retrofitting projects in various hazardous regions of Iran
3- Aggregating the FSRi and CER for each alternatives using fuzzy inference system (FIS)4- Sorting out and ranking the group of projects based on their aggregated project assessment
index (PAI)
2. Seismic risk mitigation in Iran
Earthquakes are low-probability, high-consequence disaster events that typically involve severe fatalities, damage to properties and infrastructure, and economy disruption. However, earthquake losses can be minimized or avoided with following the appropriate mitigation policy (Bostrom et al., 2006; Egbelakin 2011). Approximately, every 2.5 year Iran has been impacted by a destructive earthquake with magnitude more than 6. It means that the possibility of hitting an earthquake with the magnitude greater than 6.0 is about 99.9% in a decade. Iran government enacted legislation to reduce seismic risk impacts over infrastructure and public building. Seismic mitigation measures were initialized after the 1997 Manjil earthquake and were accelerated following 2003 Bam event. Particular attention was made to the educational sector due to vulnerability of people and buildings across country. National school inventory (NSI 2010) database shows that 22% of the total population (around 14 million students) is exposed to an earthquake event. The latest survey made by rehabilitation school office reveals that about 70% of the total schools (110,000) no longer have enough strength to whi stand against possible disastrous earthquake. More than 40,000 school projects were identified across country in the preliminary screening phase. Conversely, adopting a large number of projects in limited time frame is difficult because economic burden may be imposed due to extent of the program. To tackle this issue, two major options have been officially adopted including retrofitting and reconstructing (demolish and rebuild). Each option has its own pros and cons which is articulated in the Table 1.
Table 1. Advantages and disadvantages of two mitigation option in public school
Option Advantage Disadvantage
Retrofitting Lower impact on economy
Faster in delivery
Temporary relief for pre-code buildings
Lower quality comparing to other option
Reconstruction Structurally more reliable in long term
Lower maintenance and longer life cycle
Higher impact for the local territories
Impose extra cost for society during the operation
Due to complex “structural performance analysis” that has been often used for school and lack of proper project management system, the process of decision making in appraisal stage often takes more than the normal construction project. As a result, limited number of projects can be passed through appraisal stages and enlisted for tender every year. This issue might be even hampered taking to the account following constraints:
- large number of alternative projects (aged schools) were short listed for retrofitting study
3
- minimum disruption for the society and local economy (business interruption)- time constraint of construction (summer is the only time permitted by the authorities for the
retrofitting operation in school buildings) - large portion of the screened schools (about 89%) are masonry type and single storey (NSI
2010) which can be effectively retrofitted within the conventional procedure- Cost of seismic retrofitting is far less than reconstruction projects in most of schools(NSI 2010)
Considering above issues and to expedite the process of decision making, various benefits and drawbacks should be weighted rigorously based on the comprehensive multi-criteria system considering socio-economical attributes of the projects as well as seismic risk factors. The subsequent sections implement fuzzy expert system to import seismic risk effects into project management. This model assists decision makers in prioritizing the new projects according to their aggregated fuzzy seismic risk index (FSRi). The study focused on pre-code school buildings being used in various seismic regions of Iran. This group of schools was initially identified as “seismic vulnerable building” due to inadequate structural strength, age and material deterioration.
3. Research methodology
Decision making in any investment project usually involves considering economic aspects of alternative projects. For situations in which investment might be encountered with great degree of disaster risk, non-economic factors also could have great impact on decision making and thus to be incorporated appropriately. This article presents an alternative fuzzy based methodology that integrates seismic risk and economic factors in the process of retrofitting projects. Dong et al (1988) and Sanchez-Silva (2001) articulated the initial requirement for an effective risk-based methodology as follows:
- able to combine multiple factors- able to model interaction between all system components- able to able handle vague and incomplete information through subjective judgment process- able to design a strategy for combining evidence from different sources of information- able to provide a flexible way of handling new situations which are slightly different from past
experienceNonetheless, two additional aspects need to be added particularly for risk-based context where great degree of risk involved:
- able to measure the seismic risk through available project information - able to reconcile seismic risk with economic factors effectively
Having known the multidimensional aspects of problem, a heuristic framework is established based on fuzzy set theory and enhanced economic assessment as shown in Figure 1. The economic part of the decision process relies on economic criteria which have been specifically developed for school retrofitting projects. Life cycle costing (LCC), cost effectiveness ratio (CER) and financial analysis are the underpinning steps in economic assessment which are discussed in the ensuing sections.
4

Economic assessm
ent (CEA)
Fuzzy Inference system (FIS)
Establish hierarchy
Develop seismic risk factors
Fuzzification(establish membership function)
Rule-Based fuzzy inference Engine
Defuzzification
Project assessment IndexPAI
Develop economic factors
Screening alternative projects
Project Ranking
KnowledgeBase
Data BaseExpert
Rule Base
LCC
Financial analysis
CER
FSRi
Figure 1 – Research methodology of fuzzy risk assessment for rehabilitation projects
The risk assessment part of the model is developed through a knowledge-based expert system which is able to reconcile the knowledge from different sources of data, information, and multiple experts’ opinions. Expert system is appropriate for evaluating seismic risk because much of the assessment involves expert opinion and knowledge from past experience. Also, the fact that many criteria in SRA are not well defined or the measurement is difficult to verify makes the judgmental and heuristic rules even more important (Miyasto et al 1986). SRA process starts with collecting relevant information and criterion required in seismic risk assessment. In fuzzification step, all the qualitative and quantitative criteria can be naturally presented within the universal scale of membership function namely linguistic variables. The use of linguistic variables facilitates handling imprecise information within the common scale in a flexible manner (Miri Lavasani et al 2011). The main reason of using linguistic variables is that it is able to deal with measurement of uncertainties. An inference engine is implemented to combine various linguistic variables using a set of rules already defined by the experts. The reconciled fuzzy variables are needed to be presented in crisp language (normal math language). This mapping process is undertaken in defuzzification step where a fuzzy seismic risk index (FSRi) is resulted through. The project assessment index (PAI) is defined as combination of both FSRi and CER in fuzzy context as following:
PAI = FSRi CER (1)
Where ‘‘ refers to fuzzy operations that synthesize both indices.
5

According to the PAI developed for each retrofitting project, the ranking of the competing alternatives can be carried out. This process is outlined in following section through real case of school rehabilitation projects in high seismic zones of Iran.
4. Economic assessment
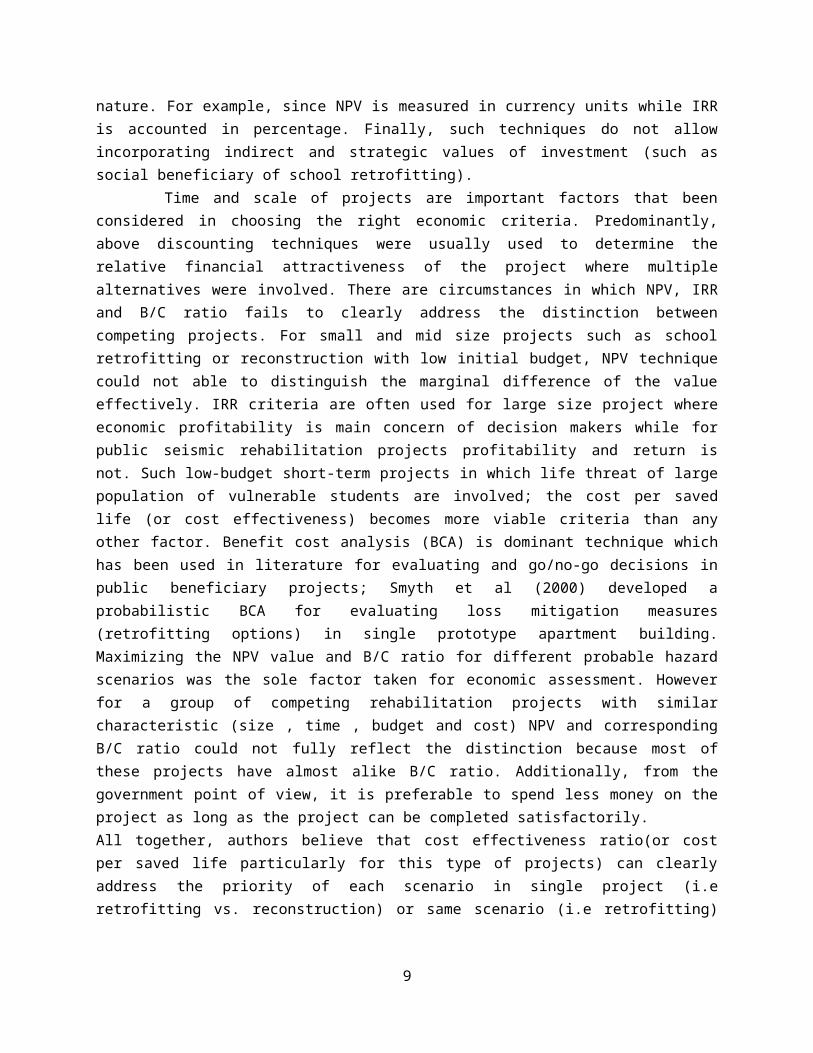
Economic evaluation of the projets is crucial step leading to investment decision. When seismic safety consideration is concerned, economic criteria can greatly impact the decision making process and subsequent population affected by this decision. Conventional methods of investment project evaluation is usually based on economic criteria such as Net Present value (NPV) , internal ate of return (IRR) , Benefit/Cost ratio(BC) and so on. Major challenge in project evaluation is uncertainty in forecasting all possible costs (during the life cycle) so appropriate method which is able to deal with uncertain situation should be used. Applicability of the probability approach is often restricted since of high quality data is a prerequisite for economical evaluation (i.e cash flow analysis) for future events. (Dimova et al 2006). Another issue in traditional economic criteria is based on the parameters that are different in nature. For example, since NPV is measured in currency units while IRR is accounted in percentage. Finally, such techniques do not allow incorporating indirect and strategic values of investment (such as social beneficiary of school retrofitting). Time and scale of projects are important factors that been considered in choosing the right economic criteria. Predominantly, above discounting techniques were usually used to determine the relative financial attractiveness of the project where multiple alternatives were involved. There are circumstances in which NPV, IRR and B/C ratio fails to clearly address the distinction between competing projects. For small and mid size projects such as school retrofitting or reconstruction with low initial budget, NPV technique could not able to distinguish the marginal difference of the value effectively. IRR criteria are often used for large size project where economic profitability is main concern of decision makers while for public seismic rehabilitation projects profitability and return is not. Such low-budget short-term projects in which life threat of large population of vulnerable students are involved; the cost per saved life (or cost effectiveness) becomes more viable criteria than any other factor. Benefit cost analysis (BCA) is dominant technique which has been used in literature for evaluating and go/no-go decisions in public beneficiary projects; Smyth et al (2000) developed a probabilistic BCA for evaluating loss mitigation measures (retrofitting options) in single prototype apartment building. Maximizing the NPV value and B/C ratio for different probable hazard scenarios was the sole factor taken for economic assessment. However for a group of competing rehabilitation projects with similar characteristic (size , time , budget and cost) NPV and corresponding B/C ratio could not fully reflect the distinction because most of these projects have almost alike B/C ratio. Additionally, from the government point of view, it is preferable to spend less money on the project as long as the project can be completed satisfactorily.All together, authors believe that cost effectiveness ratio(or cost per saved life particularly for this type of projects) can clearly address the priority of each scenario in single project (i.e retrofitting vs. reconstruction) or same scenario (i.e retrofitting) for multiple competing school projects. This technique will be explored in following section.
6

4.1 Cost effectiveness analysis (CEA)
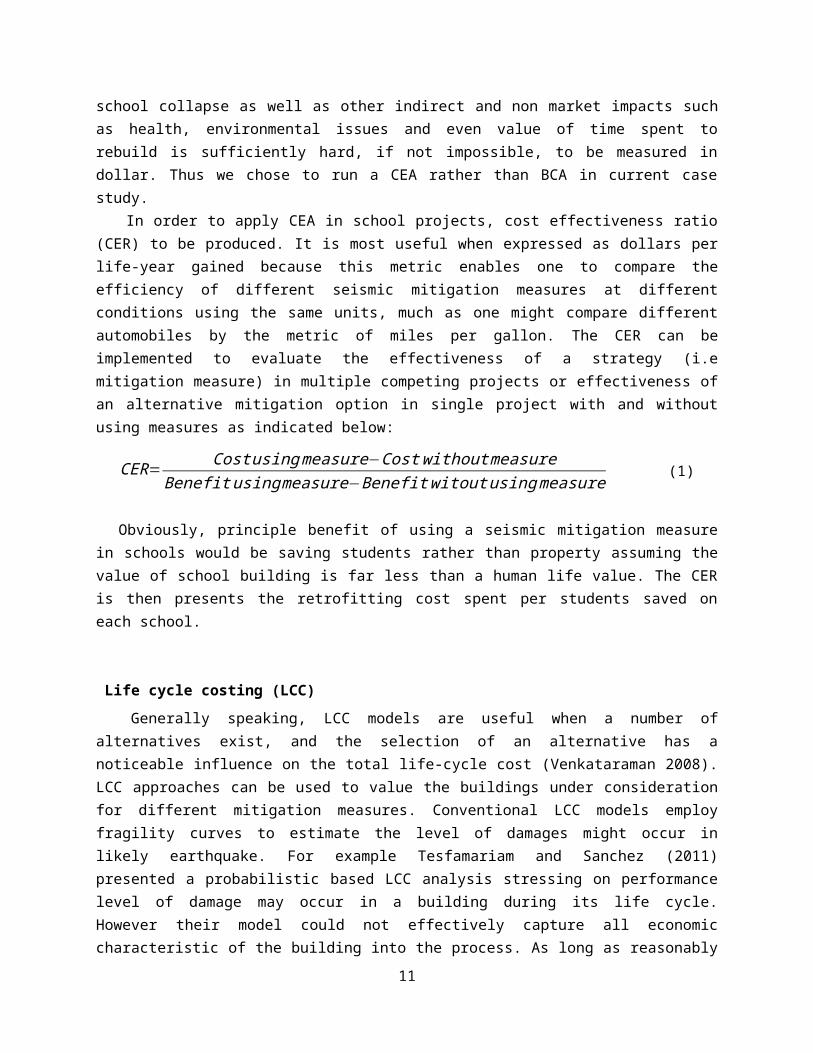
BCA and CEA are economical tools which have been used to measure the benefit and cost of the public projects on a common scale; However It should be distinguished between a BCA and a CEA. Basically there is no meaningful link between CBA and CEA, since they have fundamentally different ethical underpinnings (Dolan and Edlin 2002). “The latter analysis is an analysis where indices of the form expected cost per expected saved lives are computed; The analysis method does not explicitly put a value to the benefit as is required in the cost-benefit analysis” (Misra 2008). While BCA is a traditional technique in evaluating public infrastructure projects in which long term return is concerned (how much it returns), the latter has been dominantly implemented to evaluate the costs of health care interventions or programmes (or how much it costs per life saved ). Thus, CEA is suitable for the situations in which benefits are difficult to measure in monetary terms, the information required is difficult to determine or any attempt to make a precise monetary measurement of benefits would be vulnerable to considerable criticism (UNDP 2007 ; Yuan et al 2010). Given that two scenarios were adopted by decision makers for seismic rehabilitation, the challenge is how two maximize the mitigation measures effects (i.e save more life with less cost) with minimum costs among these competing projects. This issue can be reliably addressed by the CEA method. The strength of using CEA to evaluate seismic rehabilitation projects is that the resulting cost-effectiveness ratios can represent each dollar spent per saved life; Having employed the BCA ,past studies(Smyth et l 2000 and 2004 ; Mechner 2005) have normally converted direct social impacts such the human life value in monetary term to justify and compare the cost incurred by each option; However this methodology essentially has several weakness. First their result (B/C ratio) cannot precisely reflect the dollar spent per saved life since value of life is highly subjective as well as number of loss life; Secondly, the obvious socio-economic disruption (or indirect long term impacts) caused by a school collapse as well as other indirect and non market impacts such as health, environmental issues and even value of time spent to rebuild is sufficiently hard, if not impossible, to be measured in dollar. Thus we chose to run a CEA rather than BCA in current case study. In order to apply CEA in school projects, cost effectiveness ratio (CER) to be produced. It is most useful when expressed as dollars per life-year gained because this metric enables one to compare the efficiency of different seismic mitigation measures at different conditions using the same units, much as one might compare different automobiles by the metric of miles per gallon. The CER can be implemented to evaluate the effectiveness of a strategy (i.e mitigation measure) in multiple competing projects or effectiveness of an alternative mitigation option in single project with and without using measures as indicated below:
CER= Cost usingmeasure−Cost without measureBenefit usingmeasure−Benefit witout usingmeasure (1)
Obviously, principle benefit of using a seismic mitigation measure in schools would be saving students rather than property assuming the value of school building is far less than a human life value. The CER is then presents the retrofitting cost spent per students saved on each school.
7

Life cycle costing (LCC)
Generally speaking, LCC models are useful when a number of alternatives exist, and the selection of an alternative has a noticeable influence on the total life-cycle cost (Venkataraman 2008). LCC approaches can be used to value the buildings under consideration for different mitigation measures. Conventional LCC models employ fragility curves to estimate the level of damages might occur in likely earthquake. For example Tesfamariam and Sanchez (2011) presented a probabilistic based LCC analysis stressing on performance level of damage may occur in a building during its life cycle. However their model could not effectively capture all economic characteristic of the building into the process. As long as reasonably accurate data are provided for various cost and benefit components, the uncertainty and variability of the LCC model can be estimated reliably. For example Ergonul (2006) conducted a probabilistic evaluation of a shopping center in seismic zone based on the LCC concept albeit taking the initial cost as sole economical factor which made the result unreliable. Regarding the assessment of seismic retrofitting or reconstructing school projects , Arikan et al (2005) stated that all costs and all revenue to be considered for each option during its life cycle and then they should be compared by their present value or annual equivalent values. For simplicity of calculation and comparison, the economical life of a retrofitted school is assumed the same as newly built school as 50 years. Thus the new extended life of a typical school at the ages of 20, 30 & 40 are assumed to be 30, 20, 10 years respectively. Starting point in economical life (or present time) is considered at the end of construction. Each cost spent during a year is taken at the end of corresponding year. Initial cost of a new construction includes direct costs such as demolish, construction, school supplies and furniture and indirect costs imposed due to lack of school on student such settlement cost and transfer; While in retrofitting case , it is limited to structural reinforcing cost only. Maintenance cost is also considered as distributed long term cost in both options. This cost is taken from previous researches, code of practice for national schools and historical records. Borjikhani (2010) revealed that the maintenance cost of a medium to large size school could exceed the initial cost of construction during its life cycle given 50 years. The average cost of school rehabilitation depends on types of reinforcing system chosen and site characteristic. This cost is often estimated at design stage by the reinforcement consultants. In current case study, the average cost of a newly built school is taken from evaluation procedure and it is then verified with historical records. Cost of construction per area for a typical school with the same area could slightly differ from province to province and thus to be taken to the account.
4.2 Financial analysis of school projects
Since each costs of a project occurs in different intervals of its life span, all the cost should be discounted to a reference time either present or future. Equivalent present value (PV) of a future value (FV) (or cost) at n equal consequent intervals of time from present time with constant interest rate “i”, can be calculated from following equation:
PV=FV 1(i+1 )n
(2)
Likewise, following expression can be used for annual equivalent value (AV) of a future value:
8
AV=FV i( i+1 )n−1
(3)
Financial analysis summary of two mitigation measures was performed for 21 school projects as indicated in Table 2. These projects were picked out from 450 schools over country which were either being technically investigated or approved for tender by rehabilitation office. The buildings in the case study were selected from different categories from most frequent (and most vulnerable) masonry (M) to concrete (C) and steel (S) structure (without any seismic provisions) located in medium to large seismic hazard regions. The population, age and size of the buildings also vary from small to large representing the different case within case study. All the cost values were calculated for time basis 2010 and presented in US dollar .Effective interest rate for a discounting period of25 years and less (i.e. retrofitting projects) is taken as %12 and for longer period up to 50 years is considered as %10.
Table 2 – Financial analysis summary for two mitigation measures in school country
Proj
ect #
General Characteristic Retrofitting New Build
Type A
m2 Year
Pop
ulat
ion
Prov
ince Total
Anual cost(100$)
CER (1)
Total Annual
Cost(100$)
CER (2)
1 S 1875 1993130
0 ZN 60 5 918 712 S 690 1982 420 KHs 43 10 340 81
3 S 3635 1976160
0 AZw 247 15 1858 1164 C 2051 1995 600 QM 94 16 712 1195 S 1255 1998 300 SM 73 24 565 1886 M 2176 1972 600 AZw 151 25 531 897 S 1839 1992 475 QM 123 26 820 1738 C 1550 2001 350 MZ 115 33 534 1539 M 1507 1997 300 GZ 102 34 364 12110 S 980 1992 320 SM 125 39 453 14211 S 2063 1995 400 SB 204 51 912 22812 S 1296 1971 300 LO 172 57 582 19413 M 824 1970 340 AZw 191 56 223 65
14 M 745 1980 300 ZN 72 24 200 67
15 M 980 1991 350 GL 150 43 258 74
16 M 1080 1985 350 HM 220 63 281 80
17 S 1551 1986 150 GL 145 97 671 44718 M 317 1984 80 AK 55 68 85 106
19 M 350 1981 80 MZ 51 64 94 118
20 S 1432 1981 215 KB 287 133 631 29421 M 620 1990 90 AK 73 81 148 165
The projects sorted out based on the CER indices that represent how much dollar to be spent annually per student for each option. From the CEA indices listed above, it appears that the costs for the retrofitting measure are normally less than the cost for reconstructing; but to what extent one could accommodate go/no go decisions. There is no code of practice identified for such this situations; though empirically, local procedure limits the costs ratio of two options to %30. In the other word, if retrofitting costs of a typical school exceeded more than %30 of its reconstruction value, the retrofitting measure
9

should be discarded. Some issues could arise by using this policy in practice. First regular procedure take the construction costs as a sole factor for comparing different options while LCC model (total cost n economical life) to be used to get more accurate results. Secondly, this procedure may works for individual projects, but it fails in comparing multiple projects where great degree of seismic risk is involved. The current model takes both LCC and seismic risk into the account. Succeeding sections describe the seismic risk effects on economic assessment and revise the above table accordingly.
5. Fuzzy risk assessment
The nature of earthquake hazard has imposed substantial uncertainties on the seismic risk assessment (SRA) process, which has hampered the applicability of conventional methods in planning and project management. The uncertain feature of seismic risk might arise from randomness and fuzziness of an earthquake event. While occurrence of earthquake has random nature, the severity (or magnitude) of earthquake is a fuzzy concept (Bezdek 1988). Moreover, evaluating the adverse outcome of an earthquake make it too complex to understand and describe by the means of randomness. Fuzzy set theory has been known as a useful technique for handling such this uncertainties that often arises in SRA process (Tesfamariam et al , 2010). In conventional approach, risk was regarded as a product of severity of loss and the likelihood which was measured using probability distribution; However this approach is effective only in case that great amount of data are available; Besides , it is difficult to precisely address the relationship between an events occurrence and its probability distribution. Conventional fuzzy risk assessment has been developed in many application such as natural hazards (Chongfu 1996); construction project risk assessment (Zeng et al 2007; Ismail et al 2008 ; Neito and Ruz 2011) oil and gas industry (Miri lavasani et al 2011); environmental risk assessment (Uricchio et al 2008 ). Current research employs new holistic definition of risk which is adopted by UNDRO (1980) for management and planning purposes. Holistic definition describes the risk as interaction of hazard (H), vulnerability (V), exposed elements (E ) and response management (RM) in one expression :
R = H x V x E x RM (4)
The term “Hazard” is used to represent the degree of magnitude and severity of a disaster event that threats the human life, buildings and infrastructure. Exposure describes the number of people, and the value of property and structures that may adversely impacted by likely a hazard. Vulnerability and resilient are two basic concepts that are used for assessing the seismic risk. They denote the “capacity of resistance” (toughness) and “susceptibility“of the assets and population against severe hazards respectively. Response management denotes the ability and capacity of the disaster management authorities, institutions, plans and infrastructures to response and to recover in the event of likely earthquake and aftermath. For further review readers are referred to Vahdat & Smith (2010 a,b). Fuzzy logic meaningfully provides an interaction of risk factors in a common scale by incorporating degree of uncertainty in each variable and thus it can better present the seismic risk concept in such real situations. Similarly, the fuzzy seismic risk assessment can be obtained by following expression:
FSRi = Max {H ^ V ^ E ^ RM} = Max {Min{H,V,E,RM}} (5)
10
This expression is underpinning concepts of holistic seismic risk assessment that is expressed in fuzzy logic. Let X be universe of discourse and x be generic elements of X. H , V , E and RM are classical sets that { H X , V X , E X , RM X } and each fuzzy set factor can be defined as a set of ordered pairs
H= {(x, µH(x))| x Є X} ; V= {(x, µV(x))| x Є X} ; E= {(x, µE(x))| x Є X} ; RM= {(x, µRM(x))| x Є X} (6)
where µH(x) , µV(x) , µE(x) , µRM(x) are called the membership functions (MFs) representing the fuzzy set of H , V , E and RM .The intersection of these fuzzy factors aggregates the four MFs produce the FSRi :
FSRi = µH∩V∩E∩RM(x) = µH(x) µV(x) µE(x) µRM(x) (7)
Where fuzzy min operator is defined in most of fuzzy mathematic textbook.
5.1 Establishing hierarchy structure
Based on conceptual framework of seismic risk outlined above, the fuzzy risk assessment structure for school retrofitting projects can be developed using hierarchical presentation of risk contributing factors and attributes. The hierarchy of the current problem was constructed in three levels as indicated in Figure 2. Level I denotes the objective of the decision problem defined as”fuzzy seismic risk index” (FSRi). More specifically, the overall goal of this application is to evaluate the seismic risk index for different retrofitting school projects in Iran and identify the most and least risky projects respectively. Level II represents a category of factors play mainly in seismic risk assessment. These factors were discussed in earlier section and literature as major attributes that characterize the seismic risk. Level III contains the sub-factors of each major factor. Four major risk factors and 19 corresponding risk attributes were identified from extensive literature review and the expert’s opinion. Each expert was asked to identify possible factors that could affect the seismic risk through several surveys, questionnaire and discussions until a consensus was reached. The fourth level of the hierarchy represents the alternative regions that seismic risk to be evaluated over them.
11

Fuzzy Seismic Risk Index (FSRi)
Level 2Risk Factors
Hazard (H)(Site specific)
Vulnerability & Resilient (VR)
Exposure (E)
Level 3Risk attribute
Level 1Risk Index
SOIL TYPE
CLOSNESS TO FAULTccPOTENTIAL INSTABILITY
RETURN PERIOD
POPULATION DENSITY
POPULATION DENSITY
POPULATION EXPOSED
BUILDING AGE
HOURS OF OPERATION
USERS AGES
STRUCTURE TYPE
Response Management (RM)
ENGINERING PERFORMANCE
AREA EXPOSED
ASSET VALUE EXPOSED
HOSPITAL INDEX
POPULATION INDEX
PHYSICIAN INDEX
PLANNNG & DISASTER MANAGEMENT INDEX
INFRASTRUCTURE INDEX
LIQUIFATION SUCCEPTIBILITY
SLIDING SUCEPTIBILITY
CODE INDICATOR
CODE CONFORMANCE
Figure 2 – Proposed fuzzy risk assessment framework
Based on the conceptual framework of seismic risk articulated above and considering the most influence attributes identified through literature and seismic experts, framework for the FSRA was established. The hierarchical structure of the problem was constructed in four levels as demonstrated in Figure 6. Four major factors, namely H, V, E, RM were adopted at the second level. These criteria are further broken down into sub-criteria to reflect the dimensions more precisely. For example, hazard was characterized by six attributes namely H1 to H5. Some of risk attributes such as “Return period” were selected to take intensity earthquake hazards into the account. The indicator “Closeness to the faults” also represents the potential hazard which might happen for a project during its life cycle. Potential instability refers to collateral hazards caused by liquefaction and sliding due to building site condition. “Liquefaction susceptibility” could amplitude the hazard by reducing the bearing capacity of the grades during an earthquake event. “Sliding susceptibility” indicates the topographical impacts that may occur if the building located on slope or susceptible soil, a collateral hazard can be triggered following an earthquake. Obviously, the population density in a school can propagate the people’s loss and consequently has a direct impact on the seismic risk; likewise, other factors were broken into more detailed attributes so as to be measured more precisely.
5.2 Fuzzy representation of risk attributes
12

µ1
Risk assessment is a subjective process and the information and quantities in describing a risk are inherently imprecise and uncertain. Thus linguistic variable scale is often used to deal with various and uncertain risk values. The use of such scale allows a precise modeling of imprecise statements as “low”, “very low to fairly “ (Schmucher 1984).Describing a risk may considerably vary in practice due to various individual perception , situation and application-specific. Thus providing a common scale to describe various risk factors and attributes is crucial step in risk assessment process. Using linguistic terms allows expert judgment to be managed in a monotonous and consistent manner. Several membership function (MFs) can be used to develop fuzzy expert system such as triangular, trapezoidal, Gaussian, etc. Current research employs triangular scale to describe the various risk attributes at first level of hierarchy. Alternatively, for some output variables within the hierarchy that requires more accuracy, Gaussian function was also implemented. Karwowski and Mital (1986) recommended using five to nine linguistic terms to get high performance results in judgment process. Having reviewed the attributes and considering the expert opinion, five level scale is adopted for linguistic variables including “very low” (VL) , “low” (L) , medium” (M) , “high” (H) and “very high” (VH) as illustrated in Figure 3.
Figure 3 – MFs for weight measurement
Regarding to the case study for instance, five categories of linguistic scale are developed for risk attributes as indicated in Table 3. This classification covers the whole range of data including min and max values; Though some qualitative attributes may be simply described by three or four scales such as return period , H1 (as indicated in local seismic code) or engineering index V2 , due to nature of data.
Table 3 – Linguistic scale representation of risk attributes
# Seismic risk attribute UNIT VL L M H VHH1 Return period (hazard index)* - - 0.2 0.25 0.3 0.35
H2 Closeness to fault Km - >20 10-25 <10 -
H3 Potential instability - - Low Normal High -
H4 Soil type* - I II III IV -
H5 Population density student/area <0.15 0.05-0.35 0.25-0.55 0.45-0.75 >0.65
V1 Structure index * - E D C B AV2 Engineering performance - 6-8 4-7 1-5 <2 -V3 Building age Years <10 5-20 15-30 25-35 >30V4 Population density student/area <0.15 0.5-0.35 0.25-0.55 0.45-0.75 >0.65
13

V5 Hours of operation Hour - <4 3-6 5-8 >7V6 Users age Years - <8 6-12 10-17 >16
E1 Population exposed student <100 50 - 150 100 - 350 300-500 >450E2 Asset exposed (x$1000) <200 100 - 300 200- 500 400-700 >600E3 Area exposed m2 <200 150-350 300-750 700-1000 >900
R1 Hospital index Bed <50 20-100 80-250 200-550 >450
R2 Physician index Per 100,000 <100 60-300 250-750 600-1600 >1400
R3 Region population index x 10,000 >100 70-100 25-80 5-30 <10
R4 Planning & disaster Mng. Index - <4 3-6 5-8 7-10 -
R5 Infrastructure index(accessibility) - - low medium high -
* Taken from local code
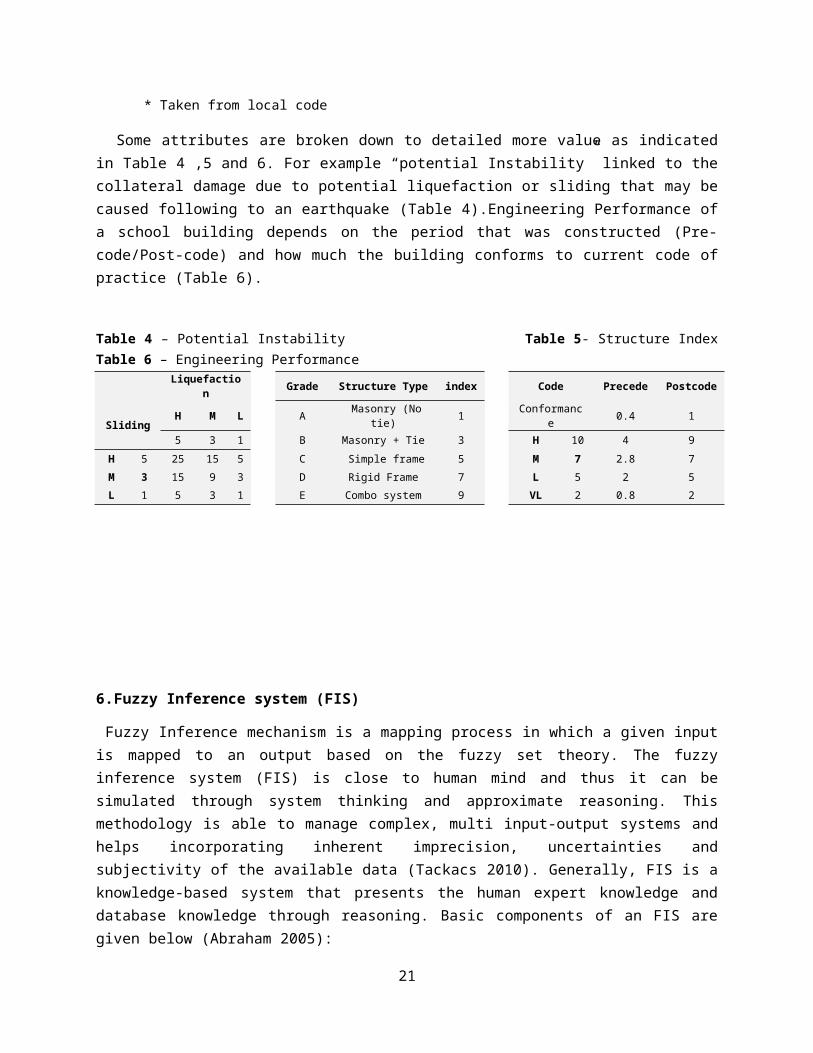
Some attributes are broken down to detailed more value as indicated in Table 4 ,5 and 6. For example “potential Instability” linked to the collateral damage due to potential liquefaction or sliding that may be caused following to an earthquake (Table 4).Engineering Performance of a school building depends on the period that was constructed (Pre-code/Post-code) and how much the building conforms to current code of practice (Table 6).
Table 4 – Potential Instability Table 5- Structure Index Table 6 – Engineering PerformanceLiquefaction Grade Structure Type index Code Precede Postcode
SlidingH M L A Masonry (No tie) 1 Conformance 0.4 15 3 1 B Masonry + Tie 3 H 10 4 9
H 5 25 15 5 C Simple frame 5 M 7 2.8 7M 3 15 9 3 D Rigid Frame 7 L 5 2 5L 1 5 3 1 E Combo system 9 VL 2 0.8 2
6. Fuzzy Inference system (FIS)
Fuzzy Inference mechanism is a mapping process in which a given input is mapped to an output based on the fuzzy set theory. The fuzzy inference system (FIS) is close to human mind and thus it can be simulated through system thinking and approximate reasoning. This methodology is able to manage complex, multi input-output systems and helps incorporating inherent imprecision, uncertainties and subjectivity of the available data (Tackacs 2010). Generally, FIS is a knowledge-based system that presents the human expert knowledge and database knowledge through reasoning. Basic components of an FIS are given below (Abraham 2005):
14

FuzzyInput Rules
FuzzyOutput
CrispInput
CrispOutput
Inference engineFuzzification Defuzzification
Rule base Data baseKnowledge
base
Fuzzification : The crisp input are fuzzified using membership functions (MFs) or linguistic variables already defined to determine the degree of truth for each rule antecedent
Knowledge base: Expert knowledge can be represented in the form of rules and data to the Inference system. The rule base is characterized in the form of If-Then rules in which an antecedents and consequents
Inference engine: Applies the reasoning process through inference procedure whereby the truth value of the rules are examined against each antecedent and applied to each consequent part of the rule. All the fuzzy variables are then combined together and form a single fuzzy output for each variable.
Defuzzification: converts the fuzzy output extracted from Inference engine to a crisp output which can be normally used in real world
The relationship of above components is illustrated in Figure 4.
Figure 4 – Structure of fuzzy Inference system (FIS)
Two most popular Inference systems known as Mamdani (1975) and Takagi Segeno(1985) have been widely used in various applications. The difference between two methods lie in their reasoning rules and thus their aggregation and defuzzification process differ accordingly. The proposed fuzzy model is based on Mamdani fuzzy model since it has been widely accepted in fuzzy expert system development (Negnevitsky 2004). Min-Max fuzzy operator is selected on the basis of fuzzy risk concept already defined. For defuzzification process the center of area (COA) method is adopted due to its simplicity and practicability. Having applied FIS ( ) module in different levels of hierarchy, the overall framework can be represented in the form of fuzzy relations as depicted in Figure 5.
15

Economic Assessment
RMR
Rules
E
Rules
V
Rules
H
Rules
FSRi
Rules
F CER
Rules
H1 .
Rules
. . . . .Rules FuzzyRules
H5V1 .
Rules
. . . . .Rules FuzzyRules
V6E1 .
Rules
E2 .
Rules
FuzzyRules
E3R
M1 .
Rules
. . . . .Rules FuzzyRules
LEVEL 3: Risk Attributes
Rules
CER
Financal Analysis
LCC
FuzzyRules Fuz
zyRules
LEVEL 2: Risk Factors
Rules
LEVEL 1: Index
Rules
LEVEL 0: Combined Indices
Rules
PAI
Rules
Seismic Risk Assesm
ent
Rules
RM5
Figure 5 – Fuzzy expert system representation of proposed framework
6.1 Rule base for fuzzy risk assessment
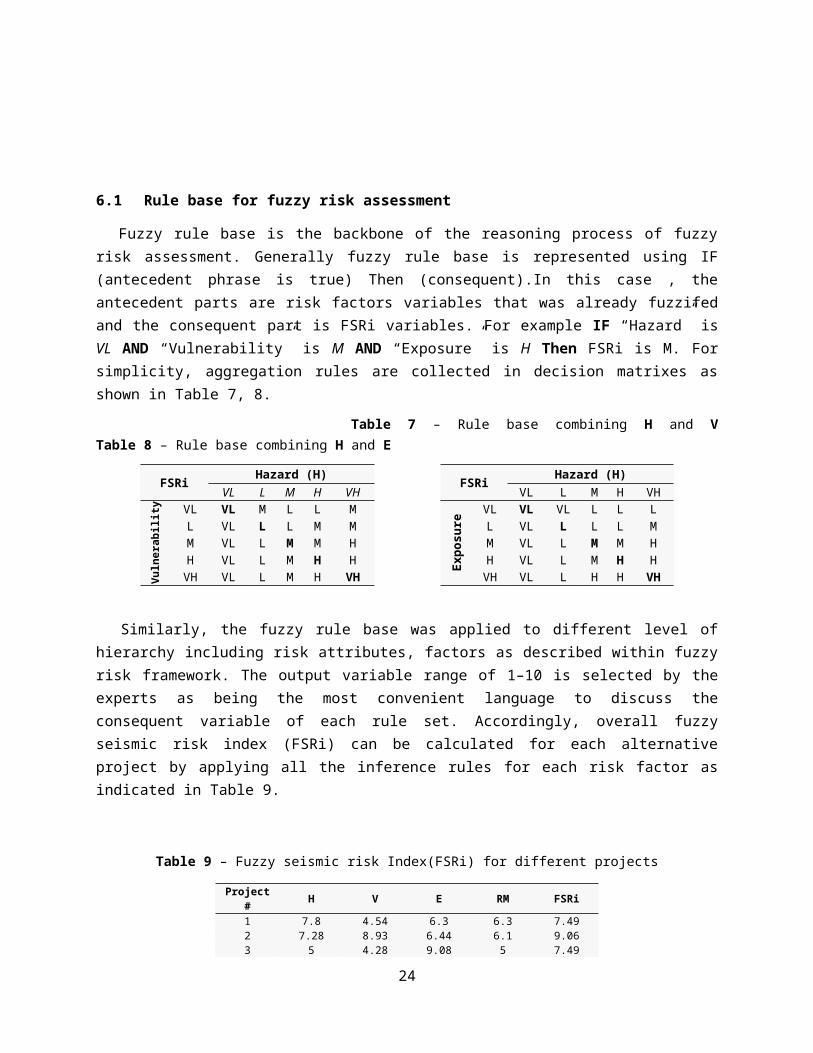
Fuzzy rule base is the backbone of the reasoning process of fuzzy risk assessment. Generally fuzzy rule base is represented using IF (antecedent phrase is true) Then (consequent).In this case , the antecedent parts are risk factors variables that was already fuzzifed and the consequent part is FSRi variables. For example IF “Hazard” is VL AND “Vulnerability” is M AND “Exposure” is H Then FSRi is M. For simplicity, aggregation rules are collected in decision matrixes as shown in Table 7, 8.
Table 7 – Rule base combining H and V Table 8 – Rule base combining H and E
16

FSRiHazard (H)
FSRiHazard (H)
VL L M H VH VL L M H VH
Vuln
erab
ility
( v) VL VL M L L M
Expo
sure
(E) VL VL VL L L L
L VL L L M M L VL L L L MM VL L M M H M VL L M M HH VL L M H H H VL L M H H
VH VL L M H VH VH VL L H H VH
Similarly, the fuzzy rule base was applied to different level of hierarchy including risk attributes, factors as described within fuzzy risk framework. The output variable range of 1–10 is selected by the experts as being the most convenient language to discuss the consequent variable of each rule set. Accordingly, overall fuzzy seismic risk index (FSRi) can be calculated for each alternative project by applying all the inference rules for each risk factor as indicated in Table 9.
Table 9 – Fuzzy seismic risk Index(FSRi) for different projects
Project# H V E RM FSRi1 7.8 4.54 6.3 6.3 7.492 7.28 8.93 6.44 6.1 9.063 5 4.28 9.08 5 7.494 3.97 2.97 6.73 4.7 2.55 2.7 1.84 3.8 4.6 2.526 3.51 3.98 6.75 4.9 6.487 3.22 2.89 5 4.6 2.538 2.72 3.90 3.8 4.69 4.719 5 1.85 3.56 5.3 2.5210 6.45 3.06 3.66 6.6 4.711 2.72 2.26 4 3.5 2.512 7.28 3.00 4.02 4.4 7.413 5 4.29 3.82 4.4 514 5.15 4.13 3.55 6.2 3.1915 5 2.82 4 6.3 2.616 4 2.64 3.97 2.5 2.5117 5 2.16 2.23 3.5 518 2.68 3.41 1.8 6.2 2.1819 5 6.23 4 5 5.7420 5 6.80 3.4 5 6.821 4.82 2.26 2.08 6 5
7. Project assessment Index (PAI)
A new project assessment Index (PAI) is developed to address the interaction of both FSRi and CER calculated in previous steps of analysis. The PAI integrates both seismic risk and CER for each retrofitting project employing a common fuzzy scale. The logic rules for combining each state of seismic risk and CER can be determined through expert opinion and can be imported to FIS engine as shown in Figure 6.
17
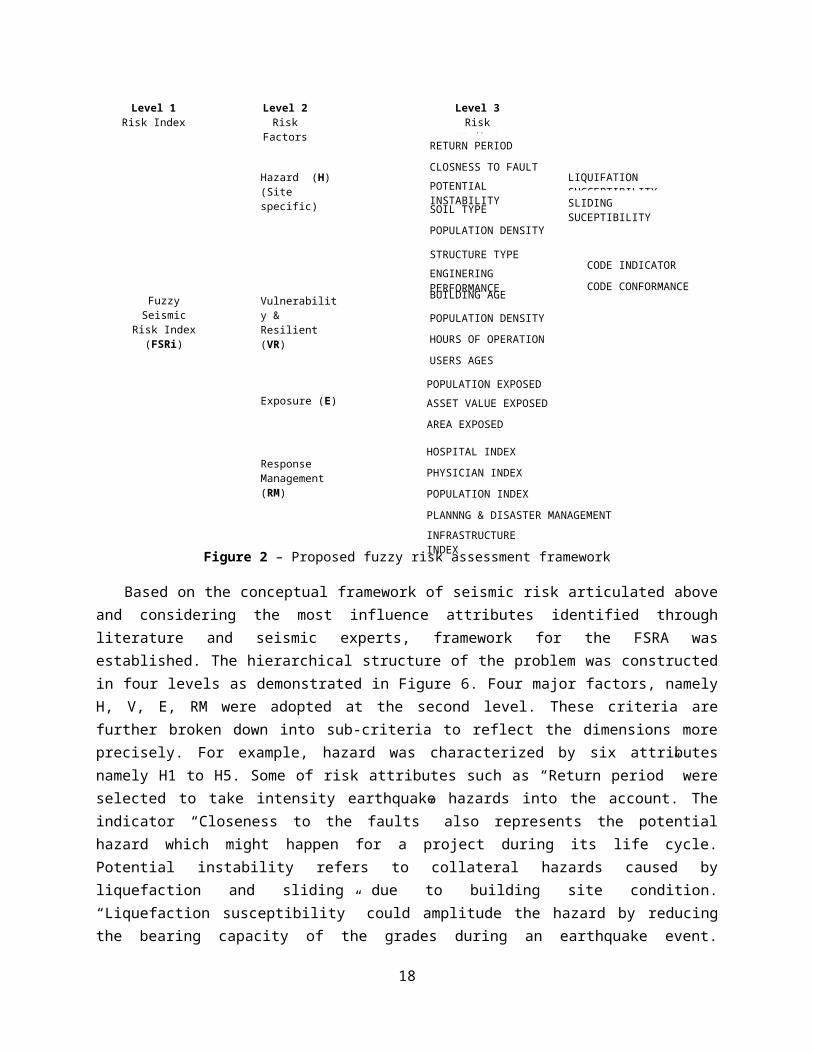
Figure 6 – Importing rules into FIS engine
Since each factor has five grade of membership, there are totally 25 possible combinations of FSRi and CER to be defined within the reasoning process. These rules are shortly expressed in decision matrix as shown Table 10.
Table 10 – Rule base combining CER and FSRi
PAI FSRiVH H M L VL
CER
VL VH H M L LL H H M L LM H M L L VLH M L L VL VL
VH L L VL VL VL
The contribution of each rule in FIS can be verified using rule viewer embedded in MATLAB® as illustrated in Figure 7.
18

Figure 7 - Rule viewer for FSRi and CER
The implemented FIS relied heavily on expert’s knowledge and experience. Expert’s Knowledge and experience was needed in the determination of membership functions for each input and output variable, and in the determination of If–Then rules that define the relationships between inputs and the output. The preliminary results of PAI was developed using five triangular MFs as indicated Table 11.
Table 11 – Project ranking before and after seismic risk combination
Project Ranking FSRi CER PAIAfter Before Triangular Gaussian
1 2 9.06 10 93.1 88.32 1 7.49 5 76.4 74.63 3 7.49 15 76.4 74.54 6 6.48 25 74.3 71.55 12 7.4 57 55.3 496 8 4.71 33 46.4 48.37 10 4.7 39 40.6 43.88 13 5 65 25 29.69 4 2.5 16 25 29.5
10 7 2.53 26 25.7 29.411 5 2.52 24 25.4 29.312 9 2.52 34 25.4 29.313 11 2.5 51 25 27.214 20 6.8 97 25 25.115 17 5 133 25 24.816 14 3.19 67 22.4 23.617 19 5.74 118 21 22.818 15 2.6 74 20.4 20.819 16 2.51 80 17.5 16.820 21 5 165 6.72 13.221 18 2.18 106 7.64 11.6
19

As it can be seen (in column 5) there are some projects that their PAI are identical, for instance the project numbers 8 and 9 have the same PAI as 25. To improve the accuracy of calculation and possible differentiating between PAI, the Gaussian MFs is also examined that is shown in the last column. Obviously, changing the MFs from linear to nonlinear function can sharpen their corresponding results. Finally, the ranking of the projects can be reordered according to the PAI developed for each retrofitting building. The results demonstrate a reasonable order that is taken into the account both factors by keeping the high performance projects before low performance ones. The ranking results before and after combination with seismic risk implicitly express that low performance (low CER) projects order can be considerably changed while in low performance (high CER) projects it happens slightly. Simultaneously, projects ranking also follow the seismic risk trend in descending order as well. A graphical demonstration of PAI as function of FSRi and CER is depicted in Figure 8. The graphs shows that PAI could have an opposite trends for high performance and low performance projects. In high performance projects the PAI deeply increases as long as slight rise in FSRi while in low performance projects this occurs conversely and in a relatively constant pace.
High performance projects Low performance projects
Figure 8 – Surface view of project assessment Index (PAI)
20
8. Sensitivity analysis and model verification
Model verification is performed to ensure both the model parameters and technique is correctly adopted. Previous seismic risk results in literature are used as benchmark to verify the robustness and reliability of the model. The effects of changing the risk factors and risk attributes on FSRi and overall ranking order are also studied through sensitivity analysis. In particular, this process focused on how do variations in the seismic risk parameters such as hazard and vulnerability as well as economic factors affects the project ranking.
VL L M H VH0%
10%20%30%40%50%60%70%80%90%
100%
RMEVH
Figure 9 – Contribution of different seismic risk factors in fuzzy scale
Variation in risk contributing factors is illustrated in Figure 9. Clearly, this chart indicates implicit weighting of each factor in different fuzzy situations comprising VL to VH. The average weights of seismic risk factors comprising H, V, E, and RM are %45, %30, %15 and % 10 respectively. The variation of the weights reveals that RM with %22 is the most sensitive factor in the process and the others varies between %5 to %12 that is acceptable comparing to past studies. According to the comparison of the results of sensitivity analysis performed with the results obtained by previous studies as baseline (shown in Table 9), the current results present the least variation in seismic risk drivers. The weighting sum method (WSM) and analytic hierarch process (AHP) demonstrate more uncertainty in results. It also shows that the results do not show the extreme changes over most important risk factors such as Hazard and vulnerability. The accuracy of the result depends upon the degree uncertainty observed in the results, how realistic the model is and how well the input distributions represent the true uncertainty of variation. Thus if the range of variation (or uncertainty) of risk attributes is reasonable, as it is in the current fuzzy SRA, the results of the model will be stable and reliable.
Table 12 – Comparison of the risk parameter uncertainty in some weighting SRA model
21

Model Category Approach
Risk factor variation Reference
Urban disaster risk Index WSM 35 Davison & Shah (1997)
Holistic seismic risk evaluation in urban centers AHP 29 Marulanda et al (2008)
Holistic seismic risk at regional level AHP 33 Vahdat & Smith (2010a)
The quality of the evaluation technique can be also verified through its applicability, adaptability, transparency, completeness and robustness. Applicability presents how model fit the problem and objectives and how adaptable with different range of information. Transparency is linked to the structure of the model and shows how flexible the model is in structure and algorithm. Adaptability refers the ability that a model can be used in a similar situation. Completeness represents how comprehensive the model is in both input and output parameters. “Robustness is related to the stability and reliability of the method to deal with the uncertainty of input data and the modeling parameters“ (Marulanda et al 2008). Given the imprecise data, which is the prime challenge for development of the risk model, fuzzy expert system has been demonstrated as a reliable and robust technique to deal with such situation. Its transparency allows profound scrutiny in each level of hierarchy along with visualization of risk attributes and risk factors that makes it easier for understanding and verification.
9. Implications and limitations of the research
The fuzzy seismic risk Index developed by the research reinforces the need to distinguish between conventional probabilistic approach and holistic fuzzy approach. Depending on the problem objectives situation, availability of data, appropriate technique can be adopted. There are many reasons why fuzzy-based methodology is preferred to probabilistic approaches in planning , management (and risk mitigation) application of seismic risk: first the former required great amount of data which is not available in many cases; second for management purposes , fuzzy sets able to address the interaction of active risk drivers while the former cannot; third some features of an earthquake as timing , location and severity and adverse outcomes of a earthquake impose great uncertainties which cannot be described precisely through probabilistic process; forth occurrence of an earthquake event is too complicated (sometimes impossible) to understand and describe by the means of probability distribution while fuzzy set provides an easily understandable way to reconcile risk attributes and compare them effectively. Nevertheless, the fuzzy approach cannot be replaced for many situations such as hazard analysis which is inherently involved with different type of uncertainty as randomness. Some limitation to the possibility of these results has to be also considered. For instance the number of the rule base combination could be progressively increased for the fuzzy grade of five and over.
10. Summary and discussion
22

An economic-seismic risk model has been developed to evaluate school retrofitting projects by the mean of CER (cost per student saved), seismic risk metrics such as fuzzy seismic risk Index (FSRi) taking to the account the seismic hazard and vulnerability effects of different retrofitting buildings scattered across country. It has been shown particularly for retrofitting projects that CER factor could be more determinant criteria for go/no go decision making rather than conventional investment evaluators such as IRR, B/C etc. Different techniques for handling uncertainty were evaluated and results indicate that seismic risk factors affecting the retrofitting costs can be successfully modeled, assessed and managed using fuzzy set theory. The applicability of the model is tested on real case of retrofitting school projects in Iran. It is demonstrated that ranking of retrofitting project could be considerably affected by likely risk variation. Thus investment decisions in seismic prone area should be made in conformance with the multi dimensional aspects of seismic risk. Management of uncertainty was significant issue in current risk-based expert system because much of the information in the knowledge base collected from expert opinions which is imprecise or could even not completely reliable. Current research demonstrated that how fuzzy expert system provides an alternative approach to tackle uncertainty issue in complex SRA model more effective than the one already provided by a weighting methods such as WSM and AHP. The proposed approach demonstrated several advantages:
It enables the synthesis of both financial and risk data into a single framework; It assigns memberships to various levels of seismic risk instead of a crisp number for different
state of risk (i.e. very low to very high) and reduce that vagueness using natural language scale; It can deal with both highly reliable and less reliable data and thus it is able to manage the
uncertainty due to impreciseness Knowledge base module accommodates the experience by storing all relevant information,
data , rules ,cases used by the expert system It can be used to guide decision makers to focus attention on those project which have the most
adverse impact in a likely earthquake event; The Interaction effects of seismic risk can be maintained through this model The sensitivity of the risk factors in current expert system are far less than weighting approach The fuzzy system is easily programmable for computer applications and can become a risk
analysis tool for a decision makers;
The limitations of the proposed method are:
It may be sensitive for the selection of aggregation operators. A trial and error approach may be required to avoid unexpected errors;
The number of rules could considerably rise up due to fuzzy grade of five and more that make the possible combinations difficult to quantify
Findings from this research are beneficial to both researchers and professional involved in seismic mitigation planning and management and for school rehabilitation offices in particular. The results of this current study add to the young body of literature examining the socio-economic aspects of earthquake by making knowledge-base experience and using it in future events. The findings give new insight into the impact of seismic risk on critically economical decision making.
23
11. References
Abraham, A. (2005) Rule-based Expert Systems in “Handbook of Measuring System Design”, edited by Peter H. Sydenham and Richard Thorn, John Wiley & Sons
Arikan , M. , Sucoglu , H., Macit , G. (2005) Economic assessment of the seismic retrofitting of low-cost apartment buildings , Journl of earthquake engineering , Vol.9 , (4) 577-584
Bezdek , J (1987) “Analysis Of Fuzzy Information “, CRC press , 67-73Borjikhani,B (2010) Management on Building Repairing and Maintenance (Case Study of Schools) , Msc
thesis , University of science and technology , IranBostrom ,A., French, S.P., Gottlieb ,S(2008) Risk Assessment , Modelling and Decision Support, SpringerCardona , O. et al (2009) “Earthquake Loss Assessment for Integrated Disaster Risk Management “ ,
Journal of Earthquake Engineering, 12(S2):48–59, 2008Chongfu , H., (1996) “Fuzy risk assessment of urban natural hazards “ , Fuzzy sets and systems (83) 271-
282Davidson R.A and H. C. Shah (1997) “An Urban earthquake disaster risk Index(EDRI)”, The John A.Blume
Earthquake Engineering Centre Dimovaa,L ., Sevastianova, P. , Sevastianov , D. (2006) “ MCDM in a fuzzy setting: Investment projects
assessment application “,Int. J. Production Economics , (100) 10–29Dolan, A., Edlin ,R. (2002) “Is it really possible to build a bridge between cost-benefit analysis and cost-
effectiveness analysis “, Journal of Health Economics (21) 827–843Dowrick, D.J. (2003) Earthqauke risks reduction actions for New Zealand. Bulletin of the New Zealand
Society for Earthquake Engineering (NZSEE), 36(4), 249–259.Egbelakin ,L. , Wilkinson ,S. , Potangaroa ,R. and Ingham J. (2011) “Challenges to successful seismic
retrofit implementation: a socio-behavioral perspective “ , Building Research & Information , 39(3), 286–300
Ergonul, S. (2006) “A probabilistic approach for economic analysis of a shopping center in seismic zone”, Civil Engineering and Environmental Systems , Vol. 23, No. 2 57–63
Hewings, G.J.D. and Mahidhara, R. (1996) Economic impacts: lost income, ripple effects, and recovery, in:S. Changnon (Ed.) The Great Flood of 1993, pp. 205–217 (Boulder, CO: West View Press).
Idris , A., Nurrudin M., Rohman M.A. (2011) “ Development ofproject cost contingency estimation model using risk analysis and fuzzy expert system ,Expert system with application (38) 1501 - 1508
Ismail , A., Abd A., Chik Z. (2008) “ Aproach to analyze risk factors for construction projects utilizing fuzzy logic” , Journal of Applied science , Vol 8 , (20) 3738 – 3742
Karwowski, W., Mital, A. (1986) “Potential applications of fuzzy sets in industrial safety engineering”, Fuzzy Sets and Systems ,Vol 19, 105–120.
Kahraman, C., Tolga E., Ulukan, Z. (2000): Justification of manufacturing technologies using fuzzy benefit/cost ratio analysis. International Journal of Production Economics, Vol. 66, No. 1, 45-52
Kahraman, C., Ruan D., Tolga, E. (2002): Capital budgeting techniques using discounted fuzzy versus probabilistic cash flows. Information Sciences, Vol. 142,No. 1-4, 57-76
Kahraman,C.. , Gülbay , M. and Kabak , O (2006) “Fuzzy Engineering Economics and Investment Analysis Techniques” , Springer-Verlag Berlin Heidelberg
Mamdani, E.H. and Assilian, S. (1975) An Experiment in Linguistic Synthesis with a Fuzzy Logic Controller. International , Journal of Man-Machine Studies, 7(1), 1–13.
Marulanda,M.C.,Cardona,O.,Barbat,A., (2008). "Robustness of the holistic seismic risk evaluation in urban centers using the USRi." Natural Hazards.
Miyasato, G.H. Levitt R. , Bpisssonnade , A. (1986) “ Implementation of a knowledge based seismic risk evaluation system on micro computers”, Artificial Intelligence, Vol 1 , No. 1
Misra , K.B. (2006) “Handbook of performability engineering “, Springer-Verlag , London
24

Miri Lavasani , S.M., Yang, J. Finlay, J. , Wang , J. (2011) “Fuzzy risk assessment of oil and gas offshore wells , Process Safety and Environmental Protection” , (89) 277–294
Mechler ,M. (2005) “Cost-benefit Analysis of Natural Disaster Risk Management in Developing Countries”, Manual , Federal ministry for economic co-operation and development , Germany
Mechler ,M. (2008) “From Risk to Resilience: The Cost-Benefit Analysis Methodology” , ProVention Consortium; Institute for Social and Environmental Transition (IIASA)
Mohamed, S., McCowan, A.K. (2001) “ Modeling project investment decisions under uncertainty using possibility theory”, International Journal of Project Management , (19) 231–241.
Negnevitsky,M (2004) Artificial Intelligent : A guide to intelligent system (2nd ed.) , London , Adison-Wesley
Nieto Morote , A., Ruz Vila , F (2011) “ A fuzzy approach to constructing project risk assessment “, International Journal of Project Management , (29) 220 - 231
NSI (2010) “National School Inventory“, Organization of school renovation and rehabilitation, seismic rehabilitating office, Tehran, Iran
Smyth, A.W et al (2004) “Probabilistic Benefit-Cost analysis for earthquake damage mitigation: evaluation measures for apartment houses in Turkey” , earthquake spectra , Vol 2, o 1 ,pp 171-203
Schmucker , K.J(1984) “Fuzzy sets, natural language computations , and risk analysis, Computer science press, Inc
Takagi, T. and Sugeno, M. (1985) Fuzzy identification of systems and its applications of modeling and control, IEEE Transactions of Systems. Man and Cybernetics, USA (pp. 116–132).
Tackacs , M (2010) Hierarchical risk management model with gained fuzzy parameters , Obuda university bulletin , vol 1
Turaga, R. and Ponomariov, B. (2006) Earthquake mitigation decisions and consequences. Earthquake Spectra, 22(2), 313–327.
Tesfamariam,S., Sadiq,R. and Najjaran , H. (2010) “Decision Making Under Uncertainty—An Example for Seismic Risk Management “ , Risk Analysis, Vol. 30, No. 1
Tesfamariam , S. , Snchez Silva , M. (2011) “ A model for earthquake risk management based on the life cycle performance of structures” , Civil engineering and environmental systems , Vol 29 , (3) 261-278
Uricchio,V. , Giordano,R., Lopez , N., (2008) “A fuzzy knowledge-based decision support system for groundwater pollution risk evaluation”, Journal of Environmental Management (73) 189–197
UNDRO(1980) “Natural Disasters and Vulnerability Analysis” , Report of Experts Group Meeting, Geneva. UNDP, 2007. Participatory local governance: LIFE’s method and experience 1992-1997 (UNDP Technical
Advisory Paper 1). http://www.undp.org/governance/programmes/life/LIFE.pdf Vahdat , K.,Smith , N.J (2010a) “A DSS framework for selecting projects in seismic areas”, ARCOM
conference Leeds , Sep 2010 , Leeds , UK Vahdat , K.,Smith , N.J (2010b) “Multidisciplinary Integrated tools in seismic risk management”, CIB
world congress , 2010 May 10th - 13th, The Lowry, Salford Quays, UKVenkataraman R. and Pinto, J.F (2008) “Cost and value management in projects” ,John Wiley & Sons, Xu, Y et al , Chan, A. and Yeung J.F. (2010) “Developing a Fuzzy Risk Allocation Model for PPP Projects in
China” , journal of Construction Engineering and Management , 894-903Yuan,Z. ,Jiang,W., Bi , J. (2010) “Cost-effectiveness of two operational models at industrial wastewater
treatment plants in China: A case study in Shengze town, Suzhou City” , Journal of Environmental Management , (91) 2038 – 2044
Zadeh , L.(1965) “Fuzzy sets. Information and Control “ , 8 (3), 338–353.Zeng , J., An ,M., Smith , N.J. (2007) “ Application of a fuzzy based decision making methodology
construction project risk assessment” , Int. J. of Project of management , (25) 589-600
25


