Seismic Reflection Exploration of Karst Phenomena of a ... · eSeismic Reflection Exploration of...
8
Proceedings World Geothermal Congress 2010 Bali, Indonesia, 25-29 April 2010 1 eSeismic Reflection Exploration of Karst Phenomena of a Geothermal Reservoir in Southern Germany Ruediger Thomas, Ewald Lueschen and Ruediger Schulz Leibniz Institute for Applied Geophysics (LIAG), Stilleweg 2, 30655 Hannover, Germany [email protected] Keywords: Low-enthalpy Reservoir, Karst, Seismic Exploration, 3D Seismics. ABSTRACT A geothermal power plant in Unterhaching, south of Munich/Germany, generates 3.36 MW of electrical power. Two boreholes (doublet) penetrated the top of the Upper Jurassic (Malm) at a depth of approx. 3000 m. The Malm which is present in most parts of the Southern German/Upper Austrian Molasse Basin is a highly- productive aquifer with increasing depths and temperatures from north (Danube River) to south (Alps). Information from boreholes in the eastern Molasse Basin indicates that the most prospective sites are in the immediate vicinity of faults. Optimal development of geothermal productivity therefore requires exploration of the geological structure, as well as information on the karstification of the Malm. Available seismic profiles, originally carried out in the framework of hydrocarbon exploration, were reprocessed with the aim of interpreting the facies and thus the degree of karstification within the Malm. The most prospective areas are, besides of faults, those where seismic diffractions (indicators for reef facies and karstification) occur together with low seismic velocities (indicators for large amount of water). Location and the deviation of the boreholes were defined from these 2D seismic profiles. Both boreholes, Gt 1 and Gt 2, about 4 km apart, were successful and supplied at least 118 l/s water of temperatures of 130.5 o C. Supplementary vertical seismic profiling (VSP) and moving source VSP-measurements were carried out in the production well Unterhaching Gt 1 for a more detailed investigation of its vicinity. A high- resolution 4 x 5 km 3D seismic reflection survey, scheduled for summer 2009 is used to explore a fault structure which was the target area of the injection well Unterhaching Gt 2. The interpretation of this dataset serves as a basis for a regional geological 3D model and for subsequent hydrological and numerical modeling. 1. INTRODUCTION The Malm (Upper Jurassic) which is present in most parts of the southern German/Austrian Molasse Basin is a highly- productive aquifer with increasing depths and temperatures from north (Danube river) to south (Alps). The limestones of the Malm consist of calcareous deposits accumulated in different regimes (Fig. 1). An increasing number of low-enthalpy geothermal power plants is being implemented in the Munich area with holes drilled into the Malm encountering increasing temperatures from North to South (Fig. 2). The resources and reserves of the Bavarian Molasse were estimated at the end of the 80s (Schulz and Jobmann 1989, see Fig. 3). The order of magnitude of regionally extractable energy can thus be estimated and has already been confirmed by a number of boreholes. Malm (Upper Jurassic) Cretaceous Tertiary thin bedded limestones thin bedded limestones reef sponglia bearing recifal limestones Figure 1: The limestones of the Malm formation (Upper Jurassic) are the focus of interest for geothermal exploration in the southern German Molasse Basin. Accumulated in different regimes, they consist of calcareous deposits. The required water paths were generated by coral reefs, karstification, fractures and faults. Figure 2: Simplified section through the southern German (Bavarian) Molasse from the Danube River (right) to the Alps (left). Some examples of power plants with drilling depths and encountered temperatures are indicated, among them the doublet of Unterhaching. D3 = Tertiary Molasse sediments, D2 = Mesozoic sediments including Malm, G1 = pre-Variscan basement. Modified from Bundesanstalt für Geowissenschaften und Rohstoffe 2004. 2. 2D-SEISMIC REFLECTION DATA FOR BOREHOLE DEFINITION The Tertiary and pre-Tertiary structures of the Upper Bavarian Alpine margins have been the focus of intensive oil and gas exploration from 1952 to 1988. Information deduced from reflection seismic data has been largely verified by deep wells, e.g., Staffelsee 1, Miesbach 1 and Vorderriß (Bachmann and Müller 1981). A detailed model of the complicated geological structures (Bachmann and Müller 1992, Zweigel 1998) results from this exploration.
Transcript of Seismic Reflection Exploration of Karst Phenomena of a ... · eSeismic Reflection Exploration of...

Proceedings World Geothermal Congress 2010 Bali, Indonesia, 25-29 April 2010
1
eSeismic Reflection Exploration of Karst Phenomena of a Geothermal Reservoir in Southern Germany
Ruediger Thomas, Ewald Lueschen and Ruediger Schulz
Leibniz Institute for Applied Geophysics (LIAG), Stilleweg 2, 30655 Hannover, Germany
Keywords: Low-enthalpy Reservoir, Karst, Seismic Exploration, 3D Seismics.
ABSTRACT
A geothermal power plant in Unterhaching, south of Munich/Germany, generates 3.36 MW of electrical power. Two boreholes (doublet) penetrated the top of the Upper Jurassic (Malm) at a depth of approx. 3000 m. The Malm which is present in most parts of the Southern German/Upper Austrian Molasse Basin is a highly-productive aquifer with increasing depths and temperatures from north (Danube River) to south (Alps). Information from boreholes in the eastern Molasse Basin indicates that the most prospective sites are in the immediate vicinity of faults. Optimal development of geothermal productivity therefore requires exploration of the geological structure, as well as information on the karstification of the Malm. Available seismic profiles, originally carried out in the framework of hydrocarbon exploration, were reprocessed with the aim of interpreting the facies and thus the degree of karstification within the Malm.
The most prospective areas are, besides of faults, those where seismic diffractions (indicators for reef facies and karstification) occur together with low seismic velocities (indicators for large amount of water). Location and the deviation of the boreholes were defined from these 2D seismic profiles. Both boreholes, Gt 1 and Gt 2, about 4 km apart, were successful and supplied at least 118 l/s water of temperatures of 130.5 oC. Supplementary vertical seismic profiling (VSP) and moving source VSP-measurements were carried out in the production well Unterhaching Gt 1 for a more detailed investigation of its vicinity. A high-resolution 4 x 5 km 3D seismic reflection survey, scheduled for summer 2009 is used to explore a fault structure which was the target area of the injection well Unterhaching Gt 2. The interpretation of this dataset serves as a basis for a regional geological 3D model and for subsequent hydrological and numerical modeling.
1. INTRODUCTION
The Malm (Upper Jurassic) which is present in most parts of the southern German/Austrian Molasse Basin is a highly-productive aquifer with increasing depths and temperatures from north (Danube river) to south (Alps). The limestones of the Malm consist of calcareous deposits accumulated in different regimes (Fig. 1).
An increasing number of low-enthalpy geothermal power plants is being implemented in the Munich area with holes drilled into the Malm encountering increasing temperatures from North to South (Fig. 2).
The resources and reserves of the Bavarian Molasse were estimated at the end of the 80s (Schulz and Jobmann 1989, see Fig. 3). The order of magnitude of regionally
extractable energy can thus be estimated and has already been confirmed by a number of boreholes.
Malm (Upper Jurassic) Cretaceous Tertiary
thin bedded limestones
thin beddedlimestones
reef
sponglia bearingrecifal limestones
Figure 1: The limestones of the Malm formation (Upper Jurassic) are the focus of interest for geothermal exploration in the southern German Molasse Basin. Accumulated in different regimes, they consist of calcareous deposits. The required water paths were generated by coral reefs, karstification, fractures and faults.
Figure 2: Simplified section through the southern German (Bavarian) Molasse from the Danube River (right) to the Alps (left). Some examples of power plants with drilling depths and encountered temperatures are indicated, among them the doublet of Unterhaching. D3 = Tertiary Molasse sediments, D2 = Mesozoic sediments including Malm, G1 = pre-Variscan basement. Modified from Bundesanstalt für Geowissenschaften und Rohstoffe 2004.
2. 2D-SEISMIC REFLECTION DATA FOR BOREHOLE DEFINITION
The Tertiary and pre-Tertiary structures of the Upper Bavarian Alpine margins have been the focus of intensive oil and gas exploration from 1952 to 1988. Information deduced from reflection seismic data has been largely verified by deep wells, e.g., Staffelsee 1, Miesbach 1 and Vorderriß (Bachmann and Müller 1981). A detailed model of the complicated geological structures (Bachmann and Müller 1992, Zweigel 1998) results from this exploration.

Thomas et al.
2
Isolines of geothermalresources (million GJ)
Temperatures 100 -130°C
50 km 4 Isolines of geothermalresources (million GJ)
Temperatures 100 -130°C
50 km Isolines of geothermalresources (million GJ)
Temperatures 100 -130°C
50 km 4
Folded MolasseNorthern Calcereous Alps
Unterhaching
Figure 3: Location map with estimated geothermal re-sources of the Malm in the central part of the Southern German Molasse Basin (Schulz and Jobmann 1989). A minimum temperature of 100 °C is required for power generation. These areas are marked in yellow. Resources refer to the theoretically extractable energy per modeled doublet in an equidistant borehole grid of 1 km. Isoline separation 4 x 10¹⁵ J (million GJ) corres-ponding to 2 GJ/m².
2.1 Reprocessing Reflection Seismic Profiles
Five seismic profiles of 1976 and 1986 vintage from the exploration industry were reprocessed and reinterpreted (Fig. 4). This investigation intends to homogenize the existing data according to modern processing techniques and to consider new scientific aspects.
The profiles were reprocessed, especially taking into account better static and residual static corrections, new velocity analyses and noise suppression techniques to enhance and optimize the effective window for reflection events between first arrivals and ground roll. The new processing enables new insights into a number of stratigraphic and structural elements. For a more detailed description of the reprocessing of industrial profiles see Thomas et al. (2001, 2006).
1 km
1
2
4
5
16
Gt 1 Gt 2
Unterhaching
Figure 4: Reprocessed reflection seismic profiles and Unterhaching Gt 1 and Gt 2 boreholes.
2.2 Interpretation of Top Malm
One of the main objectives of seismic reprocessing was to determine the depth of top Malm. The possibility of extrapolating drilling results of a borehole nearly 10 km
apart from the investigation area was checked (Thomas 2003). The dominant reflector in all of the seismic lines is interpreted as the Lithothamnion limestone (Eocene). It is followed downwards by the Turonian, Gault sandstone and Lower Cretaceous before reaching top Malm (Fig. 5). A constraining factor that needs to be taken into consideration is that the transition from Purbeckian to Malm is not marked by a clear reflector. Top Malm correlates with the appearance of diffraction hyperbolae in the vicinity of a reef facies. Reliable depths can therefore only be estimated for the Lithothamnion limestone because of its clear reflection pattern.
Although the stratigraphy may be extrapolated, this does not justify using the velocity information from boreholes in the vicinity to calculate the depth in the investigation area.
This is clearly shown by comparison of the stacking velocities which can be considered as a type of average velocity. The average velocities (from the 450 m asl reference level) down to top Malm range from 3150 m/s measured in a borehole 12 km W to 3670 m/s measured in a borehole 10 km SE; the value is 3550 m/s in the investiga-tion area based on the averaging of stacking velocities. The reprocessing of N-S oriented seismic lines indicates a clear decrease in velocity towards the north. This marked change in velocity is directly attributable to the formation of the Alpine orogene (Lemcke 1988). The variation of velocity in the Molasse sediments is governed by the distance to the Alps and the tectonic pressure of the rising mountain chain (Reich 1957). In addition, a decrease in velocity from west to east is considered to be directly attributable to the in-creasing width of the basin because the lateral pressure drops as the basin opens to the east (Lohr 1969).
NNWNNW SSE SSE
Banded MarlsLithothamnion
limestoneCretaceousPurbeckianMalm
Tonmergel Beds
BandedLithothamnion
Malm
Tonmergel
3 km 3 kmmDepth
a)b)
Figure 5: a) Profile located in the investigation area. b) Profile 10 km SE of the investigation area near to a borehole. The dominant reflector in the sections is interpreted as the approx. 60 m thick Lithothamnion limestone with overlying Banded Marls. It is underlain by Tertiary and Cretaceous down to top Malm (Thomas 2005).
The base of the Malm can only be interpreted in some parts of the lines. Nevertheless, the thickness of the Malm in the study area is estimated from 500 m to 550 m.
2.3 Facies Interpretation of Seismic Sections
In our opinion, reef facies is characterized by diffraction hyperbolae in seismic lines (Buness 2002, Thomas 2003) where these are not directly attributable to fault zones. Diffraction hyperbolae in unmigrated seismic sections are mainly observed in the higher stratigraphic levels of the Malm. They can be differentiated from horizontal and low-diffraction or diffraction-free structures which may indicate lagoonal facies. A differentiation into reef and lagoonal facies is therefore only directly possible if both unmigrated

Thomas et al.
3
and migrated sections are considered because diffraction hyperbolae can only be identified in the first one (Fig. 6).
It can be assumed that karstification of the Malm is associated with the reef facies. Therefore, it is possible to localise karstification to a certain degree. The diffractions indicate reef facies and fault zones where karstification occurs preferentially but not definitely. The seismic image alone is insufficient to predict karstification, but there are other hints. A variation in reflection character (Fig. 7) indicates a trisection of the Malm (Thomas 2003, Schulz et al. 2004). Top Malm is characterised by diffractors which are interpreted as reef facies (reef debris limestones). The base of this facies zone is marked by a clear reflector. This is followed by a poor reflective zone whose base is limited by a strong reflector (bedded limestone). This zone has neither clear horizontal reflectors nor diffractors, it indicates shallow water facies (shallow water sponge limestone; massive limestones?). The Middle and Upper Malm in the northern part of the profile are characterised by continuous reflectors. We interpret these as bedded limestones with overlying thick closed-basin sediments of the Upper Malm. The differentiation of the Malm into different facies zones improves the probability of predicting karstification.
Figure 6 a) Unmigrated seismic depth section. b) Migrated seismic depth section. The analysis of diffraction hyperbola is an interpretation tool for assumed karstification of the Malm (Thomas 2005).
Additional analysis of the interval velocities calculated from the stacking velocities reveals velocity inversions in all lines but primarily in the Malm. In this context, it is
interesting to clarify whether the zones of lower velocity are associated with specific seismic signatures which might give a handle on the various facies and/or karstification zones. The interpretation (Thomas 2003) shows that the low velocity zones are primarily related to diffractor clusters associated with fault zones, but they can also be linked to diffractors connected with possible reef facies. These two groups are concentrated near top Malm. The third low velocity group is associated with the assumed closed-basin sediments of the Upper Malm – although these lower velocity zones are not restricted to top Malm alone. Large sections of the Malm do not show low velocity zones. These zones are thought to consist of massive limestones (shallow water sponge limestones). The fact, that each of the low velocity zones in the Malm is highly localised, supports their interpretation as potential karst cavities.
Figure 7: a) Stacked seismic section (unmigrated) in the Unterhaching area. Different seismic signatures associated with different facies in the Malm: A reef facies, B massive limestone (?), C bedded limestones. Red dashed line: base Malm (supposed) (Schulz et al. 2004). b) Time-migrated seismic section derived from stacked section above. Presumed reef facies within the white circles.
2.4 Geological Interpretation and Fault Zones
Information from boreholes in the eastern Molasse Basin indicates that the most prospective sites are in the immediate vicinity of faults. Therefore an intensive analysis of fault zones is necessary.
Numerous steep, antithetic and synthetic faults can be depicted at the base of the Molasse (Fig. 8). The reflection horizons above can be easily interpreted in the unfolded Foreland Molasse (Thomas et al. 2006). The thickness of
Thomas et al.
4
Tonmergel beds, Chatt Sands and Aquitan increases towards the South.
Whereas a normal fault in the centre of the seismic section can be clearly interpreted, small displacements of faults within the Malm are only interpretable due to their visibility in the Lower Cretaceous.
Figure 8: Interpretation of reprocessed seismic explora-tion profiles. The location of Unterhaching Gt 2 well is the conformal projection. It is located about 1.4 km W.
2.5 Application of Scientific Results
On the basis of these geoscientific results, a borehole devia-tion was recommended for the production borehole Gt 1. Fault zones with small throws (decametres) could be identified in lines running to the east and to the north of the borehole. In addition clear diffractions and a low velocity zone were identified on the seismic line. The top Malm was predicted with 3017 m true vertical depth (TVD).
Drilling stopped in September 2004 at 3350 m TVD (top Malm 3002 m TVD). The borehole was successful, as a hy-draulic test after an acid treatment showed: The production rate is 65 l/s with a drawdown of ca. 70 m. The water temperature exceeds 122 °C.
The location of the production borehole was constrained by requirements for the surface facilities such as available land for drilling and the power plant control room, as well as costumers for the district heating system using the hot wa-ter. Therefore only the deviation had to be determined.
Both the location and the hole deviation for the second (injection) well Gt 2 were completely planned on the basis of the reprocessing results. A nearly NE-SW striking fault zone was interpreted on two parallel profiles with a fault throw of up to 180 m. It was finally accepted that this fault zone could be interpolated between both profiles over a distance of nearly 4 km. The location of well Gt 2 is about 1.4 km W of the seismic profile (Fig. 4).
The structural interpretation of this fault zone reveals not only one single fault zone but a bundle of at least three fault zones. Top Malm was predicted within a depth interval 2960 m to 3020 m. Regional analysis for the whole area reveal that production rates of 150 l/s with a maximum water drawdown of 500 m can be achieved with a pro-bability of approx. 91% (Schulz and Jung 2005). These involve stimulation measures such as acid treatment.
The injection borehole Gt 2 (3590 m TVD), drilled June 2006 to January 2007, was also successful. Top Malm was verified by drilling in 2978 m TVD. Two fault zones can be interpreted with a (vertical) throw of 230 m (Unger 2007).
A first hydraulic test has proven a water temperature of about 134 °C and the production rate was even higher than in the Gt 1 borehole.
3. VSP- AND MS-VSP INVESTIGATIONS
The reprocessing results imply an important decision criterion for possible karstification zones. Supplementary vertical seismic profiling (VSP)- and moving source (MS-) VSP-measurements were carried out in the Unterhaching Gt 1 well in 2005 for a more detailed investigation (Thomas and Schulz 2007).
3.1 Data Acquisition
MS-VSP data were recorded using a single heavy vibrator (Fig. 9). Careful planning of the line geometry was necessary to explore the vicinity of the intersected Malm area. The borehole geophone was fixed at 2580 m vertical depth. The source points were located on four parallel 3.5 km long profiles with 100 m point distance and one perpendicular 5 km long line with 50 m point distance (Fig. 10).
A vibration point distance of 100 m yielded a reflection point distance of only 12 m for a reflector at 3000 m (top Malm) depth. Different depth, of course, give different reflection point distances (Fig. 11).
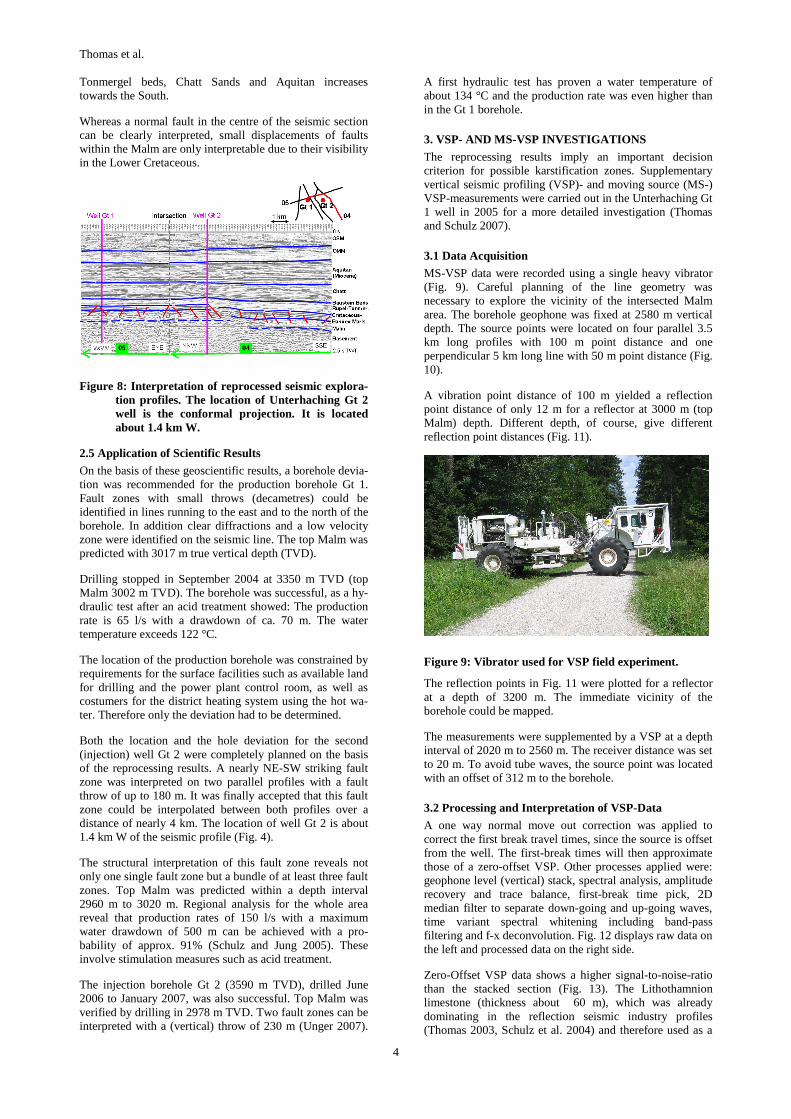
Figure 9: Vibrator used for VSP field experiment.
The reflection points in Fig. 11 were plotted for a reflector at a depth of 3200 m. The immediate vicinity of the borehole could be mapped.
The measurements were supplemented by a VSP at a depth interval of 2020 m to 2560 m. The receiver distance was set to 20 m. To avoid tube waves, the source point was located with an offset of 312 m to the borehole.
3.2 Processing and Interpretation of VSP-Data
A one way normal move out correction was applied to correct the first break travel times, since the source is offset from the well. The first-break times will then approximate those of a zero-offset VSP. Other processes applied were: geophone level (vertical) stack, spectral analysis, amplitude recovery and trace balance, first-break time pick, 2D median filter to separate down-going and up-going waves, time variant spectral whitening including band-pass filtering and f-x deconvolution. Fig. 12 displays raw data on the left and processed data on the right side.
Zero-Offset VSP data shows a higher signal-to-noise-ratio than the stacked section (Fig. 13). The Lithothamnion limestone (thickness about 60 m), which was already dominating in the reflection seismic industry profiles (Thomas 2003, Schulz et al. 2004) and therefore used as a

Thomas et al.
5
stratigraphic reference level for the interpretation and determination of top Malm (Fig. 5) shows as well a clear reflection in the VSP data at a depth of 2840 m.
Figure 10: Field geometry of VSP and MS-VSP.
- 1000 m
- 2000 m
- 3000 m
- 4000 m
1000 m2000 m3000 m4000 m5000 m
geophone
Depth
Offset
reflector reflection pointdepth distance
2600 m <1 m2800 m 7 m3000 m 12 m3200 m 16 m3400 m 19 m3600 m 22 m
Figure 11: Cross-section view of MS-VSP geometry.
The 90 m thick rock sequence (Turon, Lower Cretaceous and Purbeckian) between Lithothamnion limestone and top Malm is reproduced with a higher resolution compared to the reflection seismic profile (Fig. 13).
Top Malm at 3000 m and the basis Malm interpreted at 3500 m depth are recognized clearly. The events beneath the basis Malm let suggest the existence of Dogger.
The reflection seismic profile (Fig. 13) shows a high-reflective area at a depth interval from 3100 m to 3350 m E of the position of borehole Gt 1, whereas to the W reflections are scarce. Only at 3250 m depth strong reflections can be tracked from E to the position of the borehole.
3.3 Processing and Interpretation of MS-VSP Data
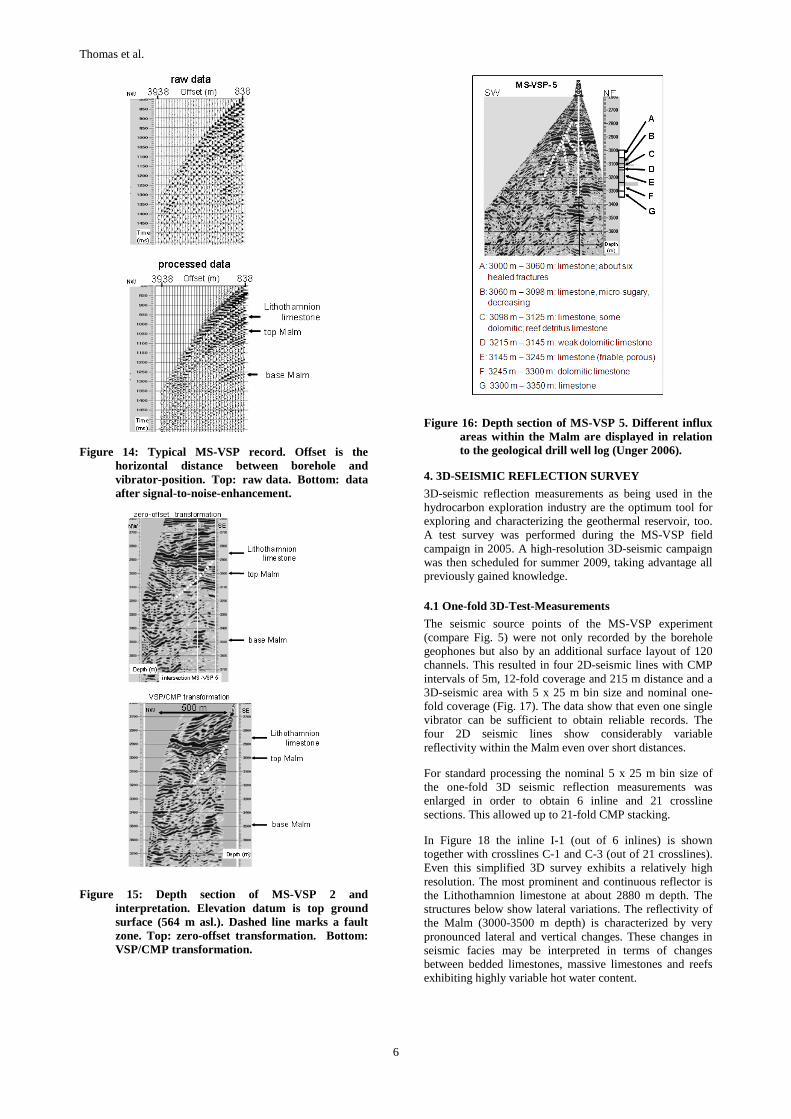
MS-VSP 2 is displayed in Fig. 14 to demonstrate the data quality which could be achieved by working with one single vibrator. The left side of the image shows the raw data (correlated and 8-fold vertical stacked) while on the right side the data is displayed after enhancing the signal-to-noise-ratio.
The unprocessed field records do not show signals that could be attributed to specific reflectors. Individual trace processing improved data quality and Lithothamnion limestone, top Malm and base Malm can be interpreted.
Figure 12: VSP data for the geophone depth interval 2020 m to 2560 m for borehole Gt 1. Left: raw data. Right: processed data.
Figure 13: Comparison of a zero-offset VSP and a reprocessed 2D surface seismic line. Elevation datum is top ground surface (564 m asl.) (Thomas 2006a).
Recording a VSP with offset sources, the reflection points will also have a lateral offset (Fig. 10). To reconstruct the VSP image in the coordinate system of 2D surface seismic sections, Dillon and Thomson (1984) described a mapping procedure (VSP/CMP transformation; Fig. 15, bottom). If we need only a comparison of MS-VSP data with each other, a more simple zero-offset transformation is sufficient (Fig. 15, top). These sections can be used for the delineation of structures in the vicinity of the borehole and for detailed reservoir studies.
Lithothamnion limestone, top and base Malm can be interpreted on MS-VSP profile 5 (Fig. 16). The depths interval from Lithothamnion limestone to Lower Cretaceous is portrayed with high resolution. The transition from Cretaceous to Malm is marked by a clear seismic event. Reflections are also visible within the Malm. This enables the interpretation of a fault system (Fig. 16; dashed lines). Contrary, the interpretation on basis of the reflection seismic profile yielded simply a single fault based on its visibility within the Lower Cretaceous. The geological drill well log from borehole Gt 1 (Fig. 16) validated the existence of this fault zone (Thomas 2006b). However, the analysis of the borings shows that the fractures are healed.
Different influx areas over 250 m thickness within the Malm, measured during a hydraulic test (GTN 2006), correspond with seismic signatures in the MS-VSP data (Fig. 16).
Thomas et al.
6
Figure 14: Typical MS-VSP record. Offset is the horizontal distance between borehole and vibrator-position. Top: raw data. Bottom: data after signal-to-noise-enhancement.
Figure 15: Depth section of MS-VSP 2 and interpretation. Elevation datum is top ground surface (564 m asl.). Dashed line marks a fault zone. Top: zero-offset transformation. Bottom: VSP/CMP transformation.
Figure 16: Depth section of MS-VSP 5. Different influx areas within the Malm are displayed in relation to the geological drill well log (Unger 2006).
4. 3D-SEISMIC REFLECTION SURVEY
3D-seismic reflection measurements as being used in the hydrocarbon exploration industry are the optimum tool for exploring and characterizing the geothermal reservoir, too. A test survey was performed during the MS-VSP field campaign in 2005. A high-resolution 3D-seismic campaign was then scheduled for summer 2009, taking advantage all previously gained knowledge.
4.1 One-fold 3D-Test-Measurements
The seismic source points of the MS-VSP experiment (compare Fig. 5) were not only recorded by the borehole geophones but also by an additional surface layout of 120 channels. This resulted in four 2D-seismic lines with CMP intervals of 5m, 12-fold coverage and 215 m distance and a 3D-seismic area with 5 x 25 m bin size and nominal one-fold coverage (Fig. 17). The data show that even one single vibrator can be sufficient to obtain reliable records. The four 2D seismic lines show considerably variable reflectivity within the Malm even over short distances.
For standard processing the nominal 5 x 25 m bin size of the one-fold 3D seismic reflection measurements was enlarged in order to obtain 6 inline and 21 crossline sections. This allowed up to 21-fold CMP stacking.
In Figure 18 the inline I-1 (out of 6 inlines) is shown together with crosslines C-1 and C-3 (out of 21 crosslines). Even this simplified 3D survey exhibits a relatively high resolution. The most prominent and continuous reflector is the Lithothamnion limestone at about 2880 m depth. The structures below show lateral variations. The reflectivity of the Malm (3000-3500 m depth) is characterized by very pronounced lateral and vertical changes. These changes in seismic facies may be interpreted in terms of changes between bedded limestones, massive limestones and reefs exhibiting highly variable hot water content.

Thomas et al.
7
Figure 17: Coverage map of the four additional 2D seismic lines (NW-SE) and the 3D data block (in red colour).
Figure 18: Fence diagrams of selected 3D sections of the 3D seismic data block: inline 1 with crossline 1 (top) and inline 1 with crossline 3 (bottom). The Lithothamnion limestone forms a continuous reflector at approx. 2880 m depth. The depth interval Turon to top Malm (approx. 3000 m) shows stronger variations of its seismic facies. The Malm (3000-3500 m) is characterized by prominent changes in reflectivity. A fault dipping to SW is visible on the left side.
4.2 Multi-fold 3D-Survey
In order to explore the sum total geothermal capacity of the Malm in the Munich area, the following subprojects are scheduled by an integrated programme:
1) A high-resolution 4 x 5 km 3-D seismic reflection survey to explore facies and geological structures around the injection well Unterhaching Gt 2 with target depths to 4000 m (Fig. 19);
2) regional geological 3-D modelling of structures aided by additional existing 2-D seismic profiles;
3) hydrological modelling and 4) numerical modelling of ground water currents.
Economical usage of the geothermal energy obtained from karst aquifers will be based at larger scale on results of the present study. Sustainable usage of geothermal energy can be improved and the operational risk will be reduced. The numerical model will be made available to administrative authorities as a tool for assessment of projected geothermal usage of the Malm reservoir.
Figure 19: Theoretical grid of 3D seismic measurements. NW-SE striking lines are geophone lines. SW-NE striking lines are vibrator point lines. Wells Unterhaching Gt 1 and Gt 2 are indicated by red points. To the west information is available by the MS-VSP data.
6. CONCLUSIONS
Reprocessing the seismic data has increased resolution. The boreholes situated at the margins of the study area could be tied into a stratigraphic interpretation, but their velocity information could not be used for depth conversion down to top Malm. Lateral changes in seismic signatures indicate that rapid facies changes can be expected within the Upper Malm. The interval velocities calculated from the stacking velocities reveal highly localised velocity inversions. The low velocity zones coincide with areas that show diffractors associated with fault zones as well as diffractors associated with interpreted reef facies. This could be an important decision-making criterion for identifying potential karstification.
VSP and MS-VSP data deliver a higher seismic resolution than the reflection seismic profile for the depth interval Cretaceous to Lithothamnion limestone. The energy of one heavy vibrator was sufficient to image the Malm down to its basis (about 3500 m).
Different influx areas within the Malm, measured during a hydraulic test, could be identified in the MS-VSP data.
A single fault, interpreted in the seismic reflection profiles based on its visibility in the Lower Cretaceous, could be

Thomas et al.
8
resolved as a fault system by means of the MS-VSP data within the Malm.
The interpretation of the MS-VSP experiment shows that small scale changes of the layer structures in the vicinity of borehole Gt 1 do not suggest an undisturbed continuation of these structures between Gt 1 and injection well Gt 2 (about 3.5 km distance).
High-resolution 3D-seismic reflection measurements are used to explore and characterize the reservoir in the vicinity of the injection well Unterhaching Gt 2 at highest possible detail. The aim is to set up a regional 3D geological model taking also other available 2D seismic lines into account. Hydrological and numerical modeling is the final goal for estimating the geothermal potential.
ACKNOWLEDGEMENTS
Five reflection seismic lines were made available by RWE Dea AG (Hamburg) for reprocessing and reinterpretation; our thanks go to this company for their permission and for the work involved in making the lines available. The scientific investigations were funded by the German Federal Ministry of the Environment, Nature Conservation and Nuclear Safety (BMU) under funding no. 0327503, 0329959 and 0325013. We thank our contractor company, DMT, Essen.
REFERENCES
Bachmann, G. H. and Müller, M.: Geologie der Tiefbohrung Vorderriß 1, Geologica Bavarica, 81, (1981), 17-53, München.
Bachmann, G., and Müller, M.: Sedimentary and structural evolution of the German Molasse Basin, Eclogae geol. Helv., 85, (1992), 519-530, Basel.
Bundesanstalt für Geowissenschaften und Rohstoffe: Geowissenschaftliche Karte der Bundesrepublik Deutschland, Geologie, 1: 2 000 2000, (2004).
Buness, H.: Reflexionsseismische Erkundungen im Bereich des Landshut Neuöttinger Hochs 2002, Report GGA, Archive-Nr. 122 459, (2002), Hannover (unpublished).
Dillon, P.B., and Thomson, R.C.: Offset source VSP surveys and their image reconstruction, Geophysical Prospecting, 32, (1984), 790-811.
GTN: Säurestimulation und Air-Lift Test – Bohrung Gt Unterhaching 1/1a – 30.03.2006 - 04.04.2006, Test Report vom 22.05.2006, (2006), Neubrandenburg (unpublished).
Lemcke, K.: Geologie von Bayern: I. Das bayerische Alpenvorland vor der Eiszeit, Verlag Schweizerbart, (1988), Stuttgart.
Lohr, J.: Die seismischen Geschwindigkeiten der jüngeren Molasse im ostschweizerischen und deutschen Alpenvorland., Geophys. Prospect., 17, (1969), 111-125.
Reich, H.: Über die Geschwindigkeiten tertiärer Ablagerungen in verschiedenen Gebieten Mittel-Europas, Geol. Jb., 74, (1957), 31-38.
Schulz, R., and Jobmann, M.: Hydrogeothermische Energiebilanz und Grundwasserhaushalt des Malmkarstes im süddeutschen Molassebecken – Teilgebiet: Hydrogeothermik, Report NLfB-GGA, Archive-Nr. 105 040, (1989), Hannover (unpublished).
Schulz, R., and Jung. R.: Abschätzung der Erfolgs-wahrscheinlichkeit für die Fündigkeit der zweiten Bohrung für das Geothermische Kraftwerk Unterha-ching, Report GGA, Archive-Nr. 125 772, (2005), Hannover (unpublished).
Schulz, R., Thomas, R., Jung, R., and Schellschmidt, R.: Geoscientific prospect evaluation for the Unterhaching geothermal power plant, Z. Angew. Geol., 2/2004, (2004), 28-36, Hannover.
Thomas, R.: Reinterpretation seismischer Messungen zur Bestimmung struktureller und fazieller Eigenschaften des Malm im Raum Unterhaching als Grundlage für eine Temperaturprognose, Report GGA, Archive-Nr. 123 338, (2003), Hannover (unpublished).
Thomas, R.: Success probability of geothermal drillings into the Malm karst - improvements by new seismic interpretation strategies, 67th EAGE Conference und Exhibition, Extended Abstract, ISBN 9073781981, 13.-16. June 2005, paper 296, (2005), Madrid.
Thomas, R.: VSP- und MS-VSP-Messungen zur Fazies- und Verkarstungsproblematik des Malm im süddeutsch-oberösterreichischen Molassebecken zur Erhöhung der Erfolgswahrscheinlichkeit geothermischer Bohrungen, Proceedings, DGMK/ÖGEW-Frühjahrstagung, 20.-21.04.2006, (2006a), 229-238, Celle.
Thomas, R.: VSP- und MS-VSP-Messungen zur Fazies- und Verkarstungsproblematik des Malm zur Erhöhung der Erfolgswahrscheinlichkeit, Proceedings, 9. Geo-thermische Fachtagung, 15.-17.11.2006, (2006b), 74-82, Karlsruhe.
Thomas, R., Bram, K., Fertig, J., and Schwerd, K.: Reprocessing industrieseismischer Profile im bayeri-schen Alpenvorland im Bereich der TRANSALP-Trasse, Proceedings, DGMK-Tagungsbericht 2001-2002, (2001), 129–138, Celle.
Thomas, R., Bram, K., Fertig, J., and Schwerd, K.: Shallow high-resolution seismics and reprocessing of industry profiles in southern Bavaria: The Molasse and the northern Alpine front, Tectonophysics, 414, (2006), 87-96; doi: 10.1016/J.tecto.2005.10.025.
Thomas, R., and Schulz, R.: Facies Differentiation of the Malm by Interpretation of Reflection Seismic Profiles and a Moving Source VSP Experiment, Proceedings of the European Geothermal Congress 2007, 30 May -1 June 2007, (2007), Unterhaching, Germany.
Unger, H. J.: Schichtenverzeichnis der Geothermiebohrung Unterhaching Gt 1, Report, (2006), (unpublished).
Unger, H. J.: Schichtenverzeichnis der Geothermiebohrung Unterhaching Gt 2, Report, (2007), (unpublished).
Zweigel, J. 1998: Eustatic versus tectonic control on fore-land basin fill, Verlag Schweizerbart, (1998), Stuttgart.