Seismic Intensity Research: 1990 Luzon Earthquake
20
25 Comprehensive Urban Studies No. 44 1991 Seismic Intensity Research:1990 Luzon Earthquake Toshio Mochizuki 1 l Norio Abeki(2l Takahisa Enomoto 3 1 Hiroshi Ishida 41 Hiroaki Takida 5 1 Y oshihi to Sai to61 Roland G. Valezuela 7 1 Nomer H. Angeles 81 Benjamin D.Verdejo8 1 Angelito G. Lanuza 9 1 Nelson R.Soqueno'O) 1. JNTRODUCTJON The Philippine earthquake hit Luzon Island on July 16th , 1990. With a magnitude of 7.8 it is among the world's largest earthquak 巴 sto occur on land. The affected area covered 120kilometers. Leftlateralstrikeslipfaultscausedahorizontaldislocationextending to 5.0m. ThefaultappearedbetweenGabaldon inNuevaEcijaProv.and Im uganinNueva Vizcaya Prov. This fault is considered to be related to the Digdig Fault , which belongs to thePhilippineFaultSystem. ThisPhilippineFaultSystem runsthrough centralLuzon to the southeast and northwest(Figure 1). 与, 理>5 H20 L¥ RLAG • ( 可6.5) im .m E12氾 Fig 同 Location of epicenters and seismicfault ofthe1990 PhilippineEarthquake. 1) CenterforUrban Studies 司 Tokyo Metropolitan University 2) Collegeof Engineering , KantoGakuin University 3) Facilityof Engineering , KanagawaUniversity 4) Kajima InstituteofConstructionTechnology 5) TechnicalDevelopmentDivision 可 Kugami Co 叫Lt d 6) T echnicalResearchInstitut e , MaedaConstructionCo 吋Lt d 7) PhilippineAtomosphericGeophysical (and Astronomical) Services Adoministration 8) Technological Universityof Philippines 9) Philippines InstituteofVolcanologyand Seismology 10) MinistryofPublicWorks & Highways Bureauof Design , Philippine
Transcript of Seismic Intensity Research: 1990 Luzon Earthquake

25
Comprehensive Urban Studies No. 44 1991
Seismic Intensity Research: 1990 Luzon Earthquake
Toshio Mochizuki1l Norio Abeki(2l Takahisa Enomoto31
Hiroshi Ishida41 Hiroaki Takida51 Y oshihi to Sai to 61
Roland G. Valezuela71 Nomer H. Angeles81 Benjamin D. Verdejo81
Angelito G. Lanuza91 Nelson R. Soqueno'O)
1. JNTRODUCTJON
The Philippine earthquake hit Luzon Island on July 16th, 1990. With a magnitude
of 7.8 it is among the world's largest earthquak巴sto occur on land. The affected area
covered 120 kilometers. Left lateral strike slip faults caused a horizontal dislocation extending
to 5.0 m. The fault appeared between Gabaldon in Nueva Ecija Prov. and Imugan in Nueva
Vizcaya Prov. This fault is considered to be related to the Digdig Fault, which belongs
to the Philippine Fault System. This Philippine Fault System runs through central Luzon
to the southeast and northwest (Figure 1).
与,
理>5
H20
L¥RLAG •
~主==='
(可6.5)
~\22
im
.m E12氾
Fig同 Locationof epicenters and seismic fault of the 1990 Philippine Earthquake.
1) Center for Urban Studies司 TokyoMetropolitan University
2) College of Engineering, Kanto Gakuin University
3) Facility of Engineering, Kanagawa University
4) Kajima Institute of Construction Technology
5) Technical Development Division可 KugamiCo叫Ltd
6) T echnical Research Institute, Maeda Construction Co吋Ltd
7) Philippine Atomospheric Geophysical (and Astronomical) Services Adoministration
8) Technological University of Philippines
9) Philippines Institute of Volcanology and Seismology
10) Ministry of Public Works & Highways Bureau of Design, Philippine

26 Comprehensive Urban Studies No.44 1991
U nfortunately, this巴arthquakehas not 1巴ftany record of strong motion seismogram
in the seismic source region. This disaster research has to be carried out in the absence
of this critical information. Compared to the 1985 Mexico earthquake and the 1989 Loma
Prieta earthquake we are faced with a significant obstacle in doing this disasterresearch.
The main purpose of this researh is to predict the intensity of seismic motion and its
effects as accurately as possible;, and tryto extract some information in the absence of
a strong motion seismographic record. Previous earthquake research has confirmed there
are various differences within damaged areas. Even in relatively small areas the extent
of damage varies. This earthquake also indicated a similar phenomenon. Therefore, we are
aiming to find out the most accurate extension of the motion intensity, and try to construct
a selsmlC mlcrozolllng町lap.
This r巴searchwas carried out by the second Philippine Earthquake damage investigation
team by the Architectural Institute of J apan.
2. EARTHQUAKE DESCRIPTION
The U. S. Gelogical Survey (USGS) indicated that the earthquake's time of origin was
July 16th, 7: 26 U.T. Local time was 16: 26. USGS said the epicenter of the quake was
110 km. north/northeast of Manila, near Bongabon (north latitude 15.70
, east longitude
121.20
). The depth of source was 25 km, magnitude of 7.8. Strong after shocks were
reported, which were 6.1 and 6.6 in magnitude ¥recorded at 18: 06 and 21 : 14 on the
17th (UT) 1. According to Nakata'sj) group analysis this seismic fault appeared along the巴xisting
active fault line. Overall, the fault displays a relatively plain and straight shape. Also, as
pr巴dictedthe fault plane shows a relatively simple shape until the deep center. In an
unappearing area near Rizal, the fault is divided into two segments. The north segment
runs to N 200
W and south segment runs to N 450
W of average fault striking. By using
the mom巴nttensor inversion method which uses long period surface wave, Abe2l worked
on the earthquake fault mechanism solution and reported this results. The fault coincides
with the same direction and movement as the Digdig Fault, which is part of the Philippine
Fault System. Abe noted that th巴 maximumaftershock occurred at the end of the north
area of the fault. The seismic noted 3.6 x 1027 dyn聞 cm. The size of the main fault plane
measures 120 km x 20 km. The crust rigidity 3 x 10¹¹ dyn/ cm'. According to crust rigidity,
Abe decided that the average fault displacement is 5.0 met巴rsand the average stress drop
to be 48 bar. The northern end of the fault is estimated to be located 30 km east of
Baguio.
In addition Ando's group3l noticed that the damage is concentrated in Bagio and Agoo,
which are 30 to 50 km from the fault. Through the dispersion of damage it is difficult
to explain fault and geographic effects. Moreover, Ando, predicted the existence of a sub
-fault beneath Bagio and Agoo; and, he executed aftershock ,observations. Later, he reported
the existence of this sub-fault, which crosses the main fault. By all means, we anticipate
fauther research in order to discover the seismic source mechanism.

Mochizuki et al : Seismic Intensity on .1990 Luzon Earthguake 27
INSTITUTE
Not on1y in Nueva Ecija and Nueva Vizcaya bul in Benguet, Pangasinan, Tarlac, and
La Union damage took p1ace. About 2,000 peop1e died a1so 3,500 peop1e were injured.
About 22,000 thousand bui1dings were destroyed. Tota1 number of evacuees reached 1,600,
000. Though there was damage in a wide range on area a10ng this fault, it was most
heavi1y concentrat巴daway from the epicenter IBaguio in Benguet, Agoo and Aringay in
La Unionl, 10cated near the end of the fau1t. Reinforced concrete hote1s were a1so damaged.
There were many office and university bui1dings damaged or d巴stroyed.In the mountainous
parts of Nueva Ecija, Nueva Vizcaya, and Benguet, numerous 1andslides occurred and major
roads were b1ocked, which caused a suspension of rescue recovery. The a11uvia1 soft zone
of the coasta1 side of Lingayen Bay experienced liquefaction ¥; especia11y at Dagupan city
in Pangaisinan. Bui1dings and pier supports were damaged. A1so some bridges were ruined.
A Phi1ippine organization reported the distribution of seismic intensity. Figure 1 i11ustrates
the intensity of the earthquake a11 over the Phi1ippines. The Phi1ippines used the Modified
Rossi-Forre1 Intensity Sca1e Inot the ordinary Rossi-Forrell, both methods differ after grade
intensity 1eve1 7.') Figure 3 il1ustrates Luzon's intensity distribution51 by the Philippine
P H I.L I P P I N E BY & RESEARCH DESCRIPTION DAMAGE 3.
19N
18N
制問
nnnu
‘l
圃
イ,
Jia,ム十一γa:i.:.L人
15N
17N
c>
J、, , , , ・.,
< ,
,、,
.'、
14N
123E
r喧
-J;:LJal--Fi--」問
YIII
v一w一山一日
O
YII
IX
YI 4
6
2
7
コ
戸、
コ
ιは一川一刊一川一
v
知一刻
IY
1
1
1 II
M.M. ; Modified Mercalli Intensity Scale
J.M.A ; Japan Meteorological Agency Intensity Scale
M.R.F. ; Modified Rossi-Forel Intensity Scale
M.R.F. J.M.A. M.M.
121E
Isoseismal map made by Philippine Institute
of Yolcanology and Seismology.
120E
Fig.3
Relationship of seismic intensity Scales. Fig.2

28 Comprehensive Urban Studies No.44 1991
Table 1 Reported seismic intensities of main cities.
Main Cities Intensity
川NILA VI "'-'VII
QUEZON VI
CABANATU州 vr"'-'VIII
TARLAC VIII
DAGUPAN VIII
AGOO Vlrr
BAGUIO VIII",-,rx
Institute of Volcanology and Seismology (PHIVOLCS). Analysis in this distribution map
indicates a grade 8, including a wide range along the fault. It was hard to find out the
detailed intensity by local area.
4. INTENSITY ESTIMATION BY QUESTIONNAIRE SURVEY
4. 1 $u rvey Descript ion
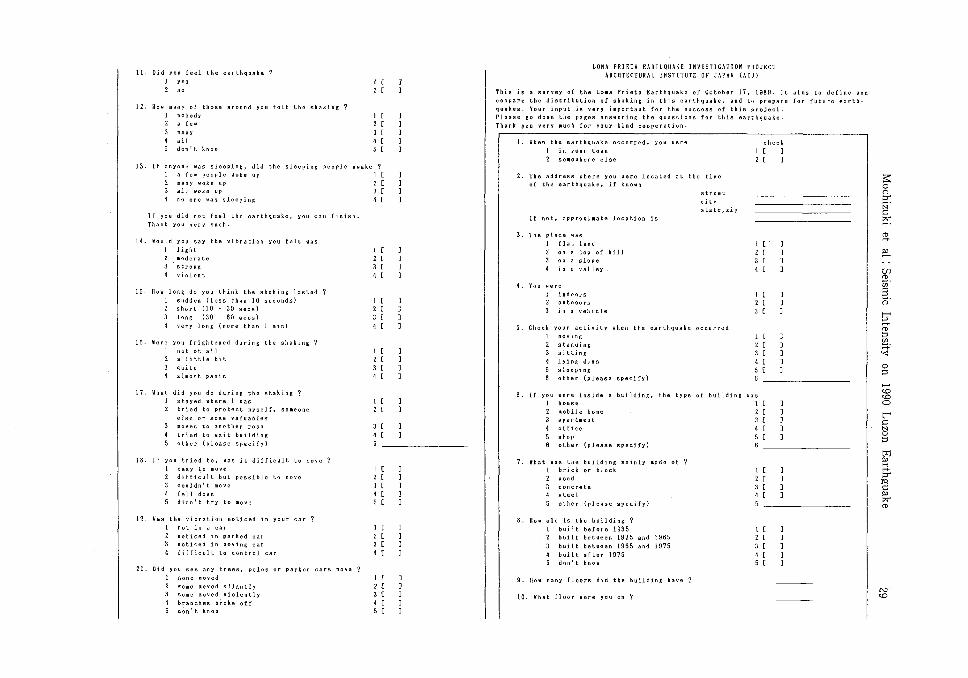
(1) Survey Sheet
The format of the questionnaire follows Figure 4. A 34 item questionnaire was
constructed by H. Kagami and H.O. Murakami. Questions related to: person's location at
moment quake occurred; sensation of quaking (i.e. conditions of furniture inside house)
description of damage to buildings; condition of ground failure. This questionnaire was
also used in 1989 at th巴 LomaPrieta earthquake site.61
(2) Survey Participants, Distribution, & Collection of Survey
The survey was carried out from the nine day period from september 20th to the
28th of 1990. All survey materials were collected within one month. Participants were mainly
teachers from publi児celementary schools (and partially junior and high s託chooωls心)わ
Distribution was facilitated principally through the city r陀巴g♂ionaldirector or the school
board superintendent. Distribution to the teachers at each shool was assisted throug the
principals. Collection was through reverse order, and then mailed through J apan. Philippine巴lementaryschool is compulsory. The scale of the school is rather small
but in numerous number. The number of teachers differ in urban and rural locations.
Rural schools contain six to seven teachers. Urban schools contain on the average around
twenty or more. Surveys were distributed to an average of ten of fifteen teachers.
29 Mochizuki
et al:
Seismic Intensity
on 1990
Luzon Earthguake
。a。=。、向。』。,h。。同刷ぺMm吋ZB・0-
。。〉崎戸市凶CH司門吋2aωa川信唱4【唱ah。。『L『hZ旬眉'eza
,-,,-,,-,L.....IL....J
-~円ぜ凶
,。nhM晶ω-E。唱凶
由トaHh@パMhコ旬以【吋2RH守
山ト白同司E個目@∞-zoozベMen-パMHHsa円
凶也市一UH勺白何回円。-a@ωz“自wa“-同2aN
凶円。吋。』。』Mwa“同司2ad
。凶ロ」『噂門同saoZぷ崎町同唱倒。,。一一・"
'-'L...l..............
-N
円守
的
4004同一可
。MO'MUE。υ円
唱。。,N
M4U。同』』。aω刊』RHH
Arh。。唱隠匿hHZH偲寵凶CH司司司2SOZJU的側,が団ZSト
む(hM円。ω&mem帽。岡弘)boaJ。巴
]凶色czm凶
]マoυH同刷。守
〕円ωロOEω弘司晶縄問
]NO匡。ZG河川a。EN
]Ha的担。ぷ【 m司-e凶巴吋勺戸吋コaH。OR凶hdos--MZH唱同吋ヨ』帽。司吋的ZHU』@お司40h』同包
.............1......1............. _
N
同ザ
目。
(hM同Ge&ao崎山崎@4a凶)』02400
凶EHaoo叫@同
aEZ。司】町民司、内門噂
Mg吋““同閥的
日開信同喧信伺ω崎町N
凶戸hd〉。巨【
-uo」』44ωυ。U4昌司Emu--ω』情。@戸山“goa-shaHP4JUdw』20hu晶uozu的
~~~
-~門
同w--u岡戸向。、,帽邑同門
mlMOo-】叫ョ。N
羽-00司=同向
。』@32。トマ
'-'L...JL...JL.....J
目~
M..,..
hMW『同司P伺=尚守
れ
W術協。Hmmwzo円
『『同aし判。品。叫僧巴。N
-uE雨戸」市同切『
時
wd吋Z。ω帽司円凶GZ」F.円
回同白。同』伺u。同@U師匠44R。』島民勾・uoz一明同
同凶円N.。』崎川副的
、内ぷ叫U
叶
-oopHdm
]】~~~
_
N円
守凶BO国必JRF』。-u由
同刷。04a。』amuzug何iMa-T
hJ[ω目。-。4P唱。〉。2ω酉。"“円
hHω石川閣時『駒市。、,。巴oaoMWN
勺。、,。冨OCO信吋
Ave-,。信ωL伺υ℃odAeM喝aLomωHoaa"。。』パwhg勾ωω抗20h司吋20N
~~
円守
的
.....................L.....J
_
N円
守
.......L....I............. _
N円
守
L...J'-''--''--'
日N
円ぜ
』伺ωヲ[。』パME。UOパ封パドH2υ同刷hj司勺4T
'M噌UMCH〉。酉EH唱@ο同ωot目
』扇町υhu@4ah伺&ロ【唱ωυ」円J。匡N
L得。偲己寸ιdoc-
。,MmwuhコohC4門官。υ同uoaa。Jmパvmha同〉ea』的伺冨aH
。POE。“、内』』パ“‘g司4-】凶
=-b。万円-oM守
@〉。EJ-Z百円。。υ円
。〉。=。Eo-D同切凶。仏μESJ{ヨω同刷し『川匂N
MWP。邑。uhm館。-
。。〉aEOJJH2G4刷HH勺』司ωmw'・0μ官。同』ベM問。h』』倍同
(h刷叫ω@色腕。凶帽。Ha}'M@SJ。目
凶Z同万円同sa日制叫“。。“旬。J門レベ“司
盤。。』'MmwzuoE旬。“-uω〉O百円
切@同a何ヨ同時〉@屋omL。匂白司。
ozoo-。m-一WHomh尚昆』UO』。,hao』hvO同EHUN
凶伺BH@』ωzz-uohmuaH
AV凶Z4S伺兵凶02ω凶C吋Lヨ唱。喝Doh-u同旬以aWEA--。ト【
ωHHMm吋島“ω。届ベ帽ぜ
。パ】同SMM円
以司』ω円以M同問伺刊
-{同閣以白川ωoz-
九V凶gHMA何回一白的oz“日制ZHhコ-u唱。zcuaMHLML『Soho』OB@円
{aHa-a勾戸山パMolMO冒)凶EO円h』ω〉咽
(moωmODO門)ωc。同門
(ωummO円iO[)』hozmN
(陥判明uz。uomOHZ母ぷ以胸明。叫)信@旬司2mH
ト旬。J臨時HMZ『uA伺』@@zduAE司Zωョ。、向。-uMao-【声。=由同
べMZ@HOM〉一守
MZ。lHμ凶内
むパ“自制1
刷。勺OEN
パwζ凶吋『-
鴎伺,“-【OHB。hzo同』何十Ma『〉ωZJuh悶ωs。、円匂ι戸ョ。2・-TH
GU2ehzMO』P20hMAce-ゐh
zaM民同』Z喝ωコohmoa悶2vau』喝OGSJ円。ω旬以OZ唱同唱2。、何回『
cz。aaM同・04mEmMSベML勾@@sdu明。
。民同“024、de司04問。。}ohO22。hueMωzzm胡@L-u-M同地。aHN
]守UZH島OOHmm時書@Z。。av
]円札20説。茸【円四判的
]目白ヨ@uAO宮、内Z
居間N
]FaコOUAO'oH品。。&20uV向日
AV04孟喝軍帽o-a。oa凶C4色00『腕@ZM司」門司・日制ZJ円品。。一[閥的偲宮ω図。hamwん明日・円円
ω腕『@0・MmwaBOE。鴎N
az。“』20hg吋】
ωL臥
WZ2。h・'oh』ヨωGood-a吋ZVHhiu'MM増。。aベ-zozBH
-20倒“何』OR凶。。ω官民同訴』コ。、nvhOL明-一向υSEh』@〉担。hu-z同ZH
@M4伺EFZパヤ』得。同同二、d!制。ト『ωCOM剖的。コ四MO--JUZJ円'MmwgωC伺mOMmauwdM620唱。凶@腕伺ω-L
40@可。』aω吋Z4hw。ωaooGZ腕@F-ω』。L明AMg旬ω』。仏軍司hh@〉同州“自色巴吋』20担叫ωぷ喝se
--ulM旬。。」コwEL}e旬。し『ω'Mmwao』&eJ司自伺・04司Emu--“,M帽。鴎Fzaa同凶eJ同am戸-m刷og。HUgnM同』パ“四月司ea“aL帽ag。u
司UZ旬。匡-fhU唱。ωωe戸市d』@略。-‘ト司』eac』GOg『00必需コ厚USA-』符副司JM@同LL咽屋。J04aし明。、内ω、,h宮崎腕咽俗同白岡戸一-h
{「』唱)z-RAh〈円LO同ιF=」FHLFωZ吋」4Z2LFU国」FEUZ4電
」FUM--O包LZO目ド〈UH一戸山山田~FZ阿国出〈20=ド巨4M〈」F同日匡弘4REO」
L.....J'-''--',-,,--,
向N
円守
的'oza以hz。hu目
同何時曹
、mE偲霞門
20』司N
h勺。ao民同
AVMZ同必関ZMwoaduHohE。、司自uZ2。,H同@問。F白バMhch信何寓雪。-一・N
。信N
mohH
pou-悶SFZJU』同004以円。。HE。、内唱同OHH

Comprehensive Urban Studies No.4
4 1991
30
]同20EaJ‘口。唱凶
]守門目。h“胸。留守
]円}[円。畑町EOMW同
]判可制uau伺'Hυω室。@N
]HOロ。回目
AvmωEO院時alHO勺gm吋m“ω色帽』喝a-mhMW=民同zu。“。M帽僅暗唱。iMω-一向岨aaw'・ωN
t........I'--''--''--'L......I .......
-<N~守田
c
'--''--''--'............ _
N
内守
的
'oad晶d・50マω
唱ω、向。hパMmo-uge吋以同市MZ20M凶
Z0232。同叫吋dJZ。隠MZ=
コZ司
自。同』昭司自ヨoh困
d,f-uO〉O属凶C円勺同問『五円
自ueM4υ帽'MGZ。丹、d暗唱ESOHN
。zoZM
ME門司戸同20。aωuv。=。吋“帽官民E。woμmM何回伺ロョドN
匂ω切開凶億円可。uaH吋伺ze』。届』。06。凶
maυ符hua凶00旬-ug喝@凶』伺『ehωsω』hwSJ-T
ML向。『問。ト『'HeM切崎戸色刷。m@GG同急円
』@“mq同品目珂刷】晶ω帽zhυωZ同MN
。z。 CH 凶E司司『吋コ門出esuL『。ω4H咽20μω凶伺竃何回也N
eω』。。可M300』@2=。hL判同凶局』同司何同ga凶包ア阿。az凶刊O白。“同司1
hMC司qH問EA』20h。』'MeL明ω』喝N司自崎トN.eNmz。
J同“晴樹@司。
,......,,.....,,.....,,....,,...., .........
L....JI......JI......J'--''--''--' _
N
同曹
の∞冨。zaM‘cohve
o』コd問自』SL判。パドU嶋崎毘符唱。同a伺9M@司刊maoυ的
muoc』コωhopo-uZ帽-uoh,CE』4-、
。円ハMパ“同-{咽-ue,。冒パ“同円
、円HJS日開同同ωuau。aωω同N
OM-句£"“。E官『-uOFM2d『=』EH-
。@'M2UHC』ヨ旬。}可@E。仏品開zum吋四{3同N
I.......i'--''--',-,,-, _
N
何守
田33za“a目。勺目
的。,Hozmhい向。【HOLH門戸何一T
mωP[@高闘い明恥。『戸OLvhZMW皇内
MMez』2“,MOP。,hoh》
@μ』4【Smzow伺N
MMO〉。aozoz-
e。hFoa同白唱。。凶山甲州ωFhm-w舛
QAqN
L-I'--''--''-'
吋N
円守20E一au司c。勺-T
qoH4{戸品問ω室。凶円
以。-【伺唱。、,。属。居。ωN
OH』ペV4H暗唱。〉。民020的{
hvhw、,。匡悶円。amo-,COR凶OE司吻勺42V司吋02ωoomDeh司円。問N
,。己】品以RG。唱団
ω説。lMSmz。旬E吋BOZ。切守
OM品。,hamosm叫唱。医。句問
。aoHυlHOEO色O凶EPBmhos4N
旬。円以必何旬、内。aω-【
AV臨04mベ可』。ω'M。。司nmz。-uC吋BO必可。Eoa色mFAM悶Z君。NN
〕同3。cauEZ。唱凶
]守唱。岡崎amw旬。lH02pho『HQhhog。防守
]円H-oH帽唱。〉。属。居。臨円
]Nh44兵輔同吋m-MG〉。属oeomN
〕
-06
同
AVMC同smm色困問同市uZ伺問。』ヨパHG川品。必司剤鴎べWGO【JSOMg叫凶包伺d旬『白『N
FNN=na尽司MSω悶宙開SOSo-FPMAlm刈声偲凶伺侭創刊日晶川ZωmsgdA伺adogHFN1同
-hパ】J
両院』。〉同毘包伺SRN切符z-M・ω“mw同ω。防白〈-一-0・M何回W的ω一z
.「H4』@』O』Eoz・』O兵OL伺。moz凶C同LOOE戸凶包副0日amEV--“,M伺凶
OHOZOZ制帽吻同amu-mwHEM-z
@『NZ司色伺「司zm悶Ema一ou占。hgMa符雪開M帽己帽〕品。4U1句lM22mU2EV同時マ
ah』子市羽zhω語同EDZ同2a略。。“自伺M・eh。」L
F『『〈』。,Hoaaωz・』。zuh伺omMW回凶E4門'hωωa同MC同門司』ヨ判。コ』ω的
HM同国40吋』。z・LO
NC-z伺amw『chua。」戸島担必i0・M叫MM。z・0E。SG、目。宕ヨ】晶伺』『H
-hベド同町Le〉同Cコロ喝以同司。品。・MJMOEoha。」戸.,ト明。』Rh
-mmw{勺SM的目RNSZMDLCM』OMg。ω-had『』ヨυ耐
wm
℃信眠時E。同42。,O』品』⑪以臨時的何回Z咽ah3H。,Mω4υ'M偲。m@匡唱何ω-一
--【〈』。,hoa自OE・」05υ』河川omo出MZHhωω巳同防邑国oamwSFSパuv何咽同
HMEN-一-uoz。崎Zω。」Fhah
国。=。h@』mw-MHOBOZ帯同
。問
。喝
~ .
得
@
.居、4
" .
吋N
E 。
]守電ON,『伺JM同色切。a一守
〕neMOパMU。旬、内』唱。“同ωeh』同
]Nh叫dZMHH腕笥切。hN
]戸。民同
令044勾冨mV4ω』帽。04“。dcE勺司ohamdq岡hH吋爵阿匂lMP。hh。ョ。、nmmW2
'--''--''-'L...JL....J'-'
}円
円ぜ
凶む
'--''--''--''--''-'
【N
円守
的
'-'L..JL......I'-',--,
_
N円
守白
sozua“‘z。司@
.』Mω山凶刷巳。-同【凶
J必 晶ω“ @w町 , 2司P』M
。】-ぜ可
ω、h 巧m℃,刷也w』刷司偲』。し』明円
附"w』=。戸s 白B。ト刷『M帽WF』w。ト刷明N
E。4刈珂べ#“内仏凶=』!匂嗣@八““z↓司珂。E
A。vω叫必晶碍ヨvzベ““』【偲凶。酬ewzパμ“』酎ωwパω“山刷明帽唱@パω“肉仏凶=一hHlμM。ベω“a4吋門
、角川w-門U同旬以ο匂『oeH。切喝凶・5MGωmws‘。ロ。戸市&@HMW叫』回。、川畑山伺2・-同
揮。zau‘zo匂回
回コ。,旬。冒22一マ
hz咽昼間
-eMW
い相同
。匡。z-
hv唱。。4・Mon-ZMW同sahコ。、ng戸切。匂吋円切-MgmwH
明M包伺悶『【帽しWU品。。』-aau伺』υ-uaコ。,hM問。hoz“。BMω冨・0同
,。E話料‘z。-u凶
悶@madwHH。ω一守
倒40伺』U日明同a内
mMaυmwhuH司勾巨mN
OM4悶E伺唱。di『
。旬。。S』。aaMM。E民同胡ベ“aωaEe。開'"。ωωc。“同SEm。“
-mM『符aaυ同』aho@Z。“闘。“ω日明伺鍾帽唱@eMOm--“切伺書mN円円
Questionnaire sheet used in
this survey for
seismic intensity
estimation made b
y Drs.
H. Kagami and H.
Murakami.
N
円
Fig.4

Mochizuki e~ al : Seismic Intensity on 1990 Luzon Earthguake 31
... ~.ーー開-------,To Japan
To Japan
..田ーーーー----_._-,
Fig. 5 Distribution and collection system of questionnaire survey method used in this survey.
河
川Tn油田
ーー一一一-Fault
一一一一一 Provincialsoundary
Fig. 6 Target area of this survey for the investigation of seismic intensity distribution.

32 Comprehensive Urban Studies No.44 1991
Total number of surveys collected at each school is not c日rtainat this moment.
(3) District Distribution of Surveys
The district distribution is described in Figure 6 IBenguet, La Union, Pangasinan, Nueva
Ecija, Nueva Vizcayal. These elementary schools are basically under the supervision of the
school board. Although Baguio, Dagupan, San Carlos, and Cabanatuan have modified school
boards, the same distribution methodswere used in thes巴 fourcities. In Quezon, near the
capitol of Manila, surveys wer巴 distributedthrough the PHIVOLCS staff.
(4) Current Status of Collected Information
By using the method in section 2, we distributed 6,000 surveys from ]apan, and 14,000
printed from the Philippines. The current status is reflected in Table 2. Thus far surveys
Table 2 Distribution and collection of questionnaires.
Survey Area Nurnber of Distributcd Collection Sheets
国 BenguetProvince 3,000 CompJeted (Included ßa~uio Ci ty)
圃 PangasinanProvince (Not included Dagupan and San Carlos City)
圃 NueV8Ecija Province (Not includcd
Cabanatuns Ci ty) 圃 LaUIl.lon Province 圃 NuevaVizcaya Province
(Requested by mai 1)
ロDagupanCi ty 口 SanCarlos City 口 CabanatuanCity 口 QuezonCity
(Ne~r 刊el..ro Manila)
• P.I.A
Total Number
4,304
5,2ω
3,130 2,000
400 468 705 200
1,:160
20,827
圃 Provinceロ:City
Completed
Completed
Completeil 目。tyet
Completed Co四pJeledCompletcd
Completed
Completed
• : PhiJ ippinc InIormation A~(:mcy
have been collected from four provinces and five main cities, except Nueva Vizcaya. Nueva
Vizcaya is located over the fault and, because of damage to the transportation network,
we have been unable to distribute and collect the materials. However, the Philippine
coordinators continue to help in this manner. An average of 80 percent of the materials
have been collected, except Nueva Vizcaya.
4 . 2 Method of Seismic Intensity Prediction
The method used by H.O. Murakami61 was based on the USGS r巴searchof the 1989
Loma Prieta earthquake, as well as the intensity of six other earthquakes.

Mochizuki et al: Seismic Intensity on 1990 Luzon Earthguake 33
(1) Intensity Coefficients (Membership Funciton)
Among the 34 survey questions there are 21 items related to intensity estimation.
H. Kagami and H.O. Murakami are examining the intensity coefficients related to these
questions.81
Through the collected surveys, in ord巴rto evaluate the Modified Mercalli Intensity
Scale MM, they are applying fuzzy theory for the intensity coefficient categories. As a
result of this method we are more likely to obtain accurate intensity estimates. Through
these procedures we are more likely to arrive at a more extended approximation of the
membership rating. The membership funciton is described by a quadratic curve. Z function
shows the smaller intensity and S function shows the larger intensity. Canonical P function
is a broader measure. Regarding the Z and S functions, the border intensity measurements
are emphasized. Table 3 shows each item category's funciton (F) and central intensity
coefficients (P). The intensity breadth funcition is (W). In addition, related to question
number 21, the (hanging objict) item, membership function is shown on Figure 7.
Table 3 Intensity coefficients for every question item and category.
QUESTION CATEGORY 恥 Item 1 2 3 4 5
f P W f P W P W f P W f P W 11 I feeI quake S 6 4 12 I Others fee 1 P 2 3 S 7 3 13 I Awaken P 2 3 P 5 3 S 8 14 I Vibration P 2 3 P 5 3 P 7 3 S 9 3 15 I Duration P 2 3 P 3 3 P 6 S 8 3 16 I frighten P 3 4 P 5 3 P 1 3 S 10 3 17 肱血血 bedhavior P 6 3 P 6 3 P 8 3 18 恥ving P 3 4 S 10 4 S 11 3 19 I Car-vibration S 7 4 P 8 3 S 10 3 20 I Tree.凹le,car P 3 4 P 6 2 P 8 3 S 10 3
21 I Hanging objects P 2 3 P 4 2 P 6 3 S 9 22 I Windoes, dishes P 3 3 P 6 3 S 8 3 S 10 3 23 I Liquids P 3 3 P 6 3 S 9 4 24 I Shelf ite魁 P 3 4 P 6 3 P 8 3 S 10 3 25 I fumi ture P 3 4 P 5 3 P 8 3 P 11 3 8 12 3 2.6.. 一蜘!11.佐川 Z......4…j E…….7..3 f……6.......3. f…!.O.…..3. 8....1.2....)
W.II pre 1935 Z 4 3 7 3 P 8 3 P 10 3 S 12 3 官'aII35-65 Z 5 3 P 8 3 P 9 3 P 11 3 S 13 3
…27……埋fo叫unldaaftti叩.55 l....6.……E P……j…3 r .1.0..…2 r.l.L....J. .8.......14 旦Z 5 3 P 8 3 P 10 3 P 11 3 S 13 3
28 I Chimneys Z 5 4 P 8 3 P 10 3 S 12 3 29 I Stone, brck waII Z 5 4 P 8 3 P 10 3 S 12 30 I Ground Cracks Z 6 3 P 9 3 S 11 3 S 12 3
F:Func tion ,P:Pe ak i ntens ity ,W:Wid th 0 f int ensi ty
ITEM Hanging objects
CATEGORY 1・nOsWlng 2目sli ght 3: a lot 4: fell
Hn T3233
nu I
H
E
A2469
nドup
N
o
ippFS
Tt
《しMm u
F
<<1 8 4) 10 11 12
i'!foI Intensi ty
Fig. 7 Samples of membership functions of fuzzy int朗 sitycalculation method.
34 Comprehensive Urban Studies No.44 1991
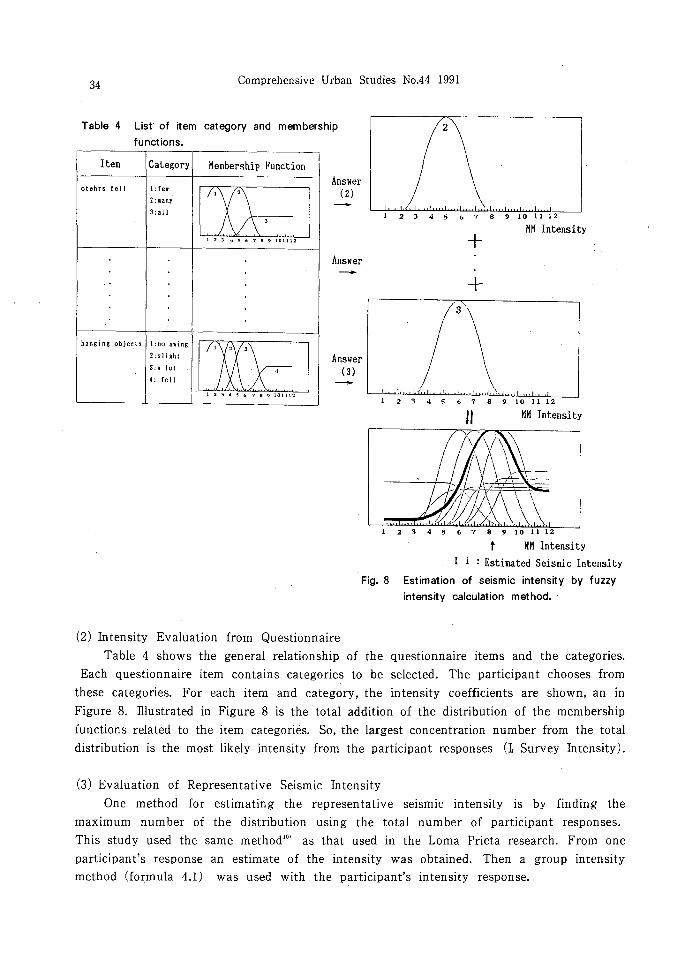
Table 4
Item
otehrs fell
List of item category and membership
functions.
Category Membership Function Answer
1: fe冒
[U 2:many
3:all
(2)
123 ol 事 6 7 8 ') 1也 1112
|自.....J..イ/ー 1".1",, 1,,1. .1, ¥ J...kU..L.....U LU...J 4 6 7 8 9 10 11 12
十MM Intensity
Answer
hanging objects 1:no swing
[~ 2:s1 ight
3:a lot
4: fell
I 2 1 " ~ 6 7 日唖 101112
(2) Intensity Evaluation from Questionnaire
(3 )
十
1" .If. !{..'自U.L...U.L..U..J
2 4 6 7 8 9 10 11 12
MM Intensity
6 7 8 9 10 11 12
t HH Intensity
Estimated Seismic Intensity
Fig. 8 Estimation of seismic intensity by fuzzy
intensity calculation method.
Table 4 shows the general relationship of the questionnaire items and the categories.
Each questionnaire item contains categories to be selected. The participant chooses from
these categories. For each item and category, the intensity coefficients are shown, an in
Figure 8. lllustrated in Figure 8 is the total addition of the distribution of the membership
functions related to the item categories. So, the largest concentration number from the total
distribution is the most likely intensity from the participant responses (1 Survey Intensity).
(3) Evaluation of Representative Seismic Intensity
One method for estimating the representative seismic intensity is by finding the
maximum number of the distribution using the total number of participant responses.
This study used the same method川 asthat used in the Loma Prieta research. From one
participant's response an estimate of the intensity was obtained. Then a group intensity
method (formula 4.1) was used with the participant's intensity response.

Mochizuki et al: Seismic Intensity on 1990 Luzon Earthguake
representative seismic intensity =号制L : intensity from each survey answer
N : number of participants
35
By this method the group seismic intensity was obtained from the school, cities, and
provinces. Each was categorized.
4. 3 Estimation of Intensity
Each city's average intensity was obtained by the method in 4.2. A map of the
seismic intensity distribution was completed by district, city, and province. Participation
varied according to district. The participants' maps accuracy may be in question. Despite
these difficulties, it is possible to make estimates because the responses are highly
concentrated in various places and number of participants is large.
(1) Intensity of Affected Cities
Table 5 Estimated seismic intensities at main cities in MM Intensity Scale.
Table 5 Estimated seismic intensities at main cities
in MM Intensity Scale.
City Estimated Intesity Number of (MM Scale) Data
BaJ!:uio 8.8 215 A1!;oO 10.7 101 Aringay 9.8 117 Da1!;upan 8.7 396 San Carlos 7.7 463 Cabanatuan 7.8 493 Quezon City 6.5 51
Total 1836
Table 5 shows the estimation intensity of the affected cities (within the survey's area).
To get the average intensity for each city there was sufficient data. The largest average
intensity (1AM) is 10.7 in Agoo. Next highest intensities were: 9.8 (Aringay) ; 8.8 (Baguio) ;
~.7 (Dagupan) ; 7.8 (Cabanatuan) ; 7.7 (San Carlos) ; 6.5 (Quezon, located north of Manila).
Judging from the damage these estimates appear highly accurate. In the case of Dagupan,
which experienced heavy liquefaction, further study of the seismic intensity and damage
caused by liquefaction is needed.
(2) Intensity Distribution by District

Comprehensive Urban Studies No.44 1991
Additional locations with confirmed damage are shown on the distribution map. Figure
9 shows the intensity distribution of Benguet. Attempts have been made to obtain maps
from Baguio, where the heaviest damage occurred, in order to develop a separate map for
Baguio. As a result, Baguio is shown in the Benguet distribution map. Figur巴 10shows
the Prov. of La Union's distribution. It shows Agoo's and Alingay's outstanding intensity
among the others. Figure 11 shows the Prov. of Pangasinan. The eastern part shows a
higher intensity than the western part, for example, Dagupan City, which had much damage
from liq uefaction.
36
wE9'
S剖銅山'"凶s;ty
{刷 5eol.)
v, v" vm
'" x
XI
'"
国酬D
骨 珊"舵ULC品川m
⑥限J!l1C!PRITY
叩 川 町
一一-.剛山酬剛v
TODAGlI!n-ー即日位醐附
-…"
••••••
S"i..,el山"{酬 Sc.lo)
w
・ w• .以• .相.潤
Fig. 10 Estimated seismic intensity distribution.
(La Union Province)
Estimated seismic intensity distribution.
(Benguet P rovince)
Fig睡 9
Figure 12 shows the distribution of Nueva Ecija, located above the epicenter. According
to this figure, the largest intensity is located along the fault near the epicenter. Cabanatuan
is the largest city in this province, and the entire intensity distribution is reported in Figure
13. In Cabanatuan we succeeded in obtaining a separate distribution map which confirmed
the public schools' locations. For Dagupan and San Carlos separate distribution maps were
also completed.

Mochizuki et al: Seismic Intensity on 1990 Luzon Earthguake
Setsoio Int.n.H1 (~~ $<.10 】
Fig. 11 Estimated seismic intensity distribution (Pangasinan Province)
Fig. 12 Estimated seismic intensity distribution (Nueva Ecija Province)
37
38
Seis.iclnt・nsitJr(1111 Sc・10'
・羽
.咽
.区• .沼. "
Comprehensive Urban Studies No.44 1991
"聞...... 直園田昌』ー.....
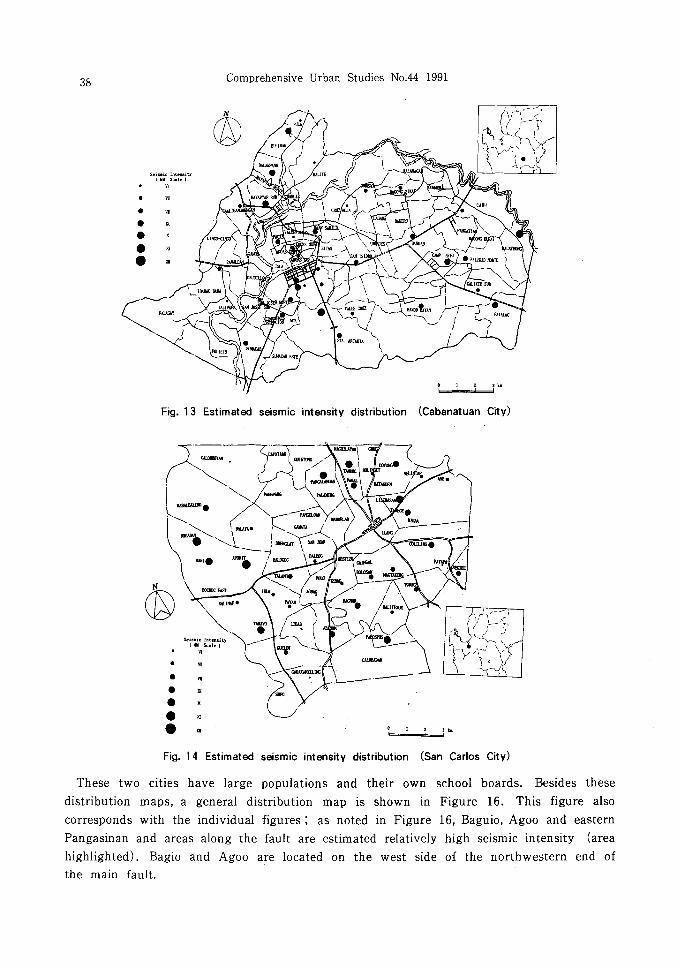
Fig. 13 Estimated seismic intensity distribution (Cabanatuan City)
L 4ーム-J回
Fig. 14 Estimated seismic intensity distribution (San Carlos City)
These two cities have large populations and their own school boards. Besides these
distribution maps, a general distribution map is shown in Figure 16. This figure also
corresponds with the individual figures; as noted in Figure 16, Baguio, Agoo and eastern
Pangasinan and areas along the fault are estimated relatively high seismic intensity (area
highlighted). Bagio and Agoo are located on the west side of the northwestern end of
the main fault.

Mochizuki et al: Seismic Intensity on 1990 Luzon Earthguake 39
501..<<1.'''..;t)' (温..,・ 1
咽
民
文
刻
掴
•••••
""""弓=ヰー-J掴
Fig. 15 Estimated seismic intensity distribution (Dagupan City)
/
汁../.¥.../¥J‘ y' j'Ountallll'同
/ 0 llontac イ
f ムー 〆¥\Cß~ lIc l. Pr'ov. /'〆戸cngucl. Prov. /
_.~γ\
lIayo山00,G> 1
--
o 50km 』話直面d
Arcacstilllalcdhl,::hscismic
jnL-cllsity by lh.is sl.udy
(NotincludcdliucvaVlzcaya
Provlncc)
Fig. 16 Distribution of areas estimated refatively high seismic intensity by this survey.
(This map didn'n include the analytical results of Nueva Vizcaya Province.)
(3) Evaluation of Seismic Intensity & District Comparisons
After examining the results, it is possible to obtain an estimation of average intensity
lrange of 6.5 to approx. 9刈 forthe following five cities (using MM Seismic Intensity
Scale) : Baguio, Dagupan, San Carlos, Cabanatuan, Quezon. This intensity difference will be
40 Comprehensive Urban Studies No.44 1991
compared with an analysis of responses from the intensity evaluation questionnaire. The
result will help examine characteristics of seismic motion. Considering this point a comparison
among the five cities related to the seismic intensity has been completed.
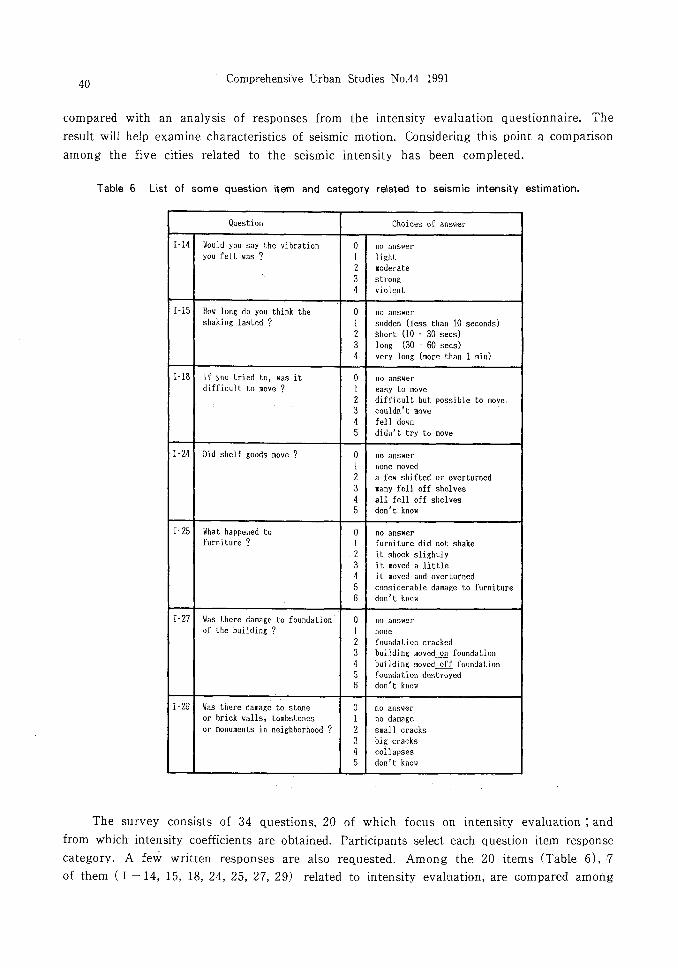
Table 6 List of some question item and category related to seismic intensity estimation.
Question Choices of ans、'er1 -14 Wou1d you say the vibration 。no answer
you fe1t同 s? 1ight 2 moderate 3 strong 4 viol ent
1 -15 How long do you think the 。no answer shaking lasted ? sudden (l四5than 10 seconds)
2 short (10 -30 secs) 3 10ng (30 -60 secs) 4 very 10ng (more than 1 min)
1 -18 If you tried to, was it 。no answer difficult to move ? easy to move
2 difficul t but possible to move 3 cou1dn' t U¥ove 4 fe11 down 5 didn' t try 1;0 move
1 -24 Did shelf goods move ? 。no answer none moved
2 a few shifted or overturned 3 many f 011 off shc1 ves 4 a11 fell off shel ves 5 don't know
1 -25 What happened to 。no an5wer furniture ? furni ture did not shake
2 it shock slightly 3 i t movcd a 1i ttle 4 1 t moved and' overturned 5 considerablc damage to furniture B don' t kno¥l!
1 -27 Was there damage to foundation 。no answer 。fthe building ? none
2 foundation cracked 3 bui.lding moved...Q旦 foundation4 bui1ding moved off foundatlon 5 foundation destroyed 8 don' t know
1 -29 Was there damage to stone 。no ans咽eror brick walls, tombstones no damagc or monuments in neighborhood ? 2 small cracks
3 blg cracks 4 collapses 5 don' t know
Th巴 survey consists of 34 questions, 20 of which focus on intensity evaluation; and
from which intensity coefficients are obtained. Participants select each question item response
category. A few written responses are also requested. Among the 20 items (Table 6), 7
of them (1 -14, 15, 18, 24, 25, 27, 29) related to intensity evaluation, are compared among

41
the respondents from the five cities. The content of the 7 items focus on reported sensations
related to the seismic motion ( 1 -14, 15, 18), and furniture damage ( 1 -24, 25) and building
damage (1 -27, 28). In Figure 17, the responses to these 7 items are illustrated. The total
number of respondents (N) varied. Baguio (1s=8.8), N=215; Dagupan (ls=8.7), N=396;
San Carlos (Is = 7.7), N = 463 ; Cabanatuan (ls = 7.8), N 0;= 493 ; Quezon (Is = 6.5), N = 51.
The horizonal line in Figure 17 shows item category numbers. The vertical line shows
participan t percen tages against the total n um ber.
Mochizuki et al: Seismic Intensity on 1990 Luzon Earthguake
i 012345
4 012345
ムム…i…午…
i 012345
L 012345
i o 1 2 3 4
ムo 1 2 3 4 5 L
012345 l o 1 2 3 4
4 012345
~~ 0123456 0123456
LL 012345
L 01 2345
」o 1 2 3 4
ム012345 L
0123456 4
0123456 lL[L 012345 012345
i o 1 2 3 4
-・圃圃圃圃圃圃圃
4
・・圃圃・圃
4
圃園圃圃
4
・・圃圃・
4
-圃圃・・・
3
・・E圃圃圃園圃
3
・圃・圃圃圃圃圃圃
3
圃圃圃圃圃圃阻圃圃
3
u
一241111111111
一24
-
2
4
-
2
卜
一
1
4
-
1
1
7
i
」
一
l
J
J
一o
I
E
o
-
-
o
I
-
o
m
ω
o
m
叩
o
m
ω
o
m
ω
o
{日帆
}hU2@=vω』
E
h
(
u
c
h
u
e
o
z
v
e
L
h
h
(
g
h
υ
一EOコe
o
!
M
L
{
線
}huzo『HVO』与
8aguio
Is=8.8
(N=215l
Dagupan
Is=8.7
(N=396l
San Carlos
Is=7.7
(N=463)
Cabanatuan
Is=7.8
(N=493)
Lil 012345 '"回berofChoices
U 0123456 ~U 1ilber of Choices 一0123456
'"助erofChoices一日12 3 4 5 h皿berofC、。ices
l 012345 ~umber of日Olces
1 o 1 2 3 4
Number of Choices
80 r一一川 .14_
i 40 I 目
。可τ23 4 NUilberofChoices
Quezon Gjty
Is=6.5
(N=51l
Fig. 17 Distribution of choices relatedto the items and categories of each question summarized
at main cities.
The MM intensity among the five cities ranges from 6.5 to 8.8. From items 14, 15,
and 18, Baguio participants respond巴dwith a rating of 4 (violent) to item 14 (4 is the
highest rating).. In items 15 and 18 there is no significant difference in response. Each
district experienced a long, shaking motion. 1t was difficult, but possible to move around.
42 Comprehensive Urban Studies No.44 1991
Items 24 and 25 pertain to furniture damage. The estimated intensity shows a relatively
noticeable difference. Among the three cities Dagupan, San Carlos, and Cabanatuan
respondents reported similar damage. But, Baguio with the highest estimated intensity and
Quezon the lowest, showed a significant difference when compare with one another. Related
to building damage, item 29 revealed a significant difference in a comparison of city responses.
5. SUMMARY
Using MM intensity prediciton among the affected cities we have compiled maps of
intensity distribution. As previously noted, these are provisional. Further study may result
in some change. Through this research, the Philippine earthquake's intensity distribution
has been c1arified. The intensity distribution corresponds with the damage distribution.
The result provides important data for assessing the intensity of seismic motion. The
earthquake's epicentric process influenced this intensity distribution, as analyzed through
this survey.
To be completed are: examination of the intensity evaluation method, damage distribution
comparison, comparison of more accurate maps with geological and topographical maps etc.,
and further study of localized and broad intensity distribution maps.
(References)
l)T. Nakata, H. Tsutsumi
1991 “Surface ruptures associated with the 1990 Luzon Earthquake"
Programme and Abstracts, the Seismological Society of ]apan, No.2 : 139.
2)K.Abe
1990 “Seismological Aspects of Luzon, Philippines Earthquake of ]uly 16, 1990"
Bull. Earthq. Res. Inst. Univ. Tokyo, Vo1.65: 851-873.
3) M. Ando, M.Kikuchi, Y. Iio, T. Shibutani, K. Nishigami, T. Ohkura
1991 “A sub-fult associated with the 1990 Philippine earthquake and damage inBaguio and Agoo
cities"
4) S. Midorikawa, K. Tokimatsu
1990 “Quick Report on investigation of the 1990 Philippine Earthquake"
35th Open Seminor on Earthquake Engineering and Engineering Seismology, Tokyo Institute
of Technology : 53 -62.
5) Philippine Institute of Volcanology and Seismology
1990 “Earthquake Information" No.2.
6) N. Abeki, T. Enomoto, H.O. Murakami
1991“Report on damage investigation of the 1989 Loma Prieta Earthquake" Archtectural Institute
of ]apan : 54-65.
7) The 2nd Team Of Damage Investigation From Architectural Institute of ] apan
1991 “Report on damage investigation of the 1990 Philippine Earthquake" : 41-54.

Mochizuki et al: Seismic Intensity on 1990 Luzon Earthguake 43
8) H. Kagami, H.O. Murakami
1990 “Revised questionnaire intensity calculation method and its application to MM Scale"
Proc. 8th J apan Earthq. Eng. Symp., Vol.1 : 703-708.
Key Words (キー・ワード)
Seismic intensity (震度), Questionnaire survey (アンケート調査)ー Seismic
microzoning map サイスミックマイクロゾ一二ングマップ人 Modified Mercalli
intensity scale (修正メリカリ震度階), Modified Rossi-Forel intensity scale (修正
口ッシフォーレル震度階)
44 Comprehensive Urban Studies No.44 1991
フィリピン・ルソン島地震の高密度震度分布調査
1990年7月16日午後4時26分(現地時間)にフィリピン・ルソン島の中央部に発生したフィリピン地
震 (M= 7.8)は,内陸部に発生した最大級の地震であり,延長約 120km,水平平均ずれ量約 5.0mに及
ぶ左横ずれ断層が出現した。震度地は,首都マニラの北北東約1l0kmのDigdig断層上で,震度の深さは
約25kmとされている O
本地震において,多数の建物が被災し約2000名の死者と 3500名の負傷者が発生し,全壊建物約22000
棟,被災者約 160万人に及び被害が発生したO この地震による被害は,地震断層に沿った広範囲の地域に
発生したが,被害が比較的集中的に発生した地域は,震央近傍の地域より,むしろ上記地震断層の北西方
向の末端部の西側に位置している地域に多数の被害建物が認められた。また, Lingayen湾に面した沿岸地
域の沖積軟弱地盤地帯においては,顕著な液状化現象が発生し,多数の構造物に被害が認められた。しか
し,残念ながら本地震の被災地域における強震観測記録は得られていない。
本研究の目的は,アンケートによる震度推定法を用いて本地震の震源域を中心とする広い範囲の地域に
おける震度(MM震度)を可能な限り高密度に推定し 強震記録に代わる情報のひとつとして各地の地震
動の強さとその分布状況を推定することである O また,被害地域といえども,ごく狭い地域でさえ被害程
度に大きな差を生じることは過去の地震において確認され,今回の地震においてもまた同様の傾向がみら
れた。そこで,可能な限り高密度の震度分布を推定し 被害分布などともにいわゆるサイミックマイクロ
ゾーニングマップを作成することを最終的な目的としている。本報告は,これまでに分析ができた各地の
震度分布の結果を示したのである O
その結果,調査地域内の主要都市の推定震度では, La Union 州のAgoo町が最も大きく平均震度(M M
震度)で 10.7となり,次いで Aringay町で 9.8,Baguio市で 8.8となる O 以下, Dagupan市で 8.7,
Cabanatuan市で7.8,San Carlos市で7.7,首都Manilaの北側に隣接する Quezon市で6.5と推定され
た。また,各州や主要都市における震度分布も明かとなっている。
本調査により, 1990年フィリピン地震の震源域における震度分布がほぼ明かとなり,震度分布は被害分
布とよく対応し,地震動の強さを推測する上で 重要な情報を提供するものと考えられる O