Seismic Hazard Analysis for the Bangalore Regionmicrozonation/index_files/J-2.pdf · the...
18
Seismic Hazard Analysis for the Bangalore Region T. G. SITHARAM w and P. ANBAZHAGAN Department of Civil Engineering, Indian Institute of Science, Bangalore, Karnataka 560012, India (Received: 29 November 2005; accepted: 8 February 2006) Abstract. Indian peninsular shield, which was once considered to be seismically stable, is experiencing many earthquakes recently. As part of the national level microzonation pro- gramme, Department of Science and Technology, Govt. of India has initiated microzonation of greater Bangalore region. The seismic hazard analysis of Bangalore region is carried out as part of this project. The paper presents the determination of maximum credible earthquake (MCE) and generation of synthetic acceleration time history plot for the Bangalore region. MCE has been determined by considering the regional seismotectonic activity in about 350 km radius around Bangalore city. The seismotectonic map has been prepared by considering the faults, lineaments, shear zones in the area and historic earthquake events of more than 150 events. Shortest distance from the Bangalore to the different sources is measured and then peak ground acceleration (PGA) is calculated for the different source and moment magnitude. Maximum credible earthquake found in terms of moment magnitude is 5.1 with PGA value of 0.146 g at city centre with assuming the hypo central distance of 15.88 km from the focal point. Also, correlations for the fault length with historic earthquake in terms of moment magnitude, yields (taking the rupture fault length as 5% of the total fault length) a PGA value of 0.159 g. Acceleration time history (ground motion) and a response acceleration spectrum for the corresponding magnitude has been generated using synthetic earthquake model con- sidering the regional seismotectonic parameters. The maximum spectral acceleration obtained is 0.332 g for predominant period of 0.06 s. The PGA value and synthetic earthquake ground motion data from the identified vulnerable source using seismotectonic map will be useful for the PGA mapping and microzonation of the area. Key words: seismic hazard, MCE, PGA, seismotectonic, fault length 1. Introduction Seismic hazard analyses involve the quantitative estimation of ground shaking hazards at a particular area. Seismic hazards can be analyzed deterministically as when a particular earthquake scenario is assumed, or probabilistically, in which uncertainties in earthquake size, location, and time of occurrence are explicitly considered (Kramer, 1996). Probabilistic seismic hazard analysis provides not one, two, or three choices, but infinite w Author for correspondence: E-mail: [email protected] Natural Hazards (2007) 40: 261–278 ȑ Springer 2006 DOI 10.1007/s11069-006-0012-z
Transcript of Seismic Hazard Analysis for the Bangalore Regionmicrozonation/index_files/J-2.pdf · the...

Seismic Hazard Analysis for the BangaloreRegion
T. G. SITHARAMw and P. ANBAZHAGANDepartment of Civil Engineering, Indian Institute of Science, Bangalore, Karnataka 560012,
India
(Received: 29 November 2005; accepted: 8 February 2006)
Abstract. Indian peninsular shield, which was once considered to be seismically stable, isexperiencing many earthquakes recently. As part of the national level microzonation pro-
gramme, Department of Science and Technology, Govt. of India has initiated microzonationof greater Bangalore region. The seismic hazard analysis of Bangalore region is carried out aspart of this project. The paper presents the determination of maximum credible earthquake
(MCE) and generation of synthetic acceleration time history plot for the Bangalore region.MCE has been determined by considering the regional seismotectonic activity in about 350 kmradius around Bangalore city. The seismotectonic map has been prepared by considering the
faults, lineaments, shear zones in the area and historic earthquake events of more than 150events. Shortest distance from the Bangalore to the different sources is measured and thenpeak ground acceleration (PGA) is calculated for the different source and moment magnitude.Maximum credible earthquake found in terms of moment magnitude is 5.1 with PGA value of
0.146 g at city centre with assuming the hypo central distance of 15.88 km from the focalpoint. Also, correlations for the fault length with historic earthquake in terms of momentmagnitude, yields (taking the rupture fault length as 5% of the total fault length) a PGA value
of 0.159 g. Acceleration time history (ground motion) and a response acceleration spectrumfor the corresponding magnitude has been generated using synthetic earthquake model con-sidering the regional seismotectonic parameters. The maximum spectral acceleration obtained
is 0.332 g for predominant period of 0.06 s. The PGA value and synthetic earthquake groundmotion data from the identified vulnerable source using seismotectonic map will be useful forthe PGA mapping and microzonation of the area.
Key words: seismic hazard, MCE, PGA, seismotectonic, fault length
1. Introduction
Seismic hazard analyses involve the quantitative estimation of groundshaking hazards at a particular area. Seismic hazards can be analyzeddeterministically as when a particular earthquake scenario is assumed, orprobabilistically, in which uncertainties in earthquake size, location, andtime of occurrence are explicitly considered (Kramer, 1996). Probabilisticseismic hazard analysis provides not one, two, or three choices, but infinite
w Author for correspondence: E-mail: [email protected]
Natural Hazards (2007) 40: 261–278 � Springer 2006DOI 10.1007/s11069-006-0012-z

choices for the user and decision-makers (Wang, 2005). Krinitzsky (2005)comments on the problems in the application of probabilistic methods andgives an account on a deterministic alternative which highlights that ‘‘ADeterministic Seismic Hazard Analysis (DSHA) uses geology and seismichistory to identify earthquake sources and to interpret the strongest earth-quake each source is capable of producing regardless of time, because thatearthquake might happen tomorrow. Those are the Maximum CredibleEarthquakes (MCEs), the largest earthquakes that can reasonably be ex-pected. As we cannot safely predict when an earthquake will happen, theMCEs are what a critical structure should be designed for if the structureis to avoid surprises’’.
A critical part of seismic hazard analysis is the determination of PeakGround Acceleration (PGA) and response acceleration (spectral accelera-tion) for an area/site. Spectral acceleration (Sa) is preferred for the designof civil engineering structures. It is an accepted trend in engineering prac-tice to develop the design response spectrum for the different types offoundation materials such as rock, hard soil and weak soils. Seismic haz-ard analysis and determination of PGA is crucial and very important forany earthquake resistant design and Microzonation. To evaluate seismichazards for a particular site or region, all possible sources of seismic activ-ity must be identified and their potential for generating future strongground motion should be evaluated. Analysis of lineaments and faultshelps in understanding the regional seismotectonic activity of the area. Lin-eaments are linear features seen on the surface of earth which representsfaults, features, shear zones, joints, litho contacts, dykes, etc; and are ofgreat relevance to geoscientists. Scientists believe that a lineament is a deepcrustal, ancient, episodically reactivated a linear feature that exerts controlon the make up of the crust and associated distribution of ore and hydro-carbons (O’ Leary et al., 1976, Ganesha Raj and Nijagunappa, 2004).
Seismicity of an area is the basic issue to be examined in seismic hazardanalysis for evaluating seismic risk for the purpose of microzonation plan-ning of urban centres. Detailed knowledge of active faults and lineamentsand associated seismicity is required to quantify seismic hazard and risk.Indian peninsular shield, which was once considered to be seismically sta-ble, has shown that it is quite active. Large number of earthquakes withdifferent magnitudes has occurred very often in this region (RamalingeswaraRao and Sitapathi Rao, 1984; Bansal and Gupta, 1998). In recent yearsmuch of the seismic activity in the state of Karnataka has been in thesouth, in the Mysore–Bangalore region (Ganesha Raj and Nijagunappa,2004). Seismotectonic map from Project Vasundhara (1994) also showsthat there are active faults that triggered earthquake magnitude of 2–4close to Bangalore. The morphology of Karnataka shows that the series ofwater falls, cascades and rabid along the Cauvery river, particularly
T. G. SITHARAM AND P. ANBAZHAGAN262

between Sivasamudram in Karnataka and Mettur in Tamil Nadu. This isattributed due to reactivation of Precambrian faults across part of the oldcourse here and lateral displacement of the uplifted blocks, giving rise tochange in the course of the river as shown in Figure 1 (Valdiya, 1998).Figure 1 shows the active faults speculated at present by Valdiya (1998) insouth of Bangalore on either side within 100 kms. Similarly, in the north,the Arkavathi River that follows a remarkably straight fault valley in theManchenabele–Aganahalli–Ramagiri tract is shown in Figure 2. Valdiya(1998) highlighted that the recent uplift is in the order of 7–10 m on theeastern side formed gully erosion on the Manchenabele reservoir area cor-roborating to the recent movement of the faults. Figure 2 shows faults andlineaments identified by Valdiya (1998) close to Bangalore at a distance ofabout 20–50 kms; having a length varying from about 35 to 90 kms.
Valdiya (1998) indicate that in Southeast of Kanakapura (see Figure 2),the Hosdurga stream flows about 10 kms in a straight valley before enter-ing on entrenched swing and they have pointed the evidence to the westernblock rising up a few meters and blocking the flow of the Hosdurgastream. As described by Radhakrishnan and Vaidyanadhan (1997), theeastern part of Karnataka (close to Bangalore) is surrounded by remobi-lized terrain and it is marked by a 5 km wide steep-dipping mylonite belt,which can be traced for nearly 400 km. Despite its steep dip many workersconsider it as a thrust on the basis of seismic evidence. Ganesha Raj andNijagunappa (2004) have identified an active lineament from Mandya–Channapatna–Bangalore using remote sensing data and neotectonic activ-ity of the area. From the above discussion, it is clear that there are severalactive faults and lineaments in and around Bangalore.
Figure 1. Active Faults present close to Bangalore (after Valdiya, 1998).
SEISMIC HAZARD ANALYSIS FOR THE BANGALORE REGION 263

Bangalore city covers an area of over 650 square kilometres and is at anaverage altitude of around 910 m above mean sea level. It is situated on alatitude of 12�58¢¢ North and longitude of 77�37¢¢ East. The population ofBangalore city is over 6 million and Bangalore city is the fastest growingcity and fifth biggest city in India. It is the political capital of the state ofKarnataka. Besides political activities, Bangalore possesses many nationallaboratories, defence establishments, small and large-scale industries andInformation Technology Companies. That is also called as Silicon Valleyof India/Science city of India. These establishments have made Bangalore a
290Devarayadurga
1013
1026
Hoskote
Devarahalli
Pinakini R.
Anekal
1466Nandidurga
Devanhalli
BANGALORE
Palaco
lake
Kollegal
Kaveri
Sivasamudram13˚
14361040Raudalli
1363
Ark
avat
hi
Sangam
1033
Falls
Hosdurga1135Kaveri
1009
1303
15141119
Pala
cola
ke
Hosadurga
1049
1064
Palacolake
Shivaganga
Maddur
Savandurga
Tumkur
953
Reservoir
Palacolake
Kanakpur
1226
Manchanbete979
996
Makalidurga
Mahadevapura
1195
Kum
udva
ti
Solur
1386
1039
1158
1211
921
935
1017
1059
DodBallapur
1023
1445
Lineament
1395
Falls 40m
Hogenakal
Chinari R.
1290
994
elsewhere
0 20 km
illustratedArea
13˚
Denknkota
Tottikere
Hosur
> > 450 mup to 1750 m
Palacolake
Fault
900 m
Tectonic hill
Kendattibetta
Antaraganga
SrinivaspurBamangarh
Ambadurga
Chintamani
1127
Chikballapur
MulbagalP
alar
R.
Kolar
1009
Gudibanda
30'
13˚
17˚ 30'
Gouribidanur
1123
1255
Madhugiri
Bondarahalli
1346
Mindupur
Papag
hni R
.930
Bagepalli
30'
13˚
Figure 2. Active Faults present in southeast of Karnataka (after Valdiya, 1998).
T. G. SITHARAM AND P. ANBAZHAGAN264

very important and strategic city. Recent earthquakes in different parts ofcountry, particularly the one at Bhuj during 2001 has influenced theimportance of earthquake resistant design and construction. Because ofdensity of population, mushrooming of buildings of all kinds from mudbuildings to RCC framed structures and steel construction, improper andlow quality construction practice and irregular and heavy traffic condi-tions; Bangalore is vulnerable even against average earthquakes. Thusthere is a need to evaluate the seismic hazard of this area. As per IS 1893(2002) Bangalore is upgraded to Zone II from Zone I in the seismiczonation map. Further, findings from geologists have shown that in theBangalore region the reactivated reverse/normal faults have a dominantstrike-strip movement resulting in repeated rupturing at close intervals.This is also evident from rejuvenation of the transcurrent faults manifestedin recurrent earthquakes (Valdiya, 1998). Ganesha Raj and Nijagunappa(2004) have also highlighted the need to upgrade the seismic zonation ofKarnataka; particularly the areas surrounding Bangalore, Mandya andKolar to zone III rather than the current zone II as these areas are quiteactive, based on the analysis using remote sensing data and past earth-quake events in the area. In this paper, as per Regulatory Guide 1.168(1997), regional geological and seismological investigations for theBangalore city has been carried out considering a radius of 350 km aroundthe point of interest to identify seismic sources by using literature review,study of maps, remote sensing data and ground reconnaissance study.Study area lies between latitudes 9�50¢¢ north to 17�12¢¢ north and longi-tudes 74�24¢¢ east to 81�42¢¢ east covering 350 km radial distance from thecity. Here, an attempt has been made to determine the maximum credibleearthquake (MCE) and generation of synthetic acceleration time historyplot for the Bangalore region. The seismotectonic map has been preparedby considering all the possible sources of seismic activity such as faults,lineaments, shear zones and historic earthquake events (of more than 150events).
2. Seismotectonics
Many earthquakes have been reported in this region and the first reportedseismic activity in the study area had an intensity of VI occurred on 10thDecember, 1807. However, earthquake recording station was not there inBangalore city until recently. Recent tremors which are reported are fromthe Gauribidanur seismic recording station which is about 85 km fromBangalore and from India Meteorological Department (IMD) data. Thehistoric earthquake shows that moderate earthquake of 4.0–5.5 in momentmagnitude have occurred many times in the study area. Some of these
SEISMIC HAZARD ANALYSIS FOR THE BANGALORE REGION 265

earthquakes are listed in Table I. In recent years much of the seismicactivity in the state of Karnataka has been in the south, in the Mysore–Bangalore region. Historically tremors have occurred in many other partsof the state such as Bellary, which is in the north part of Karnataka. OnJanuary 29th of 2001, earthquake magnitude of 4.3 in Richter scale hit inthe Mandya area, its epicentre was about 35 km south of Bangalore. Morethan 50 buildings have been reported to be damaged at Kanakapura.Widespread panic in Bangalore and schools were closed. Minor damagesare reported at Austin town and airport road in Bangalore. Even theKillari earthquake of 30th September 1993 was felt in Bangalore city.Sumatra earthquake of 2004 has triggered tremors of intensity IV in Ban-galore city. As part of this work, in the year 2005 six strong motion accel-erographs and two borehole sensors have been installed at differentlocations in Bangalore city.
Geologically most part of Bangalore region is comprised of Gneissiccomplexes, which is formed due to several tectonic-thermal events withlarge influx of sialic material, are believed to have occurred between 3,400and 3,000 million years ago giving rise to an extensive group of grey gneis-ses designated as the ‘‘older gneiss complex’’. These gneisses act as thebasement for a widespread belt of schist’s. The younger group of gneissicrocks mostly of granodioritic and granitic composition is found in the east-ern part of the state, representing remobilized parts of an older crust withabundant additions of newer granite material, for which the name ‘‘youn-ger gneiss complex’’ has been given (Radhakrishnan and Vaidyanadhan,1997). The rocks in this group range in age from 2,700 to 2,500 millionyears. The oldest rocks of Karnataka are the Sargur Group of rocks,which is followed by Peninsular Gneissic Complex, Dharwar Super Group,Closepet Granite, Kaladgi, Bhima’s, and Deccan Traps; these are furtherfollowed by laterite and alluvium. The Peninsular Gneissic Complex occu-pies major part of the study area.
Seismotectonic map has been prepared using Adobe Illustrator version9.0 package. Seismotectonic details of study area have been collected inabout 350 km radius around Bangalore. A seismotectonic detail includesgeology, rock type, faults orientation with length, lineaments withlengths, shear zones with length and seismic earthquake events. Earth-quake data collected from different agencies [United State GeologicalSurvey (USGS), India Meteorological Department (IMD), GeologicalSurvey of India (GSI) and Amateur Seismic Centre (ASC)] contains dif-ferent type scales measurement such as intensity, local magnitude orRichter magnitude and body wave magnitudes. These magnitudes areconverted to moment magnitudes (MW) by using magnitude relations gi-ven by Idriss (1985). Seismotectonic Atlas-2000 published by GeologicalSurvey of India and Karnataka lineaments using remote sensing data as
T. G. SITHARAM AND P. ANBAZHAGAN266

Table I. List of the historic earthquakes in the study area.
Date Latitude (�E) Longitude (�N) DepthKm
Datasource
Momentmagnitude
8.6.1988 9.8 77.2 5 NGRI 4.4
7.6.1988 9.8 77.2 5 NGRI 4.8
17.03.1856 9.9 78.1 – OLD 4.6
17.2.1981 9.95 76.8 GBA 4.2
2001 8 25 10.48 76.12 15 IMD 3
16.2.1979 10.5 77 CVR 4.5
16.5.1972 12.4 77 – UMC 5.1
13/02/2005 10.61 76.42 CESS 1.1
1994 12 2 10.75 76.25 15 IMD 3.7
25/08/01 10.76 76.25 CESS 2.8
01/08/02 10.76 76.24 CESS 2.8
18/04/04 10.76 76.78 CESS 1.7
22/07/04 10.76 76.30 CESS 1.5
05.01.1864 10.8 78.7 – OLD 4.6
8.2.1900 10.8 76.8 UC 6.2
17/04/04 10.92 76.04 CESS 1.8
1.3.1978 10.98 75.37 GBA 4
24.6.1865 11 76.95 UGS 4.6
29.7.1972 11 77 IMD 5.4
0.10.1964 11.3 75.8 GUB 4.9
13.8.1858 11.4 76 OLD 5
28/12/04 11.42 76.55 CESS 2
28.2.1882 11.46 76.7 MIL 6.2
21.7.1959 11.5 75.3 IMD 4.7
27.7.1959 11.5 75.25 IMD 4.7
17.12.1859 11.6 78.1 – OLD 4.6
26/08/2005 11.61 76.18 CESS 2.5
22.09.1985 11.67 79.06 – GBA 4.2
17.12.1959 11.7 78.1 – GUB 4.9
8/11/03 11.72 75.55 CESS 3.2
2001 9 25 11.79 80.31 23 IMD 5.5
18.04.1979 11.8 78.3 – BRR 4.6
2001 9 25 11.83 80.44 33 IMD 4
12/01/03 11.83 75.65 33 CESS 2.6
20.01.1860 11.9 78.2 – OLD 4.2
17.01.1860 11.9 78.2 – OLD 4.6
04.03.1861 11.9 78.2 – OLD 4.6
25/09/01 11.95 80.23 10 IRIS 5.5
SEISMIC HAZARD ANALYSIS FOR THE BANGALORE REGION 267

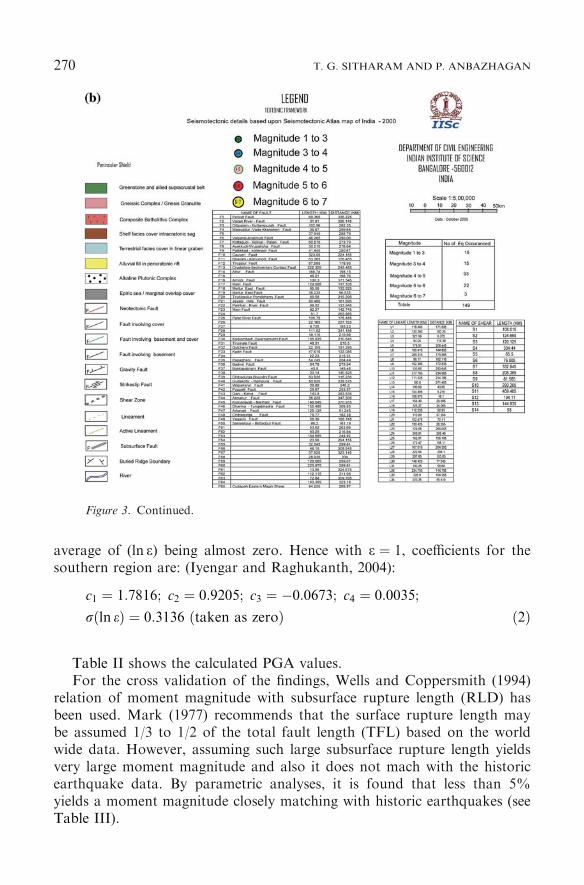
identified by Ganesha Raj and Nijagunappa (2004) are used for basemap creation over which earthquake moment magnitude with availablelatitude and longitudes are superposed. The seismotectonic map contains65 numbers of faults with length varying from 9.73 to 323.5 km, 34 lin-eaments and 14 shear zones. The map differentiates the different geologywith colour layers information. Faults, lineaments and shear zones aredifferentiated by colour layers and also earthquake magnitude variationsare shown in different diameters circle with colours. The numbers ofearthquake events collated are about 150 with minimum moment magni-tude of 1.0 and a maximum of 6.2. Seismotectonic map developed forBangalore region is shown in Figure 3a. Figure 3a shows clearly thatlarge number of earthquake events have occurred close to Bangalore andalso in southern part of Karnataka. The legend for Figure 3a is enclosedin Figure 3b.
3. Seismic Hazard Analysis
Seismic hazard analysis has been carried out using deterministic approach.Deterministic seismic hazard assessments seek to identify the maximumcredible earthquake (MCE) that will affect a site. The MCE is the largestearthquake that appears possible along a recognized fault under the pres-ently known or presumed tectonic activity (USCOLD, 1995). MCE assess-ment gives little consideration to the probability of future faultmovements. For the vulnerable earthquake source identification minimummoment magnitude considered was 3.5 and above. The number of earth-quake sources on which earthquake of greater than 3.5 moment magnitudehave occurred are 21 faults and lineaments (which are listed in Table II).Shortest distance from source to Bangalore city centre has been measuredfrom the seismotectonic map shown in Figure 3a and they are also listed inTable II. With these distance and moment magnitude Peak HorizontalAcceleration is calculated at bed rock level by assuming focal depth of theearthquake of about 15 km from the surface. This depth is also arrived atconsidering past events of earthquake. The PGA for the Bangalore hasbeen calculated using the attenuation relation developed for south India byIyengar and Raghukanth (2004). The attenuation relation used to calculatePGA is given below
ln y ¼ c1 þ c2 M� 6ð Þ þ c3 M� 6ð Þ2 � lnR� c4Rþ ln e ð1Þ
where y, M and R refer to PGA (g), moment magnitude and hypo centraldistance respectively. Since PGA is known to be distributed nearly as alognormal random variable ln y would be normally distributed with the
T. G. SITHARAM AND P. ANBAZHAGAN268

Figure 3. (a) Seismotectonic map for Bangalore region (b) Seismotectonic map legend
for Figure 3a.
SEISMIC HAZARD ANALYSIS FOR THE BANGALORE REGION 269
average of (ln e) being almost zero. Hence with e ¼ 1, coefficients for thesouthern region are: (Iyengar and Raghukanth, 2004):
c1 ¼ 1:7816; c2 ¼ 0:9205; c3 ¼ �0:0673; c4 ¼ 0:0035;
rðln eÞ ¼ 0:3136 ðtaken as zeroÞ ð2Þ
Table II shows the calculated PGA values.For the cross validation of the findings, Wells and Coppersmith (1994)
relation of moment magnitude with subsurface rupture length (RLD) hasbeen used. Mark (1977) recommends that the surface rupture length maybe assumed 1/3 to 1/2 of the total fault length (TFL) based on the worldwide data. However, assuming such large subsurface rupture length yieldsvery large moment magnitude and also it does not mach with the historicearthquake data. By parametric analyses, it is found that less than 5%yields a moment magnitude closely matching with historic earthquakes (seeTable III).
Figure 3. Continued.
T. G. SITHARAM AND P. ANBAZHAGAN270

The least PGA values from historic earthquake records and consideringRLD approach for the different sources are 0.001 and 0.002 g. The largePGA values for Bangalore city are caused from Mandya–Channapatna–Bangalore lineament from the adopted two methods are 0.146 and 0.159 g.In total, 3 sources have generated the higher PGA values close to Banga-lore city. (i) the Arkavati fault (F47 in Figure 4) which is 51.24 km awayfrom Bangalore and having the length of about 125 km with a PGA of0.025 g (0.047 g from RLD approach) due to an earthquake a momentmagnitude MW of 4.7. (ii) Chelur–Kolar–Battipalle Lineament (L20 in
Table II. Calculated peak horizontal accelerations at bed rock level based on historic
earthquakes.
Fault number and name Short
distanceto site km
Max.
magnitudeoccurred (Mw)
Hypocenter
distance(h=15)km
PGA in g
F3 Ottipalam–
Kuttampuzah Fault
282.35 3.7 282.75 0.001
F6 Valparai–Anaimudi Fault 290.06 4.5 290.45 0.002
F9 Pattikkad–Kollengol Fault 280.67 6.2 281.07 0.009
F10 Cauveri Fault 224.16 5.4 224.66 0.007
F13 Crystalline–Sedimentary
Contact Fault
243.48 5.3 243.94 0.005
F14 Attur Fault 198.15 4.5 198.72 0.003
F17 Main Fault1 137.1 4.6 137.92 0.006
F20 Tirukkavilur
Pondicherry Fault
219.4 5.7 219.91 0.009
F21 Javadi Hills Fault 161.9 4.7 162.59 0.006
F22 Pambar River Fault 123.94 4.6 124.84 0.007
F23 Main Fault2 142.74 4.9 143.53 0.008
F25 Palar River Fault 175.48 5 176.12 0.007
F28 241.1 3.5 241.57 0.001
F30 Karkambadi–
Swarnamukhi Fault
210.84 5 211.37 0.005
F36 Badvel Fault 275.94 4 276.35 0.001
F47 Arkavati Fault 51.24 4.7 53.39 0.025
F50 Sakleshpur–
Bettadpur Fault
181.19 4 181.81 0.002
F52 Bhavani fault 216.84 6.2 217.36 0.015
L15 Mandya–
Channapatna–Bangalore
5.215 5.1 15.88 0.146
L20 Chelur–Kolar–Battipalle 57.6 5.2 59.52 0.037
L24 Sorab–Narihalla 265.46 6 265.88 0.009
SEISMIC HAZARD ANALYSIS FOR THE BANGALORE REGION 271

Table
III.
Calculatedpeakhorizontalaccelerationsatbed
rock
level
basedonassumed
subsurface
rupture
length.
Faultnumber
andname
Hypocenter
Dist(h=
15)km
Maxmagnitude
occurred
(Mw)
RLD
(km)
Excepted
MW
PGA
(g)
BasedonRLD
RLD
(as%
)TFL
F3Ottipalam–KuttampuzahFault
282.748
3.7
3.846
5.168
0.003
<5%
F6Valparai–Anaim
udiFault
290.448
4.5
1.735
4.667
0.002
5%
F9Pattikkad–kollengolFault
281.071
6.2
17.261
6.114
0.009
55%
F10CauveriFault
224.661
5.4
12.114
5.891
0.011
<5%
F13Crystalline–Sedim
entary
Contact
Fault
243.942
5.3
8.337
5.655
0.007
<5%
F14AtturFault
198.717
4.5
6.253
5.474
0.009
<5%
F17Main
Fault1
137.918
4.6
4.841
5.313
0.014
<5%
F20TirukkavilurPondicherry
Fault
219.912
5.7
8.489
5.667
0.009
17%
F21JavadiHillsFault
162.593
4.7
3.394
5.089
0.008
<5%
F22PambarRiver
Fault
124.844
4.6
3.695
5.143
0.013
<5%
F23Main
Fault2
143.526
4.9
3.085
5.029
0.010
<5%
F25PalarRiver
Fault
176.120
55.091
5.345
0.010
<5%
F28
241.566
3.5
4.182
5.221
0.005
<5%
F30Karkambadi–SwarnamukhiFault
211.373
53.972
5.189
0.006
<5%
F36Badvel
Fault
276.347
42.053
4.773
0.002
<5%
F47ArkavatiFault
53.390
4.7
4.692
5.293
0.047
<5%
F50Sakleshpur–BettadpurFault
181.810
43.233
5.059
0.007
<5%
F52Bhavanifault
217.358
6.2
18.961
6.173
0.015
28%
L15Mandya–Channapatna-Bangalore
15.881
5.1
3.934
5.182
0.159
<5%
L20Chelur–Kolar-Battipalle
59.521
5.2
4.158
5.217
0.038
<5%
L24Sorab–Narihalla
265.883
614.917
6.022
0.009
8%
T. G. SITHARAM AND P. ANBAZHAGAN272

Figure 4) having a length of about 111 km, which is 57.6 km away fromBangalore causing a PGA value of 0.037 g(0.038 g from RLD approach)due to an earthquake of MW of 5.2. (iii) Mandya–Channapatna–Bangalorelineament (L15 in Figure 4) having a length of about 105 km which is5.2 km away from the Bangalore causing a PGA value of 0.146 g due toan earthquake with an MW of 5.1 occurred on 16th May 1972 (corre-sponds to a latitude of 12.4N and longitude of 77.0E) and also it matcheswith the predicted PGA value of 0.159 from assumed subsurface rupturelength for the same active source. The source, Mandya–Channapatna–Ban-galore-(L15) which triggered the highest PGA of about 0.150 is taken asvulnerable source and corresponding moment magnitude MW 5.1 is consid-ered as the maximum credible earthquake for the Bangalore region.
4. Synthetic Earthquake Data Generation
In regions lacking strong motion data, it is necessary to generate the syn-thetic earthquake data (strong motion). Seismological model by Boore
Figure 4. Vulnerable sources close to Bangalore.
SEISMIC HAZARD ANALYSIS FOR THE BANGALORE REGION 273

(1983) is used for generation of synthetic acceleration-time response (Atkin-son and Boore 1995; Hwang and Huo 1997). Iyengar and Raghukanth(2004) attenuation equation to the Peninsular India and suggested coeffi-cients for southern region have been used. Boore (1983, 2003) gives thedetails of estimating ground motion based on the Fourier amplitude spec-trum of acceleration at bedrock and this is expressed as:
A fð Þ ¼ C S fð Þ½ �D fð ÞP fð Þ ð3Þ
where, S(f ) is the source spectral function, D(f ) is the diminution functioncharacterizing the attenuation, and P(f ) is a filter to shape accelerationamplitudes beyond a high cut-off frequency fm, and C is a scaling factor.In the present study, the single corner frequency model has been used(Brune, 1970) which is given as:
S fð Þ ¼ 2pfð Þ2M0= 1þ f=fcð Þ½ � ð4Þ
where, fc is the corner frequency, M0 is the seismic moment, and, Dr is thestress drop are related through:
fc ¼ 4:9� 106VS Dr=M0ð Þ1=3 ð5Þ
Here, the shear wave velocity (VS) in the source region is taken as 4.2 km/s(Sarkar et al., 2001). The diminution function D(f ) is defined as
D fð Þ ¼ G exp �pfR=VSQ fð Þ½ � ð6Þ
In which, G refers to the geometric attenuation and the other term toan elastic attenuation. In this equation, Q(f) is the quality factor of theregion.
The high-cut filter in the seismological model is:
P f; fmð Þ ¼ 1þ f=fmð Þ8h i�1=2
ð7Þ
where fm controls the high frequency fall of the spectrum. The scaling fac-tor C is given by
C ¼ hRhuiffiffiffi2p
= 4pqVS3
� �ð8Þ
where ÆRh uæ is the radiation coefficient averaged over an appropriaterange of azimuths and take-off angles. The coefficient �2 in the aboveequation arises as the product of the free surface amplification and parti-tioning of energy in orthogonal directions. Following the work of Singhet al. (1999), the geometrical attenuation term G, for the Indian shieldregion, is taken to be equal to 1/R for R<100 km and equal to 1/(10�R)for R>100 km. For Southern Indian region, Rao et al. (1998) used
T. G. SITHARAM AND P. ANBAZHAGAN274

strong motion records of small magnitude earthquakes and estimated Qvalue to be 460f 0.83(after Iyengar and Raghukanth, 2004). The strongmotion data simulated for the moment magnitude of 5.1 and hypocentredistance of 15.88 km is shown in Figure 5. The obtained PGA value0.153 g from Boore’s model matches well with the PGA value of 0.146 gestimated from deterministic approach and 0.159 g from RLD approach.
-0.20
-0.15
-0.10
-0.05
0.00
0.05
0.10
0.15
29.5 31.5 33.5
Time(sec)
Acc
eler
atio
n(g
)
Figure 5. Simulated strong motion data for the moment magnitude of 5.1.
0.00
0.05
0.10
0.15
0.20
0.25
0.30
0.35
0.0 0.2 0.4 0.6 0.8 1.0 1.2 1.4 1.6 1.8 2.0Period (sec)
Sp
ectr
alA
ccel
erat
ion
(g)
Figure 6. Response spectra for an earthquake magnitude of 5.1 at rock level.
SEISMIC HAZARD ANALYSIS FOR THE BANGALORE REGION 275

Response acceleration spectra for the synthetic earthquake are shown inFigure 6, which clearly indicate that predominant period of the earth-quake 0.06 s and peak spectral acceleration of 0.332 g. Shape of thecurve also matches with the uniform hazard response spectra. The source,Mandya–Channapatna–Bangalore-(L15) which triggered the highest PGAis a vulnerable source for the Bangalore region. From available 900 bore-hole data and large number of shear wave velocity profile obtained usingMultichannel Analysis of Surface Wave (MASW) technique in the area,it is being planned to estimate the rock depth and also characterizationof overburden in the area. A 3D subsurface Geographical InformationSystem (GIS) model is being developed for the 220 sqkm area of Banga-lore city on scale of 1:20,000. Futher work is under progress to evaluatethe regional rock and surface PGA values and synthetic ground motionat different locations in the city. Also, 8 strong motion accelerographshave been installed at different locations in the city as part of the na-tional network.
5. Conclusions
Regional, geological and seismological investigations for Bangalore regionis carried out by considering faults, lineaments and shear zones existing ina radius of 350 km around Bangalore and past earthquake events in thearea. Seismotectonic map for the Bangalore region has been preparedalong with identification of vulnerable sources after superposing locationsof more than 150 past earthquake events triggered in the region. About 21numbers of faults and lineaments are identified as a vulnerable sources as afirst step. A deterministic seismic hazard analysis approach to determinePGA was adopted. The vulnerable source for Bangalore city is identified asMandya–Channapatna–Bangalore lineament with an earthquake momentmagnitude of 5.1. This combination has been estimated to develop a PGAof about 0.146 g at rock level at the city centre with assuming hypo centraldistance of 15.88 km from the focal point. The synthetic strong motiondata was simulated using seismological model of Boore (1983) by consider-ing regional seismological factors. The obtained high PGA value of 0.153 gfrom Boore’s model matches closely with estimated PGA value from deter-ministic approach. As part of this programme, 8 strong motion accelero-graphs have been installed in the city and being monitored continuously.Further work is being carried out to estimate the rock depth and charac-terization of the overburden in the area to prepare regional rock andground surface PGA mapping. Further it is planned to develop microzona-tion maps such as amplification, PGA at the ground surface and liquefac-tion susceptibility of the area.
T. G. SITHARAM AND P. ANBAZHAGAN276

Acknowledgements
Authors thank Seismology Division, Department of Science and Technol-ogy, Government of India for funding the project titled ‘‘Microzonationand geotechnical site characterization of greater Bangalore region (Ref no.DST/23(315)/SU/2002 Dated October 2003)’’.
References
Atkinson, G. M. and Boore, D. M.: 1995, Ground-motion relations for eastern NorthAmerica, Bull. Seismol. Soc. Am. 85(1), 17–30.
Bansal, B. K. and Gupta, S.: 1998, A glance through the seismicity of peninsular India,
J. Geol. Soc. India 52, 67–80.Boore, D. M.: 1983, Stochastic simulation of high-frequency ground motions based on
seismological models of the radiated spectra, Bull. Seism. Soc. Am. 73, 1865–1894.
Boore, D. M.: 2003, Simulation of ground motion using the stochastic method, Pure Appl.Geophys. 160, 635–675.
Brune, J.: 1970, Tectonic stress and the spectra of seismic shear waves from earthquakes,
J. Geophys. Res. 75, 4997–5009.Ganesha Raj, K. and Nijagunappa, R.: 2004, Major lineaments of Karnataka state and their
relation to seismicity: Remote sensing based analysis, J. Geol. Soc. India 63, 430–439.Hwang, H. and Huo, J.-R.: 1997, Attenuation relations of ground motion for rock and soil
sites in eastern United States, Soil Dynam. Earthquake Eng. 16, 363–372.Idriss I. M.: 1985, Evaluating seismic risk engineering practice, In: Proceedings of the 11th
International Conference on Soil Mechanics and Foundation Engineering, San Francisco,
Vol. 1, 255–320.IS 1893 (part 1): 2002, Criteria for Earthquake Resistant Design of Structure, Bureau of
Indian standards, New Delhi.
Iyengar, R. N. and Raghukanth, S. T. G.: 2004, Attenuation of strong ground motion inpeninsular India, Seismol. Res. Lett. 75(4), 530–540.
Kramer. S. L.: 1996, Geotechnical Earthquake Engineering. Published by Pearson Education
Pte Ltd.Krinitzsky, E.: 2005, Discussion on problems in the application of the SSHAC probability
method for assessing earthquake hazards at Swiss nuclear power plants, Eng. Geol. 78,285–307; Eng. Geol. 82, 66–68.
Mark, R. K.: 1977, Application of linear statistical model of earthquake magnitude versusfault length in estimating maximum expectable earthquakes, Geology 5, 464–466.
Project Vasundhara: 1994, Geo scientific Analysis, Database creation and Development of
GIS for parts of south Indian Peninsular Shield. ISSN O254–0436.O’Leary, D. W., Driedman, J. D. and Pohn, H. A.: 1976, Lineaments, linear, lineation: Some
proposed new standards for old terms, Geol. Soc. Am. Bull. 87, 1463–1469.
Radhakrishnan, B. P. and Vaidyanathan, R.: 1997, Geology of Karnataka, Geological Societyof India, Bangalore.
Ramalingeswara Rao, B. and Sitapathi Rao, P.: 1984, Historical seismicity of peninsularIndia, Bull. Seismol. Soc. Am. 74, 2519–2533.
Rao, R., Seshamma, C. V. and Mandal, P.: 1998, Estimation of Coda Qc and spectralcharacteristics of some moderate earthquakes of southern Indian peninsula, UnpublishedReport.
SEISMIC HAZARD ANALYSIS FOR THE BANGALORE REGION 277

Regulatory Guide 1.165: 1997, Identification and characterization of seismic sources and
determination of safe shutdown earthquake ground motion. Published by U.S. NuclearRegulatory Commission, March 1997.
Sarkar, D., Chandrakala, K., Padmavathi Devi, P., Sridhar, A. R., Sain, K. and Reddy, P. R.:
2001, Crustal velocity structure of western Dharwar Craton, South India, J. Geodynam. 31,227–241.
Seismotectonic Atlas of India: 2000, published by Geological Survey of India.Singh, S. K., Ordaz, M., Dattatrayam, R. S. and Gupta, H. K.: 1999, A Spectral analysis of
the 21 May 1997, Jabalpur, India, earthquake (Mw=5.8) and estimation of ground motionfrom future earthquakes in the Indian shield region, Bull. Seismol. Soc. Am. 89(6), 1620–1630.
USCOLD: 1995, Guidelines for Earthquake Design and Evaluation of Structures Appurte-nant to Dams, United States Committee on Large Dams. 75 p.
Valdiya, K. S.: 1998, Late quaternary movements and landscape rejuvenation in south-eastern
Karnataka and adjoining Tamil nadu in southern India shield, J. Geol. Soc. India 51,139–166.
Wang, Z.: 2005, Discussion on problems in the application of the SSHAC probability method
for assessing earthquake hazards at Swiss nuclear power plants, Eng. Geol. 78, 285–307;Eng. Geol. 82, 86–88.
Wells, D. L. and Coppersmith, K. J.: 1994, New empirical relationships among magnitude,rupture length, rupture width, rupture area, and surface displacement, Bull. Seismol. Soc.
Am. 4(84), 975–1002.
T. G. SITHARAM AND P. ANBAZHAGAN278