Seismic Fragility Test of a 6-Inch Diameter Pipe System
179
BBCP' NUREG/CR-4859 WIAR 2 5 ^987 Seismic Fragility Test of a 6-Inch Diameter Pipe System 9 Prepared by W. P. Chen, A. T. Onesto, V. DeVita Energy Technology Engineering Center Prepared for ^o'^rsS ""^"'""'^ DO NOT MICROFILM COVER DISTRIBUTION OF THIS QOCUMEJdT iS UNUMiTED
Transcript of Seismic Fragility Test of a 6-Inch Diameter Pipe System

BBCP' N U R E G / C R - 4 8 5 9
WIAR 2 5 ^987
Seismic Fragility Test of a 6-Inch Diameter Pipe System
9
Prepared by W. P. Chen, A. T. Onesto, V. DeVita
Energy Technology Engineering Center
Prepared for
^o'^rsS "" "'""' DO NOT MICROFILM COVER
DISTRIBUTION OF THIS QOCUMEJdT iS UNUMiTED
DISCLAIMER
This report was prepared as an account of work sponsored by an agency of the United States Government. Neither the United States Government nor any agency Thereof, nor any of their employees, makes any warranty, express or implied, or assumes any legal liability or responsibility for the accuracy, completeness, or usefulness of any information, apparatus, product, or process disclosed, or represents that its use would not infringe privately owned rights. Reference herein to any specific commercial product, process, or service by trade name, trademark, manufacturer, or otherwise does not necessarily constitute or imply its endorsement, recommendation, or favoring by the United States Government or any agency thereof. The views and opinions of authors expressed herein do not necessarily state or reflect those of the United States Government or any agency thereof.

DISCLAIMER Portions of this document may be illegible in electronic image products. Images are produced from the best available original document.
Do . . r iviiCw:=..-.i . COVER
NOTICE
This report was prepared as an account of work sponsored by an agency of the United States Government Neither the United States Government nor any agency thereof, or any of their employees, makes any warranty, expressed or implied, or assumes any legal liability of re sponsibility for any third party's use, or the results of such use, of any information, apparatus, product or process disclosed in this report, or represents that its use by such third party would not infringe privately owned rights
NOTICE
Availability of Reference Materials Cited in NRC Publications
Most documents cited in NRC publications wi l l be available from one of the following sources
1 The NRC Public Document Room, 1717 H Street, N W Washington, DC 20555
2 The Superintendent of Documents, U S Government Printing Office, Pobt Office Box 37082, Washington, DC 20013 7082
3 The National Technical Information Service, Springfield, VA 22161
Although the listing that follows represents the majority of documents cited in NRC publications It IS not intended to be exhaustive
Referenced documents available for inspection and copying for a fee from the NRC Public Docu ment Room include NRC correspondence and internal NRC memoranda, NRC Office of Inspection and Enforcement bulletins, circulars, information notices, inspection and investigation notices. Licensee Event Reports, vendor reports and correspondence, Commission papers, and applicant and licensee documents and correspondence
The fol lowing documents in the NUREG series are available for purchase from the GPO Sales Program formal NRC staff and contractor reports, NRC sponsored conference proceedings, and NRC booklets and brochures Also available are Regulatory Guides, NRC regulations in the Code of Federal Regulations, and Nuclear Regulatory Commission Issuances
Documents available from the National Technical Information Service include NUREG series reports and technical reports prepared by other federal agencies and reports prepared by the Atomic Energy Commission, forerunner agency to the Nuclear Regulatory Commission
Documents available from public and special technical libraries include all open literature items, such as books, journal and periodical articles, and transactions Federal Register notices, federal and state legislation and congressional reports can usually be obtained from these libraries
Documents such as theses, dissertations, foreign reports and translations, and non NRC conference proceedings are available for purchase from the organization sponsoring the publication cited
Single copies o) NRC draft reports are available free, to the extent of supply upon written retjuest to the Division of Technical Information and Document Control, U S Nuclear Requlatory Com mission Washington, DC 20555
Copies of industry codes and standards used in a substantive manner in the NRC regulatory process are maintained at the NRC Library, 7920 Norfolk Avenue, Bethesda, Maryland, and are available there for reference use by the public Codes and standards are usually copyrighted and may be purchased from the originating organization or, if they are American National Standards, from the American National Standards Institute, 1430 Broadway, New York, NY 10018
NUREG/CR-4859 RM, RD
Seismic Fragility Test of a 6-Inch Diameter Pipe System NUREG/CR—4859
TI87 900555
Manuscript Completed: January 1987 Date Published: February 1987
Prepared by W. P. Chen, A. T. Onesto, V. DeVita
Energy Technology Engineering Center P. 0 . Box 1449 Canoga Park, CA 91304
Prepared for Division of Engineering Safety Office of Nuclear Regulatory Research U.S. Nuclear Regulatory Commission Washington, DC 20555 NRC FIN B3052
MASTER DISTRlBUTlUh Uh 1h,6 oUUCmcNl tS liadMiTED

1 NOTICE
This report was prepared as an account of work sponsored by an agency of the United States Gpvernment Neither the United States Government nor any agency thereof, or any of their employees, makes any warranty, expressed or implied, or assumes any legal liability of re-spKjnsibility for any third party's use, or the results of such use, of any information, apparatus, product or process disclosed m this report, or represents that its use by such third party would not infringe privately owned rights.
NOTICE
Availability of Reference Materials Cited in NRC Publications
Most documents cited m NRC publications will be available from one of the following sources.
1. The NRC Public Document Room, 1717 H Street, N.W Washington, DC 20555
2. The Superintendent of Documents, U.S. Government Printing Oftice. Post Office Box 37082, Washington, DC 20013-7082
3. The National Technical Information Service, Springfield, VA 22161
Although the listing that follows represents the majority of documents cited in NRC publications, it is not intended to be exhaustive.
Referenced documents available for inspection and copying for a fee from the NRC Public Docu ment Room include NRC correspondence arxj internal NRC memoranda; NRC Office of Inspection and Enforcement bulletins, circulars, information notices, inspection and investigation notices; Licensee Event Refxjrts; vendor reports and correspondence; Commission papers; and applicant and licensee documents and correspKjndence.
The following documents in the NUREG series are available for purchase from the GPO Sales Program: formal NRC staff and contractor reports, NRC-sponsored conference proceedings, aruj NRC booklets and brochures. Also available are Regulatory Guides, NRC regulations in the Code of Federal Regulations, and Nuclear Regulatory Commission Issuamxs.
Documents available from the National Technical Information Service include NUREG series reports and technical reports prepared by other federal agencies and reports prepared by the Atomic Energy Commission, forerunner agency to the Nuclear Regulatory Commission.
Documents available from public and special technical libraries include all open literature items, such as books, journal and periodical articles, and transactions. Federal Register notices, federal and state legislation, and congressional reports can usually be obtained from these libraries.
Documents such as theses, dissertations, foreign reports and translations, and non-NRC conference proceedings are available for purchase from the organization sponsoring the publication cited
Single copies of NRC draft reports are available free, to the extent of supply, upon written request to the Division of Technical Information and Document Control, U.S. Nuclear Regulatory Com mission, Washington, DC 20555.
Copies of industry codes and standards used in a substantive manner in the NRC regulatory process are maintained at the NRC Library, 7920 Norfolk Avenue, Bethesda, Maryland, and are available there for reference use by the public. Codes and standards are usually copyrighted and may be purchased from the originating organization or, if they are American National Standards, from the American National Standards Institute, 1430 Broadway, New York, NY 10018.
ABSTRACT
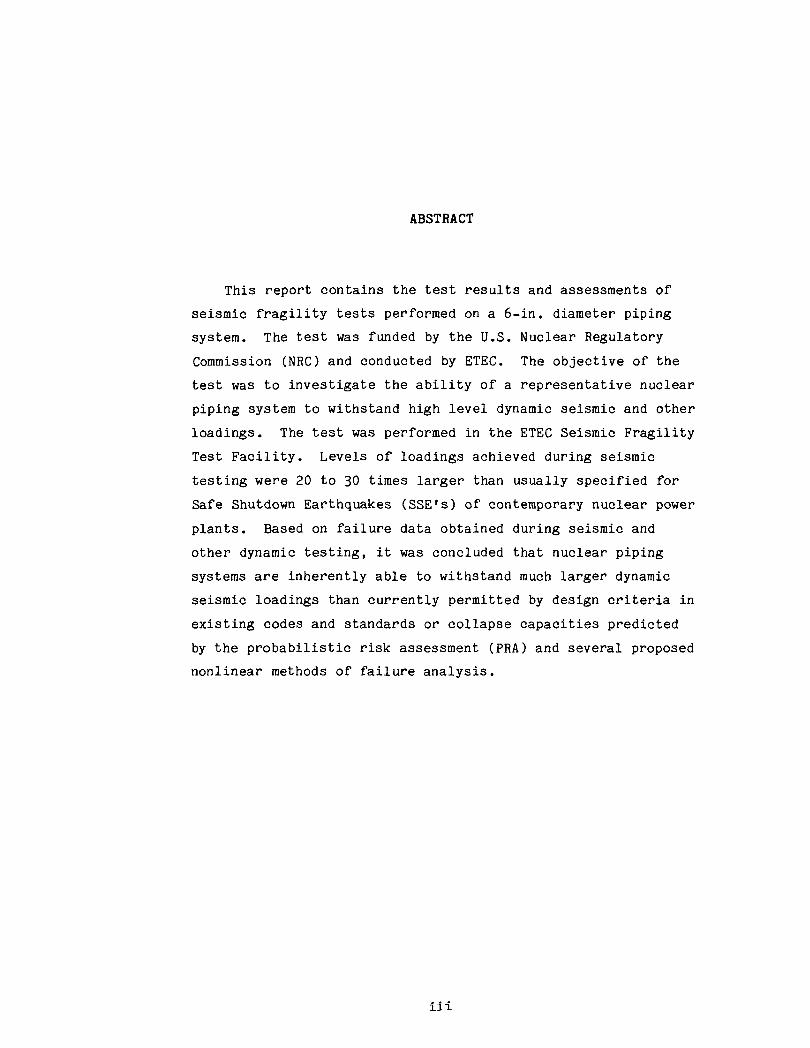
This report contains the test results and assessments of
seismic fragility tests performed on a 6-in. diameter piping
system. The test was funded by the U.S. Nuclear Regulatory
Commission (NRC) and conducted by ETEC. The objective of the
test was to investigate the ability of a representative nuclear
piping system to withstand high level dynamic seismic and other
loadings. The test was performed in the ETEC Seismic Fragility
Test Facility. Levels of loadings achieved during seismic
testing were 20 to 30 times larger than usually specified for
Safe Shutdown Earthquakes (SSE's) of contemporary nuclear power
plants. Based on failure data obtained during seismic and
other dynamic testing, it was concluded that nuclear piping
systems are inherently able to withstand much larger dynamic
seismic loadings than currently permitted by design criteria in
existing codes and standards or collapse capacities predicted
by the probabilistic risk assessment (PRA) and several proposed
nonlinear methods of failure analysis.
ill

williamsonc
Text Box
Blank Page

TABLE OF CONTENTS
Page
Abstract ill
Acknowledgement Ix
Executive Summary xl
1.0 Introduction 1-1
2.0 Test Description 2-1
2.1 Test Article Description 2-1
2.2 Test Article Installation 2-6
2.3 Test Article Instrumentation 2-7
2.4 Test Input Motions 2-11
2.5 Test Observations 2-21
3.0 Test Results 3-1
3.1 Characterization of Dynamic Response 3-1
3.1.1 Acceleration Response 3-1
3.1.2 Amplification Ratio 3-3
3.1.3 Strains and Strain Ranges 3-3
3.1.4 Strain Ratchetting 3-9
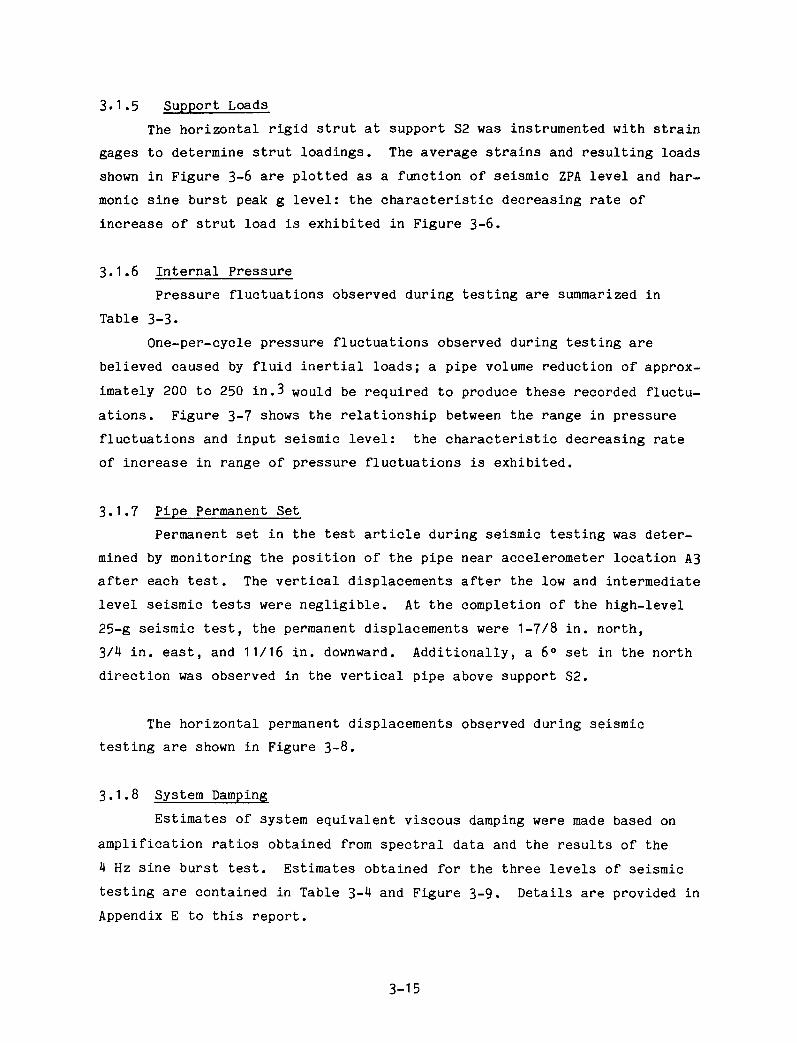
3.1.5 Support Loads 3-15
3.1.6 Internal Pressure 3-15
3.1.7 Pipe Permanent Set 3-15
3.1.8 System Damping 3-15
3.2 Failure Predictions 3-21
3.3 Post-Test Examinations 3-23
3.3.1 General Examination - Excluding Failure Zone 3-23
3.3.2 Examination of Failure Zone 3-23
4.0 Conclusions and Recommendations 4-1
4.1 Conclusions 4-1
4.2 Observations and Recommendations 4-3
References 5-1
V
TABLE OF CONTENTS
Page
Appendix A - Facility Description A-1
Appendix B - Test-Article-Related Hardware Drawings B-1
Appendix C - Calculation of Seismic Motion from Given Response
Spectrum C-1
Appendix D - Test Data Plots D-1
Appendix E - Estimate of System Damping E-1
Appendix F - Strain Ratchetting During Test F-1
Appendix G - Welding Procurement Specification G-1
TABLES
2-1. Physical Description of Test Article Pipe and Components. . 2-4
2-2. Material Properties for Test Article Pipe and Components. . 2-5
2-3. Planned Test Article Base Input Motions 2-13
3-1. Maximum and Minimum Microstrains in Test Article 3-5
3-2. Incremental Residual Microstrains During Testing 3-7
3-3. Internal Pressure Variations During Testing 3-16
3-4. Estimated System Equivalent Viscous Damping 3-19
3-5. Conservativeness of Pretest Failure Predictions 3-22
3-5. Post-Test Measurements 3-24
3-7. Post-Test Elbow Measurements 3-25
3-8. Post-Test Diameter and Wall Thickness Data 3-30
FIGURES
2-1. Test Article Configuration 2-2
2-2. Simulated Valve Assembly 2-3
2-3. Test Article Installation 2-8
2-4. Test Article Instrumentation - Strain Gage Locations. . . . 2-9
2-5. Test Article Instrumentation - Accelerometer Locations. . . 2-10
2-6. Block Diagram: Signal Flow from Sensors to DDAS 2-12
vi
TABLE OF CONTENTS
Page
FIGURES (Continued)
2-7. Required Acceleration - Time History 2-14
2-8. Required Response Spectrum 2-15
2-9. Planned Sine Burst Tests 2-17
2-10. Actual Sine Burst Tests 2-18
2-11. Comparison of Required and Programmed Input Response
Spectra for Intermediate Level Seismic Test 2-19
2-12. Comparison of Programmed and Measured Response Spectra for
Intermediate Level Seismic Test 2-20
2-13. Typical Pressure Drop 2-22
2-14. Circumferential Bulge Near Support SI Following High Level
Seismic Test 2-23
2-15. Failure of the Test Article (NW View) 2-25
2-16. Failure of the Test Article (SE View) 2-26
2-17. Test Article Following Failure During 5 Hz Sine Burst Test. 2-27
2-18. Failure of the Horizontal Rigid Strut 2-28
3-1. Test Article Acceleration Due to Seismic Input 3-2
3-2. Amplification Ratio 3-4
3-3. Strain Range at Gage Location G1 3-10
3-4. Strain Range Definition 3-11
3-5. Circumferential/Longitudinal Strain Ratchet at Failure
Location 3-12
3-6. Horizontal Strut Loads 3-14
3-7. Range of Internal Pressure Fluctuations 3-17
3-8. Test Article Set During Seismic Testing 3-18
3-9. Estimated System Damping 3-20
3-10. Fracture Surface 3-27
3-11. Growth in Pipe Outside Diameter at Failure Section 3-28
3-12. Photomicrograph of Single Slant Fracture Edge (SOX) . . . . 3-29
3-13. Wall Thickness Measurements Near Fracture 3-32
3-14. SEM Photograph of Fracture Surface (425X) 3-33
3-15. SEM Photograph of Fracture Surface Exhibiting Deformed
Structure 3-34
vii

williamsonc
Text Box
Blank Page

ACKNOWLEDGEMENT
The authors wish to express their thanks to the many who
contributed to the realization of the test program. In par
ticular, the assistance of J. R. Prevost, D. Wait, and R. M.
Jassak of ETEC Engineering Department and the operating crews
of the ETEC Seismic Fragility Test Facility are gratefully
acknowledged.
Our thanks to Mr. D. Guzy of the U.S. NRC-RES for his
support of the test program is also acknowledged.
ix

williamsonc
Text Box
Blank Page
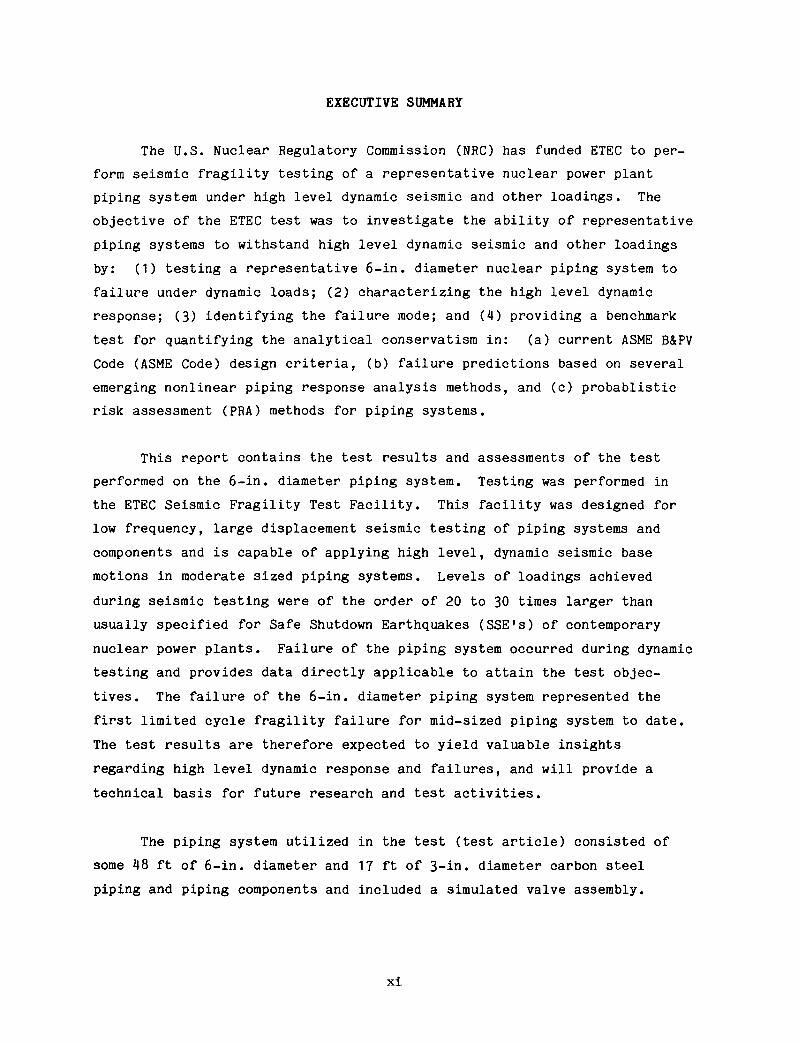
EXECUTIVE SUMMARY
The U.S. Nuclear Regulatory Commission (NRC) has funded ETEC to per
form seismic fragility testing of a representative nuclear power plant
piping system under high level dynamic seismic and other loadings. The
objective of the ETEC test was to investigate the ability of representative
piping systems to withstand high level dynamic seismic and other loadings
by: (1) testing a representative 6-in. diameter nuclear piping system to
failure under dynamic loads; (2) characterizing the high level dynamic
response; (3) identifying the failure mode; and (4) providing a benchmark
test for quantifying the analytical conservatism in: (a) current ASME B&PV
Code (ASME Code) design criteria, (b) failure predictions based on several
emerging nonlinear piping response analysis methods, and (c) probablistic
risk assessment (PRA) methods for piping systems.
This report contains the test results and assessments of the test
performed on the 6-in. diameter piping system. Testing was performed in
the ETEC Seismic Fragility Test Facility. This facility was designed for
low frequency, large displacement seismic testing of piping systems and
components and is capable of applying high level, dynamic seismic base
motions in moderate sized piping systems. Levels of loadings achieved
during seismic testing were of the order of 20 to 30 times larger than
usually specified for Safe Shutdown Earthquakes (SSE's) of contemporary
nuclear power plants. Failure of the piping system occurred during dynamic
testing and provides data directly applicable to attain the test objec
tives. The failure of the 6-in. diameter piping system represented the
first limited cycle fragility failure for mid-sized piping system to date.
The test results are therefore expected to yield valuable insights
regarding high level dynamic response and failures, and will provide a
technical basis for future research and test activities.
The piping system utilized in the test (test article) consisted of
some 48 ft of 6-in. diameter and 17 ft of 3-in. diameter carbon steel
piping and piping components and included a simulated valve assembly.
xi
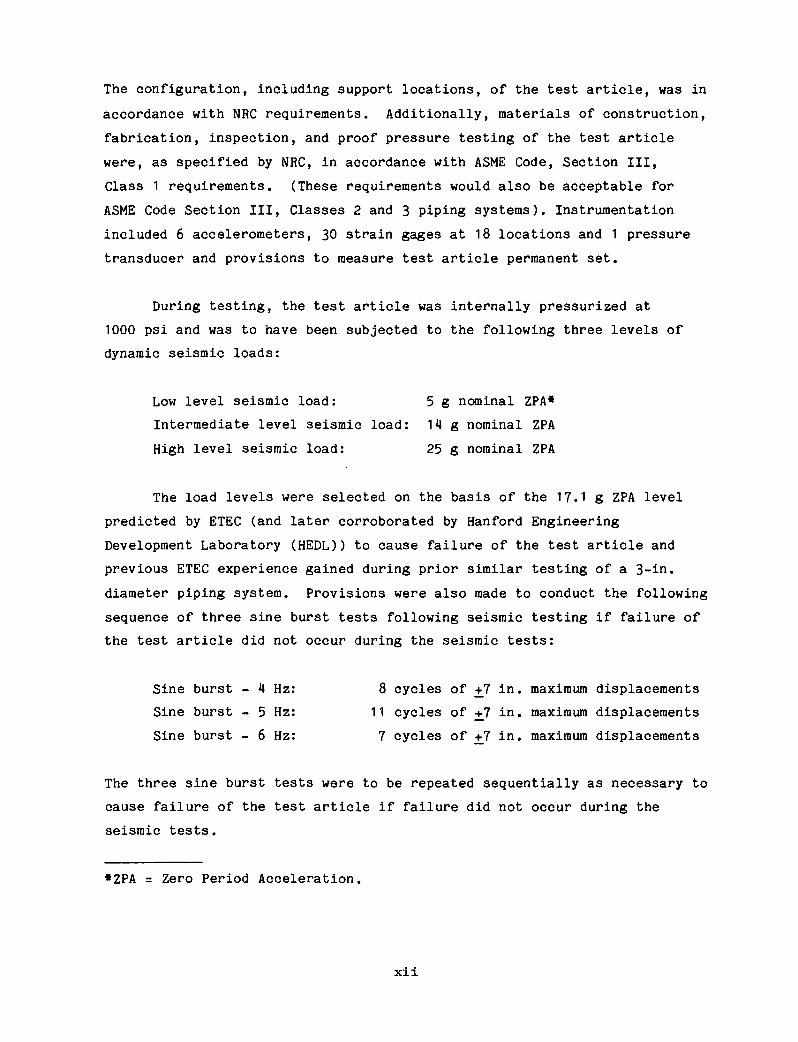
The configuration, including support locations, of the test article, was in
accordance with NRC requirements. Additionally, materials of construction,
fabrication, inspection, and proof pressure testing of the test article
were, as specified by NRC, in accordance with ASME Code, Section III,
Class 1 requirements. (These requirements would also be acceptable for
ASME Code Section III, Classes 2 and 3 piping systems). Instrumentation
included 6 accelerometers, 30 strain gages at 18 locations and 1 pressure
transducer and provisions to measure test article permanent set.
During testing, the test article was internally pressurized at
1000 psi and was to have been subjected to the following three levels of
dynamic seismic loads:
Low level seismic load: 5 g nominal ZPA*
Intermediate level seismic load: 14 g nominal ZPA
High level seismic load: 25 g nominal ZPA
The load levels were selected on the basis of the 17.1 g ZPA level
predicted by ETEC (and later corroborated by Hanford Engineering
Development Laboratory (HEDL)) to cause failure of the test article and
previous ETEC experience gained during prior similar testing of a 3-in.
diameter piping system. Provisions were also made to conduct the following
sequence of three sine burst tests following seismic testing if failure of
the test article did not occur during the seismic tests:
Sine burst - 4 Hz: 8 cycles of +7 in. maximum displacements
Sine burst - 5 Hz: 11 cycles of +7 in. maximum displacements
Sine burst - 6 Hz: 7 cycles of +7 in. maximum displacements
The three sine burst tests were to be repeated sequentially as necessary to
cause failure of the test article if failure did not occur during the
seismic tests.
*ZPA = Zero Period Acceleration.
xii
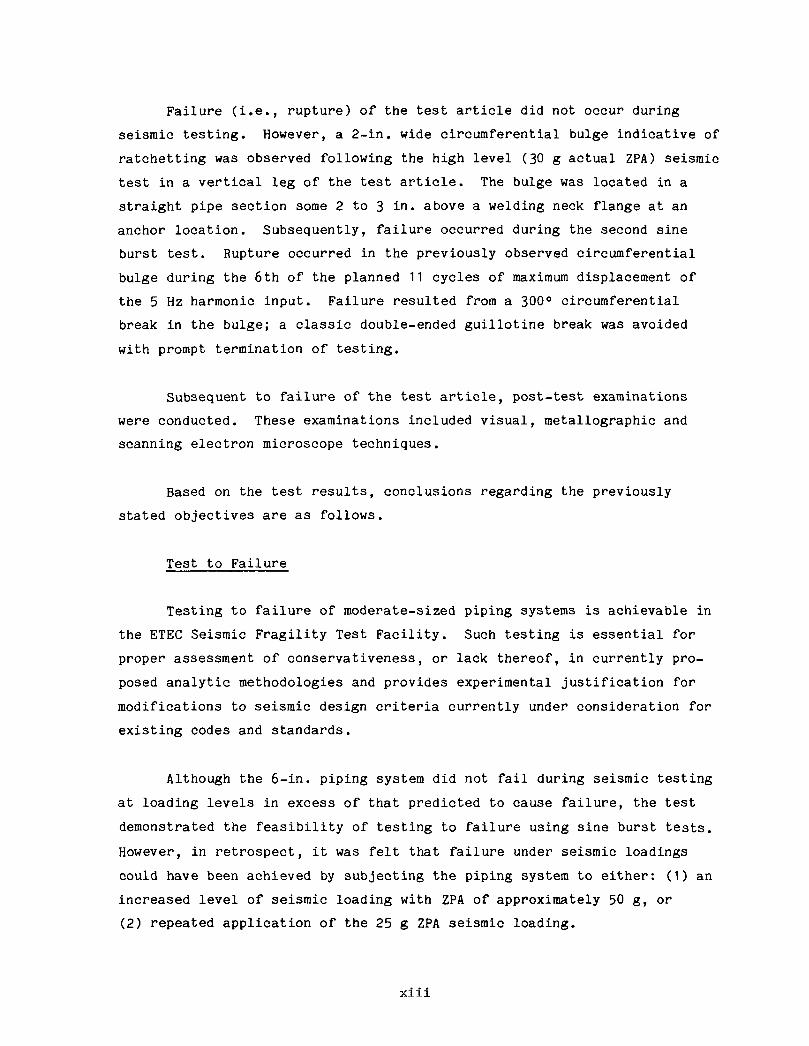
Failure (i.e., rupture) of the test article did not occur during
seismic testing. However, a 2-in. wide circumferential bulge indicative of
ratchetting was observed following the high level (30 g actual ZPA) seismic
test in a vertical leg of the test article. The bulge was located in a
straight pipe section some 2 to 3 in. above a welding neck flange at an
anchor location. Subsequently, failure occurred during the second sine
burst test. Rupture occurred in the previously observed circumferential
bulge during the 6th of the planned 11 cycles of maximum displacement of
the 5 Hz harmonic input. Failure resulted from a 300° circumferential
break in the bulge; a classic double-ended guillotine break was avoided
with prompt termination of testing.
Subsequent to failure of the test article, post-test examinations
were conducted. These examinations included visual, metallographic and
scanning electron microscope techniques.
Based on the test results, conclusions regarding the previously
stated objectives are as follows.
Test to Failure
Testing to failure of moderate-sized piping systems is achievable in
the ETEC Seismic Fragility Test Facility. Such testing is essential for
proper assessment of conservativeness, or lack thereof, in currently pro
posed analytic methodologies and provides experimental justification for
modifications to seismic design criteria currently under consideration for
existing codes and standards.
Although the 6-in. piping system did not fail during seismic testing
at loading levels in excess of that predicted to cause failure, the test
demonstrated the feasibility of testing to failure using sine burst tests.
However, in retrospect, it was felt that failure under seismic loadings
could have been achieved by subjecting the piping system to either: (1) an
increased level of seismic loading with ZPA of approximately 50 g, or
(2) repeated application of the 25 g ZPA seismic loading.
xili
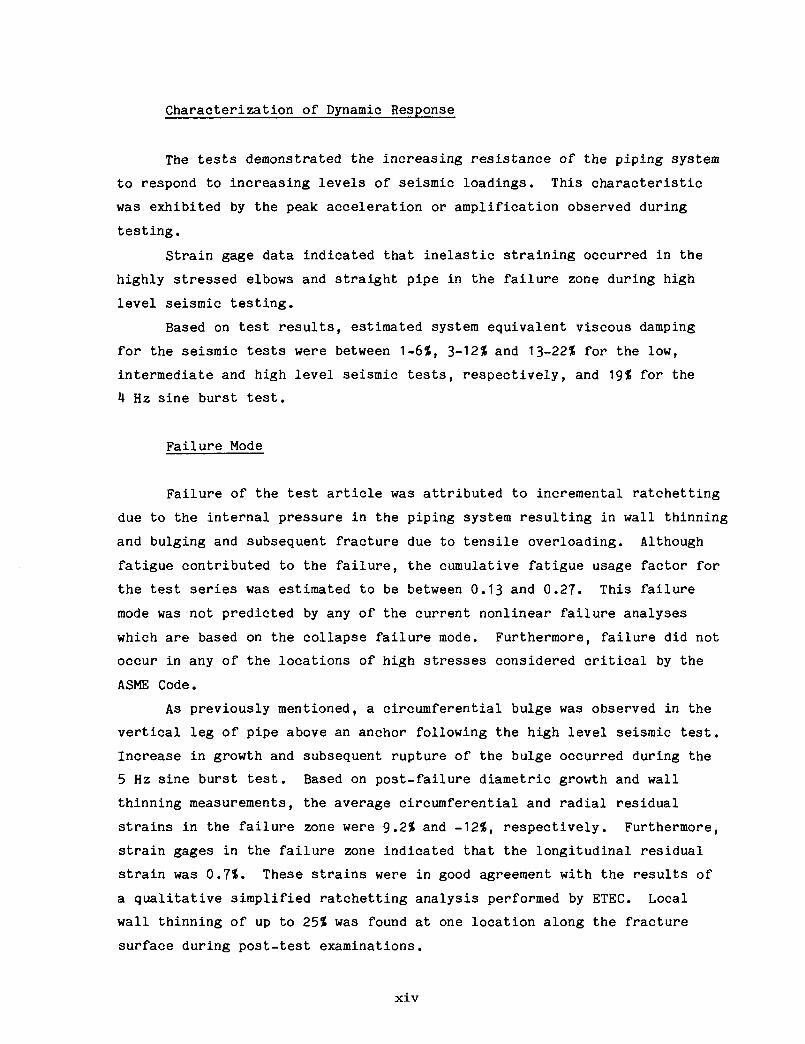
Characterization of Dynamic Response
The tests demonstrated the increasing resistance of the piping system
to respond to increasing levels of seismic loadings. This characteristic
was exhibited by the peak acceleration or amplification observed during
testing.
Strain gage data indicated that inelastic straining occurred in the
highly stressed elbows and straight pipe in the failure zone during high
level seismic testing.
Based on test results, estimated system equivalent viscous damping
for the seismic tests were between 1-6t, 3-12t and 13-22$ for the low,
intermediate and high level seismic tests, respectively, and ^9% for the
4 Hz sine burst test.
Failure Mode
Failure of the test article was attributed to incremental ratchetting
due to the internal pressure in the piping system resulting in wall thinning
and bulging and subsequent fracture due to tensile overloading. Although
fatigue contributed to the failure, the cumulative fatigue usage factor for
the test series was estimated to be between 0.13 and 0.27. This failure
mode was not predicted by any of the current nonlinear failure analyses
which are based on the collapse failure mode. Furthermore, failure did not
occur in any of the locations of high stresses considered critical by the
ASME Code.
As previously mentioned, a circumferential bulge was observed in the
vertical leg of pipe above an anchor following the high level seismic test.
Increase in growth and subsequent rupture of the bulge occurred during the
5 Hz sine burst test. Based on post-failure diametric growth and wall
thinning measurements, the average circumferential and radial residual
strains in the failure zone were 9.256 and -12$, respectively. Furthermore,
strain gages in the failure zone indicated that the longitudinal residual
strain was 0.7$. These strains were in good agreement with the results of
a qualitative simplified ratchetting analysis performed by ETEC. Local
wall thinning of up to 25$ was found at one location along the fracture
surface during post-test examinations.
xiv
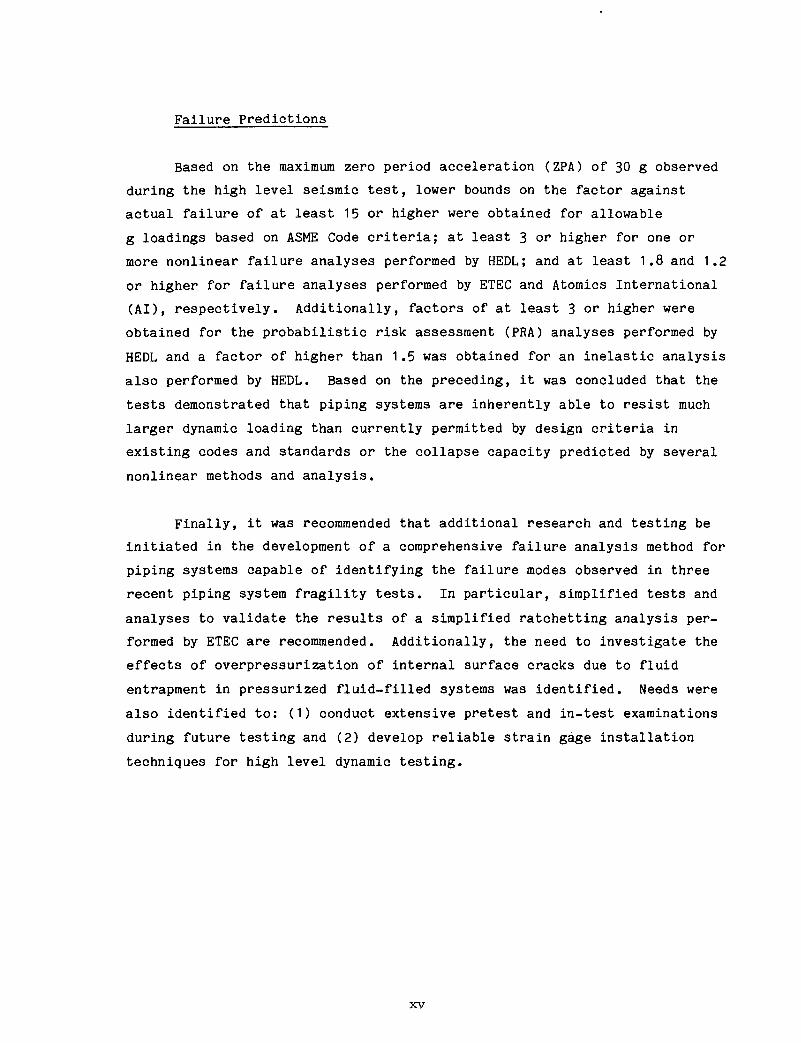
Failure Predictions
Based on the maximum zero period acceleration (ZPA) of 30 g observed
during the high level seismic test, lower bounds on the factor against
actual failure of at least 15 or higher were obtained for allowable
g loadings based on ASME Code criteria; at least 3 or higher for one or
more nonlinear failure analyses performed by HEDL; and at least 1.8 and 1.2
or higher for failure analyses performed by ETEC and Atomics International
(AI), respectively. Additionally, factors of at least 3 or higher were
obtained for the probabilistic risk assessment (PRA) analyses performed by
HEDL and a factor of higher than 1.5 was obtained for an inelastic analysis
also performed by HEDL. Based on the preceding, it was concluded that the
tests demonstrated that piping systems are inherently able to resist much
larger dynamic loading than currently permitted by design criteria in
existing codes and standards or the collapse capacity predicted by several
nonlinear methods and analysis.
Finally, it was recommended that additional research and testing be
initiated in the development of a comprehensive failure analysis method for
piping systems capable of identifying the failure modes observed in three
recent piping system fragility tests. In particular, simplified tests and
analyses to validate the results of a simplified ratchetting analysis per
formed by ETEC are recommended. Additionally, the need to investigate the
effects of overpressurization of internal surface cracks due to fluid
entrapment in pressurized fluid-filled systems was identified. Needs were
also identified to: (1) conduct extensive pretest and in-test examinations
during future testing and (2) develop reliable strain gage installation
techniques for high level dynamic testing.
XV
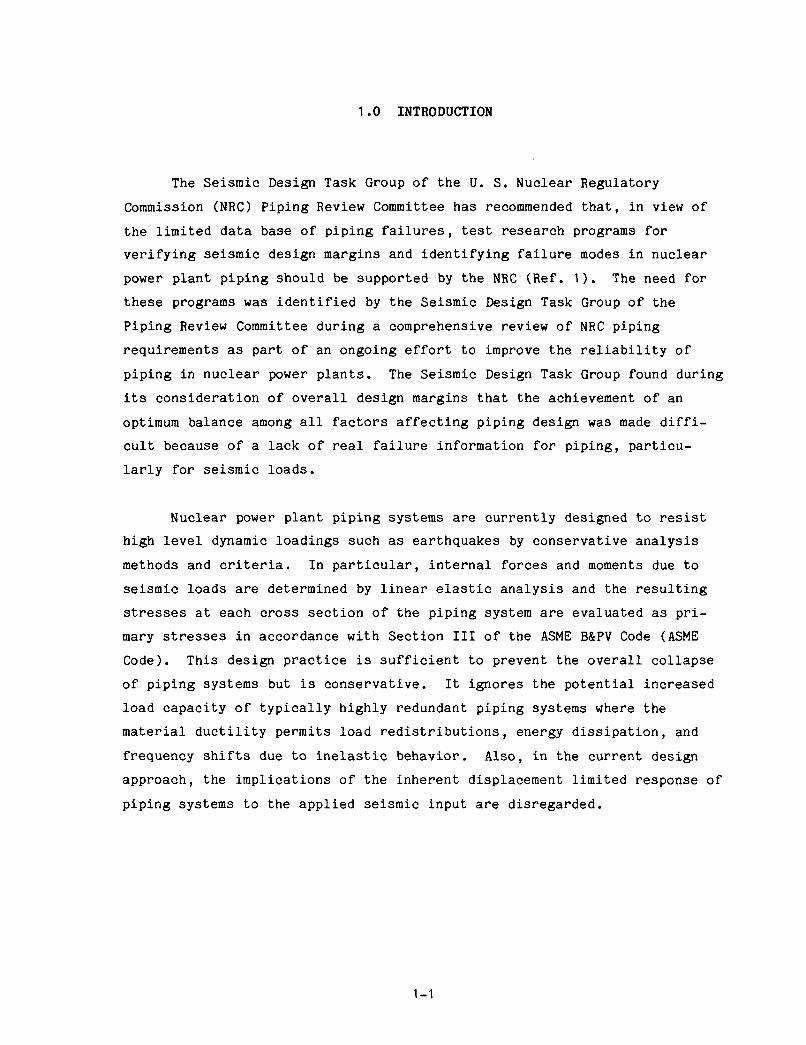
1.0 INTRODUCTION
The Seismic Design Task Group of the U. S. Nuclear Regulatory
Commission (NRC) Piping Review Committee has recommended that, in view of
the limited data base of piping failures, test research programs for
verifying seismic design margins and identifying failure modes in nuclear
power plant piping should be supported by the NRC (Ref. 1). The need for
these programs was identified by the Seismic Design Task Group of the
Piping Review Committee during a comprehensive review of NRC piping
requirements as part of an ongoing effort to improve the reliability of
piping in nuclear power plants. The Seismic Design Task Group found during
its consideration of overall design margins that the achievement of an
optimum balance among all factors affecting piping design was made diffi
cult because of a lack of real failure information for piping, particu
larly for seismic loads.
Nuclear power plant piping systems are currently designed to resist
high level dynamic loadings such as earthquakes by conservative analysis
methods and criteria. In particular, internal forces and moments due to
seismic loads are determined by linear elastic analysis and the resulting
stresses at each cross section of the piping system are evaluated as pri
mary stresses in accordance with Section III of the ASME B&PV Code (ASME
Code). This design practice is sufficient to prevent the overall collapse
of piping systems but is conservative. It ignores the potential increased
load capacity of typically highly redundant piping systems where the
material ductility permits load redistributions, energy dissipation, and
frequency shifts due to inelastic behavior. Also, in the current design
approach, the implications of the inherent displacement limited response of
piping systems to the applied seismic input are disregarded.
1-1
The NRC has funded ETEC to perform seismic fragility tests on a
representative 6-in. diameter nuclear power plant piping system under high
level dynamic seismic and other loadings. The objective of the ETEC tests
was to investigate the ability of the piping system to withstand high level
dynamic seismic and other loadings by: (1) testing the piping system to
failure under dynamic loads; (2) characterizing the high level dynamic
response; (3) identifying the failure mode; and (4) providing a benchmark
test for quantifying the analytical conservatism .in: (a) current design
criteria, (b) failure predictions based on several emerging nonlinear
piping response analysis methods, and (c) probabilistic risk assessment
(PRA) methods for piping systems.
This report contains the test results and assessments of the test
performed on the 6-in. diameter piping system. Testing was performed in
the ETEC Seismic Fragility Test Facility. Failure of the piping system
occurred during dynamic testing and provides data directly applicable to
attain the test objectives. The failure of the 6-in. diameter piping system
represented the first limited cycle fragility failure for mid-sized piping
to date. The test results are therefore expected to yield valuable
insights regarding high level dynamic response and failures, and will pro
vide a technical basis for future research and test activities.
1-2
2.0 TEST DESCRIPTION
The test described in this report was conducted in the ETEC Seismic
Fragility Test Facility. This facility was designed for low frequency,
large displacement seismic testing of piping systems and components. The
facility is capable of applying high level, dynamic seismic base motions in
moderate sized piping systems. Achievable levels of seismic loadings are
of the order of 20 to 30 times larger than usually specified for Safe
Shutdown Earthquakes (SSE's) of contemporary nuclear power plants.
Additionally, non-colinear base motions with differing time-displacement
signatures can be applied at the supports of piping systems during any
single test. Further details of the Seismic Fragility Test Facility are
provided in Appendix A to this report.
2.1 Test Article Description
The configuration including support locations of the piping system
utilized in the test (test article) was as shown in Figure 2-1 and was in
accordance with NRC requirements. In Figure 2-2, El through E9 identify
elbow locations and SI through S3 and S5 identify anchor and intermediate
support locations. The test article consisted of some 48 ft of 6-in.
diameter and 17 ft of 3-in. diameter carbon steel piping and piping com
ponents, and included a simulated valve assembly (Figure 2-2) which had
been utilized in previous dynamic seismic testing of related piping systems
sponsored by the NRC and the Electric Power Research Institute (EPRI)
(Ref. 2). Details pertaining to the pipe and components are provided in
Table 2-1 and material properties in Table 2-2.
The test article was fabricated from materials procured in accordance
with the requirements of American Society of Testing Materials (ASTM)
materials specifications which were identical to the corresponding ASME
Code, Section II material specifications. Fabrication, including welding
and inspection, were in accordance with ASME Code, Section III, Class 1
requirements. These requirements were also acceptable for ASME Code
Section III, Classes 2 and 3 fabrication.
2-1

Figure 2-1. Test Article Configuration
4 ft 0 m
PIPE MATERIAL ASTM A-106 GRADE B
NORTH
SIMULATED VALVE ASSEMBLY
ABL-5R1
2-2
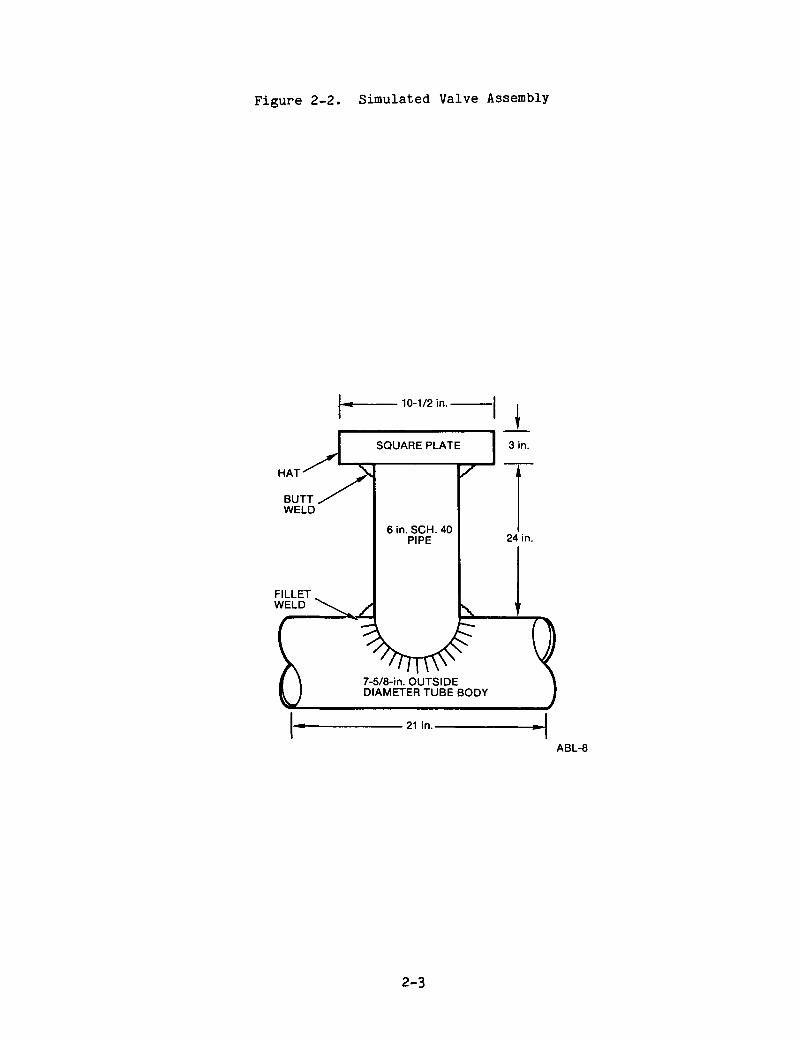
Figure 2-2. Simulated Valve Assembly
HAT
21 In.-
ABL-8
2-3

Table 2-1. Physical Description of Test Article Pipe and Components
Item Description
6-in. Schedule 40 pipe 6.625-in. nominal OD*
0.280-in. nominal WT»»
6.626-in. - 6.600-in. actual OD
0.285-in. - 0.310-in. actual WT
3-in. Schedule 40 pipe 3.500-in. nominal OD
0.216-in. nominal WT
3.505-in. - 3.517-in, actual OD
0.235-in. - 0.255-in. actual WT
6-in. Schedule 40
90° long radius elbow
Per ANSI B16.9
3-in. Schedule 40
90° long radius elbow
Per ANSI B16.9
6-in. x 3-in. Schedule 40
reducing tee
Per ANSI B16.9
Welding neck, raised face,
bored Schedule 40 flanges
Class 600-lb flanges
Per ANSI B16.5
*0D = outside diameter
»*WT = wall thickness
2-4
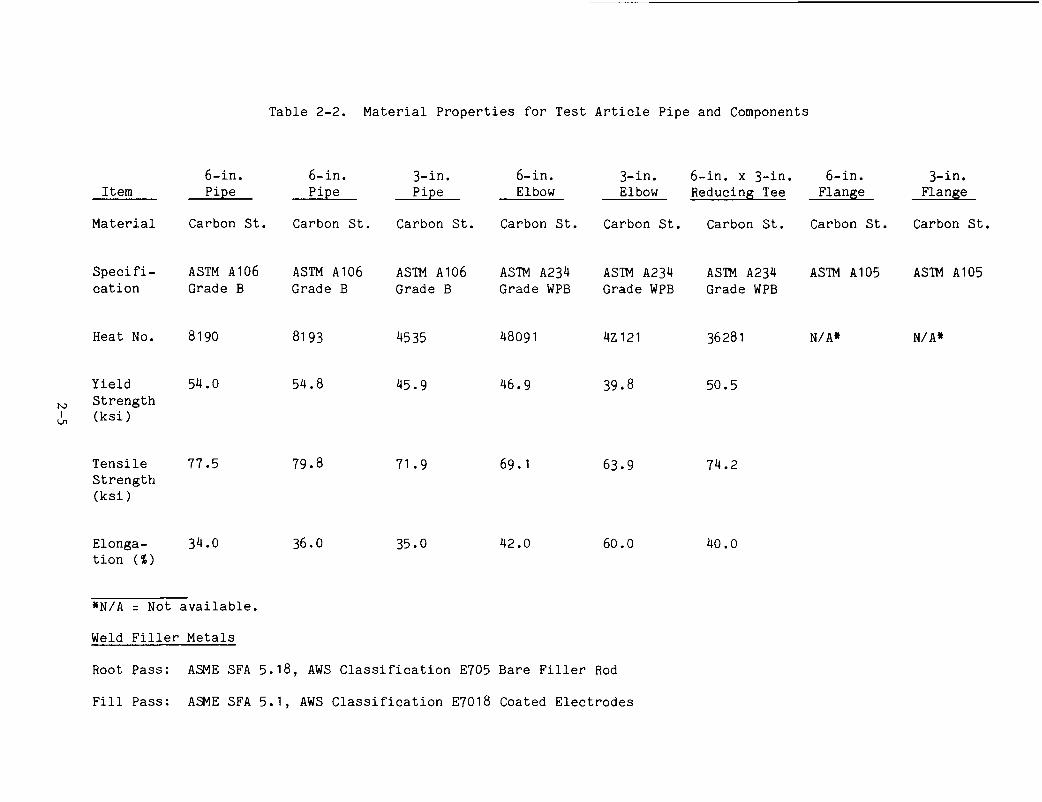
Table 2-2. Material Properties for Test Article Pipe and Components
N3 I
Item
Material
Specification
Heat No.
Yield
6-in. Pipe
Carbon St.
ASTM A106 Grade B
8190
54.0
6-in. Pipe
Carbon St.
ASTM A106 Grade B
8193
54.8
3-in. Pipe
Carbon St.
ASTM A106 Grade B
4535
45.9
6-in. Elbow
Carbon St.
ASTM A234 Grade WPB
48091
46.9
3-in. Elbow
Carbon St.
ASTM A234 Grade WPB
4Z121
39.8
6-in. x 3-in, Reducing Tee
Carbon St.
ASTM A234 Grade WPB
36281
50.5
6-in. Flange
Carbon St.
ASm A105
N/A»
3-in. Flange
Carbon St
ASIM A105
N/A*
Strength (ksi)
Tensile Strength (ksi)
77.5 79.8 71.9 69.1 63.9 74.2
Elonga- 34.0 tion ($)
36.0 35.0 42.0 60.0 40.0
*N/A = Not available.
Weld Filler Metals
Root Pass: ASME SFA 5.18, AWS Classification E705 Bare Filler Rod
Fill Pass: ASME SFA 5.1, AWS Classification E7018 Coated Electrodes
The qualified weld procedure specification used to assemble the 6-in.
piping system was TMA-2-1. This procedure employs the manual gas tungsten-
arc welding process using E705 filler rod for the root pass and manual
shielded metal-arc welding using E7018 low hydrogen, coated electrodes for
fill passes (see Appendix G).
Prior to testing, the test article was hydraulically proof tested in
accordance with ASME Code Section III requirements. The liquid utilized
for the proof pressure test was an oil selected for convenience to be
compatible with the oil used in the ETEC facility shaker table bearings;
compatibility of the oils was desirable since mixing was expected to occur
following rupture of the test article.
Subsequent to proof pressure testing, the oil filled test article
was internally pressurized to 1000 psi. Provisions were made to entrap
approximately 800 in.3 (approximately 4$ of the total volume) of air and
gas during pressurization. This pressurized condition was maintained
during dynamic testing and was selected as a means of reducing potential
variations in the 1000 psi internal pressure in the test article due to
variations in ambient temperature during testing.
2.2 Test Article Installation
The test article was installed in the ETEC Seismic Fragility Test
Facility by: (1) attachment of the three welding neck flanges at test
article supports SI, S3, and S5 to three of the facility shaker tables; and
(2) by installation of a pipe support at test article support S2 (see
Figure 2-1).
Restraints provided to the test article by the method of installation
were as follows: (1) full fixity (i.e., restraint of all displacements and
rotations) at supports SI, S3, and S5; and (2) restraint of vertical and
horizontal displacements at support S2. Restraint of the test article at
support S2 was provided by an assembly constructed from commercially
2-6
available component standard supports prototypic of ASME Code Section III
component supports; i.e., a pipe clamp and two rigid struts. The vertical
strut was attached to the floor of the test facility and the horizontal
strut was attached to a rigid vertical stanchion. The struts were selected
such that failure of the test article would occur during testing prior to
failure of the support.
Additionally, allowance was made to apply horizontal input motions to
the test article at support S2 which were identical to the horizontal base
input motions applied at supports SI, S3, and S5. These motions were pro
vided by a fourth shaker table to which the vertical stanchion was attached.
The installed test article is shown in Figure 2-3. Details of the
adapter plates utilized at supports SI, S3, and S5 and the support assembly
at support S2 are provided in Appendix B to this report.
2.3 Test Article Instrumentation
The test article was instrumented with 6 accelerometers, 30 strain
gages, and 1 pressure transducer. The installation locations were in accor
dance with NRC requirements. In addition, each of the four shaker tables
utilized in the test were instrumented with one accelerometer to measure
table acceleration in the direction of motion, and one linear variable
differential transformer (LVDT) for table displacement measurement in the
direction of motion. The locations of the test article instruments are
shown in Figures 2-4 and 2-5.
The 18 strain gages at locations G1, G2, G3, G4, G6, G7, and G9 were
single element gages, part number PA-HE-250AG-350-EN; and the remaining 12
at locations G5 and G8 were comprised of four 3-element 45° rosettes, part
number PA-HE-250RB-350-SDEN. All gages were supplied by Micro-Engineering II.
The strain gages were conditioned by B&F strain gage conditioners Model
PC2423 and then amplified to +10.0 VDC full scale with Bell & Howell zero
suppression amplifiers. Type 1-18A. Low pass filters were set at 30 Hz.
The high level signals were input to the facility digital data acquisition
system (DDAS).
2-7
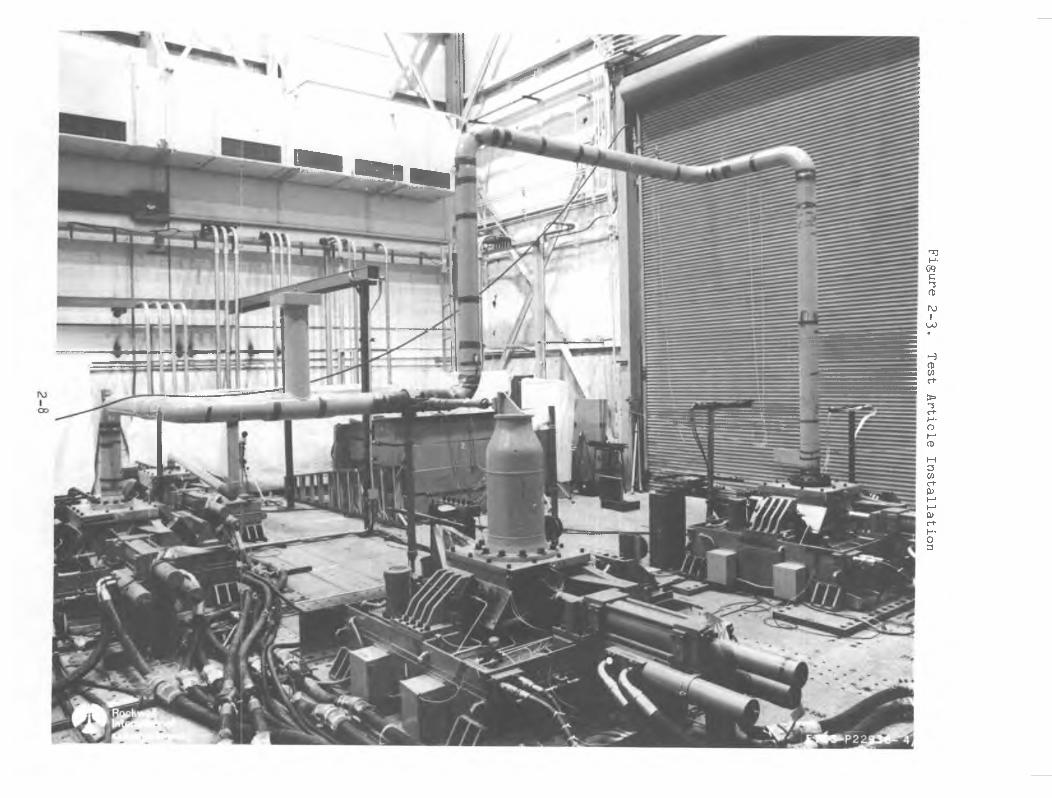
Figure 2-3. Test Article Installation
\
IiI
4
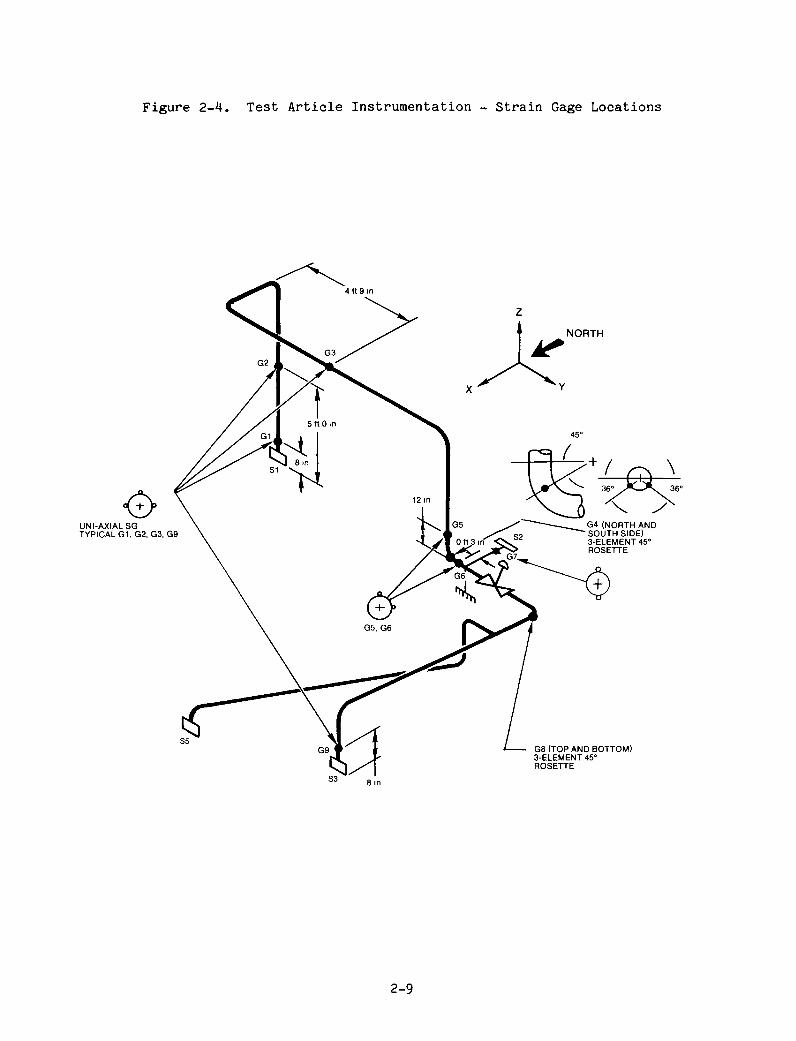
Figure 2-4. Test Article Instrumentation - Strain Gage Locations
<i> UNI-AXIAL SG TYPICALG1,G2, G3, G9
NORTH
/ /T^ \ 36°
V y G4 (NORTH AND SOUTH SIDE) 3-ELEMENT 45° ROSETTE
G8 (TOP AND BOTTOM) 3-ELEMENT 45° ROSETTE
2-9

Figure 2-5. Test Article Instrumentation - Accelerometer Locations
12 m
NORTH
ABL-6R1
2-10
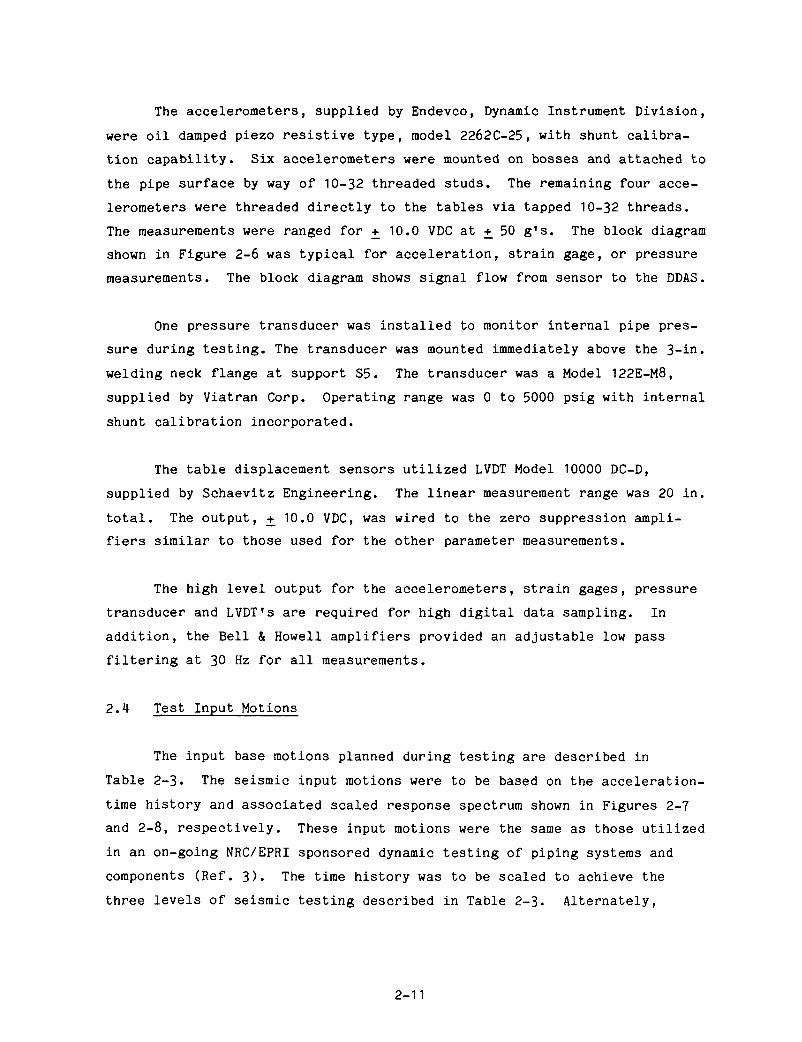
The accelerometers, supplied by Endevco, Dynamic Instrument Division,
were oil damped piezo resistive type, model 2262C-25, with shunt calibra
tion capability. Six accelerometers were mounted on bosses and attached to
the pipe surface by way of 10-32 threaded studs. The remaining four acce
lerometers were threaded directly to the tables via tapped 10-32 threads.
The measurements were ranged for + 10.0 VDC at + 50 g's. The block diagram
shown in Figure 2-6 was typical for acceleration, strain gage, or pressure
measurements. The block diagram shows signal flow from sensor to the DDAS.
One pressure transducer was installed to monitor internal pipe pres
sure during testing. The transducer was mounted immediately above the 3-in.
welding neck flange at support S5. The transducer was a Model 122E-M8,
supplied by Viatran Corp. Operating range was 0 to 5000 psig with internal
shunt calibration incorporated.
The table displacement sensors utilized LVDT Model 10000 DC-D,
supplied by Schaevitz Engineering. The linear measurement range was 20 in.
total. The output, + 10.0 VDC, was wired to the zero suppression ampli
fiers similar to those used for the other parameter measurements.
The high level output for the accelerometers, strain gages, pressure
transducer and LVDT's are required for high digital data sampling. In
addition, the Bell & Howell amplifiers provided an adjustable low pass
filtering at 30 Hz for all measurements.
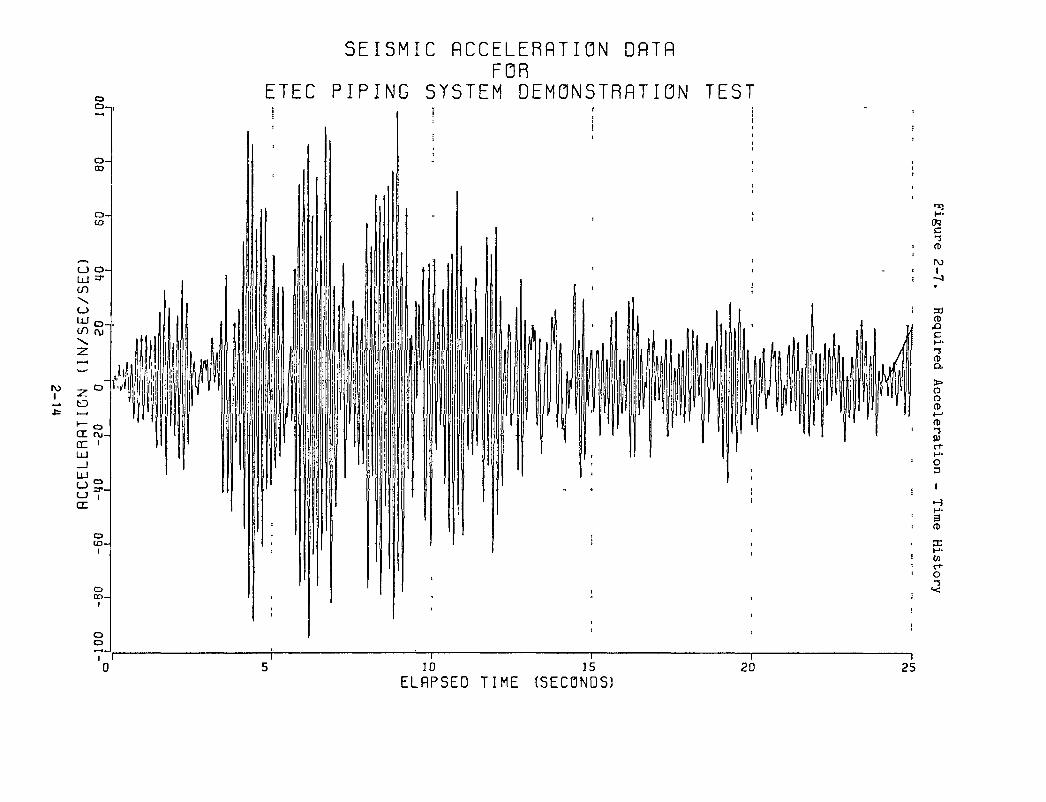
2.4 Test Input Motions
The input base motions planned during testing are described in
Table 2-3. The seismic input motions were to be based on the acceleration-
time history and associated scaled response spectrum shown in Figures 2-7
and 2-8, respectively. These input motions were the same as those utilized
in an on-going NRC/EPRI sponsored dynamic testing of piping systems and
components (Ref. 3). The time history was to be scaled to achieve the
three levels of seismic testing described in Table 2-3. Alternately,
2-11
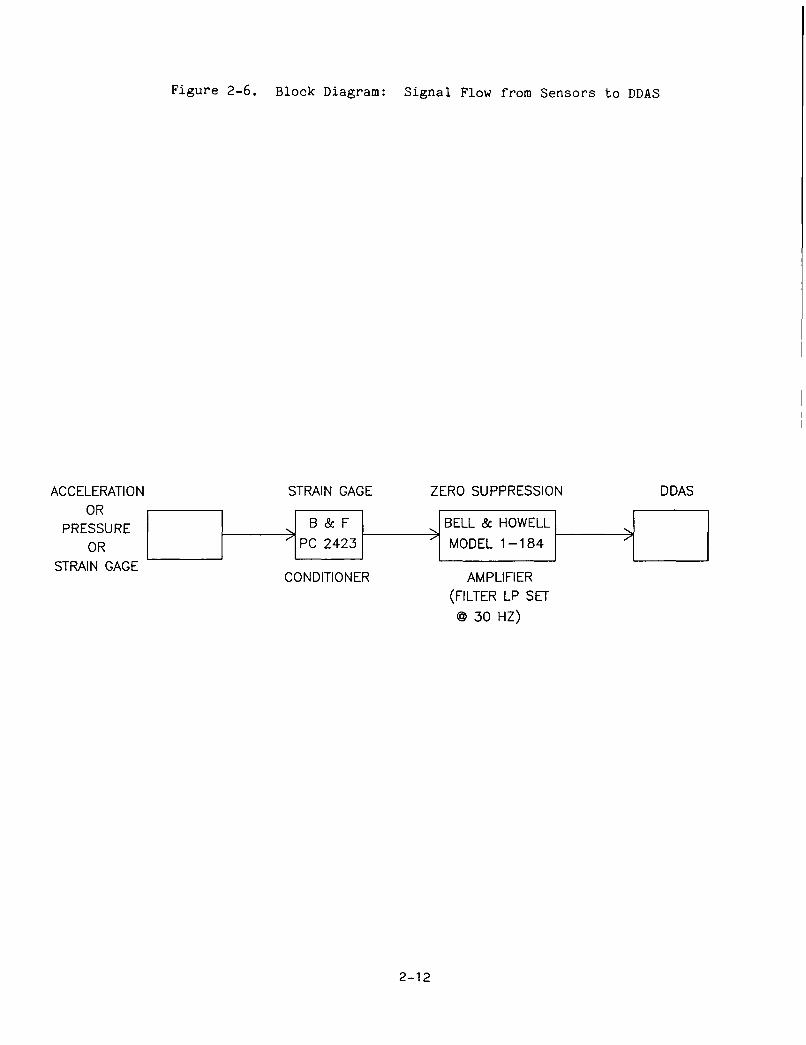
Figure 2 -6 . Block Diagram: Signal Flow from Sensors to DDAS
ACCELERATION OR
PRESSURE OR
STRAIN GAGE
STRAIN GAGE
^ B & F
PC 2423
CONDITIONER
ZERO SUPPRESSION
^ BELL & HOWELL
MODEL 1-184
AMPLIFIER
(FILTER LP SET
@ 30 HZ)
DDAS
->
2-12
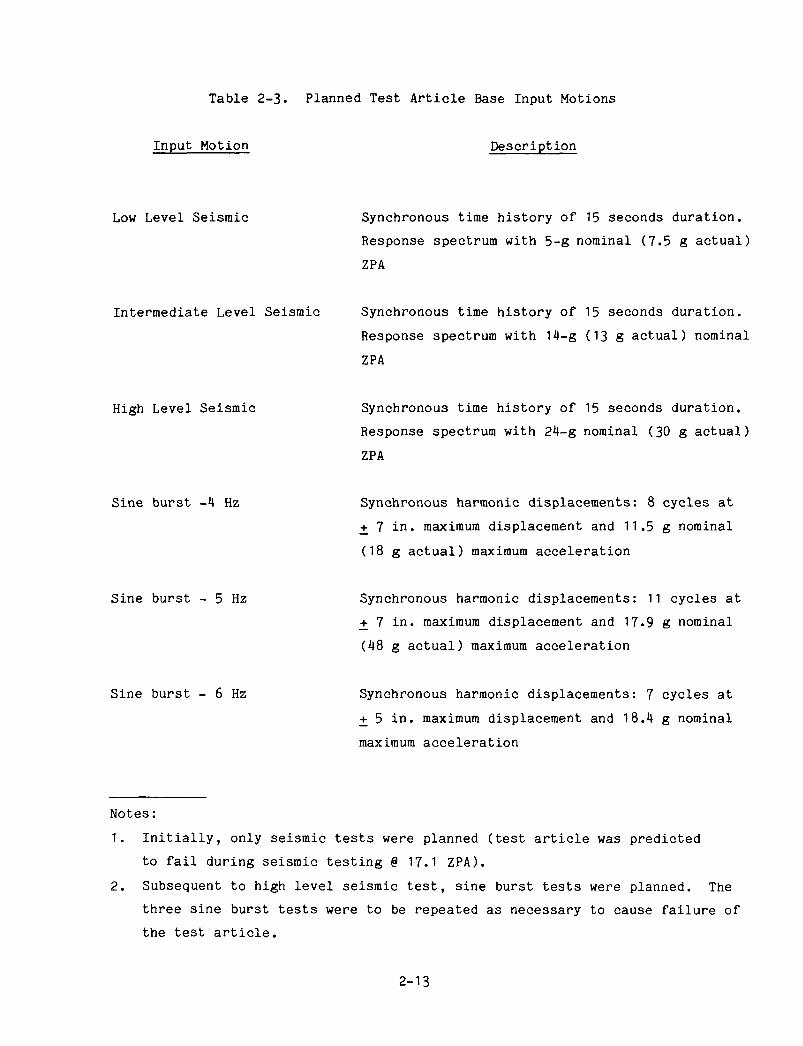
Table 2-3. Planned Test Article Base Input Motions
Input Motion Description
Low Level Seismic Synchronous time history of 15 seconds duration.
Response spectrum with 5-g nominal (7.5 g actual)
ZPA
Intermediate Level Seismic Synchronous time history of 15 seconds duration.
Response spectrum with 14-g (13 g actual) nominal
ZPA
High Level Seismic Synchronous time history of 15 seconds duration.
Response spectrum with 24-g nominal (30 g actual)
ZPA
Sine burst -4 Hz Synchronous harmonic displacements: 8 cycles at
+ 7 in. maximum displacement and 11.5 g nominal
(18 g actual) maximum acceleration
Sine burst - 5 Hz Synchronous harmonic displacements: 11 cycles at
+ 7 in. maximum displacement and 17.9 g nominal
(48 g actual) maximum acceleration
Sine burst - 6 Hz Synchronous harmonic displacements: 7 cycles at
+ 5 in. maximum displacement and 18.4 g nominal
maximum acceleration
Notes:
1. Initially, only seismic tests were planned (test article was predicted
to fail during seismic testing § 17.1 ZPA).
2. Subsequent to high level seismic test, sine burst tests were planned. The
three sine burst tests were to be repeated as necessary to cause failure of
the test article.
2-13
o O-i
o-OD
SEISMIC RCCELERflTION DRTR FOR
ETEC PIPING SYSTEM DEMONSTRATION TEST
UJ =•* CT)
o L L J Q . CO {\j
- > CO
•^ o en ru-CC I UJ
cc
C3 UP-I
o 0 3 -
o o
H-TO c T CD IV) I
(D £ l C H-T (D Q.
> O O CD
(D T (U e-i-H-O D
3
M
o
10 15 ELRPSED TIME (SECONDS)
20 I
25

REQUIRED RESPONSE 5PECTRR FOR 6 INCH PIPE TEST
5X DRMPING
I
H-TO C -i
w
I CX5
5d (D £> C H-T CD
a
so CD CO
• D O D M CD 00
•o (D O c+ C B
QlOO '1000
FREQUENCY (HZ)
the input motions were to be based on a similarly scalable artificial time
history. The response spectrum for the artificial time history was
required to envelope the response spectrum shown in Figure 2-8 over the
range of frequency of interest in the test. The seismic input motions were
based on the latter option.
The peak spectral response frequency (7 Hz) was not "tuned" to coin
cide with the test article fundamental frequency (5 Hz) since this con
dition is expected to be investigated in an upcoming NRC/EPRI cooperative
research study. Pretest analysis did not suggest a need to tune the input
to produce a piping failure.
Initially, only the three seismic tests were planned. The load
levels were selected on the basis of the 17.1 g ZPA level predicted by ETEC
(and later corroborated by Hanford Engineering Development Laboratory
[HEDL] - see Section 3.2 of this report and Ref. 4) to cause failure of the
test article and previous ETEC experience gained during similar testing of
a 3-in. diameter piping system (Ref. 5). However, provisions were made to
conduct repeated sine burst testing to failure of the test article if
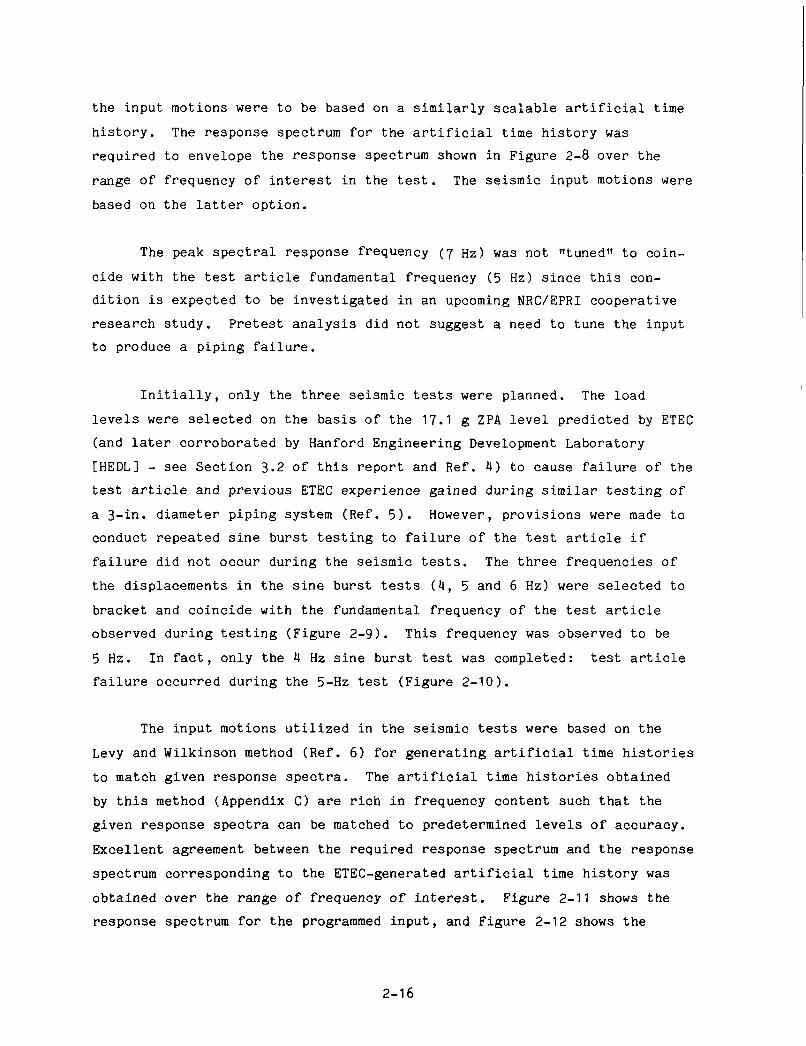
failure did not occur during the seismic tests. The three frequencies of
the displacements in the sine burst tests (4, 5 and 6 Hz) were selected to
bracket and coincide with the fundamental frequency of the test article
observed during testing (Figure 2-9). This frequency was observed to be
5 Hz. In fact, only the 4 Hz sine burst test was completed: test article
failure occurred during the 5-Hz test (Figure 2-10).
The input motions utilized in the seismic tests were based on the
Levy and Wilkinson method (Ref. 6) for generating artificial time histories
to match given response spectra. The artificial time histories obtained
by this method (Appendix C) are rich in frequency content such that the
given response spectra can be matched to predetermined levels of accuracy.
Excellent agreement between the required response spectrum and the response
spectrum corresponding to the ETEC-generated artificial time history was
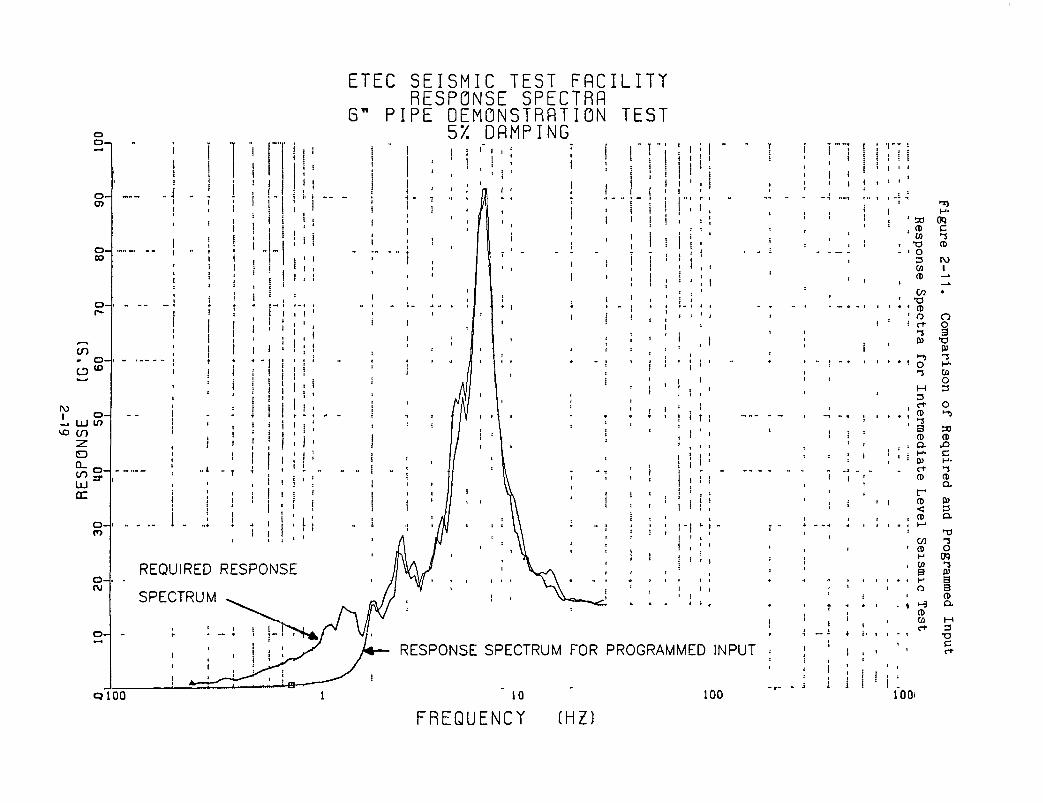
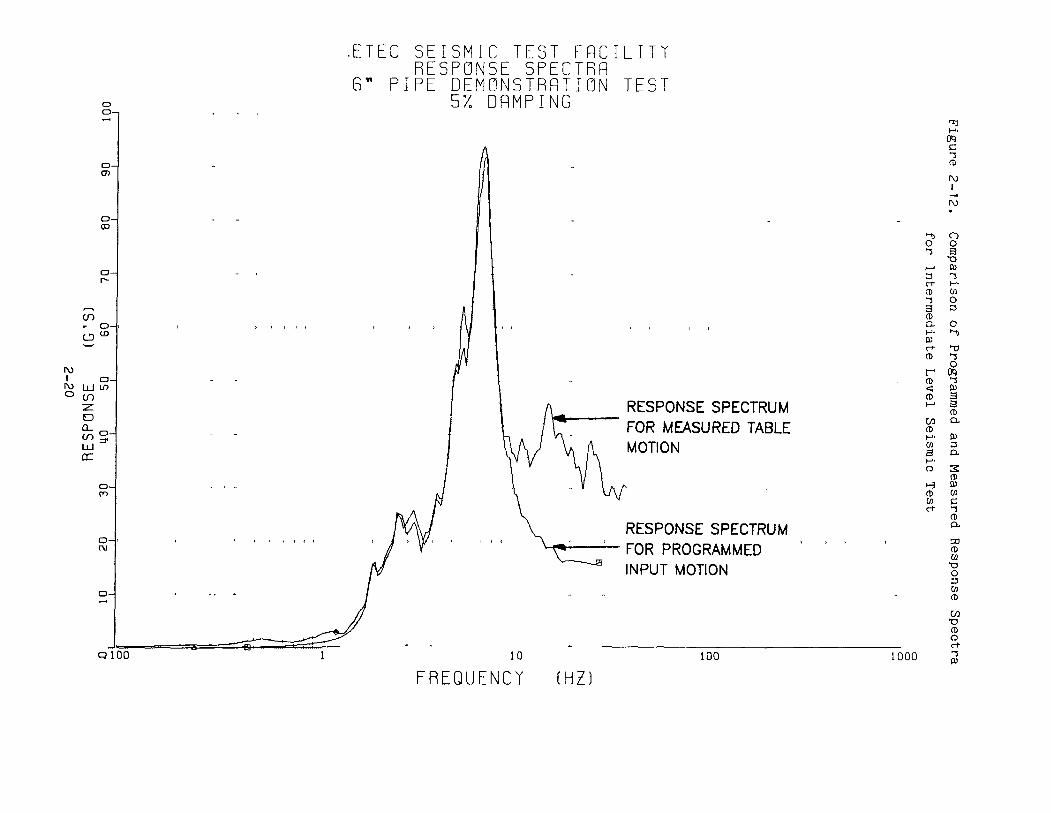
obtained over the range of frequency of interest. Figure 2-11 shows the
response spectrum for the programmed input, and Figure 2-12 shows the
2-16

Figure 2-9. Planned Sine Burst Tests
6.333
-6.397 0 - 0
TIME (SECS.) 10-00 15.34
2-17
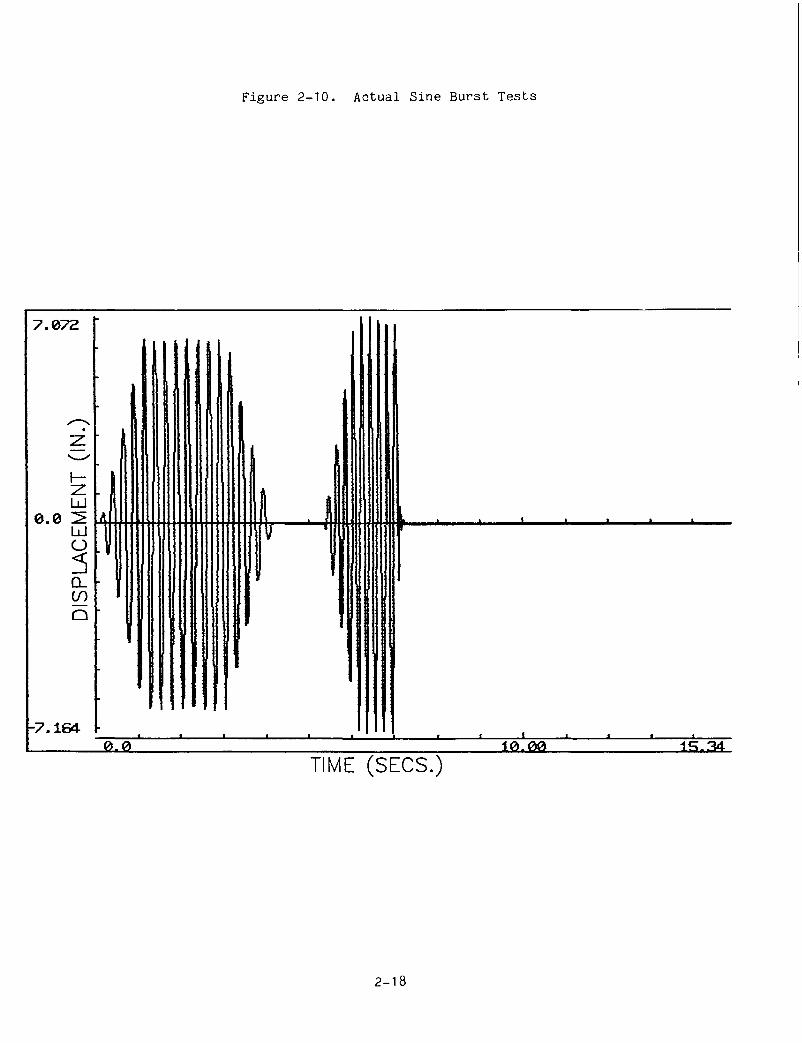
Figure 2-10. Actual Sine Burst Tests
7.072
0 . 0 Ld : ^ LU O
CL (/) Q
-7.164 0 . 0
' ' ' ' '
i I I I I I ' • ' I i_
iQ.m 15.34 TIME (SECS.)
2-18
o 0 - ,
o -
oo
o -
o -U3
I o -_ . UJ LO
o Q_ en o -
o-
o -
ETEC SEISMIC TEST F A C I L I T RESPONSE SPECTRA
6 " PIPE DEMONSTRATION TES 5X DAMPING
REQUIRED RESPONSE
SPECTRUM
QlOO
RESPONSE SPECTRUM FOR PROGRAMMED INPUT
100
J
' 1
' 1
.
' ' f
i t 1
' I
I
j
„ t
1
t
, ' *
t t
* ,
1- 1
, t
1 1 1 1
1
' 50 ' . <I>
Cfl 1 n - ' o D
M (D
CO
• n ' ' • CD
' ^ ' i n-T I"
. . . " ) • • 1 o T
M D
, o-, , , ^ T
3 CD
, . Q. . H-
, ' ' 0) ci-(D
r-1 CD
< . CD 1 » . M
1
M ' CD
H , CO
a . 1 H
o - » - 9
CD Cfl a-
'
- T )
H-
TO C T CD
IV) 1
•
O o g •a T H-ca O D
O
•- 50 CD £1 C H-T CD Q .
W D Q.
TJ T O
TO T B) 5 B CD
a M D
• o c n-
1001
FREQUENCY (HZ)
o
.ETEC S E I S M I C TEST F R C I L I T T RESPONSE SPECTRA
6 " P I P E DEMONSTRATION TEST 57. DAMPING
o -
C D -CO
CO •• d-
o-UJ LO CD
Q_ CO UJ CC
o -
O -c\j
QlOO
RESPONSE SPECTRUM FOR MEASURED TABLE MOTION
RESPONSE SPECTRUM FOR PROGRAMMED INPUT MOTION
100 1000
FREQUENCY (HZ:

response spectrum for the measured table motion. The programmed input was
tailored to optimize the energy content in the critical frequency range of
interest for this test article, i.e., 2 to 10 Hz.
During seismic testing, differences in amplitude of displacements of
up to 3/4 in. (approximately 5% of the maximum approximately 15 in. peak-
to-peak motions) were observed between the displacement at supports S3 and
S5 during the nominal 25 g high level seismic test. This difference was
attributed to a scaling anomaly which will be corrected during future
testing. Fortunately, the effects of this difference were limited to the
3-in. branch piping of the test article which was far removed from the
critical section of 6-in. pipe for the tests.
2.5 Test Observations
During testing, no instrumentation anomalies were noted except for
strain gage locations G1 and 08 (see Figure 2-4). Extremely high strain
levels caused these gages to lift off their respective surfaces. The gages
at location G1 were replaced as necessary after each seismic test. The
rosette gages at the top and bottom of location G8 were not replaced.
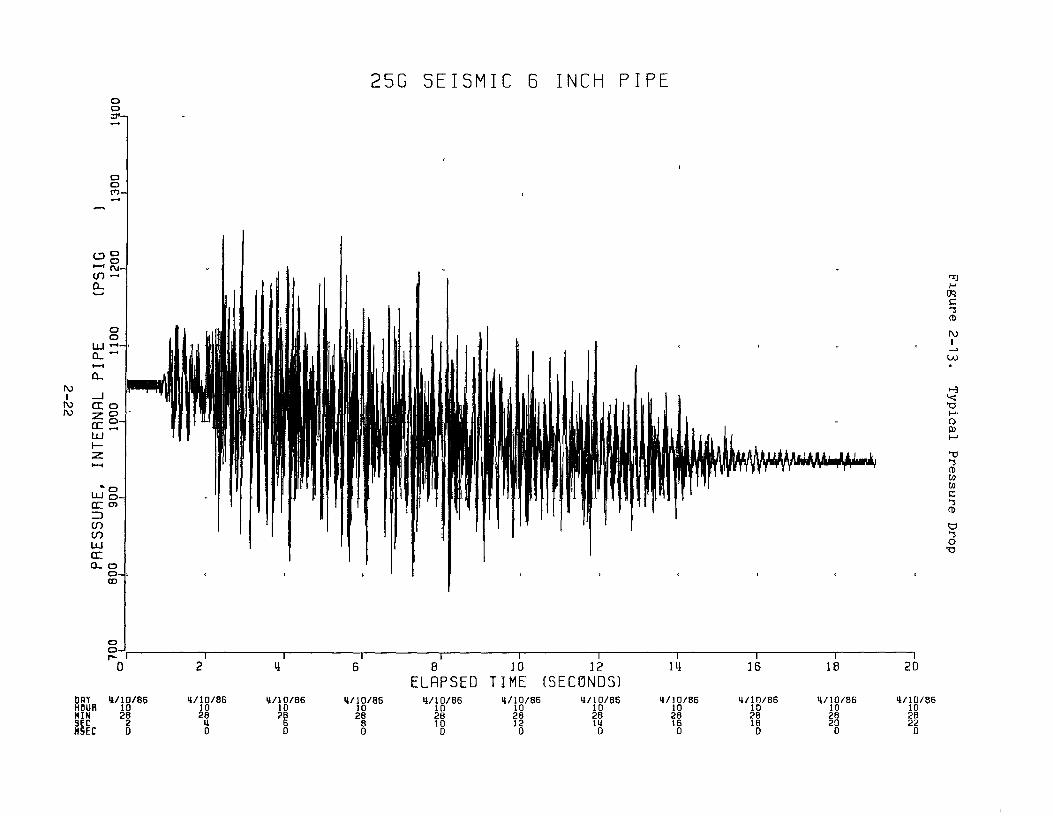
Additionally, an 8O-IOO psi mean pressure drop was noted after each
test. This pressure drop required repressurization of the test article
after each test in order to maintain the internal pressure within the 1000
+ 100 psi acceptance limit (Figure 2-13). This pressure drop could not be
attributed to volumetric changes in the pipe due to residual strains.
No visual indications of damage were observed prior to high level
seismic testing. However, two such indications were observed at the end of
the high level test: a 2-in. wide circumferential bulge was found in the
vertical leg of the test article 8 in. above support SI, and the permanent
set of the test article was found to be of the order of 2 in. Based on
diametral measurements, the residual circumferential strain in the bulge
was found to be approximately 2.3/t (Figure 2-14).
2-21
25G S E I S M I C 6 INCH P I P E
o o
) IV) rv)
O g >-> [\i-tO ' -a. ^
o o
UJ '-•-Q_ '-1—H
O-
_ l (X o
UJ 1— z t - H
. " o UJ o -CC c =5 CT) CO UJ CC Q- o
o 1 r-
8 10
EinPSED TIME pRT HOUfl MIN SEC HSEC
4/10/86 10 26 2 0
4/10/86 10 28 4 0
4/10/86 10 2B 6 0
4/10/86 10 28 8 0
4/10/86 ID 2B 10 D
4/10/86 10 28 12 0
T 12
(SECONDS) 4/10/86 ID 2B 14 D
4/10/86 10 28 16 0
— T " 16
4/10/86 10 28 IB 0
18
4/10/86 10 28 20 0
H TO C T CD
ru I
o 03
-o CD CO CO C T CD
a o
— I
20
4/1D/86 ID 26 22 0
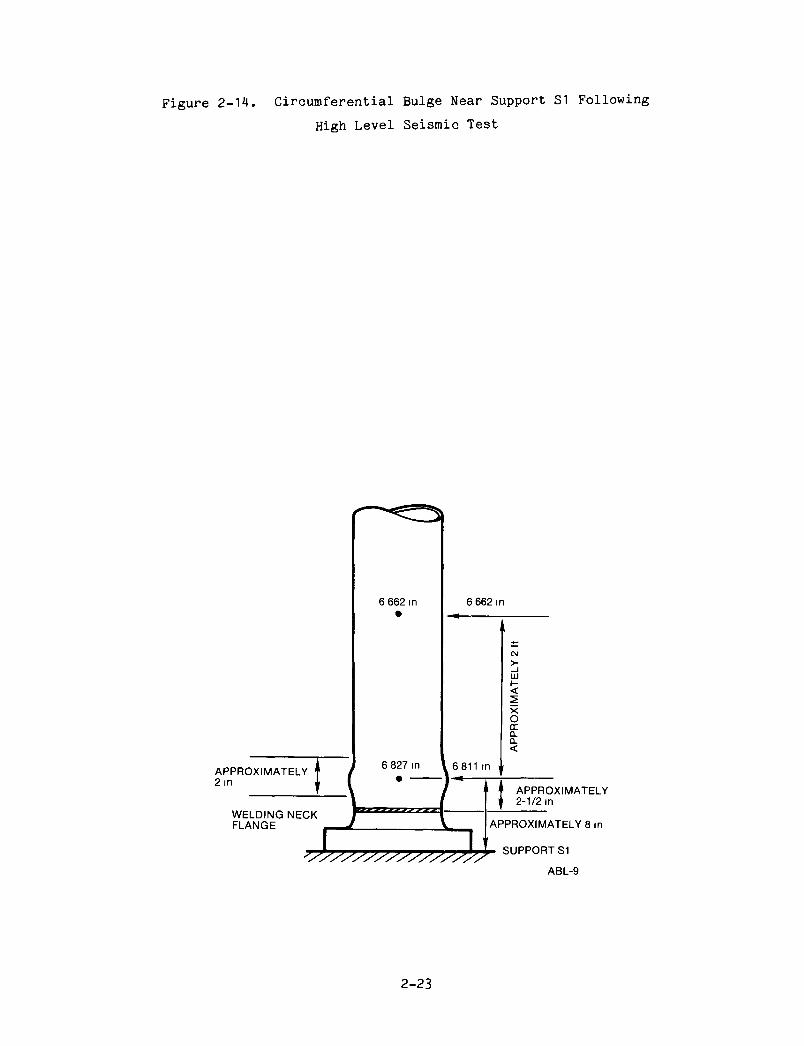
Figure 2-14. Circumferential Bulge Near Support SI Following
High Level Seismic Test
APPROXIMATELY 2 in
6 662 in 6 662 in
WELDING NECK FLANGE
j 6 827 in \ 6 811 in i
\ / I APPRO ' \ ^ f !| 2-1/2 in
J V APPROXIMA
' ' SUPPORT
>-_ i 111 I -<
X o DC £L Q . <
APPROXIMATELY
APPROXIMATELY 8 in
SUPPORT SI
ABL-9
2-23

As previously mentioned, failure of the test article occurred during
the 5-Hz sine burst test. The failure was located in the previously
observed circuraferentially bulged area in the test article and occurred
during the 6th of the 11 planned full amplitude cycles (see Figures 2-9 and
2-10). The test was promptly terminated to prevent possible damage to the
seismic tables.
During the failure cycle, the first indication of a through-wall
crack was observed at 8 in. above support SI. The initial crack was
oriented circumferentially and located in the central plane of the bulge.
Growth of the through-wall crack was primarily in the circumferential
direction and occurred rapidly only during southward half cycle input
motions of the failure cycle at support SI. During the first half cycle,
the maximum circumferential extent of the crack was approximately 60°, and
during the second, the maximum extent was 300°. The maximum set in crack
opening displacement observed after testing was 0.70 + 0.02 in.
(Figures 2-15 and 2-16). Piping dislocation following failure of the test
article is shown in Figure 2-17.
During the termination of the test, the horizontal rigid strut at
support S2 was damaged (Figure 2-18). The rod end attached to the clamp at
support S2 was bent as a result of the increased torsional deflections of
the pipe between elbows E4 and E5 (Figure 2-1). The increased deflections
were due to the decrease in restraint of the test article piping resulting
from the failure. Frictional forces at the clamp were exceeded causing the
clamp to rotate around the pipe and subsequent misalignment and bending of
the horizontal strut.
Details of post-test examination conducted after failure of the test
article are provided in Section 3 of this report and data plots for all
four tests are provided in Appendix D to this report.
2-24
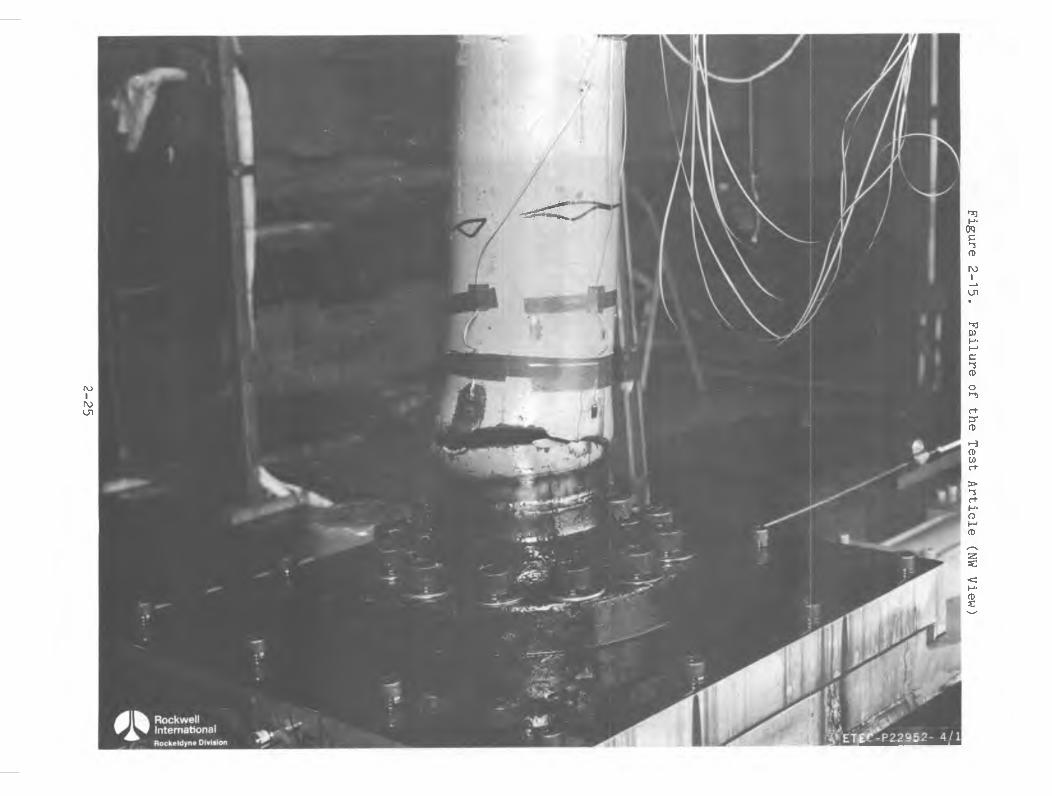
Figure 2-15. Failure of the Test Article (NW View)
H
2-25
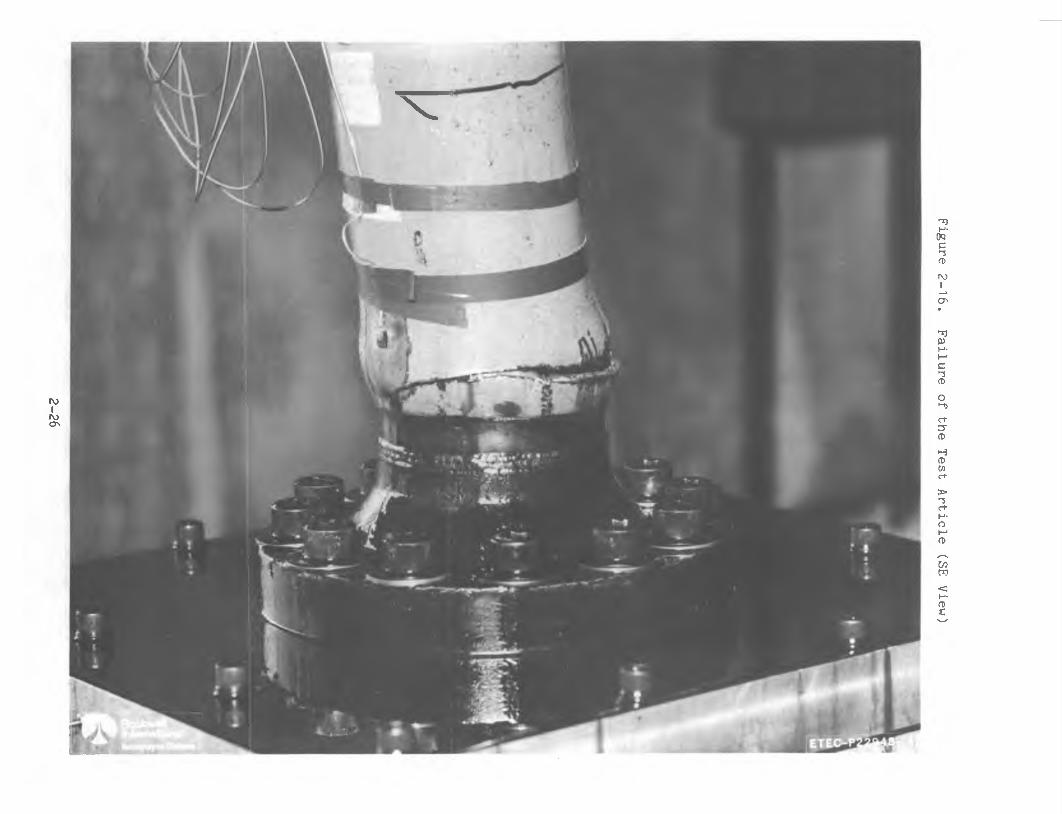
Figure 2-16. Failure of the Test Article
(SE View)
/
2-26
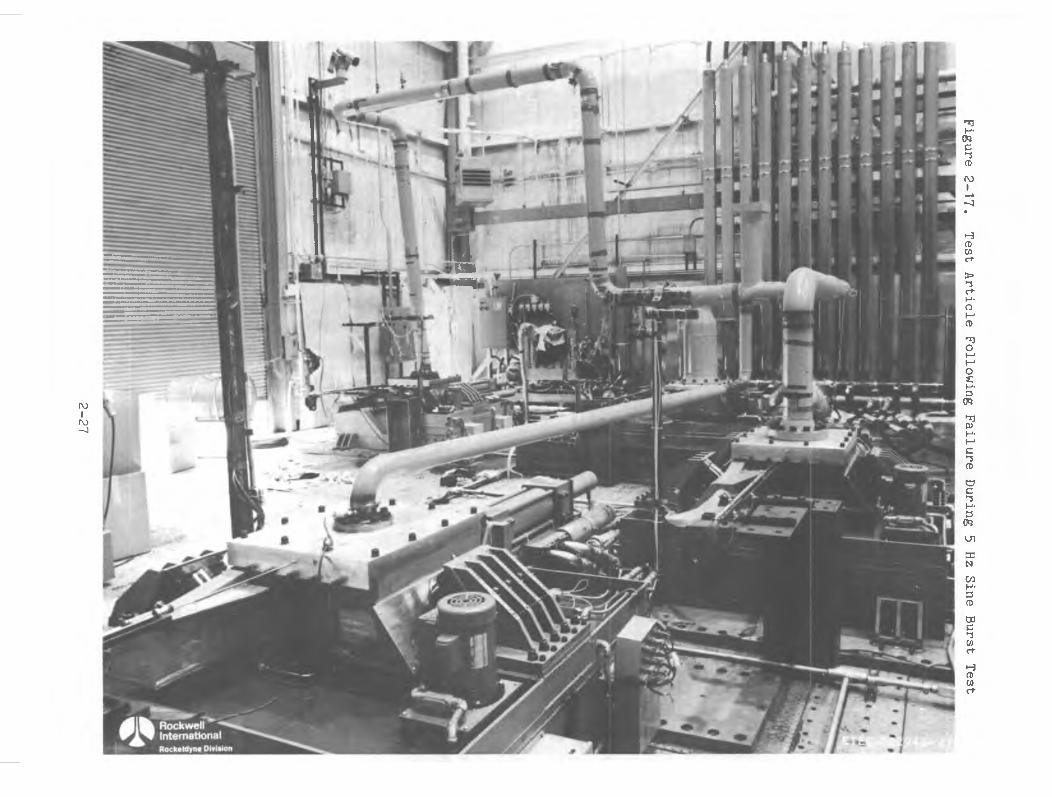
Figure 2-17. Test Article Following Failure During 5 Hz Sine Burst Test
mar
2-27
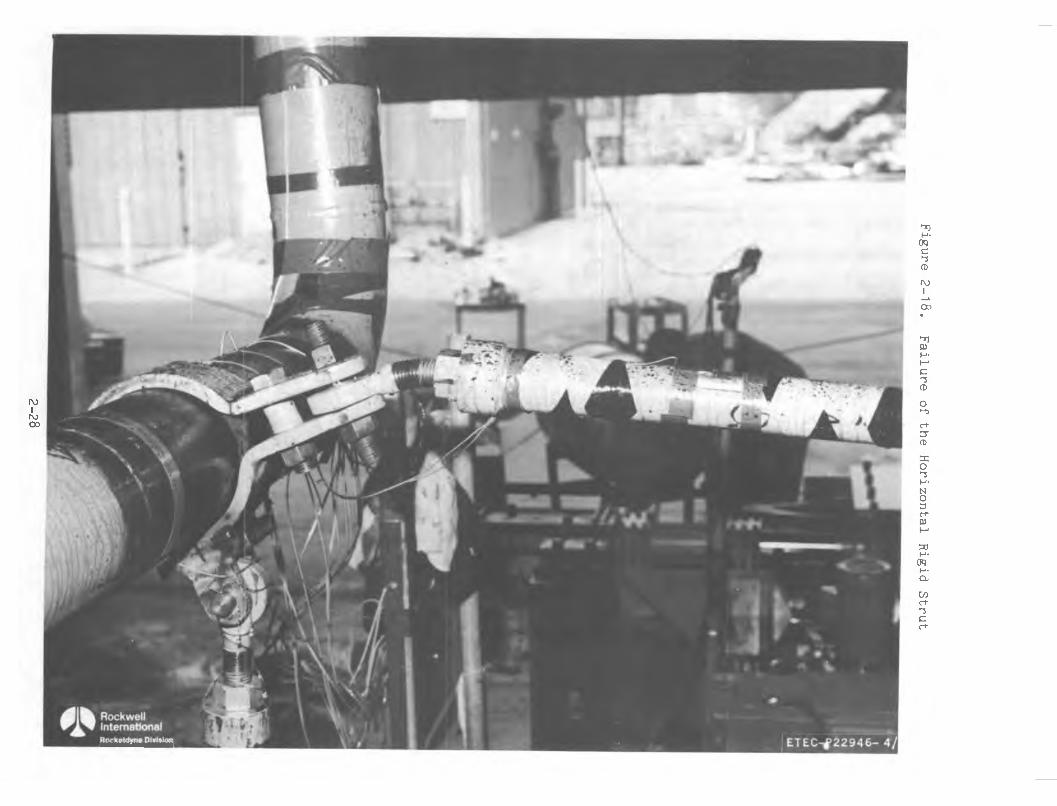
Figure 2-18. Failure of the Horizontal Rigid Strut
2-28

3.0 TEST RESULTS
The results of the three seismic and two sine burst tests are
arranged for convenience to address the following test objectives:
1) Characterize high level dynamic response
2) Quantify conservatisms in current design criteria and failure
analysis methods
3) Identify failure modes.
3.1 Characterization of Dynamic Response
The dynamic response of the test article was characterized by parame
ters which describe the overall and localized response of the test article.
The overall or general parameters include acceleration values at specific
locations or averaged values for several locations. Localized parameters
include strains and strain ranges. Additional characterization parameters
include test article permanent set and support loads.
Variations of the response parameters with increasing levels in test
seismic inputs are described in the following.
3.1.1 Acceleration Response
The overall response of the test article was characterized by peak
acceleration attained at locations throughtout the test article. Accord
ingly, peak accelerations measured during test at all accelerometer loca
tions (Figure 2-5) are shown as functions of seismic ZPA in Figure 3-1.
The figure indicates the expected behavior: the increasing resistance of
the test article to respond to increasing levels of seismic input.
3-1

Figure 3-1. Test Article Acceleration Due to Seismic Input
)A4
A2
4 A1 A3, A6 A5
10 15
G|N (ZPA)
20 25 30
ABL-10
3-2
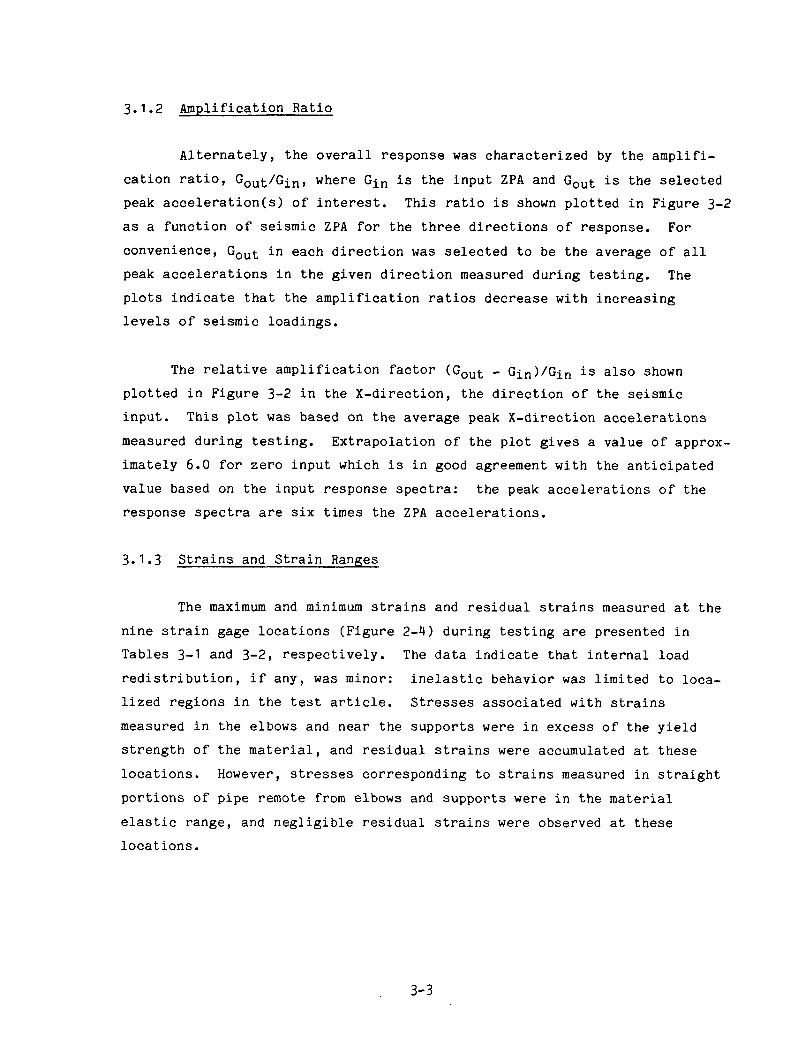
3.1.2 Amplification Ratio
Alternately, the overall response was characterized by the amplifi
cation ratio, Gout/Oin> where 0^^ is the input ZPA and Gout is the selected
peak acceleration(s) of interest. This ratio is shown plotted in Figure 3-2
as a function of seismic ZPA for the three directions of response. For
convenience, GQ^^^ in each direction was selected to be the average of all
peak accelerations in the given direction measured during testing. The
plots indicate that the amplification ratios decrease with increasing
levels of seismic loadings.
The relative amplification factor (Go^t - Gin)/Gin is also shown
plotted in Figure 3-2 in the X-direction, the direction of the seismic
input. This plot was based on the average peak X-direction accelerations
measured during testing. Extrapolation of the plot gives a value of approx
imately 6.0 for zero input which is in good agreement with the anticipated
value based on the input response spectra: the peak accelerations of the
response spectra are six times the ZPA accelerations.
3.1.3 Strains and Strain Ranges
The maximum and minimum strains and residual strains measured at the
nine strain gage locations (Figure 2-4) during testing are presented in
Tables 3-1 and 3-2, respectively. The data indicate that internal load
redistribution, if any, was minor: inelastic behavior was limited to loca
lized regions in the test article. Stresses associated with strains
measured in the elbows and near the supports were in excess of the yield
strength of the material, and residual strains were accumulated at these
locations. However, stresses corresponding to strains measured in straight
portions of pipe remote from elbows and supports were in the material
elastic range, and negligible residual strains were observed at these
locations.
3-3
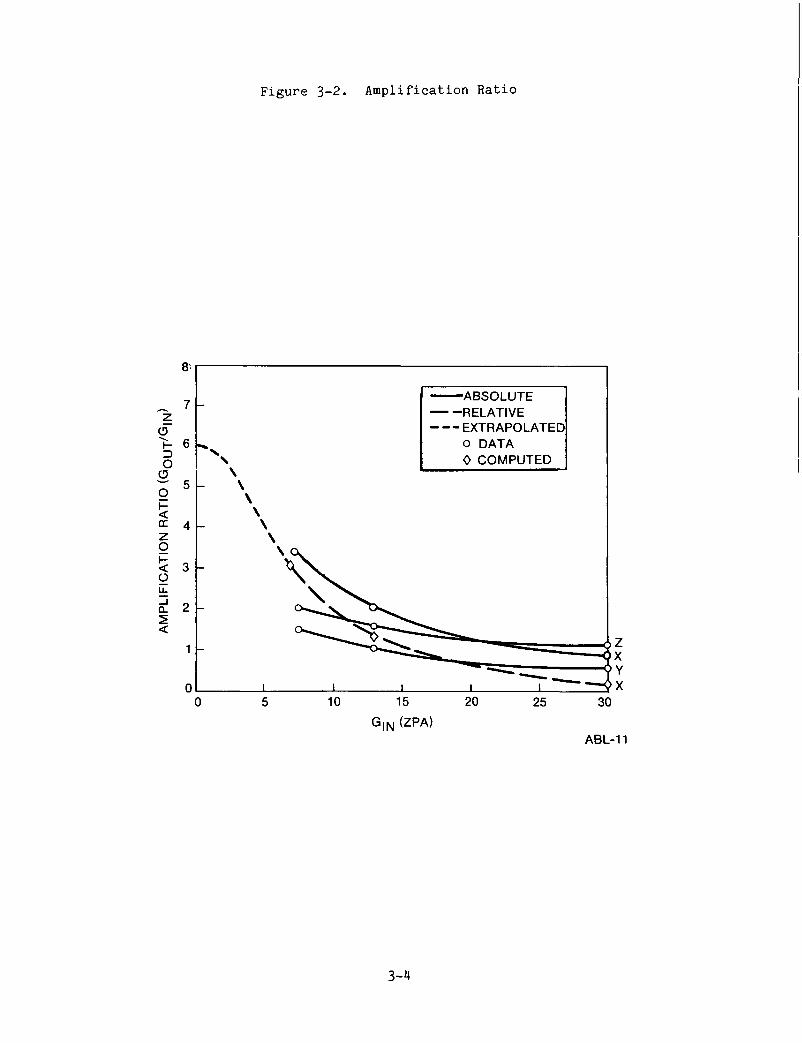
Figure 3-2. Amplification Ratio
•ABSOLUTE RELATIVE EXTRAPOLATED O DATA 0 COMPUTED
ABL-11
3-4
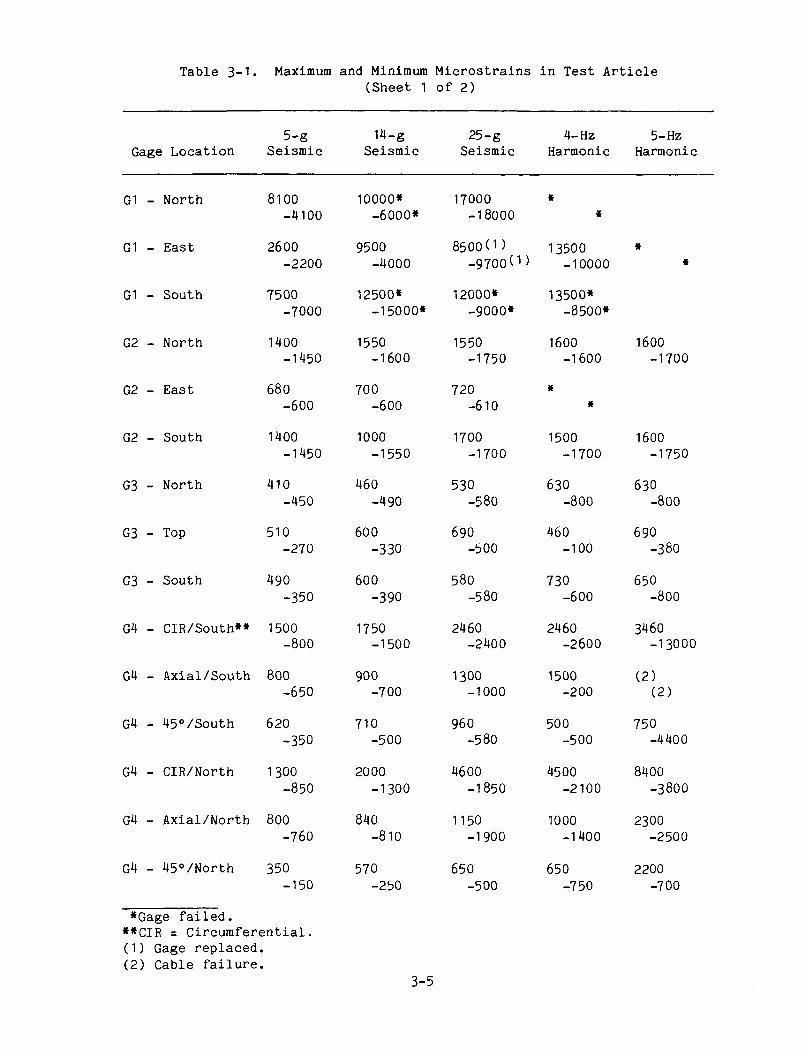
Table 3-1. Maximum and Minimum Microstrains in Test Article (Sheet 1 of 2)
Gage Location
G1 - North
G1 - East
G1 - South
G2 - North
G2 - East
G2 - South
G3 - North
G3 - Top
G3 - South
G4 - CIR/South«»
G4 - Axial/South
G4 - 45°/South
G4 - CIR/North
G4 - Axial/North
G4 - 45°/North
»Gage failed. «*CIR = Circurafer-(1) Gage replaced (2) Cable failure
5-g Seismic
8100 -4100
2600 -2200
7500 -7000
1400 -1450
680 -600
1400 -1450
410 -450
510 -270
490 -350
1500 -800
800 -650
620 -350
1300 -850
800 -760
350 -150
ential. • •
14-g Seismic
10000» -6000*
9500 -4000
12500* -15000*
1550 -1600
700 -600
1000 -1550
460 -490
600 -330
600 -390
1750 -1500
900 -700
710 -500
2000 -1300
840 -810
570 -250
25-g Seismic
17000 -18000
8500(1) -9700(1)
12000* -9000*
1550 -1750
720 -610
1700 -1700
530 -580
690 -500
580 -580
2460 -2400
1300 -1000
960 -580
4600 -1850
1150 -1900
650 -500
4-Hz Harmonic
«
13500 -10000
13500* -8500*
1600 -1600
«
«
1500 -1700
630 -800
460 -100
730 -600
2460 -2600
1500 -200
500 -500
4500 -2100
1000 -1400
650 -750
5-Hz Harmonic
«
1600 -1700
1600 -1750
630 -800
690 -380
650 -800
3460 -13000
(2) (2)
750 -4400
8400 -3800
2300 -2500
2200 -700
3-5

Table 3-1. Maximum and Minimum Microstrains in Test Article (Sheet 2 of 2)
Gage Location
G5 -
G5 -
G6 -
G6 -
G7 -
G7 -
G8 -
G8 -
G8 -
G8 -
G8 -
G8 -
G9 -
G9 -
G9 -
North
East
Top
South
Top
Bottom
CIR/Top**
Axial/Top
45°/Top
CIR/Bottom
Axial/Bottom
45°/Bottom
North
East
South
5-g Seismic
1050 -850
460 -350
350 -280
320 -210
75 -275
180 -60
12500* -2200*
2800 -3600
5400 -2500
6200 -4100
3400 -2500
3100 -2600
1100 -1100
900 -1000
1200 -950
14-g Seismic
1200 -1250
460 -400
460 -270
400 -270
190 -165
240 -165
3600 -4200
2750* -400*
14000* -400*
5500 -3100
6300 -1250
1400 -1000
1000 -1200
1200 -1500
25-g Seismic
1400 -1500
500 -680
500 -550
850 -250
350 -280
190 -350
6800* -3100*
-h4800* +900*
1750 -1500
1150 -1350
1400 -2300
4-Hz Harmonic
1550 -1500
400 -400
180 -380
700 -100
350 -360
220 -100
Not replaced
Not replaced
Not replaced
Not replaced
Not replaced
Not replaced
1500 -1 100
750 -1750
400 -2100
5-Hz Harmonic
1650 -2700
700 -3100
460 -700
1200 -800
480 -300
700 -500
1600 -3450
750 -2600
4000 -4200
*Gage failed. •*CIR = Circumferential.
3-6
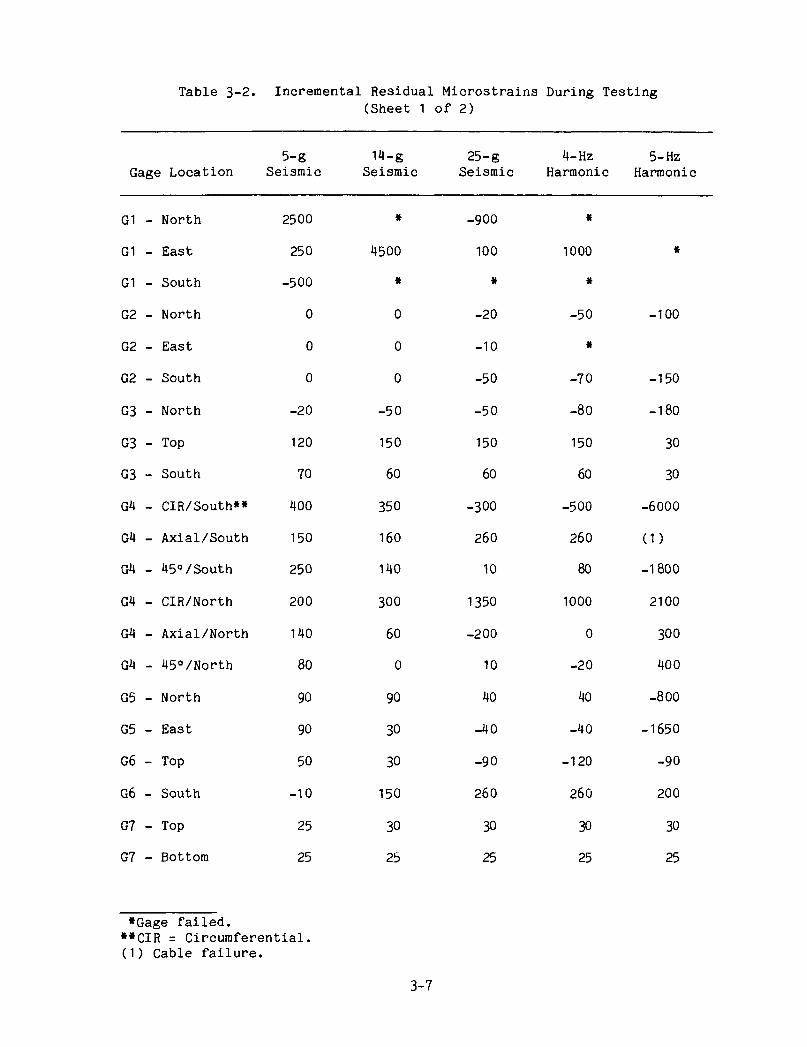
Table 3-2. Incremental Residual Microstrains During Testing (Sheet 1 of 2)
Gage Location
G1 -
G1 -
G1 -
G2 -
G2 -
G2 -
G3 -
G3 -
G3 -
G4 -
G4 -
G4 -
G4 -
G4 -
G4 -
G5 -
G5 -
G6 -
G6 -
G7 -
G7 -
North
East
South
North
East
South
North
Top
South
CIR/South**
Axial/South
45°/South
CIR/North
Axial/North
45°/North
North
East
Top
South
Top
Bottom
5-g Seismic
2500
250
-500
0
0
0
-20
120
70
400
150
250
200
140
80
90
90
50
-10
25
25
14-g Seismic
»
4500
«
0
0
0
-50
150
60
350
160
140
300
60
0
90
30
30
150
30
25
25-g Seismic
-900
100
«
-20
-10
-50
-50
150
60
-300
260
10
1350
-200
10
40
-40
-90
260
30
25
4-Hz Harmonic
«
1000
*
-50
*
-70
-80
150
60
-500
260
80
1000
0
-20
40
-40
-120
260
30
25
5-Hz Harmonic
«
-100
-150
-180
30
30
-6000
(1)
-1800
2100
300
400
-800
-1650
-90
200
30
25
*Gage failed. **CIR = Circumferential. (1) Cable failure.
3-7
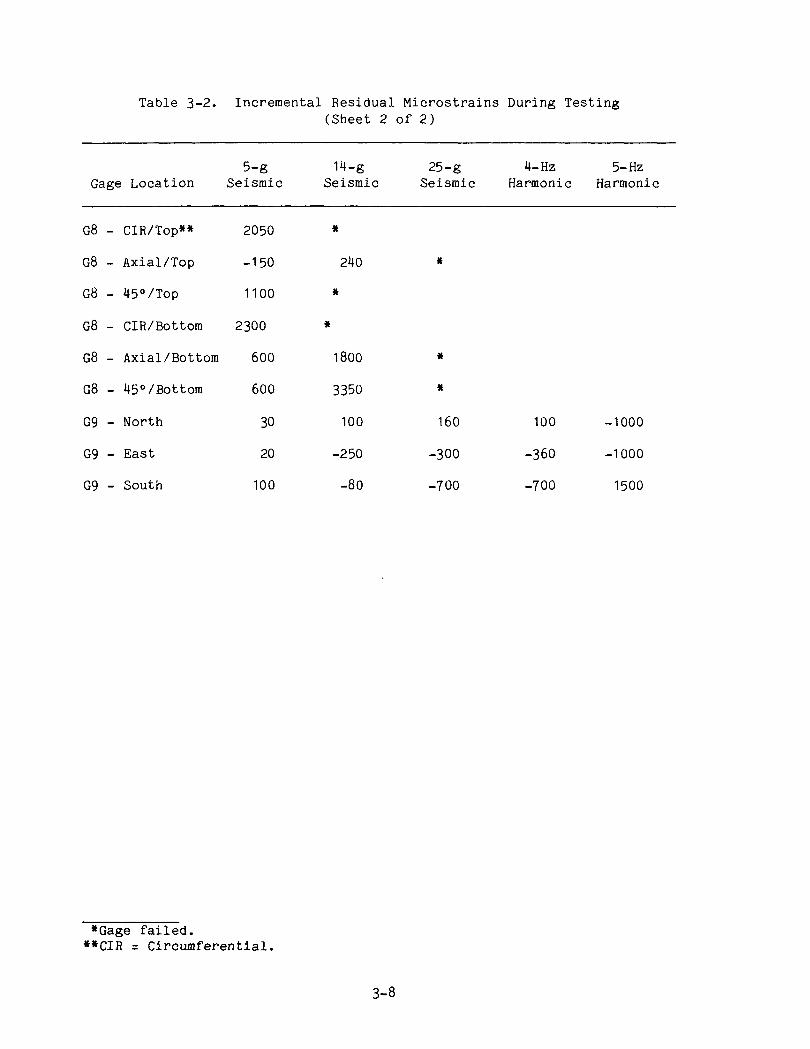
Table 3-2. Incremental Residual Microstrains During Testing (Sheet 2 of 2)
Gage Location
G8 - CIR/Top**
G8 - Axial/Top
G8 - 45°/Top
G8 - CIR/Bottom
G8 - Axial/Bottom
G8 - 45°/Bottom
G9 - North
G9 - East
G9 - South
5-g Seismic
2050
-150
1100
2300
600
600
30
20
100
14-g Seismic
»
240
*
«
1800
3350
100
-250
-80
25-g Seismic
*
*
«
160
-300
-700
4-Hz 5-Hz Harmonic Harmonic
100 -1000
-360 -1000
-700 1500
*Gage failed. **CIR = Circumferential.
3-8
For each of the seismic tests, the data indicate that the most highly
strained elbow was elbow E5 (gage location G 8 ) , and the critical support-
related piping was the 6 in. vertical leg at support SI (gage location G1).
Prior to failure of the critical gage at location G8 on the elbow, the
maximum strain measured in the elbow (12,500 in./in.) appeared to be 50J
higher than that in the pipe (8,100 in./in.) but is believed to reflect
conditions in highly localized areas in the elbow. Other strains in the
elbow were low (approximately 3000 in./in. to 6000 in./in.) in comparison
to the maximum strain.
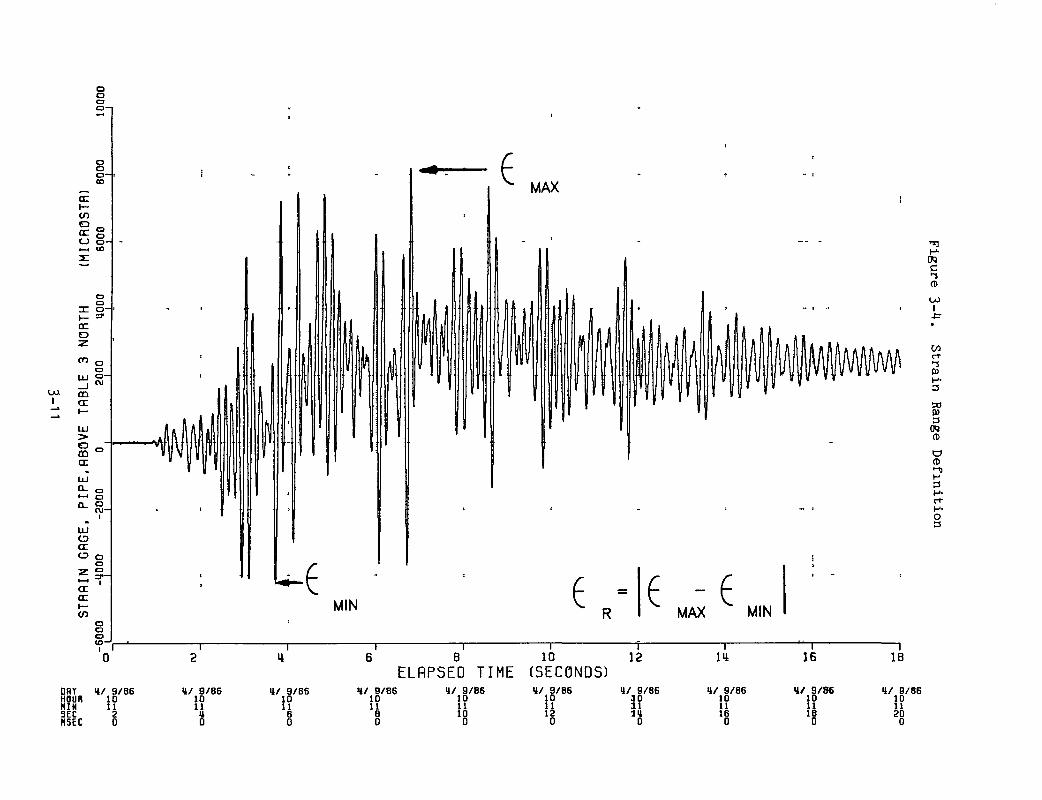
The longitudinal strain ranges observed at gage location G1 are shown
in Figure 3-3 where the strain range is defined to be the difference
between the maximum and minimum strains during any test (Figure 3-4). The
figure indicates the decreasing rate of increase of strain range with
increasing levels of seismic input.
3.1.4 Strain Ratchetting
Strain ratchetting was limited during testing to localized areas in
the test article, i.e., the failure zone and the E4 (gage location G4) and
E5 (gage location G8) elbows.
The maximum accumulated residual strains in the failure zone were
0.7^ and 9.24 in the longitudinal and circumferential directions, respec
tively (Figure 3-5). The large strain in the circumferential direction
occurred in the 2-in. wide circumferential bulge first observed after the
high-level seismic test. This bulge continued to grow during the 4-Hz sine
burst test and subsequently ruptured during the 5-Hz sine burst test.
As discussed in Section 3 of this report, wall thinning, i.e., radial
strain, in the failure zone was found to be between ^0% and 15/6. The
magnitude of these radial strains, together with the magnitudes of the 0.7%
longitudinal and 9.2% circumferential strains, confirms the results of the
3-9
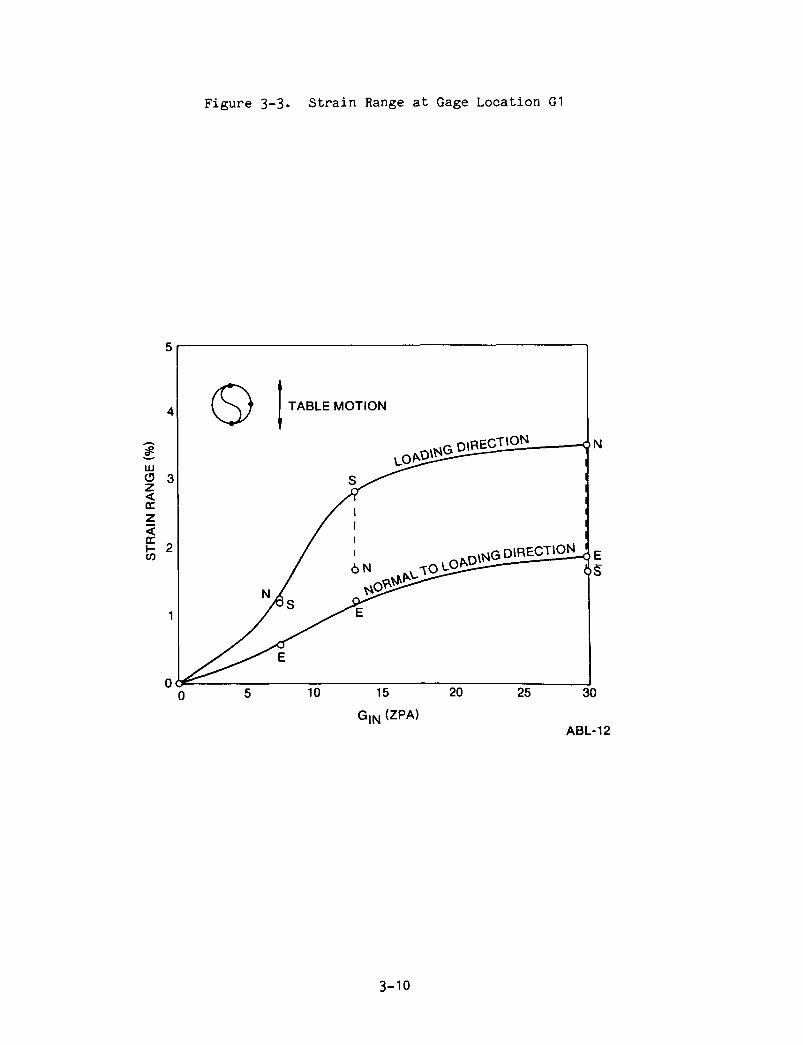
Figure 3-3. Strain Range at Gage Location Gl
O TABLE MOTION
D\RECTHi
ABL-12
3-10
0
n 01
99/6 /fi
L
Q 91
n 01
9fi/6 /TI
SI J_
0 91 II 01
99/6 /fi
0 nc It oc
99/6 /fi
21
0 21 II 01
98/6 /fi
Q 01 II 01
99/6 /TI
0 9 II 01
99/6 /Tt
0 9 II
99/6 /TI
0 fl II 01
99/6 /TI
0 33SH Z 33S II NIH 01 unoH
99/6 /TI JIUQ
(9aN033S) 01 J.
3WIi D3Scjyi3 8 9
J L
c o •H J-) •H c f^
Cl>
o OJ bO c CO
OS
CO
CO
:3-I
CO
0)
3 60
•H Cl4
I TOO
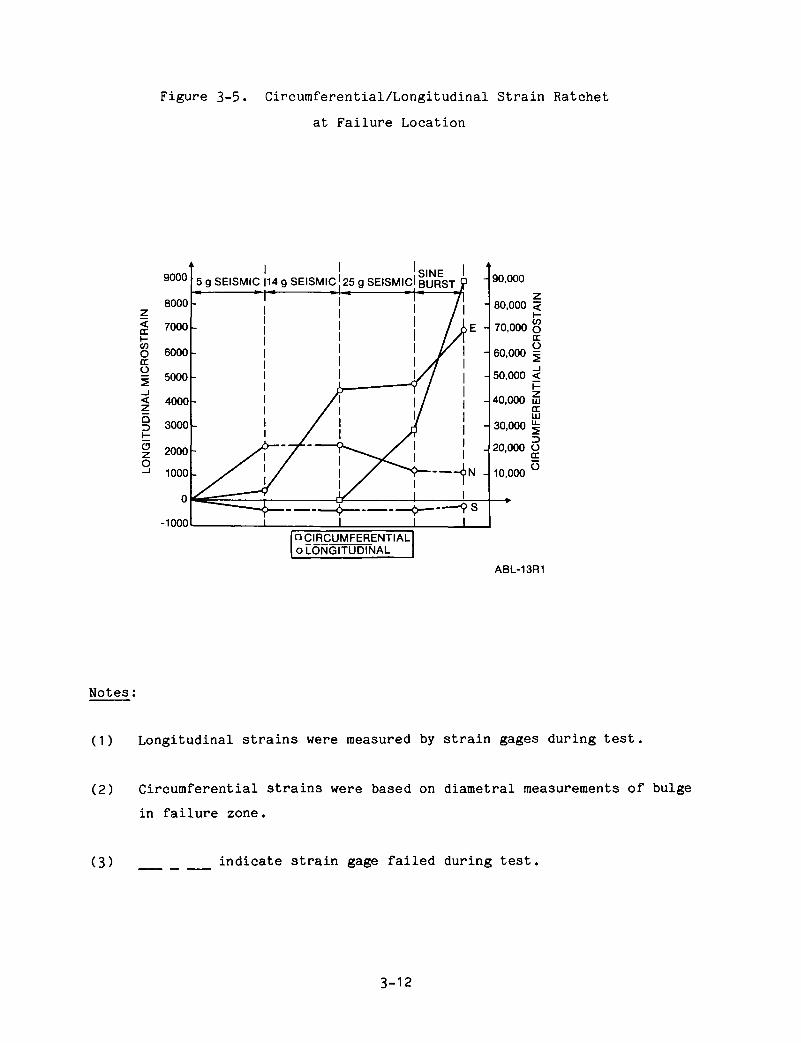
Figure 3-5. Circumferential/Longitudinal Strain Ratchet
at Failure Location
< cc H CO O cc o
o 3 H C3 Z o
14 g SEISMIC 125 g SEISMIC SINE BURST 90,000
z 80,000 <
H 70,000 o
cc
60,000 y
50,000 < 40,000 m
DC LU
30,000 ^
20,000 O cc
10,000 O
ABL-13R1
Notes;
(1) Longitudinal strains were measured by strain gages during test.
(2) Circumferential strains were based on diametral measurements of bulge
in failure zone.
(3) indicate strain gage failed during test.
3-12
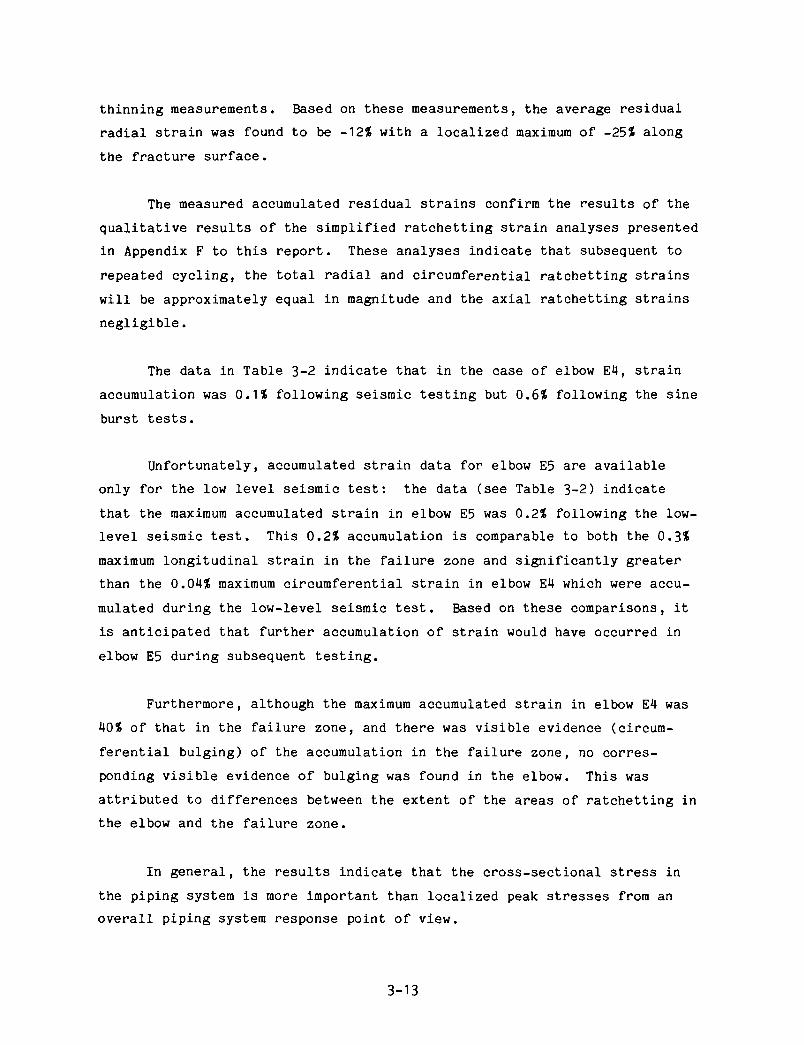
thinning measurements. Based on these measurements, the average residual
radial strain was found to be -^2% with a localized maximum of -25i along
the fracture surface.
The measured accumulated residual strains confirm the results of the
qualitative results of the simplified ratchetting strain analyses presented
in Appendix F to this report. These analyses indicate that subsequent to
repeated cycling, the total radial and circumferential ratchetting strains
will be approximately equal in magnitude and the axial ratchetting strains
negligible.
The data in Table 3-2 indicate that in the case of elbow E4, strain
accumulation was 0.1$ following seismic testing but 0.6? following the sine
burst tests.
Unfortunately, accumulated strain data for elbow E5 are available
only for the low level seismic test: the data (see Table 3-2) indicate
that the maximum accumulated strain in elbow E5 was 0.2? following the low-
level seismic test. This 0.2? accumulation is comparable to both the 0.3?
maximum longitudinal strain in the failure zone and significantly greater
than the 0.04? maximum circumferential strain in elbow E4 which were accu
mulated during the low-level seismic test. Based on these comparisons, it
is anticipated that further accumulation of strain would have occurred in
elbow E5 during subsequent testing.
Furthermore, although the maximum accumulated strain in elbow E4 was
40? of that in the failure zone, and there was visible evidence (circum
ferential bulging) of the accumulation in the failure zone, no corres
ponding visible evidence of bulging was found in the elbow. This was
attributed to differences between the extent of the areas of ratchetting in
the elbow and the failure zone.
In general, the results indicate that the cross-sectional stress in
the piping system is more important than localized peak stresses from an
overall piping system response point of view.
3-13

Figure 3-6. Horizontal Strut Loads
z < cc 1-co O
o
DUU
500
400
300
200
100
LOAD
r KJ/^ '^ ^f^J\^*t-^
p y
y <' H X
/ J^y^
y
• J
^y'^£S^^-^^\
^ ^ ^ ^ ^ ^ " ^ " ^ ^
^ 1 1 L 1 1 1
40
-30
10 J5 20 °PEAK
25
-20
O < O
Z) ir I-co
- 1 0
30
ABL-14
3-14
3.1.5 Support Loads
The horizontal rigid strut at support S2 was instrumented with strain
gages to determine strut loadings. The average strains and resulting loads
shown in Figure 3-6 are plotted as a function of seismic ZPA level and har
monic sine burst peak g level: the characteristic decreasing rate of
increase of strut load is exhibited in Figure 3-6.
3.1.6 Internal Pressure
Pressure fluctuations observed during testing are summarized in
Table 3-3.
One-per-cycle pressure fluctuations observed during testing are
believed caused by fluid inertial loads; a pipe volume reduction of approx
imately 200 to 250 in.3 would be required to produce these recorded fluctu
ations. Figure 3-7 shows the relationship between the range in pressure
fluctuations and input seismic level: the characteristic decreasing rate
of increase in range of pressure fluctuations is exhibited.
3.1.7 Pipe Permanent Set
Permanent set in the test article during seismic testing was deter
mined by monitoring the position of the pipe near accelerometer location A3
after each test. The vertical displacements after the low and intermediate
level seismic tests were negligible. At the completion of the high-level
25-g seismic test, the permanent displacements were 1-7/8 in. north,
3/4 in. east, and 11/16 in. downward. Additionally, a 6° set in the north
direction was observed in the vertical pipe above support S2.
The horizontal permanent displacements observed during seismic
testing are shown in Figure 3-8.
3.1.8 System Damping
Estimates of system equivalent viscous damping were made based on
amplification ratios obtained from spectral data and the results of the
4 Hz sine burst test. Estimates obtained for the three levels of seismic
testing are contained in Table 3-4 and Figure 3-9. Details are provided in
Appendix E to this report.
3-15
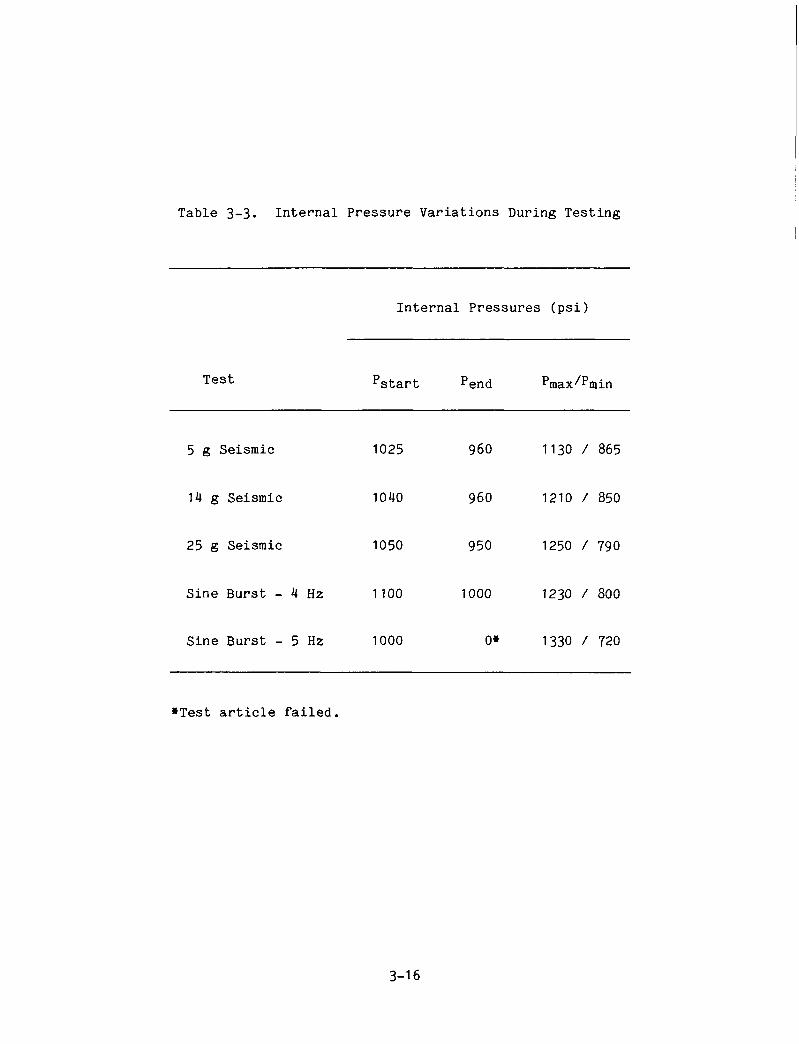
Table 3-3. Internal Pressure Variations During Testing
Internal Pressures (psi)
Test ^start Pend Pmax^P max"^min
5 g Seismic 1025 960 1130 / 865
14 g Seismic 1040 960 1210 / 850
25 g Seismic 1050 950 1250 / 790
Sine Burst - 4 Hz 1100 1000 1230 / 800
Sine Burst - 5 Hz 1000 0* 1330 / 720
•Test article failed.
3-16
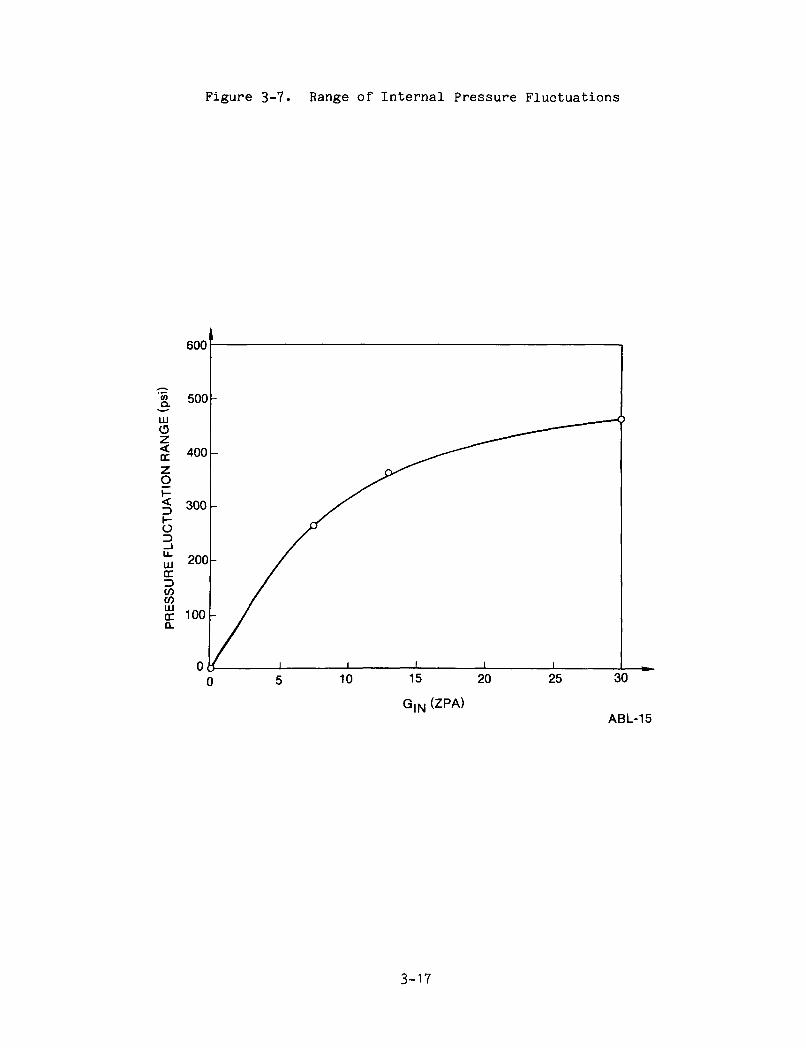
Figure 3-7. Range of Internal Pressure Fluctuations
a. UJ O z < cc z g <
O D
UJ
oc CO CO LU QC Q.
600
500
400
300
200
100
0,
-
^ ^ ^ - ^ ^ ^ ^
y^ - /
- /
/ 1 1 1 1 1
)
10 15 20
G|N (ZPA)
25 30
ABL-15
3-17
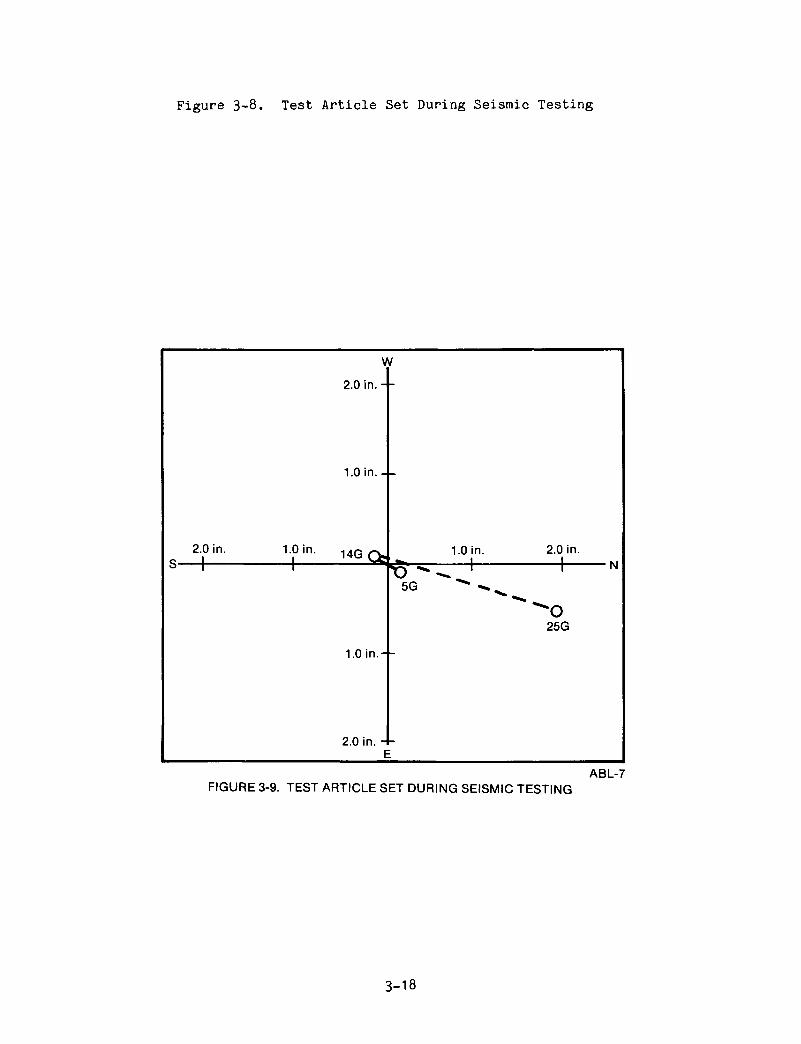
Figure 3-8. Test Article Set During Seismic Testing
2.0 in. 1 1
1.0 in. 1
1
W
2.0 i n . -
1.0 i n . -
1 4 G C ^
1.0 i n . -
2.0 in. -
-
1.0 In. 2.0 in. . ^ 1 1
5G - ^ ^ ^
25G
E
N
ABL-7 FIGURE 3-9. TEST ARTICLE SET DURING SEISMIC TESTING
3-18
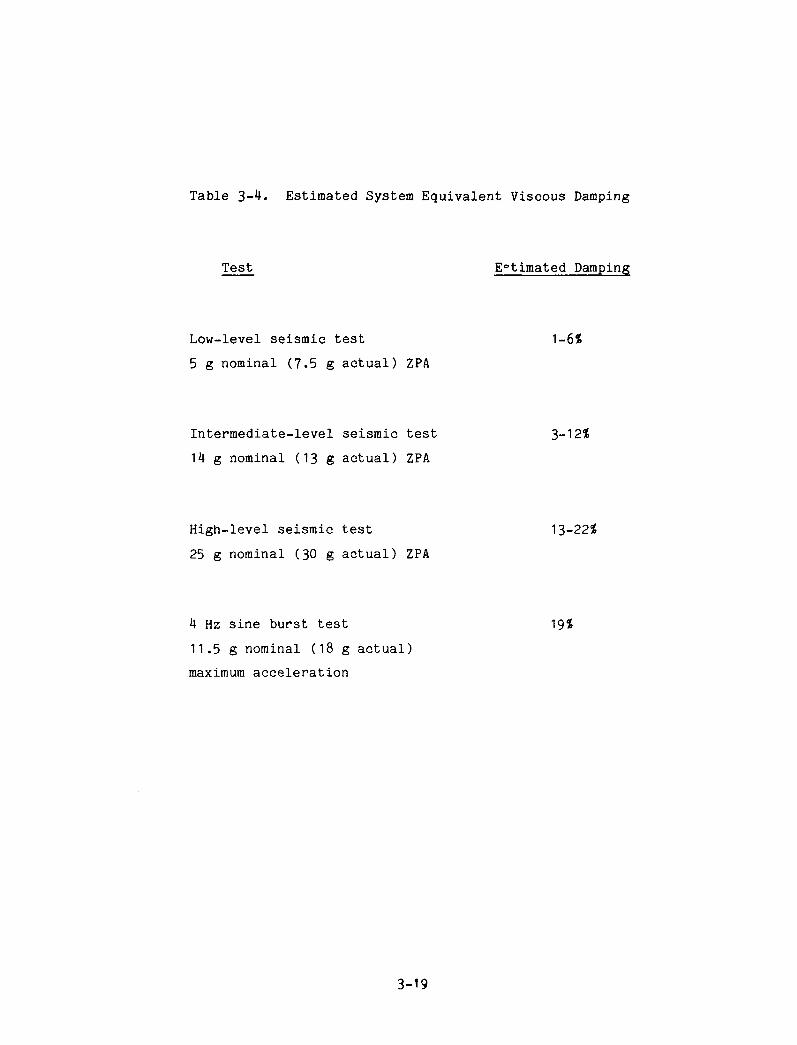
Table 3-4. Estimated System Equivalent Viscous Damping
Test
Low-level seismic test
5 g nominal (7.5 g actual)
Intermediate-level seismic
14 g nominal (13 g actual)
High-level seismic test
25 g nominal (30 g actual)
4 Hz sine burst test
11.5 g nominal (18 g actua!
maximum acceleration
E°timated Damping
1-6?
ZPA
test 3-12?
ZPA
13-22?
ZPA
19?
)
3-19

Figure 3-9. Estimated System Damping
? o z CL 5 < Q Q UJ h -<
H CO UJ
20
15
10
5
- ^ ^ ^ ^
— ^r ^ ^
. / y ^ > 1
" A -A^
» MAXIMUM
) MEAN
' MINIMUM - > ^ .^^
yy^ 1 1 1 1 1
10 15 20
SEISMIC ZPA (g)
25 30
ABL-17
3 -20
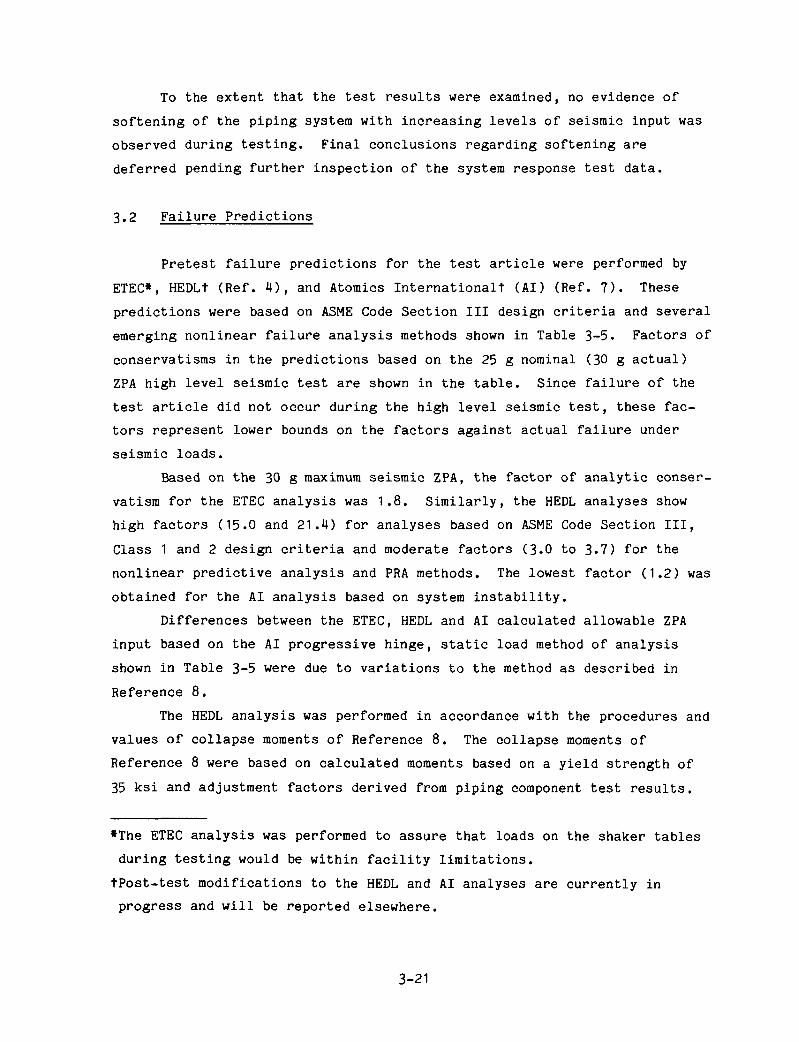
To the extent that the test results were examined, no evidence of
softening of the piping system with increasing levels of seismic input was
observed during testing. Final conclusions regarding softening are
deferred pending further inspection of the system response test data.
3.2 Failure Predictions
Pretest failure predictions for the test article were performed by
ETEC*, HEDLt (Ref. 4), and Atomics Internationalt (AI) (Ref. 7). These
predictions were based on ASME Code Section III design criteria and several
emerging nonlinear failure analysis methods shown in Table 3-5. Factors of
conservatisms in the predictions based on the 25 g nominal (30 g actual)
ZPA high level seismic test are shown in the table. Since failure of the
test article did not occur during the high level seismic test, these fac
tors represent lower bounds on the factors against actual failure under
seismic loads.
Based on the 30 g maximum seismic ZPA, the factor of analytic conser
vatism for the ETEC analysis was 1.8. Similarly, the HEDL analyses show
high factors (15.0 and 21.4) for analyses based on ASME Code Section III,
Class 1 and 2 design criteria and moderate factors (3.0 to 3.7) for the
nonlinear predictive analysis and PRA methods. The lowest factor (1.2) was
obtained for the AI analysis based on system instability.
Differences between the ETEC, HEDL and AI calculated allowable ZPA
input based on the AI progressive hinge, static load method of analysis
shown in Table 3-5 were due to variations to the method as described in
Reference 8.
The HEDL analysis was performed in accordance with the procedures and
values of collapse moments of Reference 8. The collapse moments of
Reference 8 were based on calculated moments based on a yield strength of
35 ksi and adjustment factors derived from piping component test results.
*The ETEC analysis was performed to assure that loads on the shaker tables
during testing would be within facility limitations.
tPost-test modifications to the HEDL and AI analyses are currently in
progress and will be reported elsewhere.
3-21
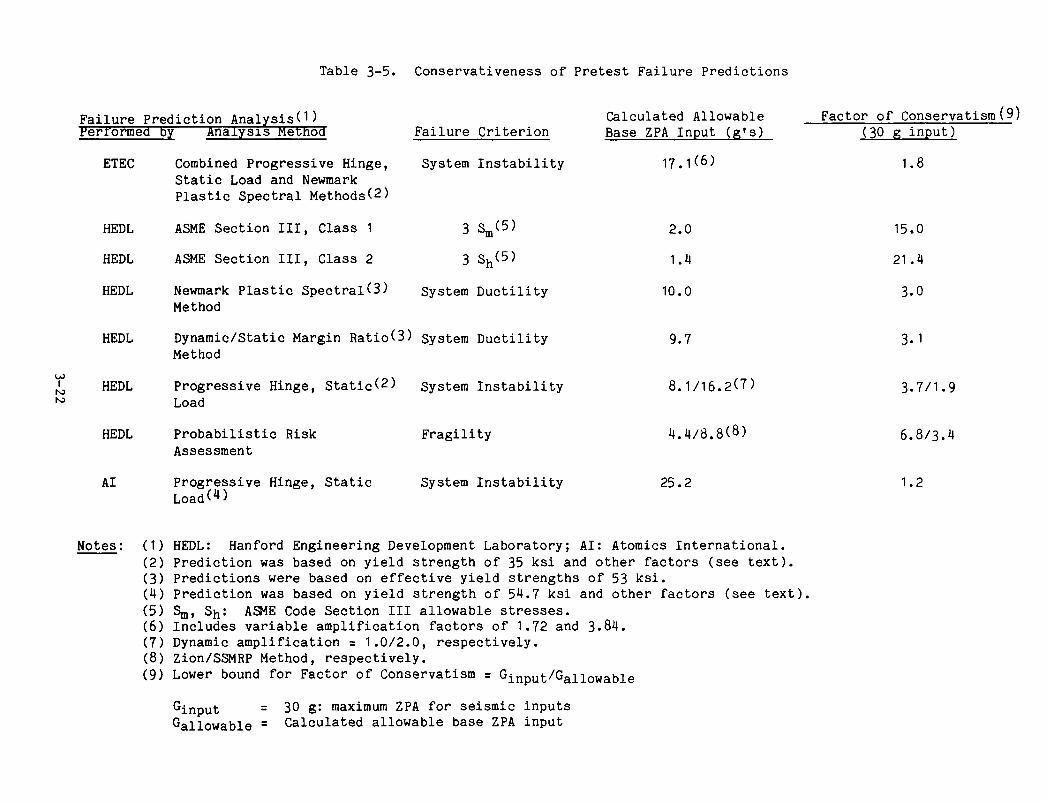
Table 3-5. Conservativeness of Pretest Failure Predictions
Failure Prediction Analysis^^) Fertormed by Analysis Methocf
I
N5
ETEC
HEDL
HEDL
HEDL
HEDL
HEDL
HEDL
AI
Combined Progressive Hinge, Static Load and Newmark Plastic Spectral Methods(2)
ASME Section H I , Class 1
ASME Section III, Class 2
Newmark Plastic Spectral(3) Method
Failure Criterion
System Instability
3 S„(3)
3 Sh(5)
System Ductility
Dynamic/Static Margin Ratio(3) System Ductility Method
Progressive Hinge, Static(2) System Instability Load
Probabilistic Risk Assessment
Progressive Hinge, Static Load(^)
Fragil i ty
System Ins t ab i l i t y
Calculated Allowable Base ZPA Input (g ' s )
17.1(6)
2.0
1.4
10.0
9.7
8.1/16.2(7)
4.4/8.8(8)
25.2
Factor of Conservatism(9) (30 g input)
1.8
15.0
21.4
3.0
3.1
3.7/1.9
6.8/3.4
1.2
Notes: (1) HEDL: Hanford Engineering Development Laboratory; AI: Atomics International. (2) Prediction was based on yield strength of 35 ksi and other factors (see text). (3) Predictions were based on effective yield strengths of 53 ksi. (4) Prediction was based on yield strength of 54.7 ksi and other factors (see text), (5) Sm, Sh: ASME Code Section III allowable stresses. (6) Includes variable amplification factors of 1.72 and 3.84. (7) Dynamic amplification = 1.0/2.0, respectively. (8) Zion/SSMRP Method, respectively. (9) Lower bound for Factor of Conservatism = Ginput/GaHowable
^input = 30 g: maximum ZPA for seismic inputs ('allowable = Calculated allowable base ZPA input
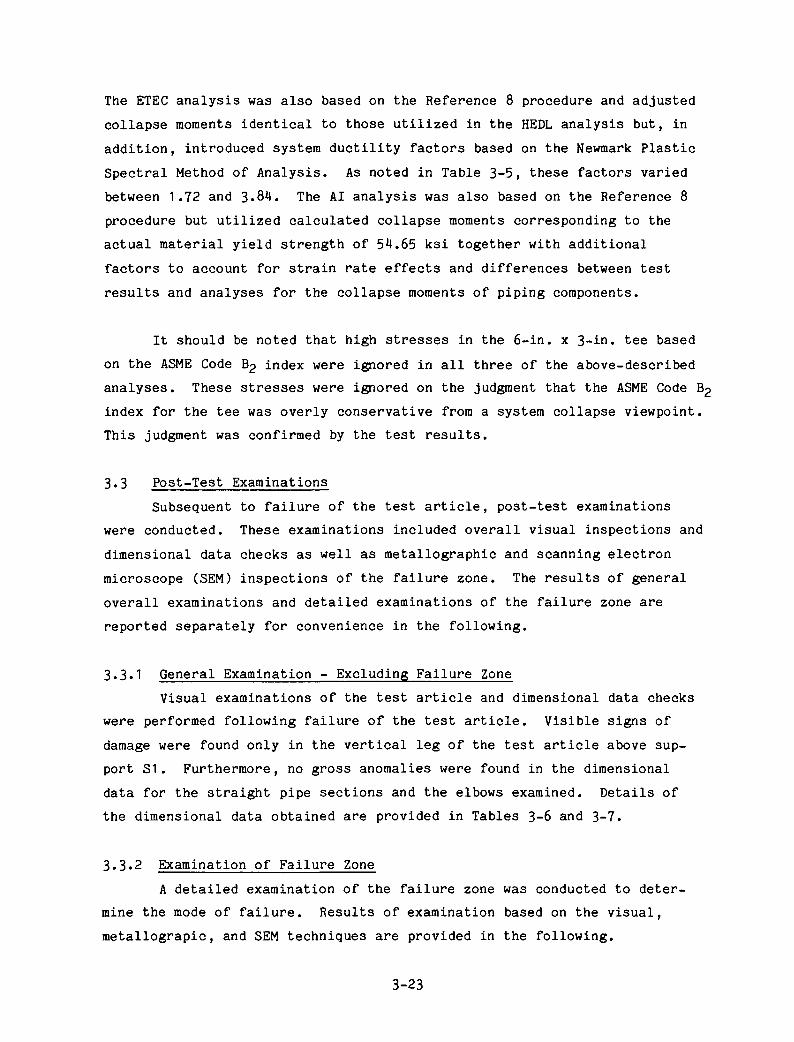
The ETEC analysis was also based on the Reference 8 procedure and adjusted
collapse moments identical to those utilized in the HEDL analysis but, in
addition, introduced system ductility factors based on the Newmark Plastic
Spectral Method of Analysis. As noted in Table 3-5, these factors varied
between 1.72 and 3.84. The AI analysis was also based on the Reference 8
procedure but utilized calculated collapse moments corresponding to the
actual material yield strength of 54.65 ksi together with additional
factors to account for strain rate effects and differences between test
results and analyses for the collapse moments of piping components.
It should be noted that high stresses in the 6-in. x 3-in. tee based
on the ASME Code B2 index were ignored in all three of the above-described
analyses. These stresses were ignored on the judgment that the ASME Code B2
index for the tee was overly conservative from a system collapse viewpoint.
This judgment was confirmed by the test results.
3.3 Post-Test Examinations
Subsequent to failure of the test article, post-test examinations
were conducted. These examinations included overall visual inspections and
dimensional data checks as well as metallographic and scanning electron
microscope (SEM) inspections of the failure zone. The results of general
overall examinations and detailed examinations of the failure zone are
reported separately for convenience in the following.
3.3.1 General Examination - Excluding Failure Zone
Visual examinations of the test article and dimensional data checks
were performed following failure of the test article. Visible signs of
damage were found only in the vertical leg of the test article above sup
port SI. Furthermore, no gross anomalies were found in the dimensional
data for the straight pipe sections and the elbows examined. Details of
the dimensional data obtained are provided in Tables 3-6 and 3-7.
3.3.2 Examination of Failure Zone
A detailed examination of the failure zone was conducted to deter
mine the mode of failure. Results of examination based on the visual,
metallograpic, and SEM techniques are provided in the following.
3-23
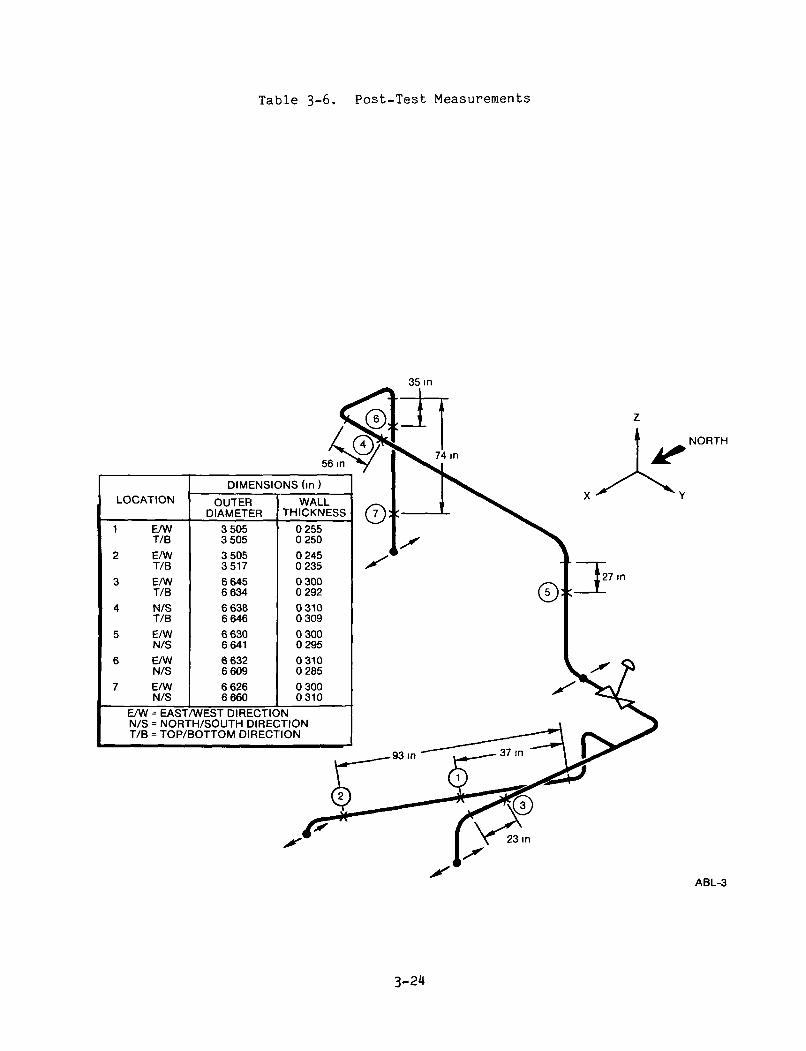
Table 3-6. Post-Test Measurements
35 in
LOCATION
1 E m T/B
2 E/W T/B
3 E/W T/B
4 N/S T/B
5 E/W N/S
6 E/W N/S
7 E m N/S
DIMENSIONS (in)
OUTER DIAMETER
3 505 3 505
3 505 3 517
6 645 6 634
6 638 6 646
6 630 6 641
6 632 6 609
6 626 6 660
WALL THICKNESS
0 255 0 250
0 245 0 235
0 300 0 292
0 310 0 309
0 300 0 295
0 310 0 285
0 300 0310
E m = EAST/WEST DIRECTION N/S = NORTH/SOUTH DIRECTION T/B = TOP/BOTTOM DIRECTION
© :3'
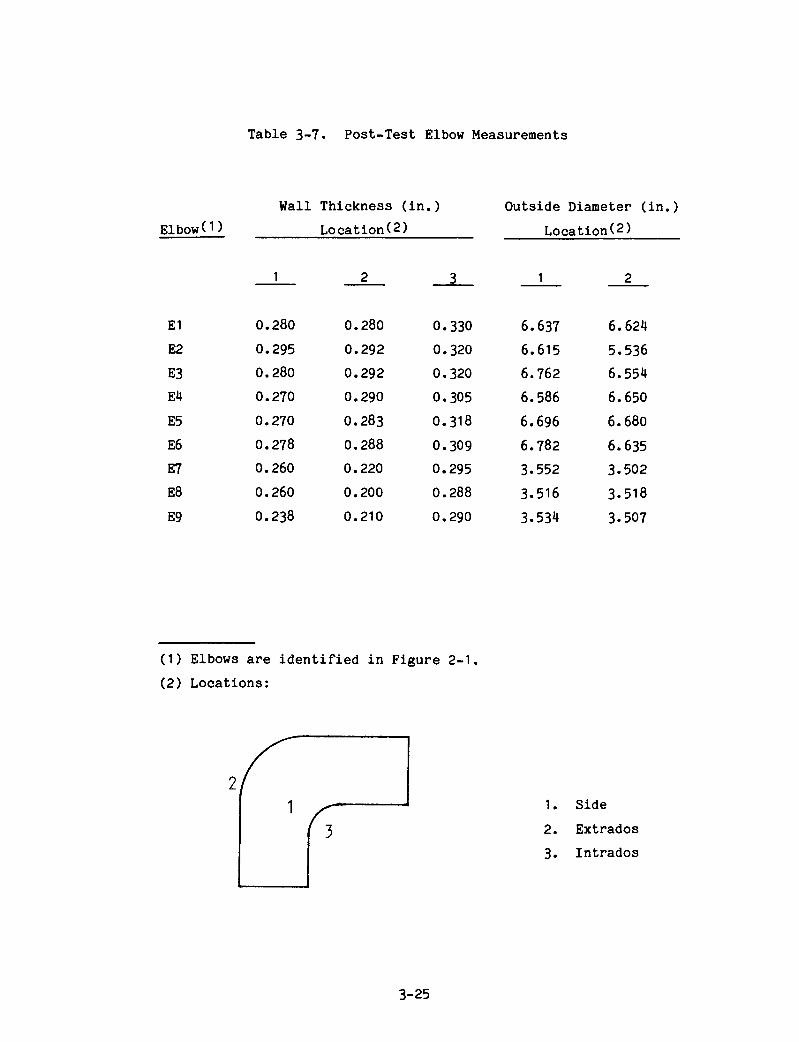
Table 3-7. Post-Test Elbow Measurements
Elbowd)
El
E2
E3
E4
E5
E6
E7
E8
E9
Wall
1
0.280
0.295
0.280
0.270
0.270
0.278
0.260
0.260
0.238
Thickness (in Location(2)
2
0.280
0.292
0.292
0.290
0.283
0.288
0.220
0.200
0.210
. )
3
0.330
0.320
0.320
0.305
0.318
0.309
0.295
0.288
0.290
Outside Diameter ( in . ) Location(2)
1
6.637
6.615
6.762
6.586
6.696
6.782
3.552
3.516
3.534
2
6.624
5.536
6.554
6.650
6.680
6.635
3.502
3.518
3.507
(1) Elbows are identified in Figure 2-1
(2) Locations:
1. Side
2. Extrados
3. Intrados
3-25

Visual Examination - Visual examinations of the failure zone found
that in addition to the primary through-wall fracture, cracking of the
internal surface as well as wall thinning and diametral growth had
occurred in the highly strained, plastically deformed, circumferential
bulge. Additionally, measurements confirmed that less severe diametral
growth had also occurred in the vertical leg of pipe within 2 ft above the
failure zone.
The examination of the primary through-wall fracture (Figure 3-10)
indicated that failure was due principally to overloading under tension and
plane stress conditions during the failure cycle. Most of the south side
of the fracture surface exhibited a double slant (V-shaped) fracture, and
the east and west sides exhibited a single slant fracture at approximately
45°. These slant fractures are typical for the indicated failure mode.
Additionally, no evidence of fatigue failure was found. Although much of
the fracture surface on the south side was deformed during impact of the
mating halves during fracture closure, no beach marks or flat fractures
were found anywhere.
Additional examinations of the failure zone found multiple circum
ferentially oriented surface cracks. These cracks were located on the
south side of the inside surface of the circumferentially bulged area above
and below the primary fracture. The cracks were found around approximately
one-third of the circumference of the bulge. Crack lengths were approxi
mately 1/8 to 3/16 in. long on the south side of the bulge and decreased in
length toward the east and west sides. Subsequent metallographic examina
tions found that the cracks were blunt and of depth between 0.050 and
0.070 in. (Figure 3-12).
Post-test diametric and wall thickness data in the vertical leg of
pipe up to 5 ft above the failure zone are presented in Table 3-8 and
Figure 3-11. The diametric data indicated that diametic growth (up to 9?)
had occurred in the first foot of pipe above the fracture but was attenu
ated at two feet away from the fracture. The wall thickness data indicated
that thinning on the east and west sides of the pipe was less severe than
3-26
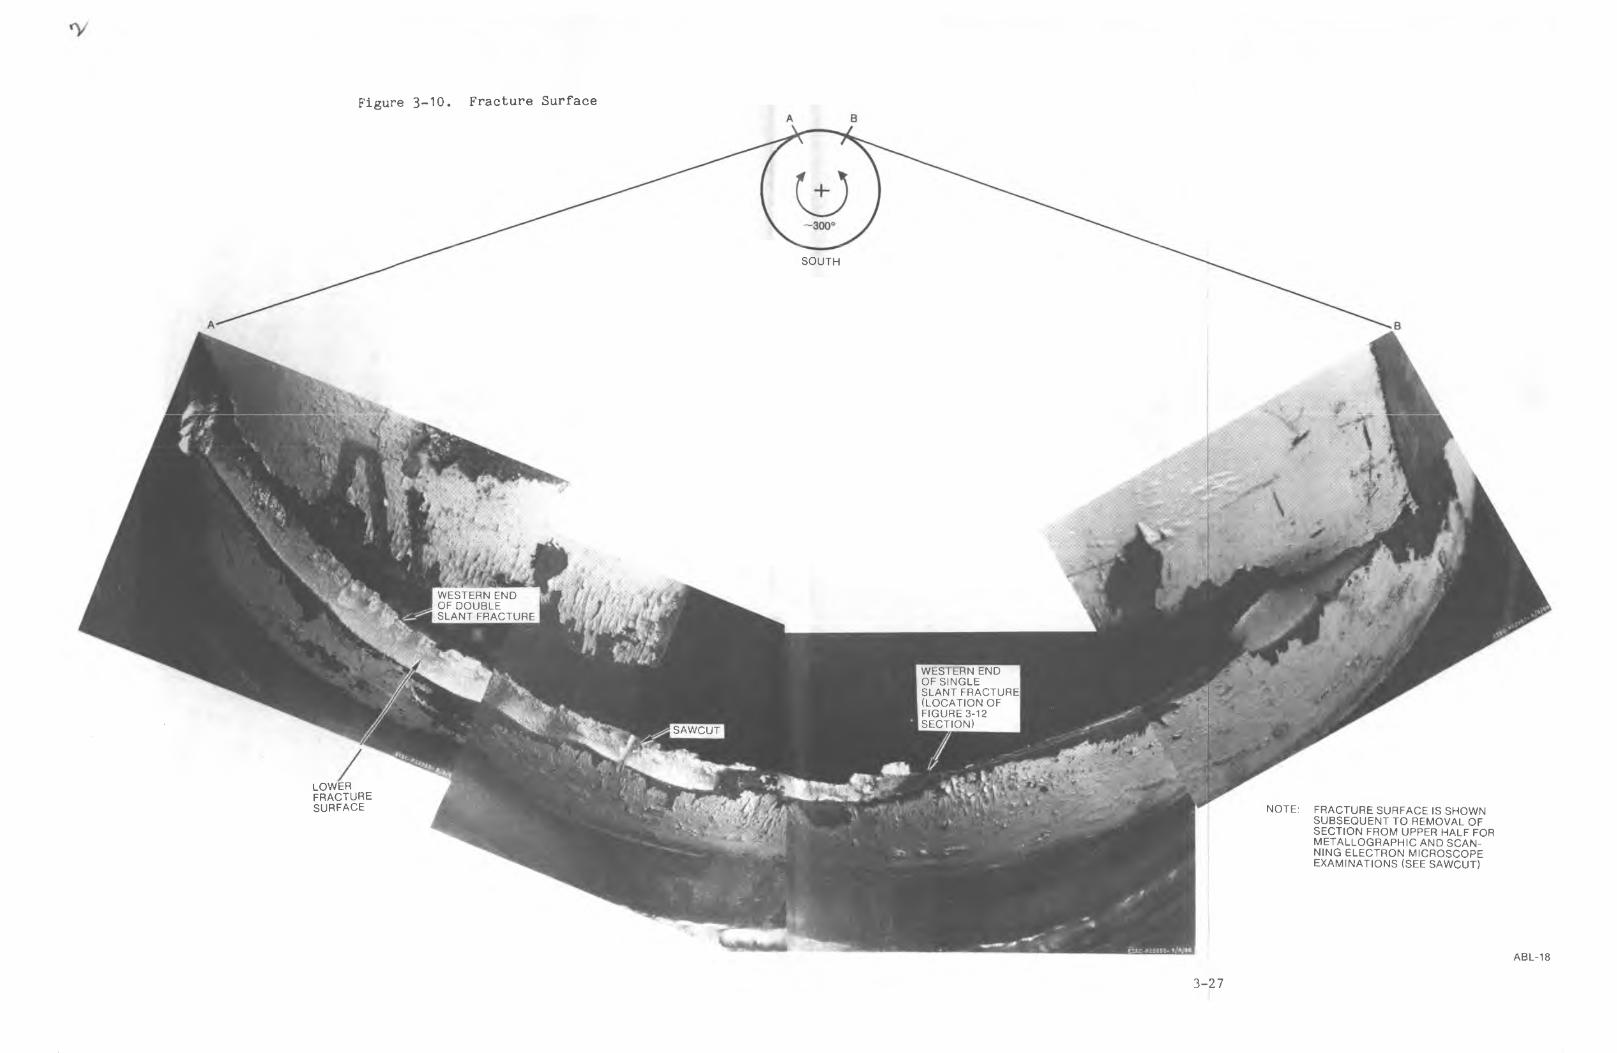
Figure 3-10 . Fracture Surface
SO U T H
mmm:.W ESTERN END OF DO U B LE SLANT F R A C TU R E
W E STE R N END O F SIN GLE SLA N T F R A C TU R E (L O C A TIO N OF FIG U R E 3-12 S E C T IO N )
SAW CU T
» -
Il o w e rF R A C TU R ES U R F A C E NOTE: F R A C T U R E S U R F A C E IS SH O W N
S U B S E Q U E N T T O REMOVAL O F S E C T IO N FROM U P P ER HALF FOR M ET A LL O G R A P H IC AND S C A N NING E L E C T R O N M IC R O S C O P E EXAMINATIONS (SEE SA W CU T)
ABL-18
3-27
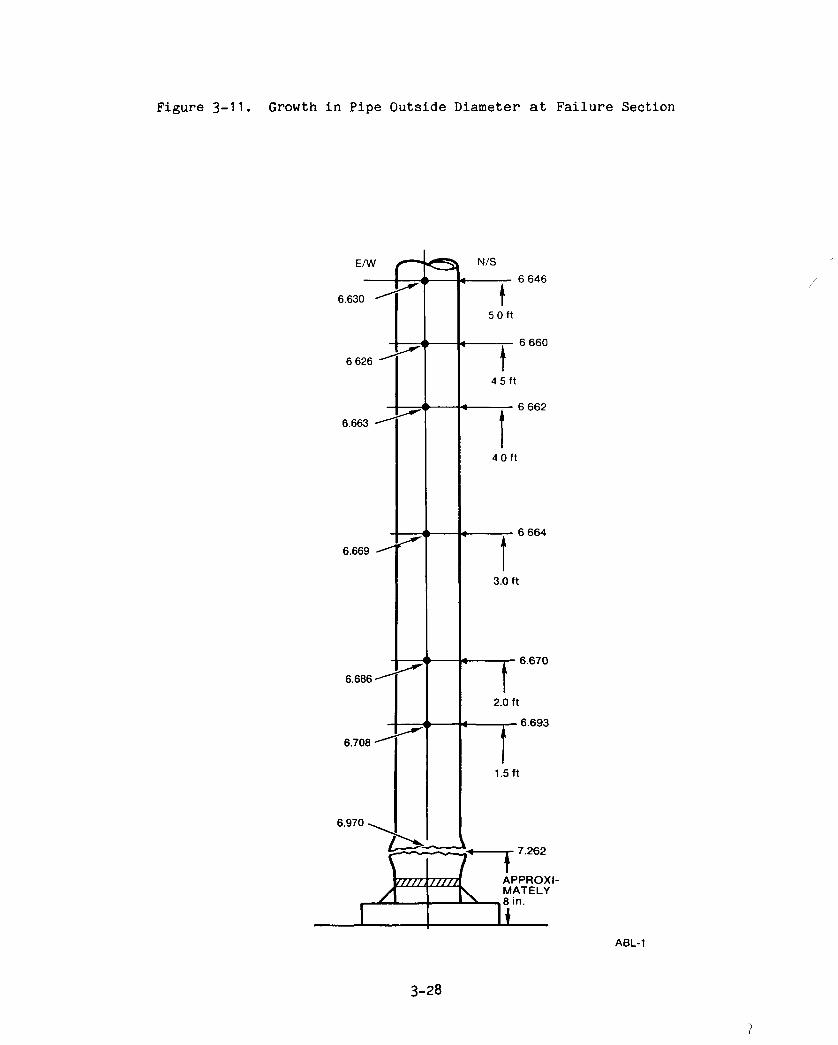
Figure 3-11. Growth in Pipe Outside Diameter at Failure Section
E/W
6.630
6 626
6.663
6.669
6.686 -
6.708
6.970
<» •
N/S
6 646
5 0 ft
6 660
4 5 ft
6 662
4 0 ft
6 664
3.0 ft
6.670
2.0 ft
• 6.693
1.5 ft
7.262
ABL-1
3-28
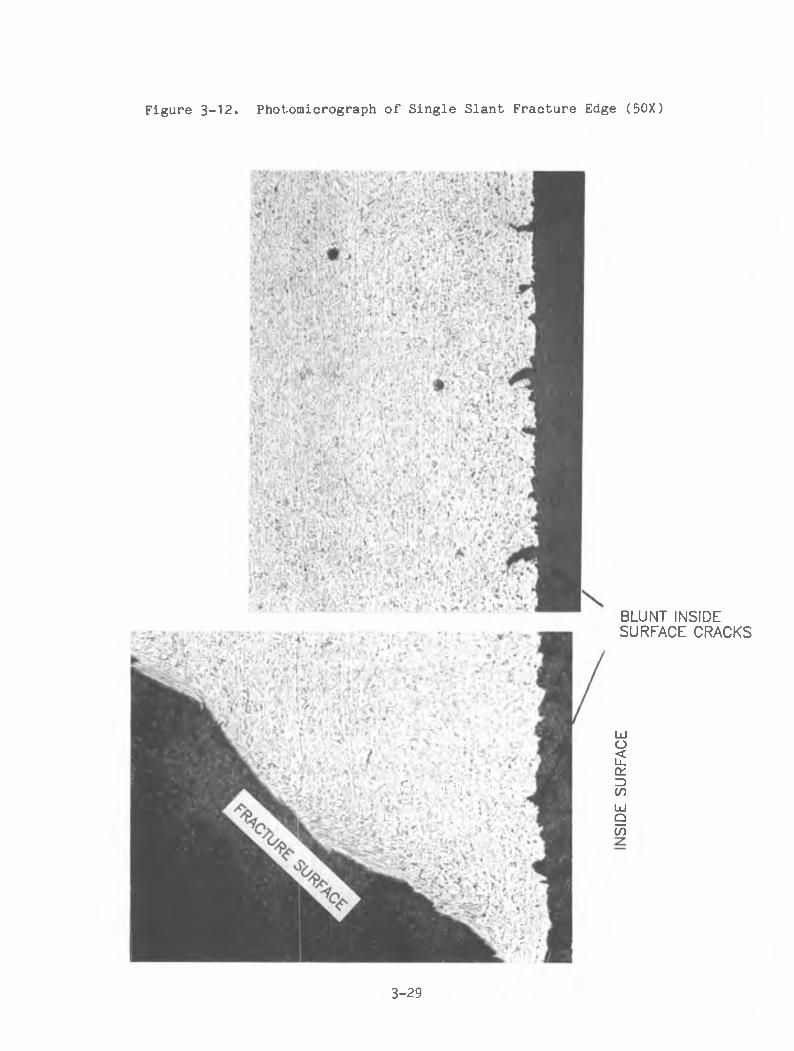
Figure 3-12. Photomicrograph of Single Slant Fracture Edge (50X)
\'i
5 . ' - ’ ' ' -'u ^V-" - ' 1 *r-V-i ■'*■ '
pH -.,
r*v - V'»1
kX'''+ i' *
BLUNT INSIDE SURFACE CRACKS
UJoiftt:3(/)UJ9(/)
3-29
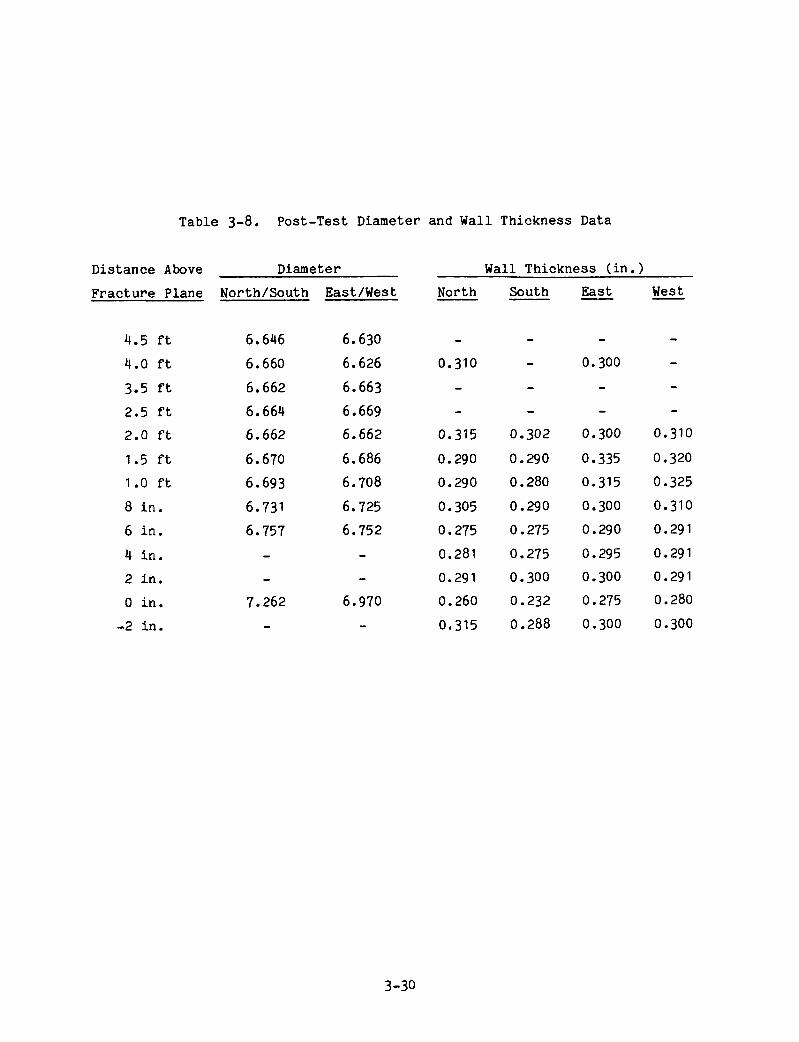
Table 3-8. Post-Test Diameter and Wall Thickness Data
Wall Thickness (in.)
North South East West
0.310 - 0.300
0.315
0.290
0.290
0.305
0.275
0.281
0.291
0.260
0.315
0.302
0.290
0.280
0.290
0.275
0.275
0.300
0.232
0.288
0.300
0.335
0.315
0.300
0.290
0.295
0.300
0.275
0.300
0.310
0.320
0.325
0.310
0.291
0.291
0.291
0.280
0.300
3-30
Distance Above
Fracture Plane
4.5 ft
4.0 ft
3.5 ft
2.5 ft
2.0 ft
1.5 ft
1.0 ft
8 in.
6 in.
4 in.
2 in.
0 in.
-2 in.
Diameter
North/South
6.646
6.660
6.662
6.664
6.662
6.670
6.693
6.731
6.757
-
-
7.262
—
East/West
6.630
6.626
6.663
6.669
6.662
6.686
6.708
6.725
6.752
-
-
6.970
-
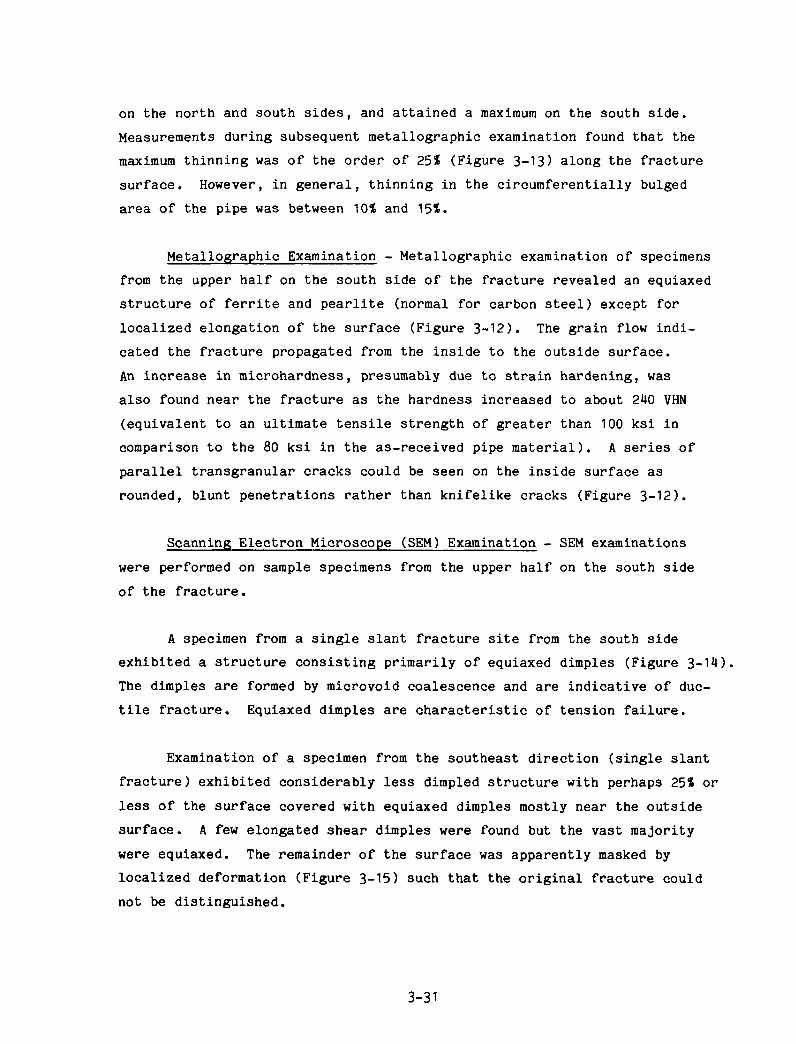
on the north and south sides, and attained a maximum on the south side.
Measurements during subsequent metallographic examination found that the
maximum thinning was of the order of 25? (Figure 3-13) along the fracture
surface. However, in general, thinning in the circumferentially bulged
area of the pipe was between 10? and 15?.
Metallographic Examination - Metallographic examination of specimens
from the upper half on the south side of the fracture revealed an equiaxed
structure of ferrite and pearlite (normal for carbon steel) except for
localized elongation of the surface (Figure 3-12). The grain flow indi
cated the fracture propagated from the inside to the outside surface.
An increase in microhardness, presumably due to strain hardening, was
also found near the fracture as the hardness increased to about 240 VHN
(equivalent to an ultimate tensile strength of greater than 100 ksi in
comparison to the 80 ksi in the as-received pipe material). A series of
parallel transgranular cracks could be seen on the inside surface as
rounded, blunt penetrations rather than knifelike cracks (Figure 3-12).
Scanning Electron Microscope (SEM) Examination - SEM examinations
were performed on sample specimens from the upper half on the south side
of the fracture.
A specimen from a single slant fracture site from the south side
exhibited a structure consisting primarily of equiaxed dimples (Figure 3-14).
The dimples are formed by microvoid coalescence and are indicative of duc
tile fracture. Equiaxed dimples are characteristic of tension failure.
Examination of a specimen from the southeast direction (single slant
fracture) exhibited considerably less dimpled structure with perhaps 25? or
less of the surface covered with equiaxed dimples mostly near the outside
surface. A few elongated shear dimples were found but the vast majority
were equiaxed. The remainder of the surface was apparently masked by
localized deformation (Figure 3-15) such that the original fracture could
not be distinguished.
3-31
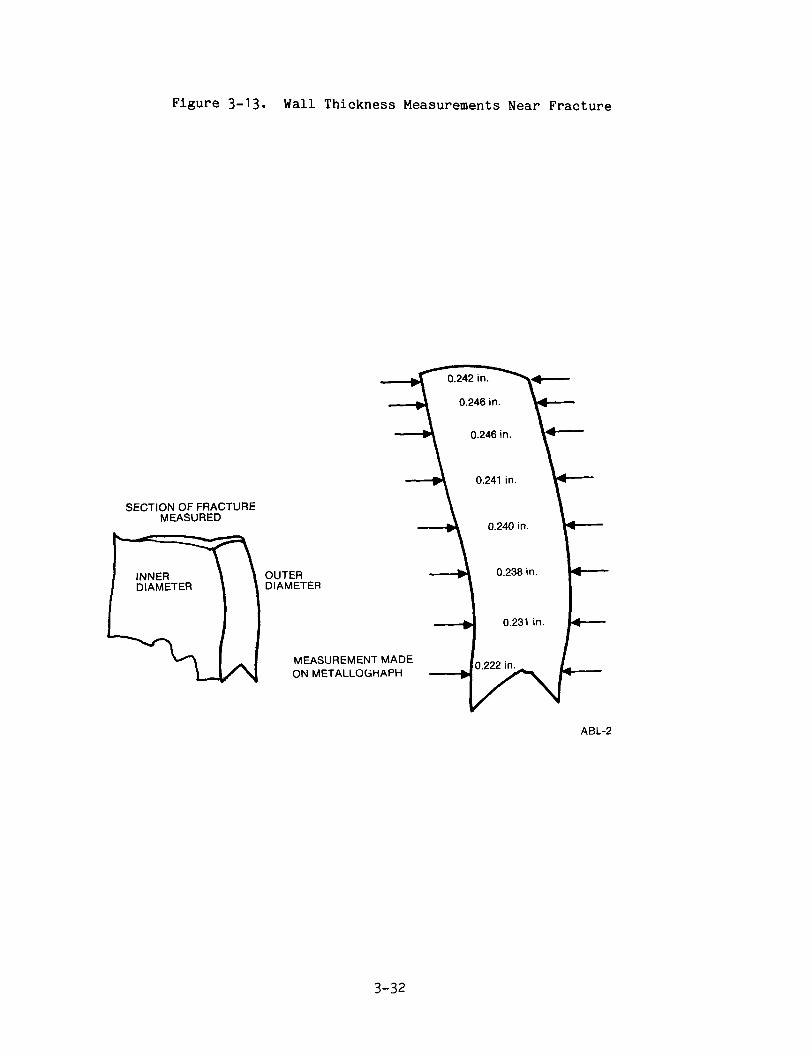
Figure 3-13. Wall Thickness Measurements Near Fracture
0.242 in.
0.246 in.
0.246 in.
0.241 in.
SECTION OF FRACTURE MEASURED
OUTER DIAMETER
MEASUREMENT MADE ON METALLOGHAPH
0.240 in.
0.238 in
ABL-2
3-32

Figure 3-14. SEM Photograph o f F rac tu re Surface (425X)
( A
^ f ^ ' i F . * . - ' M »>
s?
3-33

Figure 3-15. SEM Photograph of Fracture Surface Exhibiting Deformed Structure (900X)
3-34

All surfaces were scanned for fatigue striations but none were found.
However, even if fatigue striations had been present on the fresh fracture
surface, they were probably obliterated by the deformation during crack clo
sure impact. The absence of striations did not preclude the possibility of
fatigue fracture since striations are not always found on fatigue fractures.
Failure Mode - Based on visual, SEM, and metallographic examination,
the fracture was primarily a ductile tension failure. Some brittle frac
ture could have occurred and been masked by deformation after fracture, but
no evidence of fatigue was found. The cumulative fatigue usage factor for
the entire test series was estimated by HEDL to be between 0.13 and 0.27
(Reference 4). Fracture initiated on the inside surface and propagated to
the outside.
Since the cumulative fatigue usage factor was small and the fracture
appeared to be a ductile tension failure, fracture apparently occurred
because the ultimate tensile strength of the material was exceeded. Since
wall thinning was observed at the fracture (less than 0.25 in. vs 0.31 in.
wall), it may be postulated that prior to the failure cycle, the pipe was
loaded above the yield strength but below the ultimate strength of the
material and that subsequently ductile tension failure occurred during the
failure cycle when the ultimate tensile strength was exceeded.
3-35
4.0 CONCLUSIONS AND RECOMMENDATIONS
Testing to failure of the 6-in. piping system was achieved in the
ETEC Seismic Fragility Test Facility. Failure of the test article did not
occur during the 30 g ZPA seismic loading but occurred during the 5 Hz sine
burst test. Based on the test data and observations, the following conclu
sions and recommendations were developed.
4.1 Conclusions
Relative to the objectives of the test program, it was concluded
that:
Test to Failure
Testing to failure of moderate-sized piping systems is currently
achievable in the ETEC Seismic Fragility Test Facility. Such testing is
essential for proper assessment of conservatisms in current-design criteria
and proposed analytic methodologies and provides experimental justification
for more realistic seismic design criteria currently under consideration
for existing codes and standards.
Although the 6-in. piping system did not fail during seismic testing
at loading levels in excess of that predicted to cause failure, the test
demonstrated the feasibility of testing to failure using sine burst tests.
However, in retrospect, it was felt that failure under seismic loadings
could have been achieved by subjecting the piping system to either:
(1) an increased level of seismic loading with ZPA of approximately 50 g
or (2) repeated application of the 25 g ZPA seismic loading.
4-1
Characterization of Dynamic Response
The test results indicated an increasing resistance of the piping
system to respond to increasing levels of seismic loadings. This charac
teristic was exhibited by the overall response of the piping system as
measured by the peak accelerations or amplifications (Figures 3-1 and 3-2).
This characteristic was also demonstrated by the local response as measured
by strain ranges (Figure 3-3) in the vicinity of the failure zone.
Strain gage data indicated that minor redistribution of internal
loadings occurred in the highly stressed elbows due to local yielding.
Otherwise, the strains and associated stresses in straight sections of pipe
remote from elbows and supports were in the material elastic range. The
average circumferential, longitudinal, and radial residual strains at the
failure location were 9.2?, 0.7? and -12?, respectively, which is in good
agreement with the qualitative results of analyses presented in Appendix F,
indicating equal circumferential and radial ratcheting strains and negli
gible longitudinal ratchetting strains.
Based on the test results, equivalent viscous damping was estimated
to be between 1-6?, 3-12? and 13-22? for the low, intermediate and high
level seismic tests, respectively, and 19? for the 4 Hz sine burst test.
Failure Mode
Failure, i.e., rupture, of the test article was attributed to incre
mental ratchetting due to internal pressure that resulted in wall thinning
and subsequent fracture due to tensile overloading during the failure cycle.
Although no evidence of fatigue failure was found, the cumulative usage
factor for the entire test series was estimated to be between 0.13 and 0.27.
Failure was initiated locally on the inside surface of the pipe with rapid
circumferential propagation subsequent to growth through the wall.
Failure occurred in a circumferential bulge observed after high level
seismic testing in the vertical leg of pipe above support SI . Increase in
growth and subsequent rupture occurred during the 5 Hz sine burst test.
Local wall thinning of up to 25? was found along the fracture surface
during post-test examinations.
4-2
Failure Predictions
Based on the maximum ZPA of 30 g observed during the high level
seismic test, conservative factors against actual failure of between 15
and 20 were obtained for allowable g loadings based on ASME Code criteria;
between 3.0 and 3.7 for several nonlinear failure analyses performed by
HEDL and 1.2 and 1.8 for failure analyses performed by AI and ETEC, respec
tively. Additionally, factors of 3.4 and 6.8 were obtained for PRA analy
ses performed by HEDL. The HEDL inelastic dynamic analyses predicted no
instability at 20 g, corresponding to a factor of 1.5.
It should be noted, however, that none of the above described methods
of failure analyses were able to predict the failure mode observed in the
5 Hz sine burst test. The failure criteria utilized in the analyses were
based on ASME Code design criteria, system ductility or instability or fra
gility criteria. The 1.2 factor of conservatism reported above for the AI
analyses is, therefore, fortuitous.
The test results demonstrate that piping systems are inherently able
to withstand much larger dynamic loadings than currently permitted by
design criteria in existing codes and standards or collapse capacity pre
dicted by several proposed nonlinear methods of failure analysis.
4.2 Observations and Recommendations
Based on.assessments of the results of this test program and the
results of two other Government-funded fragility piping system test
programs completed within the past 2 years (References 5 and 9), the
following recommendations were formulated.
1) Although the three test programs indicated that piping systems
have greater reserves of strength than currently accounted for in
existing codes and standards and nonlinear failure prediction
analyses, it appears that changes to design criteria in existing
4-3
codes and standards should be coordinated with the development of
a comprehensive theory of failure of piping systems and the vali
dation of such a theory by critical testing. This theory should
be capable of identifying the three modes of failure observed in
the aforementioned (Jovernment-funded test programs. In particu
lar, the overall collapse mode in the DOE/HEDL (Reference 9) 1-in.
pipe test, the local collapse/fatigue failure mode in the DOE/ETEC
(Reference 5) 3-in. pipe test, and the local ratchetting/tensile
overloading failure mode in the current test, as well as all
other available seismic failure mode test data, should be identi
fiable by the theory.
The failure of the piping system was attributed to the effects of
internal pressure during high level cyclic loading. These
effects were restricted to the critical failure cross-section.
The ratchetting strains in the failure zone appear to agree with
the results of a simplified ETEC analysis. It is recommended
that simple tests and more detailed analyses be conducted to con
firm the results of this simplified ETEC analysis.
Further, relative to failure modes, it is unclear if liquid
filled, internally pressurized piping systems would exhibit a
greater propensity towards failure modes which are locally ini
tiated than nonfluid-filled systems. The possible detrimental
effects of increases in pressure in surface cracks internal to
the pipe due to fluid entrapment during crack closure are
currently unknown. (As previously noted, cracks in the failure
zone were found to be blunt - see Figure 3-12.) Investigations
of the effects of internal pressure in fluid-filled systems are,
therefore, recommended.
4-4

4) Current failure analyses of piping systems only address piping
failure. In view of the inherent strength of the piping, and the
numerous reported incidents of pipe support failure in piping
systems, it is also recommended that failure analyses be extended
to include the effects of support failure.
5) The subject test program served to identify the need to conduct
extensive pretest and in-test examinations in future test
programs. Such examinations should include monitoring of wall
thickness and diametric measurements as well as crack detection
and growth during testing. These examinations will provide a
better understanding of the failure initiation and progression
towards ultimate failure observed during testing.
6) The subject test program also identified the need to develop
reliable strain gage installation techniques for high level dyna
mic seismic testing. Valuable data were lost during testing due
to gage installation failures.
4-5

REFERENCES
NUREG-1061, Vol. 2, "Report of the U.S. Nuclear Regulatory Commission
Piping Review Committee, Evaluation of Seismic Designs - A Review of
Seismic Design Requirements for Nuclear Power Plant Piping," April 1985.
EPRI NP-3916, "High-Amplitude Dynamic Tests of Prototypical Nuclear
Piping Systems," February 1985.
NEDC-31272, W.F. English, "Piping and Fitting Dynamic Reliability
Program, First Semi-Annual Progress Report, May 1985 - October 1985",
November 1985.
HEDL-TC-2779, M.J. Anderson et al, "Draft Report, Pre-Test Failure
Predictions, Post-Test Analyses, and Comparisons to Test Results of
the NRC/ETEC Seismic Fragility Demonstration Piping Test," June I986.
ETEC test report on results of testing to failure of a 3-in. diameter
piping loop (to appear).
S. Levy and J.P.D. Wilkinson, "Generation of Artificial Time Histories,
Rich in All Frequencies, from Given Response Spectra," Paper K 1/7,
Trans, of the Third International Conference on Structural Mechanics
in Reactor Technology," London, United Kingdom, September 1975.
Private communication, K. Jaquay to A. Onesto, "6-inch Fragility
Test," April 1986.
K. Jaquay to A. Onesto, "Required Shaker Table Capacity to Collapse a
Portion of an Unpressurized, Representative LWR Piping Line,"
March 12, 1984.
5-1

HEDL-TME-85-24, M.R. Lindquist et al, "High-Level Dynamic Testing and
Analytical Correlations for a One-Inch Diameter Piping System,"
February 1986.
H.G. Edmunds and F.J. Beer, Notes on Incremental Collapse in Pressure
Vessels, Journal of Mechanical Engineering Science, Vol.3, No.3, 1961.
5-2

APPENDIX A
FACILITY DESCRIPTION
1. Facility Description
2. Fragility Test Data Acquisition

1. Facility Description
The ETEC Seismic Fragility Test Facility is made up of four major
systems: (1) energy storage system, (2) table/actuator components,
(3) hydraulic power supply, and (4) digital computer controlled system.
a. Energy Storage System
The energy storage system is comprised of twelve 30-gallon piston
accumulators manifolded at the output to delivery pressurized oil to as
many as four tables by way of high pressure flex hoses. The top side of
the pistons are driven by 3200 psi of gaseous nitrogen with a storage
capacity of more than 1000 ft3 at 3200 psi. The hydraulic capacity of
360 gallons is capable of maintaining a high level seismic signature for
a minimum of 15 seconds. Gaseous nitrogen pressure and hydraulic pressure
at the outlet manifold were monitored during each test.
b. Shaker Table / Actuator Components
The shaker table / actuator assembly (manufactured by Shore-Western
Manufacturing, Inc.) generates uniaxial dynamic motion. The four seismic
tables are aluminum, constructed in a honeycomb design for efficient
strength-to-weight ratio. Table top dimensions are 24 in. x 24 in. with a
symmetrical 16-hole bolt pattern to mount test articles directly or
indirectly by way of an aluminum interface plate as assembled for this
6-in. pipe test. Each table slides between 3 pairs of 9-in. pad bearings
(manufactured by Team, Inc.) operating at 3000 psi for the three 37°
inclined mounted bearings and approximately 2000 psi for the three lower
vertically mounted bearings. The table at support SI included an
additional bearing. This bearing is identical to the sleeve bearing that
is used on the actuator side.
A-2
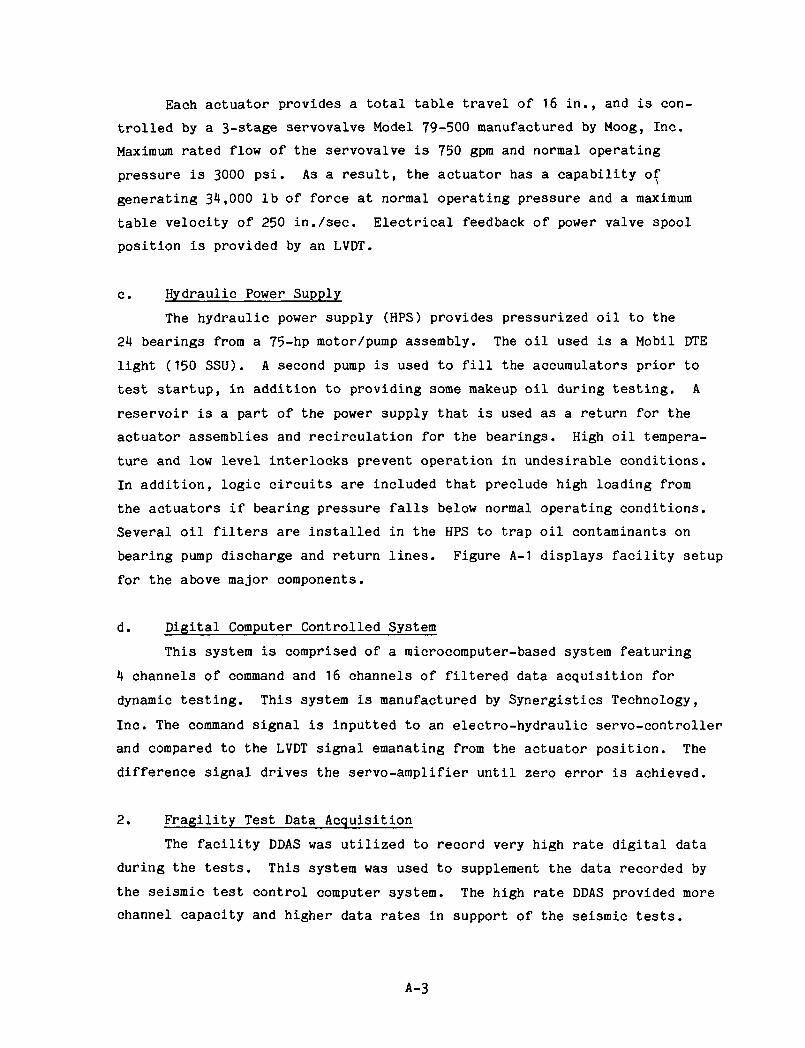
Each actuator provides a total table travel of 16 in., and is con
trolled by a 3-stage servovalve Model 79-500 manufactured by Moog, Inc.
Maximum rated flow of the servovalve is 750 gpm and normal operating
pressure is 3000 psi. As a result, the actuator has a capability of
generating 34,000 lb of force at normal operating pressure and a maximum
table velocity of 250 in./sec. Electrical feedback of power valve spool
position is provided by an LVDT.
c. Hydraulic Power Supply
The hydraulic power supply (HPS) provides pressurized oil to the
24 bearings from a 75-hp motor/pump assembly. The oil used is a Mobil DTE
light (150 SSU). A second pump is used to fill the accumulators prior to
test startup, in addition to providing some makeup oil during testing. A
reservoir is a part of the power supply that is used as a return for the
actuator assemblies and recirculation for the bearings. High oil tempera
ture and low level interlocks prevent operation in undesirable conditions.
In addition, logic circuits are included that preclude high loading from
the actuators if bearing pressure falls below normal operating conditions.
Several oil filters are installed in the HPS to trap oil contaminants on
bearing pump discharge and return lines. Figure A-1 displays facility setup
for the above major components.
d. Digital Computer Controlled System
This system is comprised of a microcomputer-based system featuring
4 channels of command and 16 channels of filtered data acquisition for
dynamic testing. This system is manufactured by Synergistics Technology,
Inc. The command signal is inputted to an electro-hydraulic servo-controller
and compared to the LVDT signal emanating from the actuator position. The
difference signal drives the servo-amplifier until zero error is achieved.
2. Fragility Test Data Acquisition
The facility DDAS was utilized to record very high rate digital data
during the tests. This system was used to supplement the data recorded by
the seismic test control computer system. The high rate DDAS provided more
channel capacity and higher data rates in support of the seismic tests.
A-3
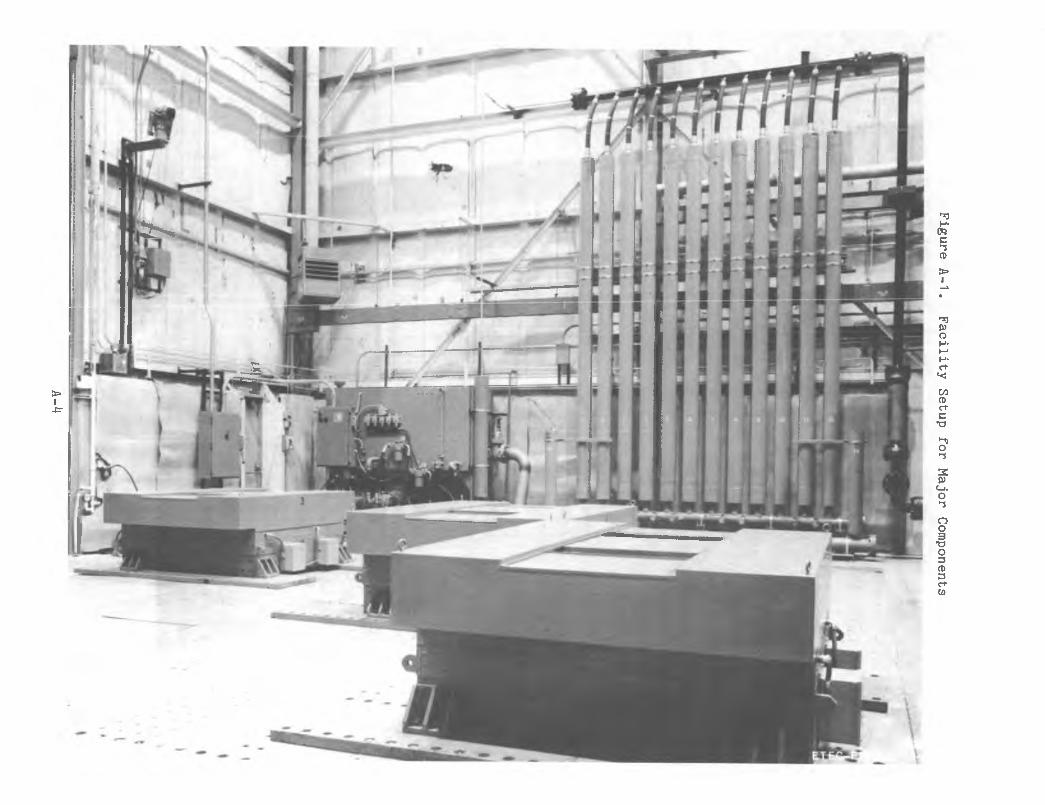
Figure A-1. Facility Setup for Major Components
'If
kA-4
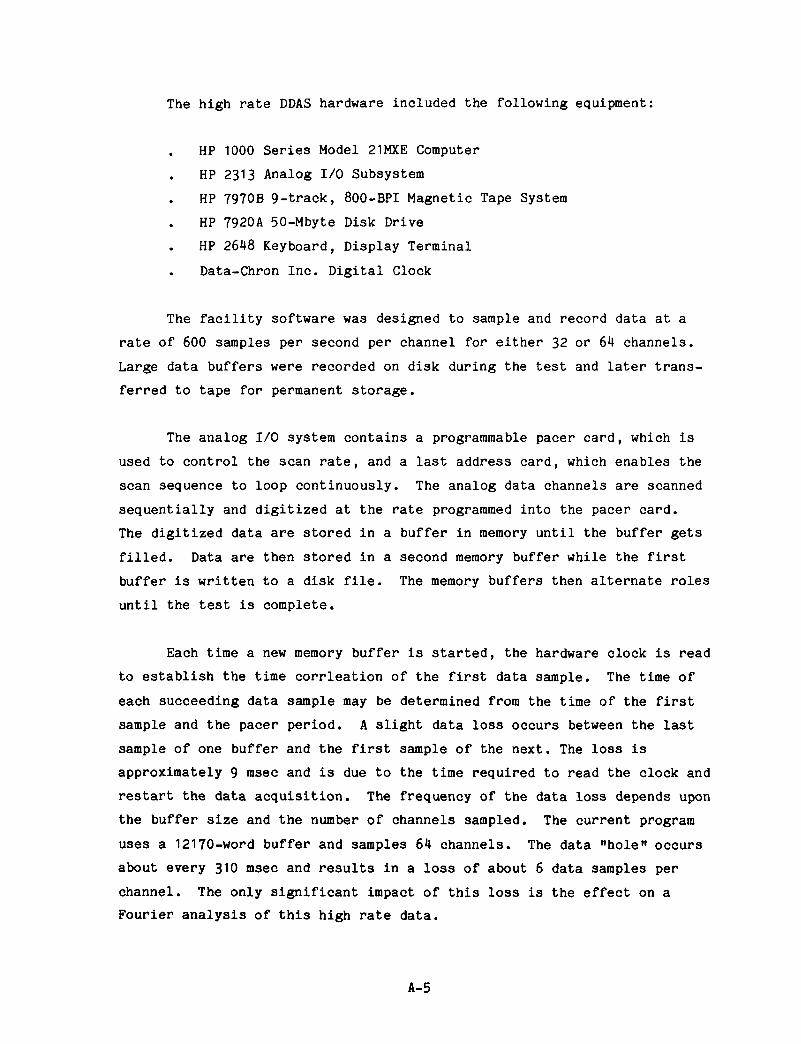
The high rate DDAS hardware included the following equipment:
HP 1000 Series Model 21MXE Computer
HP 2313 Analog I/O Subsystem
HP 7970B 9-track, 8OO-BPI Magnetic Tape System
HP 792OA 50-Mbyte Disk Drive
HP 2648 Keyboard, Display Terminal
Data-Chron Inc. Digital Clock
The facility software was designed to sample and record data at a
rate of 600 samples per second per channel for either 32 or 64 channels.
Large data buffers were recorded on disk during the test and later trans
ferred to tape for permanent storage.
The analog I/O system contains a programmable pacer card, which is
used to control the scan rate, and a last address card, which enables the
scan sequence to loop continuously. The analog data channels are scanned
sequentially and digitized at the rate programmed into the pacer card.
The digitized data are stored in a buffer in memory until the buffer gets
filled. Data are then stored in a second memory buffer while the first
buffer is written to a disk file. The memory buffers then alternate roles
until the test is complete.
Each time a new memory buffer is started, the hardware clock is read
to establish the time corrleation of the first data sample. The time of
each succeeding data sample may be determined from the time of the first
sample and the pacer period. A slight data loss occurs between the last
sample of one buffer and the first sample of the next. The loss is
approximately 9 msec and is due to the time required to read the clock and
restart the data acquisition. The frequency of the data loss depends upon
the buffer size and the number of channels sampled. The current program
uses a 12170-word buffer and samples 64 channels. The data "hole" occurs
about every 310 msec and results in a loss of about 6 data samples per
channel. The only significant impact of this loss is the effect on a
Fourier analysis of this high rate data.
A-5

Upon completion of the test, another program is run which reformats
the data and transfers it to both tape and another disk file. The tape
data provides a permanent record for achiving and off-line processing.
The new disk file permits quick-look plotting in the facility using stan
dard facility software.
A-6

APPENDIX B
TEST-ARTICLE-RELATED HARDWARE DRAWINGS
B-1
tt) (V)
H-oq c -s ro
CB I
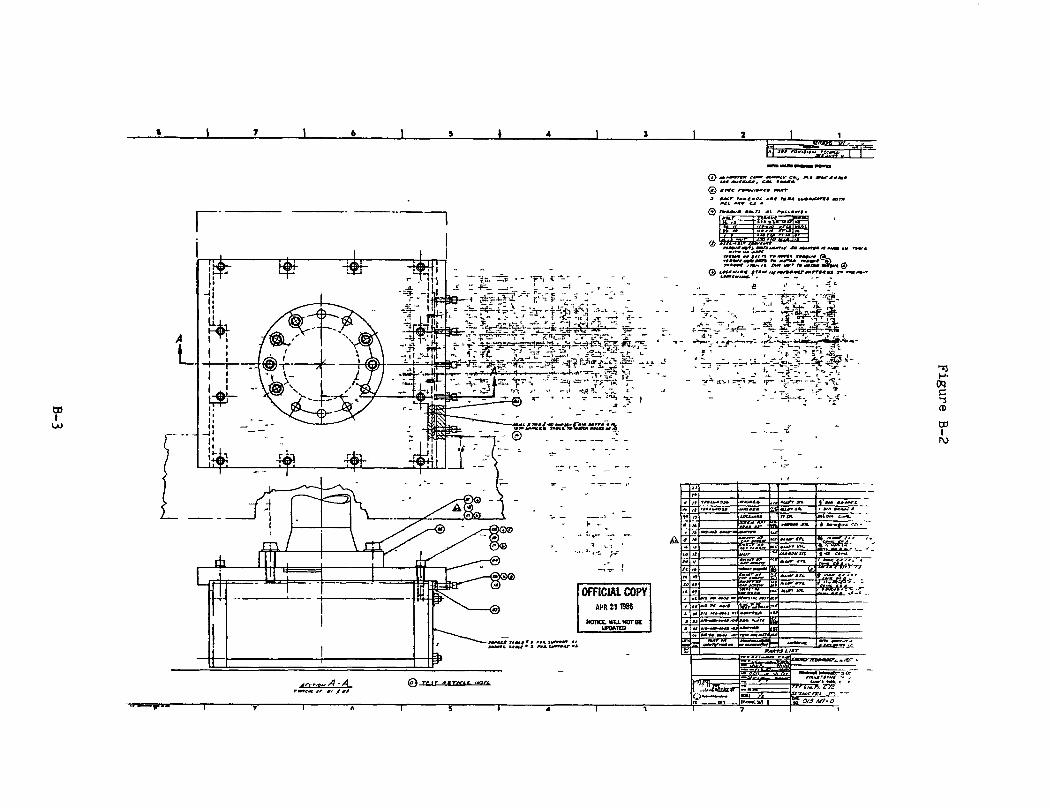
03 I
UJ
,/l-/l
i?2-"^n^l
i.' v' : ; ,_• f Z~r I :S 1"' .--X - ^ ^ - '
x - ^ " Y' - ' —-i--:» ^*.itf-L,_*;i,*-„-
- ,< -al 1 , , - ; - - ^ - 'I'V^
titmt gymo i-» mtnnfmM amwrm tm.
® _ . -:
A
OFFICIAL COPY APR !9 198$
(S^ rrtr » n - / r t l /»!/•»•
t«a«*.«o>.
<^.*. o* , .*/ s
OT.ytow/
r«i=ei^^. : ^fabK4^
n4»r.f LIST t tatfi'T'.ijL.
H-0<5 C -i ro 03 I ru

OS I
•MM "'-
au-
" j " "° "'•' """rails''. "J •''•"' "
- -£a.
• i ^ r - - A — .
OFFICIAL COPY APR 29 t986
MOTICL W U . NOT BE UPWTED
jtmmaa •mttM * ' « # * i
./A-A 0 jstarja
T r
• I ]
OQ C
ro
I U)
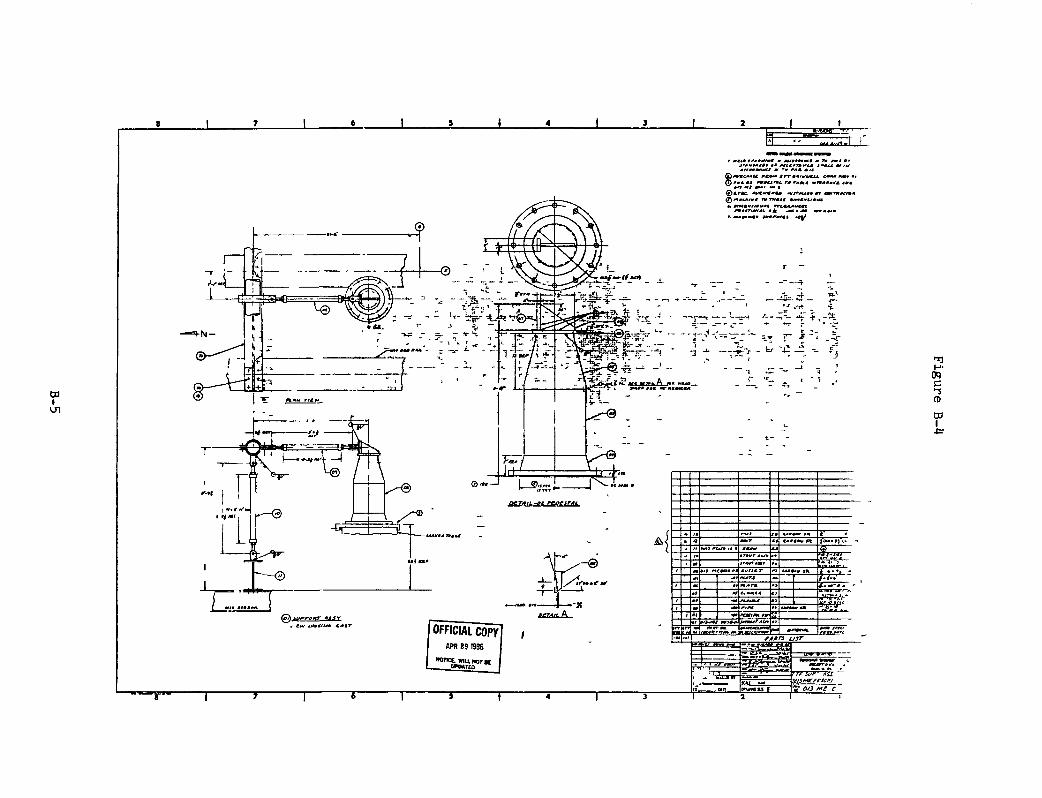
a I
-f
ogr...i.w»t norirAL
A |
r — A i » «f«—
»eTAit.f^
*ti*3 rtu* It «
*n-*^t tota-» f^mtrssn
KAmmmt itt
T^^ iinfi^r-t.
c -i ro O) I
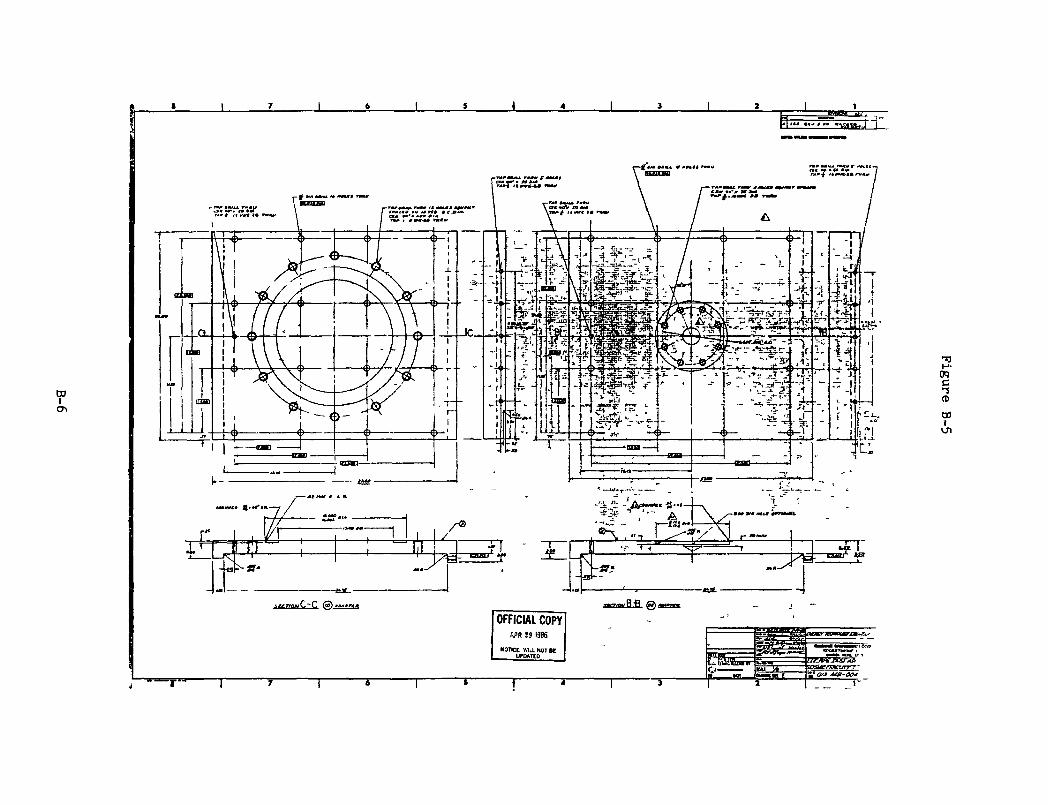
tt) c T ro w I Ul
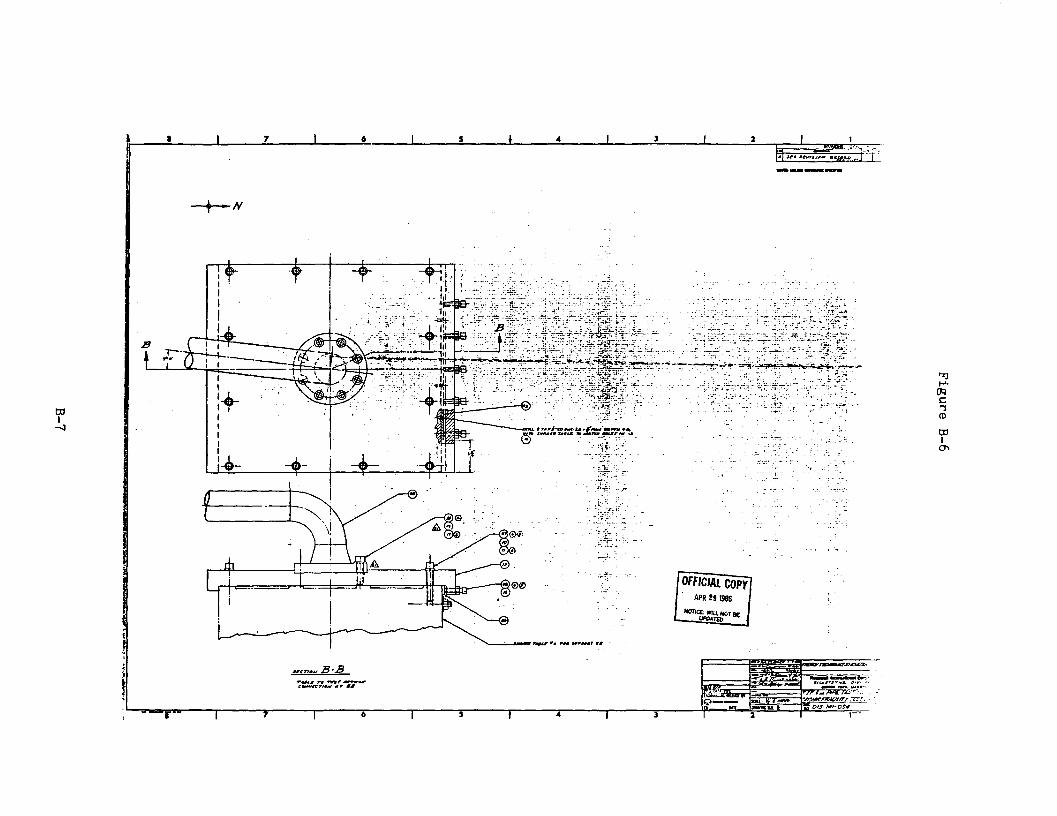
ff-a'
c^JL
fM t»*f*M ... ». #MK. JW
I CQ
(1) iU 3
"JONTlW.louo^
9861 6; adtf
li^MlWOIJJoj
-%• l^i •
r.;. ^ sat——--
-v; aiiaiMH
"I
I CQ
f/''-\-
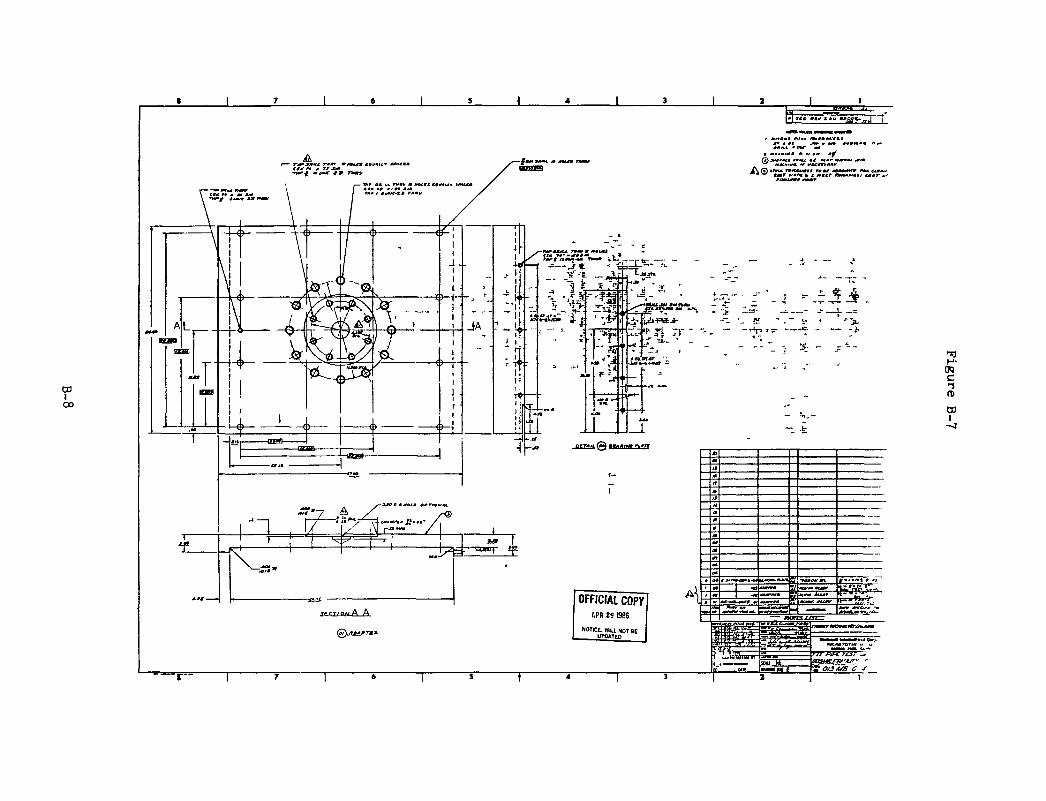
dd I oo
cn c ro 03 I
- J
APPENDIX C
CALCULATION OF SEISMIC MOTION FROM GIVEN RESPONSE SPECTRUM
C-1
Calculation of Seismic Motion from Given Response Spectrum
A number of methods can be employed to generate a time history, the
spectrum of which matches a given response spectrum. The method employed
herein, taken from Levy and Wilkinson (Reference 6), is summarized as
follows.
First, a number of frequencies are chosen to cover the frequency
range of interest, such that the frequencies are equally spaced on a
logarithamic scale. The spacing can be chosen to ensure that the half-
power points of adjacent frequencies overlap, which ensures full coverage
of the frequency range.
Second, an envelope function, which ranges from zero to unity in
magnitude, is chosen to shape the time history to simulate the time-
severity characteristics of an actual earthquake.
The acceleration time history is mathematically represented as a sum
mation of sinusoidal terms, one for each of the chosen frequencies, multi
plied by the envelope function. The coefficients of the sinusoidal terms
are varied iteratively until the response spectrum of the time history
matches the given response spectrum to some predetermined level of
accuracy.
The calculation of the response spectrum involves calculating the
maximum relative displacements of the single degree of freedom oscillators
having frequencies covering the desired range. The relative displacement
of an oscillator as a function of time is found by numerically solving the
second order differential equation:
d2zj /dt2 + 26a)i dz/dt + 0) 23 _ _a(t)
where z^ is the displacement relative to the seismic table, 6 is the
amount of damping as a fraction of the amount of critical damping, 0)^ is
the natural radian frequency, and a(t) is the acceleration of the seismic
C-2

table as a function of time. The maximum absolute value of iji^^z is taken
as the pseudo acceleration response on the spectrum curve at frequency coi.
For convenience, the velocity and displacement of the seismic tables
is made to be zero at the end of the event by adding a small acceleration
term of the form At + Bt2j where A and B are constants adjusted at each
iteration and t is time.
C-3

APPENDIX D
TEST DATA PLOTS
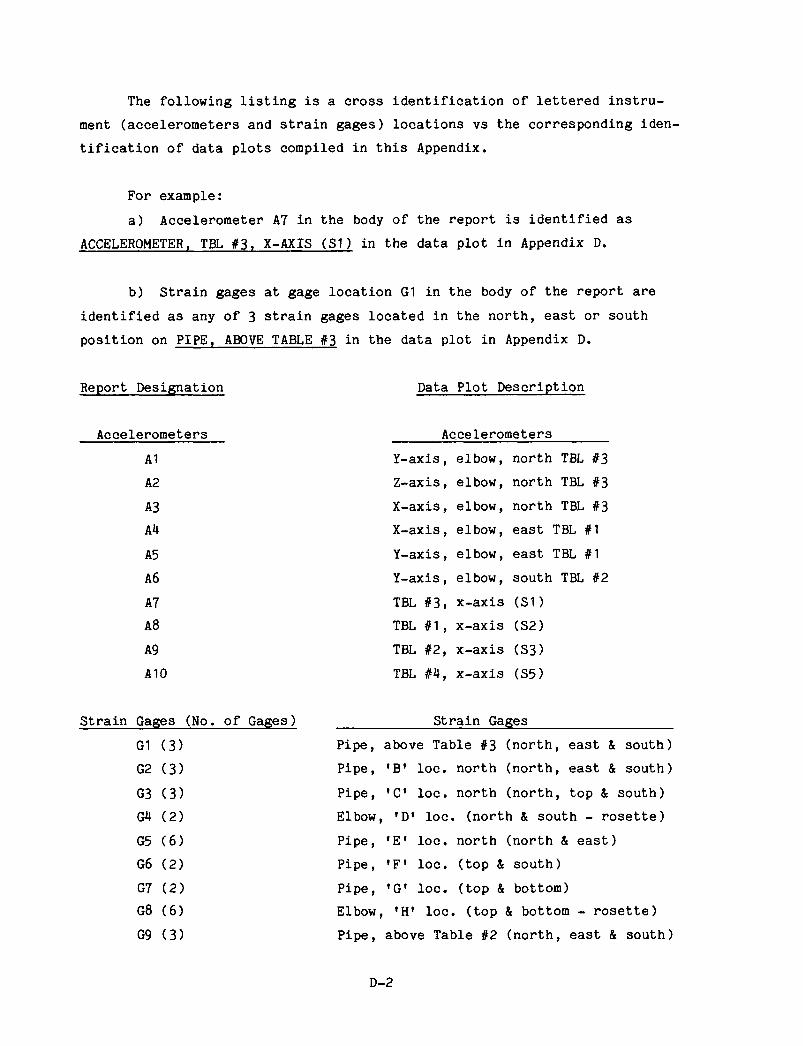
The following listing is a cross identification of lettered instru
ment (accelerometers and strain gages) locations vs the corresponding iden
tification of data plots compiled in this Appendix.
For example:
a) Accelerometer A7 in the body of the report is identified as
ACCELEROMETER, TBL #3. X-AXIS (SI) in the data plot in Appendix D.
b) Strain gages at gage location Gl in the body of the report are
identified as any of 3 strain gages located in the north, east or south
position on PIPE. ABOVE TABLE #3 in the data plot in Appendix D.
Report Designation Data Plot Description
Accelerometers
Al
A2
A3
A4
A5
A6
A7
A8
A9
A10
Accelerometers
Y-axis, elbow, north TBL #3
Z-axis, elbow, north TBL #3
X-axis, elbow, north TBL #3
X-axis, elbow, east TBL #1
Y-axis, elbow, east TBL #1
Y-axis, elbow, south TBL #2
TBL #3, X-axis (SI)
TBL #1, X-axis (S2)
TBL #2, X-axis (S3)
TBL #4, X-axis (S5)
Strain Gages (No. of Gages)
Gl (3)
G2 (3)
G3 (3)
G4 (2)
G5 (6)
G6 (2)
G7 (2)
G8 (6)
G9 (3)
Strain Gages
Pipe, above Table #3 (north, east & south)
Pipe, 'B' loc. north (north, east & south)
Pipe, 'C loc. north (north, top & south)
Elbow, 'D' loc. (north & south - rosette)
Pipe, 'E' loc. north (north & east)
Pipe, 'F' loc. (top & south)
Pipe, 'G' loc. (top & bottom)
Elbow, 'H' loc. (top & bottom - rosette)
Pipe, above Table #2 (north, east & south)
D-2
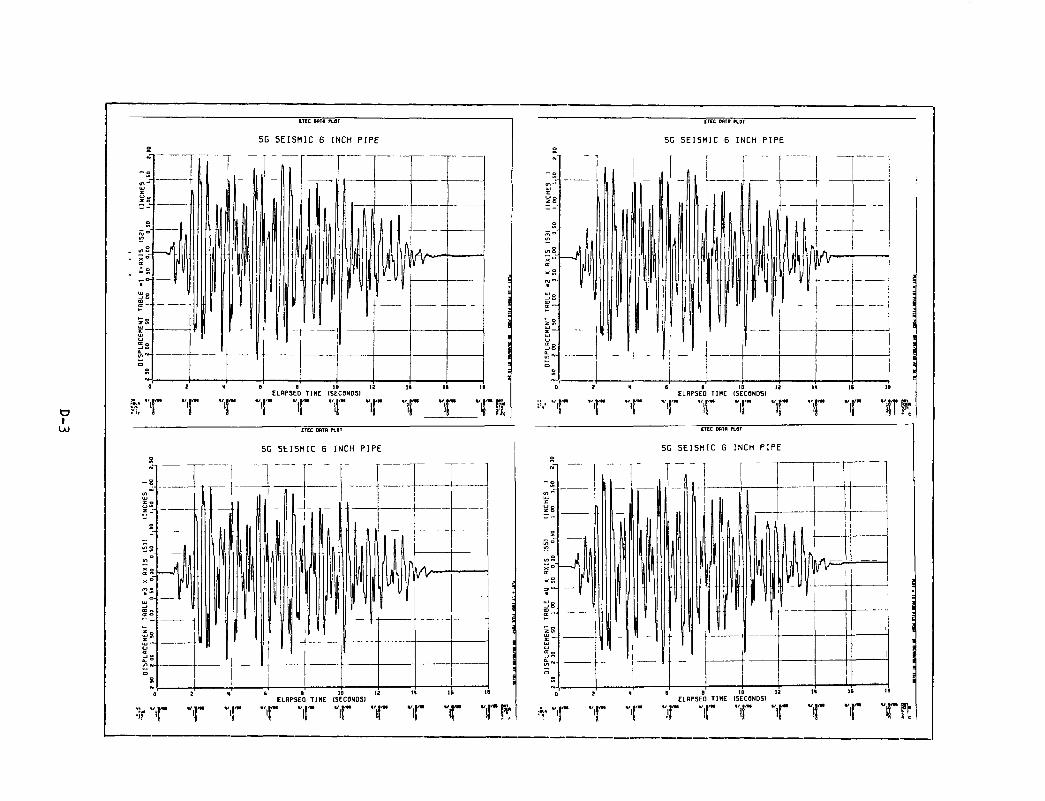
ETEC CMTfl PLOT
O UJ
5G SEISMIC 6 INCH PIPE
K i f '1 ELRPSED TIME (SECONOSl
«/•/•< <'l'»« • ' . I ' * * " . I ' *
'! i| if if r If T! CTEC MTB PLOT
5G SEISMIC 6 INCH PIPE
£LnpsEO T I H E (SECONDSI
:j,."f " f " f "if "f "If "if "If "if "ff*
CTEC MTR PLOT
SG SEISMIC 6 INCH PIPE
1
ELRPSED TIME (SECONDS)
If i! if T •'ilTf': CTEC OBIfl M.BT
5G SEISMIC 6 INCH PIPE
='r T ELRPSED TIME (SECONDS)
« «/ |/M «/,
r T T T T FP
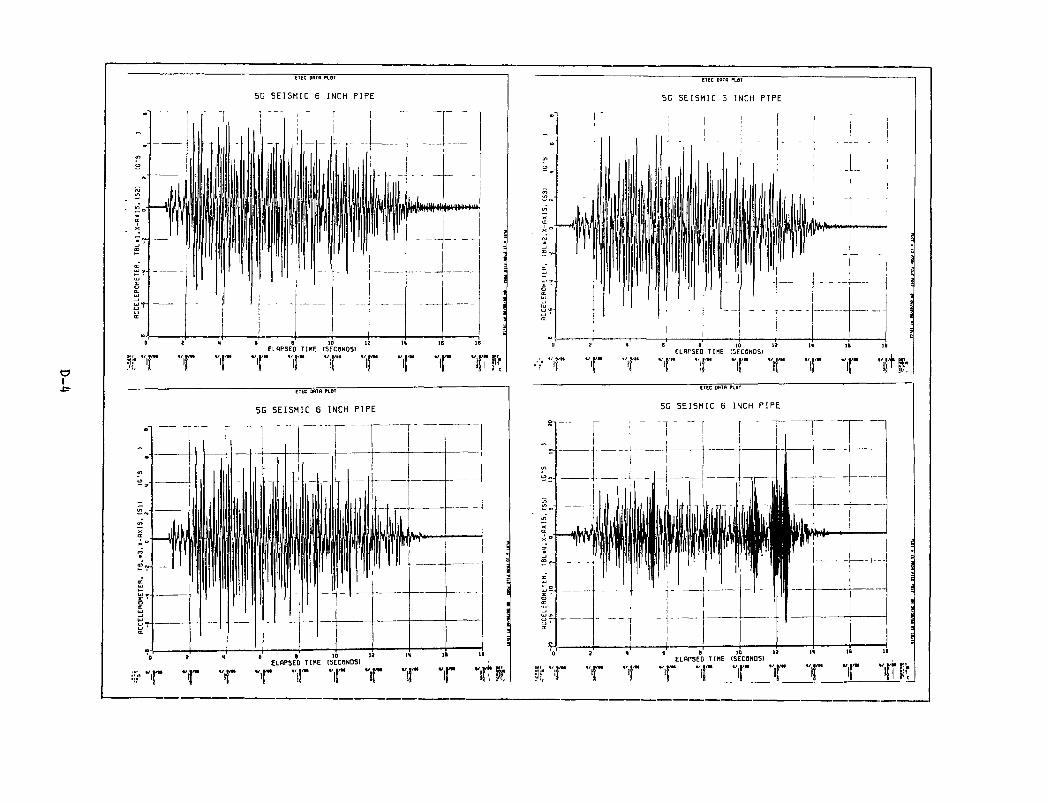
ETEC DfiTfl PLBT
SG SEISMIC 6 INCH PIPE
ETET DftTfl FLOT
5G SEISMIC 6 INCH PIPE
ELBPSED TIME ISECONDSI ]
,f "f "if "if "If "if "!f "if T "iftl:
ETEC DFITfl PLOT
SG SEISMIC G INCH PIPE
ETEC DflTB FLBT
SG SEISMIC 5 INCH PIPE
^ 1 - -
1/ a/M *', l '**
ELRPSED TIME (SECONDS)
' I I I T 'Vf

ETEC ORTa PLOT
SG SEISMIC 6 INCH PIPE
ELAPSED TIME (SECONDSI I D«i «/ I'M V |/M */ tm . / |/M ./ |/M »/ irt. v.l 'w v.t/M V. I / . . **,V¥ B£U
ELAPSED TIBE (SECONDSI
FIEC DflTB fLflT
SG SEISMIC 5 INCH PIPE
T T T T T
«/ ( /N
i! T Tf.

o ON
CTEC OBTB fLOr
SG SEISMIC 6 INCH PIPE
IT T T T T T T T T T CTCC DflTB PLBT
SG SEISMIC 5 INCH PIPE
ELAPSED TIKE (SECONDSI
IT T T T T T T T T Tl
ETEC DflTR PLOT
SG SEISMIC 6 INCH PIPE
ELAPSED TIME (SECONDSI oar t/ |/M V | / « . / ./M . / l/l . ./ |/M V l/H . / l/m V f/M V f/M V Vm KT_
w. i f 'I 'I if i! if i| If ff. ETEC WTfl riBT
5G SEFSMIC 6 INCH P I P E
ELRPSED TIME (SECONDS) |/M *',]'>•
i! if If «/ l /M «/,
fi:
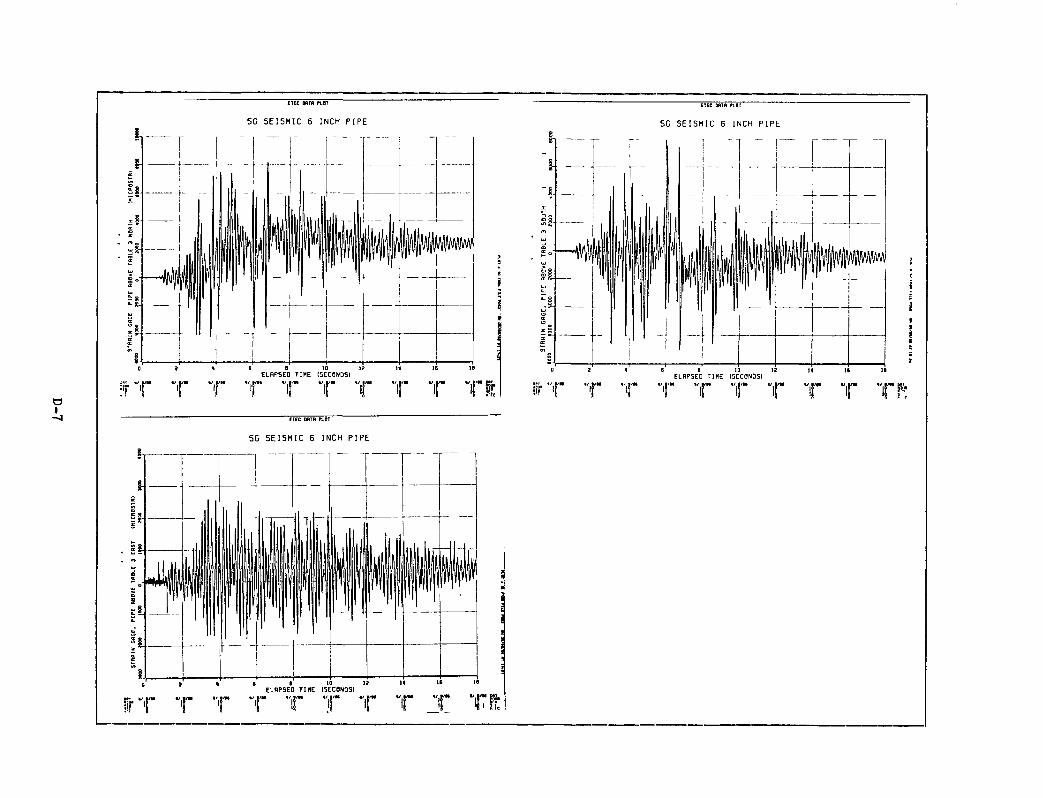
ETEC DflTB PLOT
SG SEISMIC 6 INCH PIPE
O I
:'r " ELRPSED TIME (SECONDS)
|/M V f/M " 'J '** • ' . ( ' • • »'.('•• ".iC" »',l'>» " . f " * ' , ! '" " • I " ' ES.V
'! r '1 'I if if if If f ii i ETEC DflTB PLBT
5G SEISMIC 6 INCH PIPE
r Tft
ETEC DATfl PLOT
SG SEISMIC 6 INCH PIPE
•r 11 ELAPSED TIKE (SECONDSI
f "f "If ">f "If "If "If "If "If "|7>
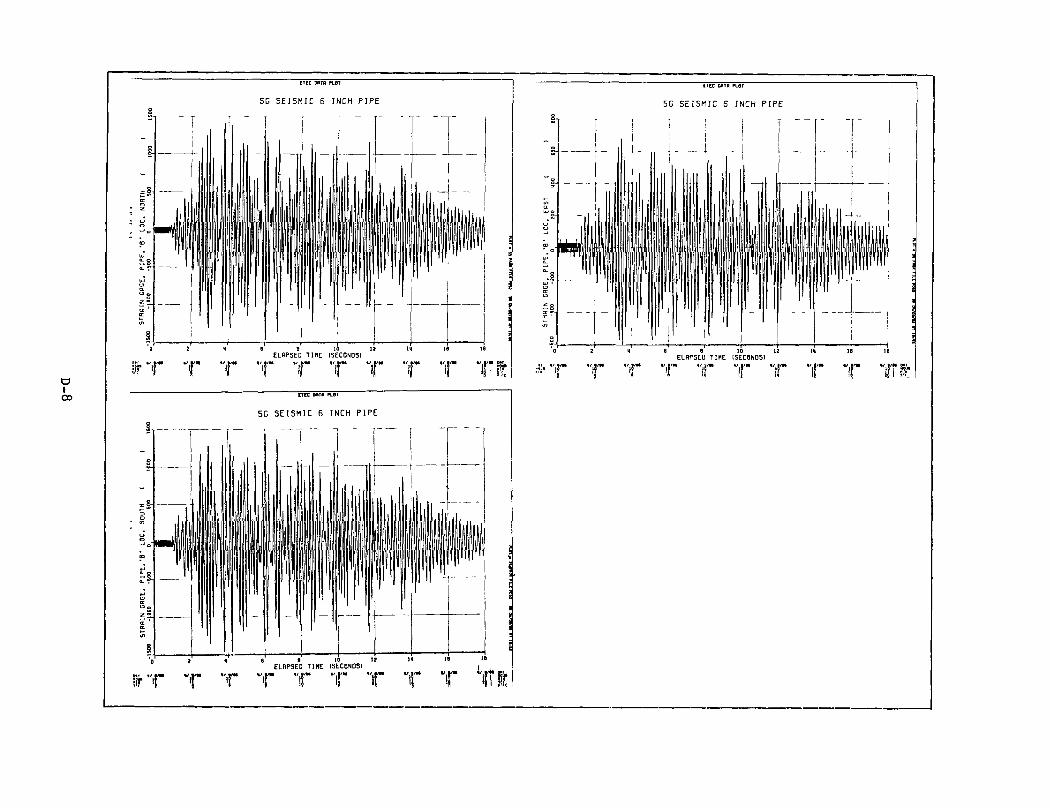
CTEC DBTB PLOT
SG SEISMIC 5 INCH PIPE
o I 00
0*1 • / | /W «/ f / n l / . l / M %r | / N «/ | /M «/ | / M • / | / H «/ l/M «/ | /M • ' . • '* • 9!]L
sir '1 r '! i f If if il ij i i K
h o
" -
o
m
?-LU
IX
"1 oc
i 'o
t " l
1 i 1 4 1
2
r "
1
II
r
— 1 ^
I 1 i n
•I
T
HEC DftTfl rLBT
5G SEISMIC 6 INCH PIPE
i' v~ 1 " r
1
1
1 r 11 i i l l 1 !
1 1 i l l ll III 1 1 L 1
•1 1 II ' 1 1 • i|
1 11 1 II 11 1 " i
, 1' 1
s' ELAPSED TIHE (SE
" l " "1 r "1
12 CONDSI
r "! r
1
111
1 1 1
X
"1 r
~*
_
— -
i ilk 1 - 1 -
IS
"1 r
- *"
I n l • - 1
a IB
"I IT 1:1
ITEC OflTfl PLOT
5G SEISMIC 5 INCH PIPE
ELAPSED TIHE (SECONDSI
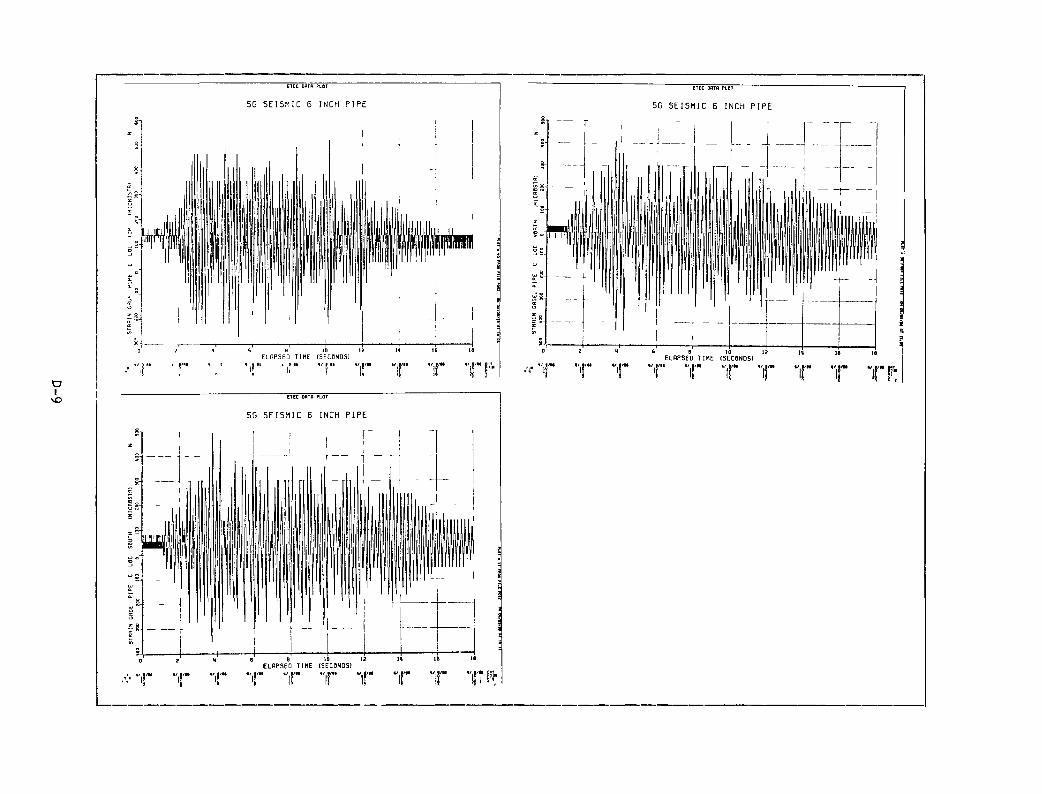
ETEC DOTfi PLOT
5G SEISMIC 6 INCH PIPE
ETEC DRTR PLOT
5G SEISMIC 6 INCH PIPE
1 1 r
111
1 1'
12
—
1 1 :
U 16 ] ELRPSED TIME (SECONDS)
i/j/if *'.i'n «/.(/H "'J'W »' l/w «/ |/N n/ •
ETEC M T f l PLOT
5G SEISMIC 5 INCH PIPE
ELAPSED TIHE (SECONDSI
'If "If "If If "if "If T T T T
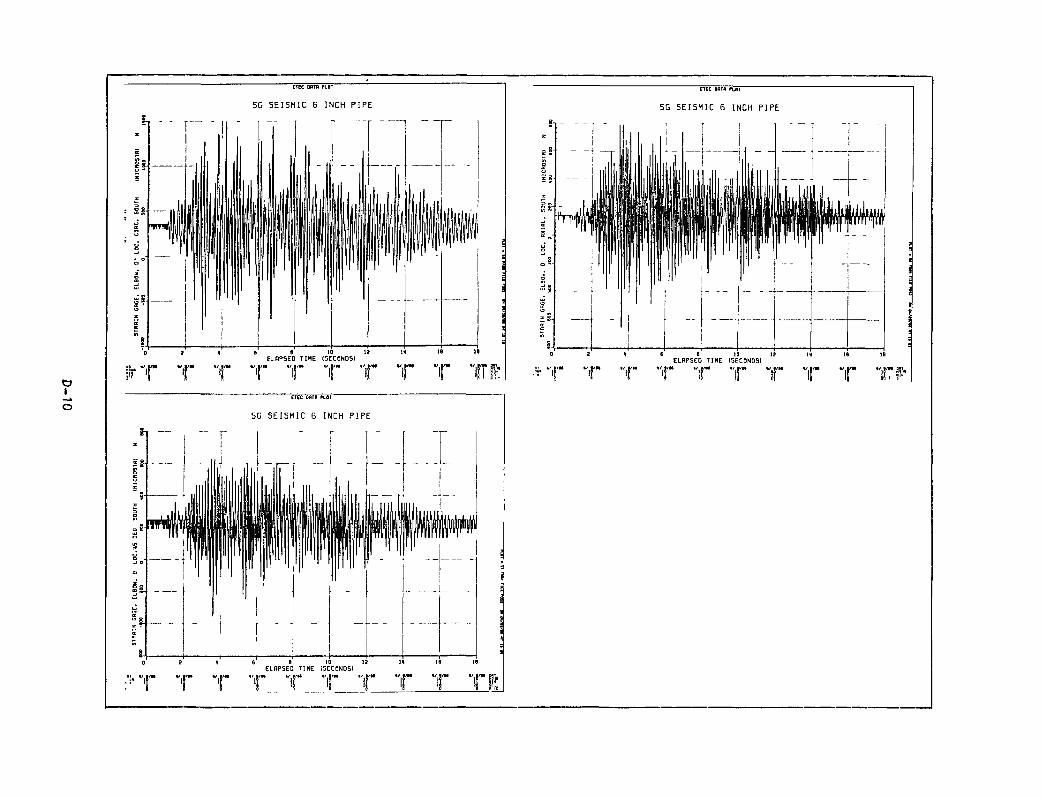
ETEC DflTR PLOT
SG SEISMIC B INCH PIPE
I
ELAPSED TIHE (SECONDSI
'If "f ",f "If "If "If ",f "If "If "jiTPf: ETEC DflTR PLBT
5G SEISMIC 6 INCH PIPE
ELRPSED TIME (SECONDS) 1/ l/M «/ I'M «/ |/M 1/ |/M «/ a/u */.>/» */.!'** *',l'** *^,P
i i i i if ll i! ij ij "if&
ETEC DRTfl PUDT
SG SEISMIC 6 INCH PIPE

ETEC DflTB PLOT
5G SEISMIC 6 INCH PIPE
ELBPSED TIHE ISECONDSI
lf7 Br
ETEC DBIR PLOT
5G SEISMIC 6 INCH PIPE
ELRPSED TIME (SECONDS) 1/ I'M 1/ i/M </ a/M */ l/M «/ a/a* " J ' " ".ll'** SIL
'! ij ll '1 Ij Ij '1 t ETEC DflTB PLDT
5G SEISMIC 6 INCH PIPE
ELAPSED TIHE (SECONDSI
',f Y "f "f "If "If "If "If 1'- Tf-
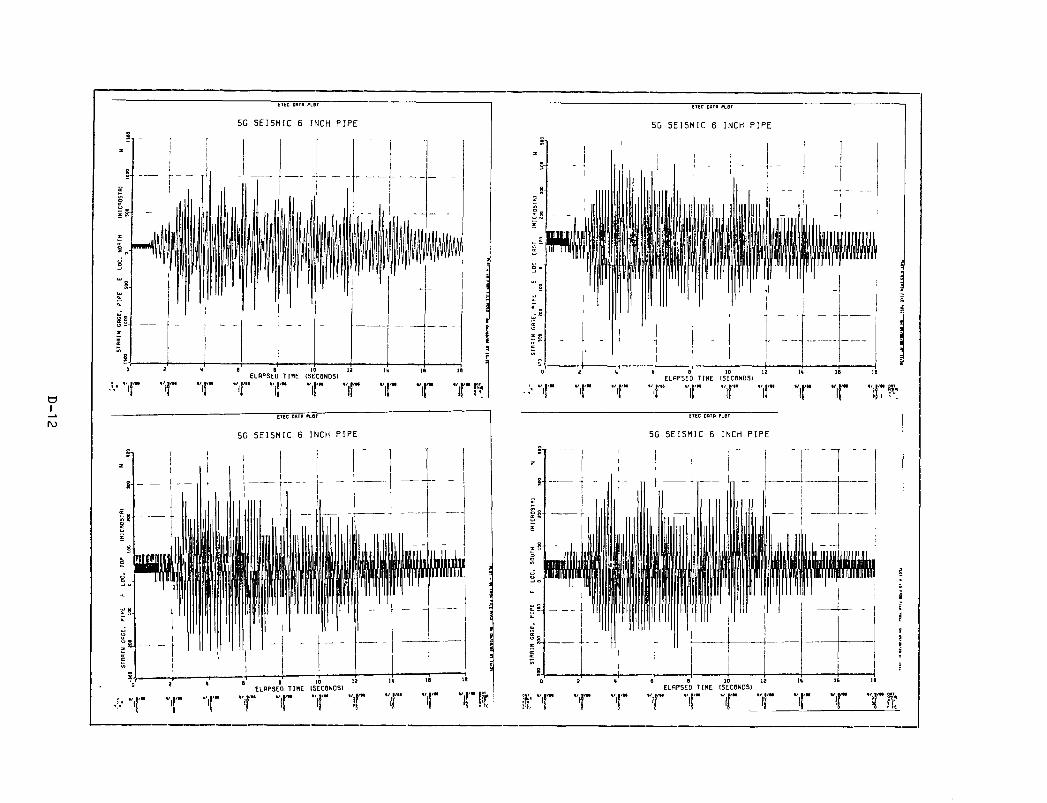
ETEC DRTfl PLOT
5G SEISMIC 6 INCH PIPE
ETEC DRTfl PLOT
5G S E I S M I C 6 INCH P I P E
ETEC DflTR PLOT
SG SEISMIC 6 INCH PIPE
f/ai %/ tiH t/ I'ta 1/ | /M oni
i! i! ij if, f' ETEC DflTB PLOT
SG SEISMIC B INCH PIPE
ELAPSED TIHE ISECONDSI
W. '
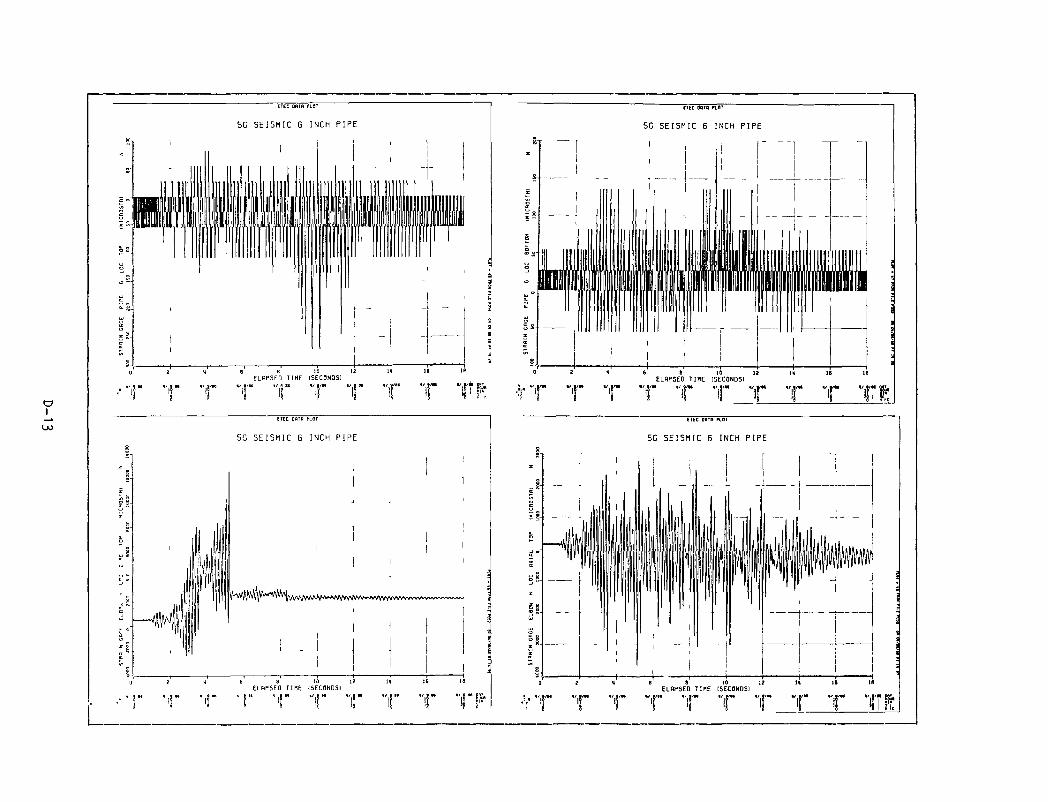
ETEC DflTR PLOT
5G SEISMIC 6 INCH PIPE
B la 12 ELRPSED T I H E (SECONDSI
1 / Ri-H «/ a ai «/ |/>s </.! M *^.t'"
i i! if if if ETEC ofliB puor
5G SEISMIC 6 INCH PIPE
l!)iill!
m M ^ w l f ' ^ * ' ' ' ' ' ' ' ™ i v v l A ^ w M ^ ' ' * ' > ^ —
10 12 ELAPSED TIHE (SECONDS
• ,!
'S
16 18
"if T 1" T TF
HEC ORTH PLBT
SG SEISMIC 6 INCH PIPE
10 12 ELRPSED T IME (SECONDS)
'1 1 1 il ij if il ir i < t ETEC DflTR PLOT
5G SEISMIC 6 INCH PIPE
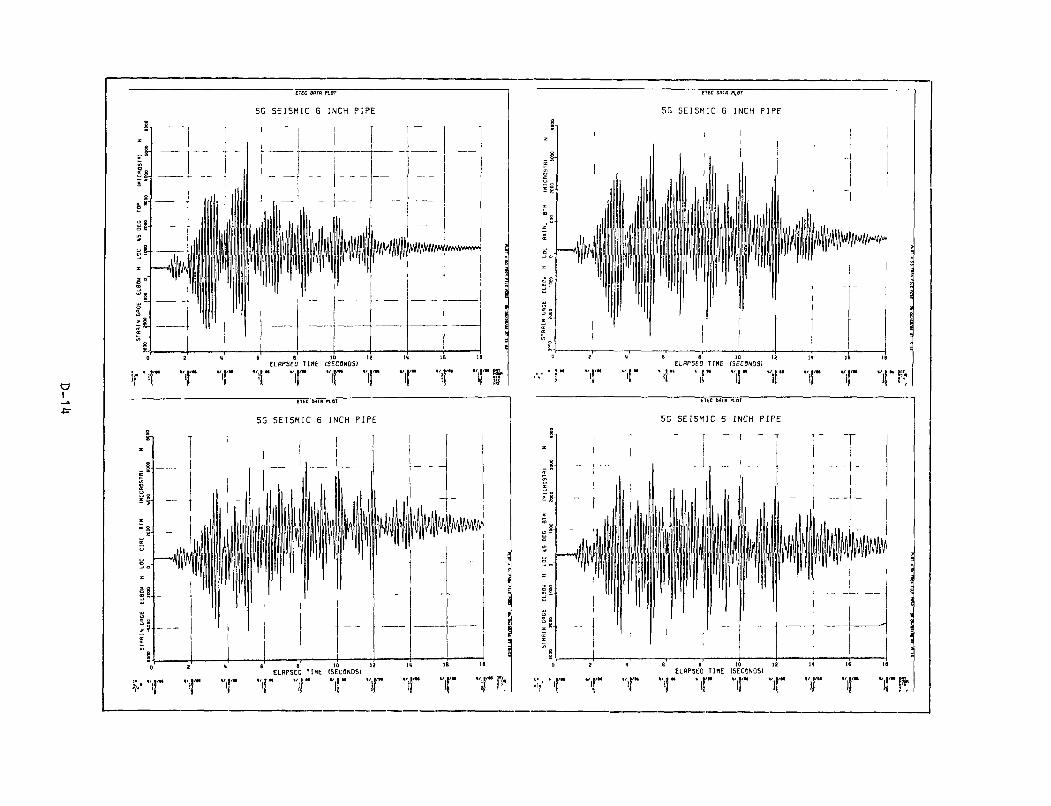
o I
i-s
X
g
s"
a °'
X
X a'
" 1
" l 0
i f ' i
- -
- - -
,.il
1 1 ill
2
f- "'
iP
r ",
ETEC DflTB PLOT
SG SEISMIC 5 INCH PIPE
1
1
^ 1 1 1 1
1 1 1
1 [
' 1
-' 1
1 li. '
1 II 1.11.1 ,11.1
li 1
I 6 B
ELRPSED
- "f "1
11 '
—
—
1 .If.
M 1
10 1 T I M E (SECONDS)
" "If •']
pi|
1
^
—
WwV
16
" T
—
W^NVVN i s
i
3
B
1
i
s IB
Tr ETEC Onifl PLOT
SG SEISMIC 6 INCH PIPE
ETEC DflTfl P OT
SG SEISMIC B INCH PIPE
ETEC DflTfl PLOT
SG SEISMIC 6 INCH PIPE
- r - -|
0 2
w % l /M 1/ a/t ELRPSED TIME (SECONDS)
| / M <^, l ' **
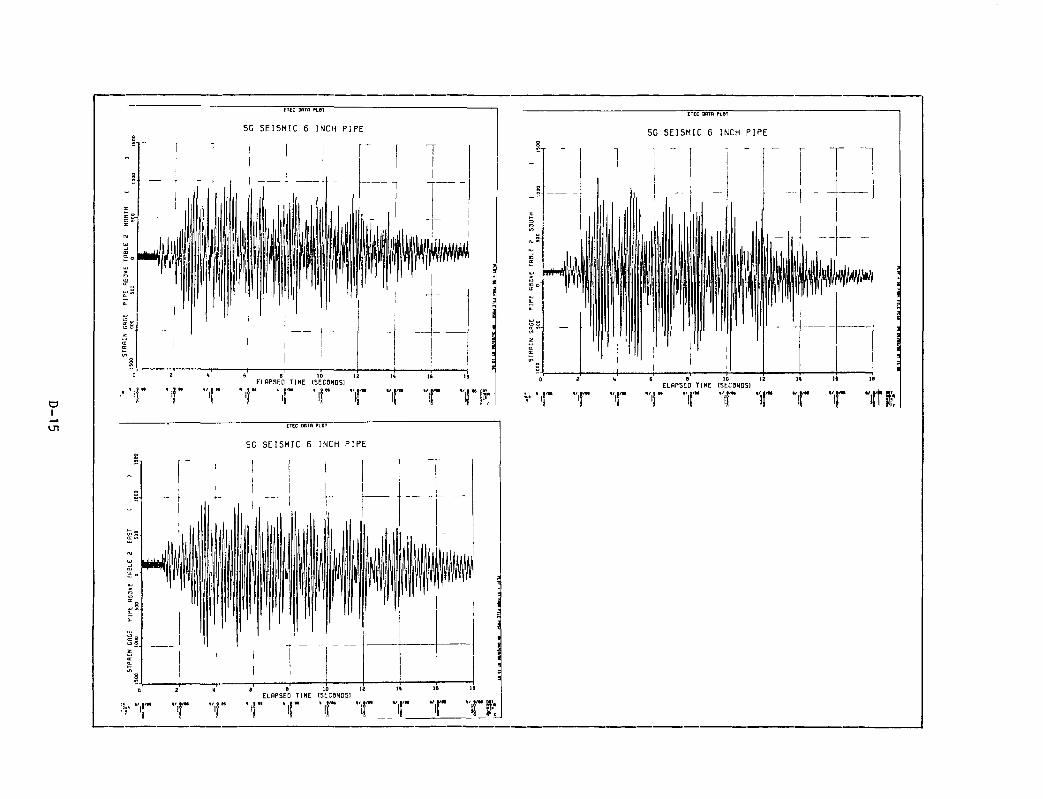
ETEC DflTfl PLOT
5G S E I S M I C 6 INCH P I P E
U 16
T T T T T T T T in't ETEC DBTB PLOT
5G SEISMIC B INCH PIPE
ELAPSED TIHE (SECONDSI
T T T "f "il" "if" T 1'" T Tit
ETEC DflTfl PLOT
SG SEISMIC 6 INCH PIPE
1
ELAPSED TIHE (SECONDSI / | / M «/ | /M * / I M » ' , » " . . ' . I f . . . ' . I ' . . . ' . I ' . . " . I f * " . t ' t * I9.U
'1 'i '! If If i i f i\k
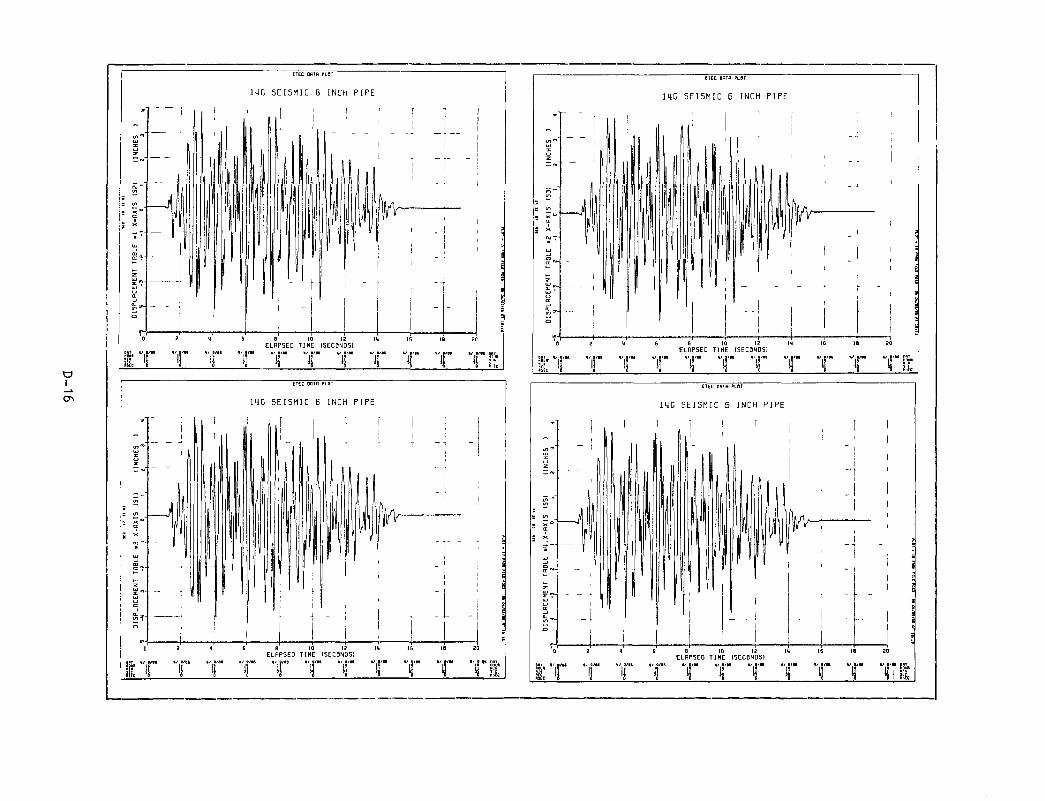
I
a\
ETEC DRTfl PLOT
l i e SEISMIC B INCH PIPE
I
IJ: ij il ij i! ij il ij ii i i iji ETEC OBTR PLOT
l i e SEISMIC B INCH PIPE
ELAPSED T I H E (SECONDSI
k 11 ! !5 "l5
ETEC DRTfl PLOT
14G S E I S M I C 5 INCH P I P E
ilc ij '1 -i 1 1 1
ELRPSED TIME (SECONDS)
li ! ',!"• 8?.
• ' "
r" z
— ft)
i n "
S CO _
" cr S X
• UJ
a: ~-
*-s S '
a. , .
'o
ii: 1
1 , - t
1
1 i
' 1 1
- 1 1 1
2
1 1
'
< (
1 1 1 1
1 1 1
i 1
1
1
11
ETEC DflTB PLOT
mC SEISMIC B INCH PIPE
1 , 1 1 ' 1 .1 ,1 '
II 1
1 1 ' 1 1
i
II ll i i 1 1 1 h. ' 1 1 ' 1
. 1 1 I 1 J
' I iMy 1 . 1 n 1
y yv
1 F ' ' '
p ' 1
1 ;Mi
1
6 B 1
1 , 1 —
12 m ELRPSED T IME (SECONDS)
T 1 r 1 f
1 1
1
' 1
' 1
16
'1
1 ~
-
i
1 1
- 1
iq
'1
1
1
1
'
j
1
_.|
20
T
?
5
?
3
I
IS"

ETEC DflTfl PLOT
mC SEISMIC B INCH PIPE
/ B/w «/ I/as
I! i il ij il '! il / l /M (/ a/n c
J c
ETEC Dnrfl PLOT
14G SEISMIC B INCH PIPE
ELRPSED TIME (SECONDS) / a/fli */ a/at 1/ s/sE « g/M 1 / 919b «/ S/8B «/ B/ae «/ a/as «/ a/aa <•/ B/IG ont
i; il il il ij '1 il il K
ETEC DRTR PLOT
lUG SEISMIC B INCH PIPE
K 1 ELRPSED TIHE (SECONDS)
a/ae r T T T T T Tl! ETEC OflTfl PLOT
m e SEISMIC B INCH PIPE
ii; !i
ELRPSED TIME (SECONDS) <•/ s/ag « a/aa «/ a/aa «/ a/ae
i] il i| il 11 ll '< l i
J ij 'i '1
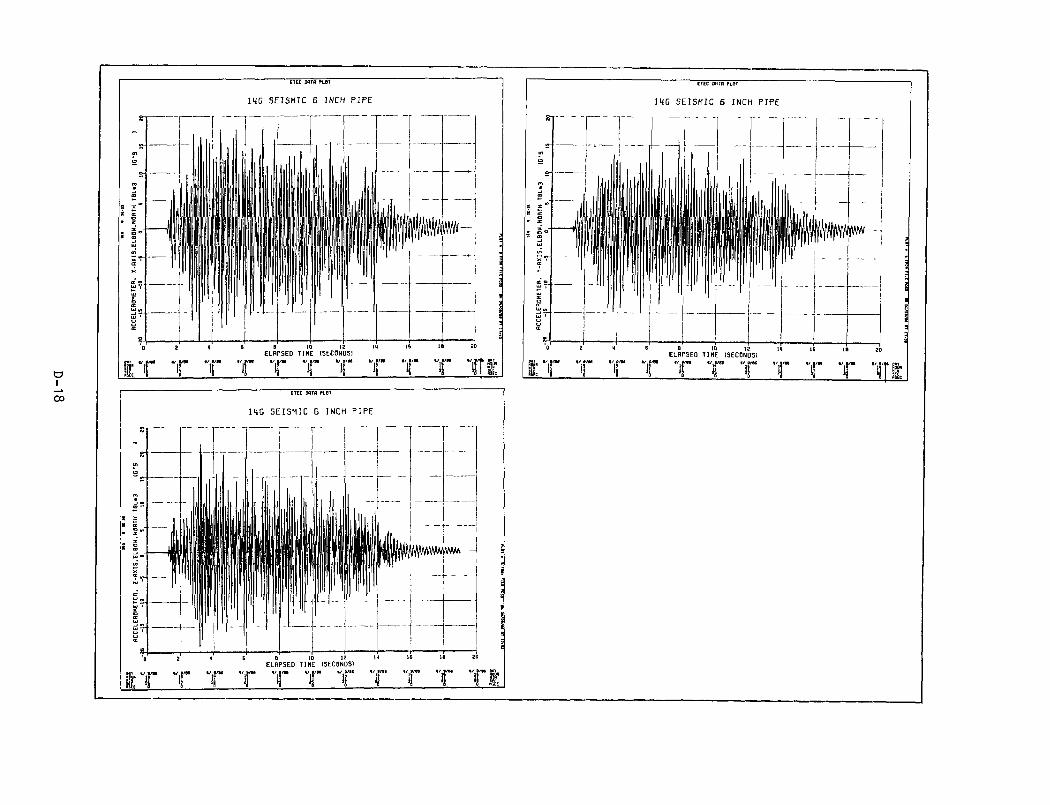
ETEC DflTR PLOT
mC SEISMIC 5 INCH PIPE
*» -€0
a
Sr
m
• B a:
i 1°
tf) X
K; X o cc
o u cc
'o
I , i
1 ll u 1, . 11 ' » 1 r ' L -t -I I I M <l V . . t 1 1
lllllllllllllllll,ll.b,,lil II 1.. ,1 " ' i l l Ml ill nil ll ll 1 1 r " . .iiiiiJinihil 11 III.., -I
1 III 1 i 1 llli III nil II 1 "' 1 III 1II 111 11 1
I
'IM iMiiiP 1 ii'i irr ' i 1 Ih II M 1 -1
4
f B
p L i j ' i r L B 1 1
lii P 1 III
; m
MIIUMIIIII
PPI m
w -
16 IB
iw— __.!
2C ELRPSED TIME (SECONDS)
.j/aa a/.B/x * ' . ! ' • * ' " , ! ' " • ' ^ S ' " IT "f T T "T" t"" t T T T Iti ETEC DBTB PLOT "
mC SEISMIC B INCH PIPE
VplWftWA
IT 1' ELAPSED TIHE (SECONDSI
<'.!'" >'.!'» " . ! ' " " i ! " '
T 'T ij %/ raa «/ /a
T 'i
ETEC DRTfl PLOT
mC SEISMIC 5 INCH PIPE
IT ELRPSED TIME (SECONDS)
*',!'" '",!'" 'M'" *'.?'•• f T T T T "f[i

I
vO
ETEC OBTfl PLOT
m C SEISMIC 6 INCH PIPE
ELAPSED TIHE (SECONDSI t/ . / « V ./M
K 11 1] i| T T T T T T ETEC DBTB PLOT
m C SEISMIC 5 INCH PIPE
ELAPSED TIHE (SECONDSI
I T "f T T T T T T T T T l
n
m S"
o
= IS
5 i° UJ
cr
a:
UJ u u CE
-1
H 1
0 2
IT "1
1
1 '
1
1
r T
ETEC OflTfl PLOT
U G SEISMIC B INCH PIPE
1 ]
1 III ll i 1 1
1 li 1 III l l l i 1 i
1
1
1 r Ml '' 1
1 . _ •
•• 1 1 6 6 10 12 ig
ELRPSED TIME (SECONDS!
T T T T T
1 1 f
!
I l l l l i i i i 1
1 1
1 .
T
_ ..
- - -
mm -
1
1
18
T
i
i
i 1
1 3 :
20
Tl

ETEC DflTfl PLOT
m C S E I S M I C 6 INCH P I P E
-1
u
- n
¥ = 1-
1 1 ~i,lii i f li
1
'
t
1
'
--
1 J 1 1 1
1
-
r
^
1
"
— -
-1 : 1
1
1
-
"
._
- _
- — —
ELAPSED TIHE ISECONDSI
1 f T T T T T l ro o
ETEC DRTfl PLOT
id 1? lU ELRPSED TIME (SECONDS)
«/,l/M */,•/•* •/.!'•• '".?'•• "|8'*
16 18
T 1 r "iJ ij'" "ir 1' Jl
ETEC OflTfl PLOT
14C SEISMIC B INCH PIPE
- H 1 . 1 1 1 i 1 1 1 2 U 6 0 10 12 l l IB IB 20
ELAPSED TIHE ISECONDSI
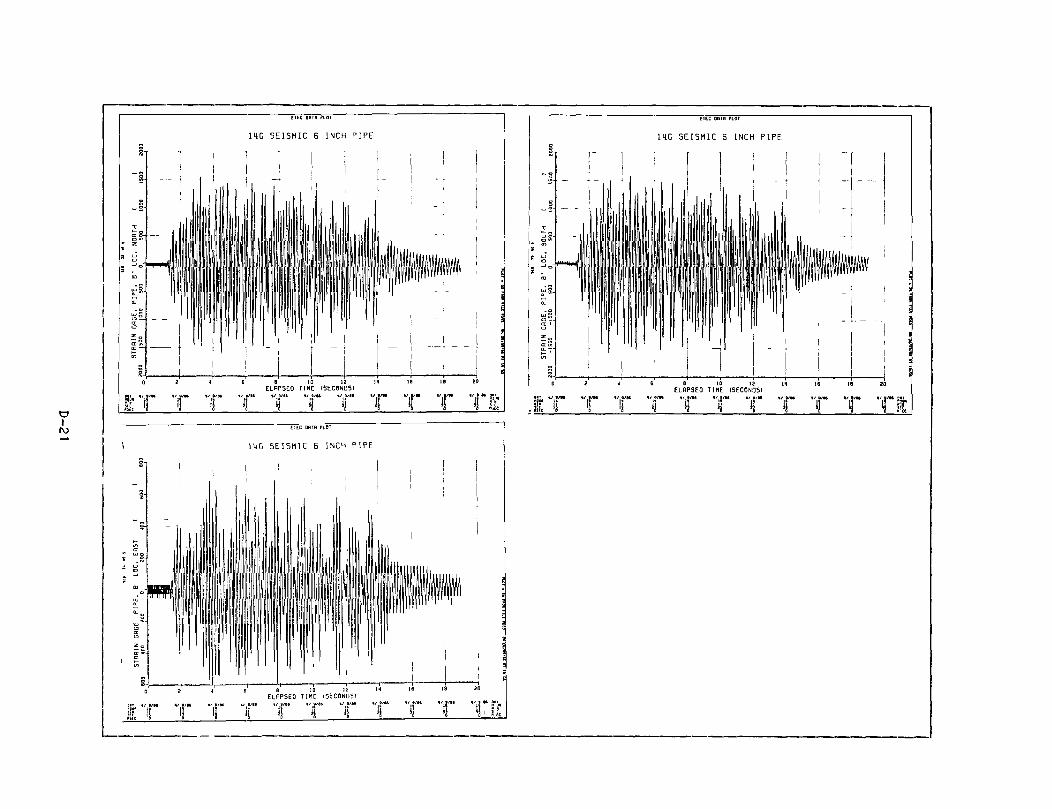
ETEC DflTfl PLOT
I IG SEISMIC 6 INCH PIPE
O I l\J
ELAPSED TIHE ISECONDSI */M «/ . / H . / l/M . / 9/H . / (/M «/ 9 / . .
1 li !! ! il !1 |/M ",!'••
ij il 11
EtEC DRTR PLOT
mC SEISMIC B INCH PIPE
/ B/M a/ a/M ELRPSED TIME (SECONDS)
Jl 1
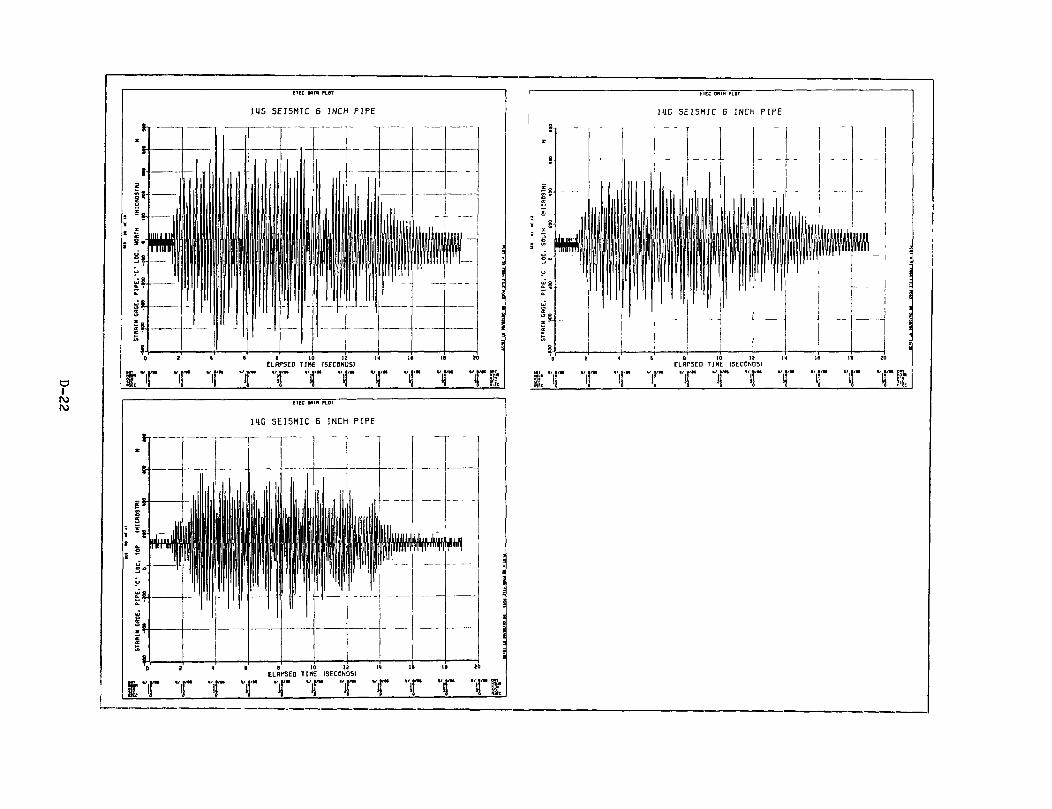
ETEC DflTB PLOT
I IG SEISMIC B INCH PIPE
O I ro ro
r T T T T T T ETEC DflTR PLOT
mC SEISMIC 6 INCH PIPE
IT T T T T T T T T T 1
ETEC DflTR PLOT
lilG SEISMIC B INCH PIPE
/ a/H * ' . ! ' * *
ELRPSED TIME (SECONDS) 1/ j / M * ^ i i " * / a/a« I ' . l ' a i
il il ij a / , a / M DMT
hi
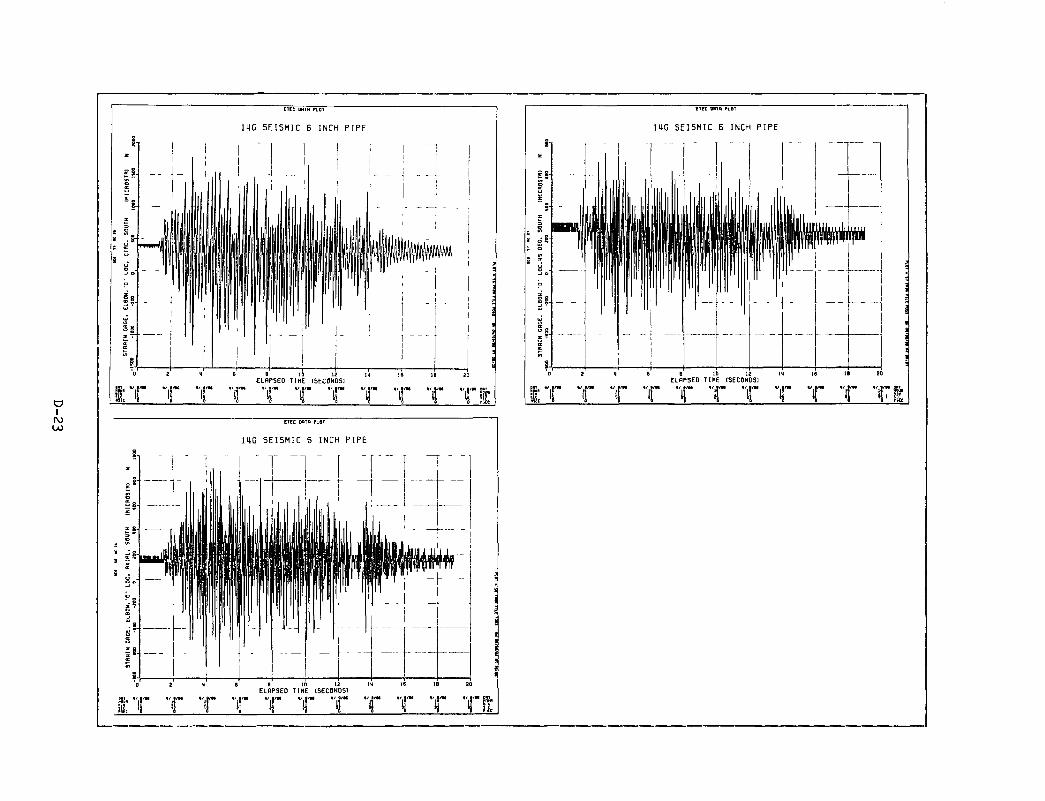
ETEC DRTfl PLOT
mC SEISMIC 6 INCH PIPE
Slj. Ij «/a/M */ a/ai
J i ELAPSED TIHE ISECONDSI
'•"" "•"" T T T T T ETEC DATA PLOT
14G S E I S M I C 6 INCH P I P E
T T T T T T T T T T 1' 1
ETEC OflTB PLOT
IIG SEISMIC 5 INCH PIPE
ELAPSED TIHE (SECONDSI
IT T T T T T T T T T Tl
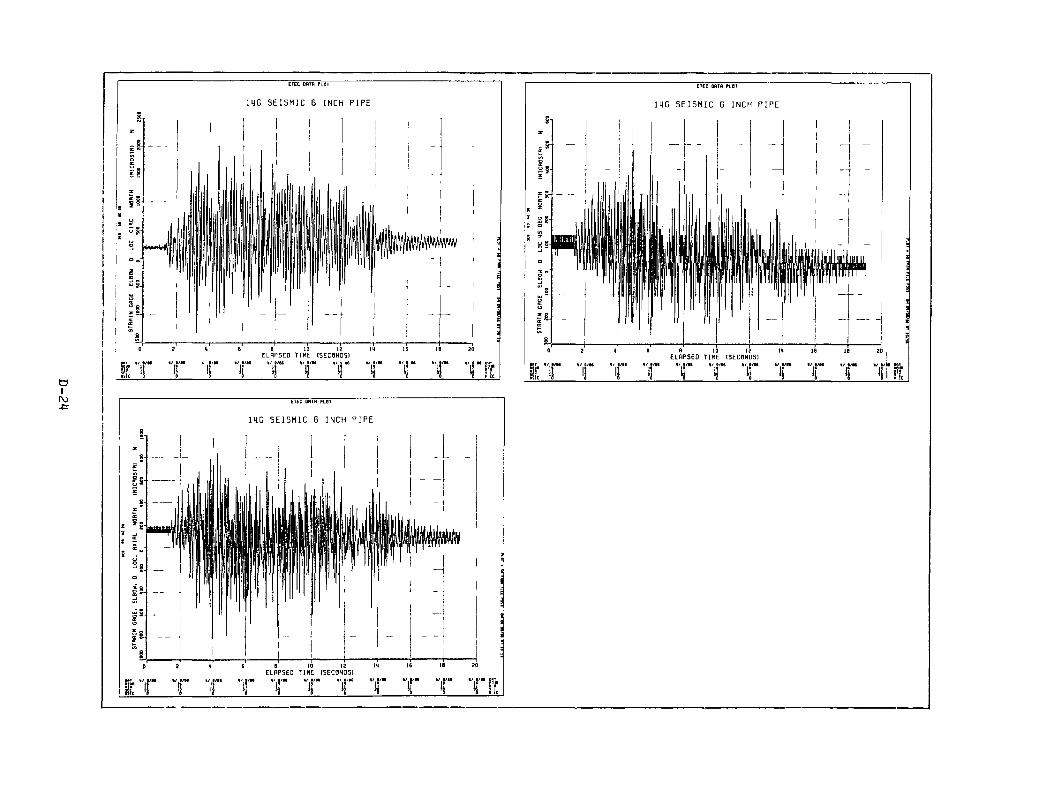
ETEC DflTR PLOT
pai «/ B/M
m. Is
IMG SEISMIC B INCH PIPE
T 'f I a/ac a/B/M ' B/M \i a ae %i a /n a/ a w «/ ff
il ij ij ij ij j / a M twT
! i I'C
J i -ETEC OflTfl PLOT
lUG SEISMIC 6 INCH PIPE
IT 1
par a/ a/M «/ I / N
I If 11 ELRPSED TIHE (SECONDS)
" / a/a* a/ a/M a/ a/M
i> i! \ \ ".!'" "'iP "iIT !?!>
ij il Wk
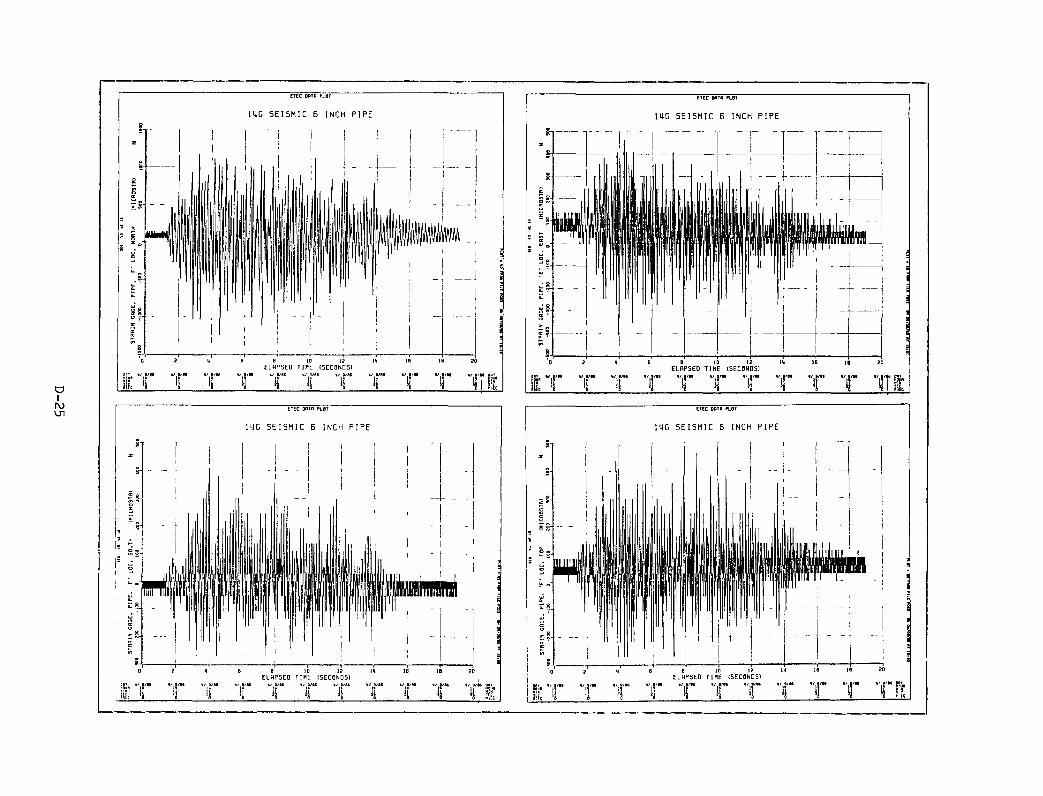
o I I\J Ul
/ P/M « / , .
ili. Ij
ETEC Dfllfi PLOT
m C S E I S M I C 6 INCH P I P E
ELRPSED TIME (SECONDS) a/ a/aa «/ a/as a/ s/aa a/ B/aa «/ e/a
il ij ij ij il
ETEC Dfllfi PLOT
m C S E I S M I C 6 INCH P I P E
B/ai «/ a/w c
J Lill
ETEC DflTfl PLOT
14G S E I S M I C B INCH P I P E
' B/Bi a/ B/M a/ B/BB pai
11 f ll ETEC DflTfl PLOT
m C S E I S M I C 6 INCH P I P E
ELAPSED TIME (SECONDSI / a/aa »/ e/aa a/M a/a/a« o-t
r il il ij ^ 1 ;[
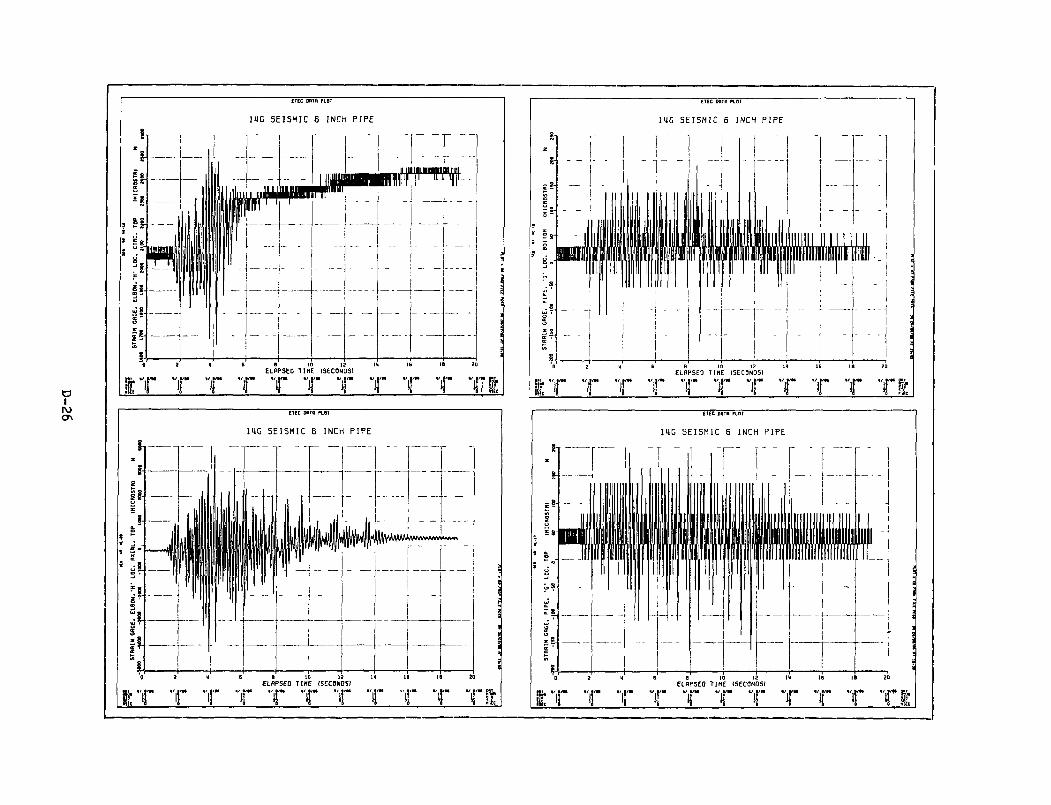
ETEC OflTfl PLOT
O I
mC SEISMIC 6 INCH PIPE
10 12 m 16 ELAPSED TIHE (SECONDSI
If "If "If T T T T T T T T l ETEC OBTfl PLOT
I IG SEISMIC B INCH PIPE
ELAPSED TIHE (SECONDSI
If "If T T T T T T T T T l
ETEC OBTfl PLOT
I IG SEISMIC 6 INCH PIPE
! 5 F "I a/M «/ a/M
•if" T T T T T T T T l ETEC DflTB PLOT
I IG SEISMIC 5 INCH PIPE
-i 1 'r-10 12 lU IB
ELAPSED TIME (SECONDSI
IT T 1'" T T T T T T T Ti
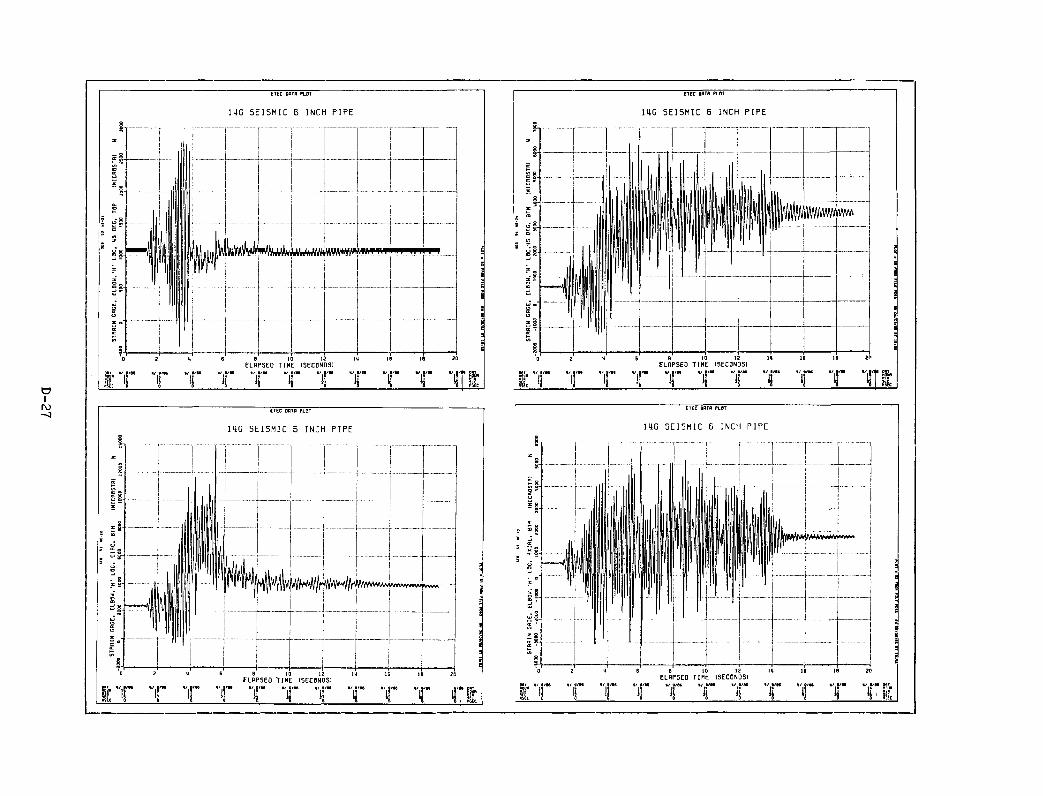
ETEC OflTfl PLOT
l i e S E I S M I C B INCH P I P E
^i<ftyH^<k>AAWrW^»'ViW*a*aiw^iwwaiiiaPW p i ^
ID 12 111 IB 10 20 ELAPSED TIHE (SECONDSI
I ll i! II i] il il il ij i! il ill I
ETEC DRTfl PLOT
I 4 G S E I S M I C 6 INCH P I P E
Sola ' " iS" ' " ' l ! "
if. ij ij
ELRPSED TIME (SECONDSI / B / M a/,a/aa a/ s«
1
B
' » • " •
1 1 1 1 1 2
J! 1 /B /M '•/.g/aa
ij il ij il
ETEC OflTB PLOT
m C S E I S M I C 5 INCH P I P E
ELAPSED TIKE (SECONDSI
IT T T T 1 f 1 f T T Tl ETEC DRTR PLOT
14G S E I S M I C 6 INCH P I P E
oai a/ 8/«e
i 11 ELRPSED TIME (SECONDS)
«/ B/aa a/ B/M «/ B/M
!1 il ii 11 1 Jl?
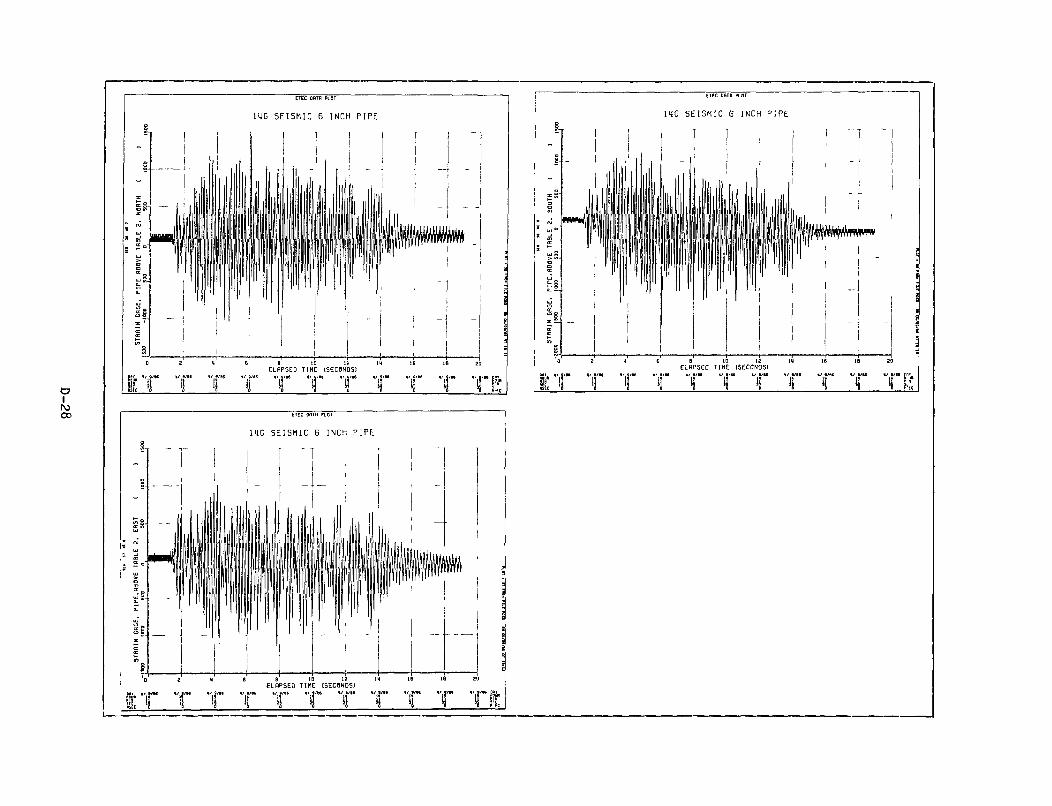
o I ro 00
ETEC DflTfl PLOT
mC SEISMIC B INCH PIPE
lit
«/ */ac «/ 9/BE a/ B/Bi
11 11 11 il ELAPSED TIME (SECONDS)
a/ s/ae «/ e/ai
il L I '•• >'.!'•• • ' , ! ' " " l l " ' " | i "
ij ij ij ij \
ETEC OfiTfl PLOT
14G SEISMIC B INCH PIPE
ELRPSED TIME (SECONDSI 18 20
a/M a/ i/Bc *',!'*< «/ B/M *',! '"'
T T 1
ETEC DflTfl PLOT
mC SEISMIC B INCH PIPE
I I
^.IfiHA^rt'ffWw*
ELAPSED TIHE (SECONDSI / 9/99 9/ 9/9. 1/ 9/m 9/ 9/89 9/ S/M 9/ . / . . 9/ S/B9 «/ . / 9 . 9/ 9/9. tHT
Ij ij ij I ij il if il il k

I ro
ETEC DBTB PLOT
25C SEISMIC 5 INCH PIPE
ELAPSED TIHE (SECONDSI
i" "ii" "ir if "f "f "f T 'jf 'f J ( T E C OflTB PLOT
25G SEISMIC B INCH PIPE
ELAPSED TIHE ISECONDSI
ill: 1 If 'if 'if "jf "j|"
ETEC OBTfl PLOT
2SG SEISMIC 6 INCH PIPE
k 1 ELAPSED TIHE ISECONDSI
9/jj/» 9/j|/« 9,||/» „j|/9. ,/|,9. 9 /™ 9/j,« , /«,. T*
ETEC OflTfl PLOT
25C SEISMIC 6 INCH PIPE
_J-
ELAPSED TIHE (SECONDSI
.'15'. !
./j^/9. . j ^ 9 . 9/^/.9 ..^, . / j j / ^ 9/^/.. ..^. 9 / ^ / . 9 / ^ .

I T E C OflTB PLOT
25G SEISMIC B INCH PIPE
ELAPSED TIHE (SECONDSI
jT .,j./» . - j | - .-jj/» . / j j - m-m ,/jj/« ./pm . / 1 | - ./ j j /- ./«/» «y/- [.
CTEC OflTB PLOT
25G SEISMIC 6 INCH PIPE
ETEC DBTB PLOT
25C SEISMIC B INCH PIPE
ELAPSED TIHE (SECONDSI
IT T T T T T ETEC DBTB PLOT
25C SEISMIC B INCH PIPE
ELAPSED TIME ISECONDSI
flS" " I j ' " " I j " "Ij" " i j " "jj"* " j j " "jj'" " j f "jj'" " j f 'RJ.
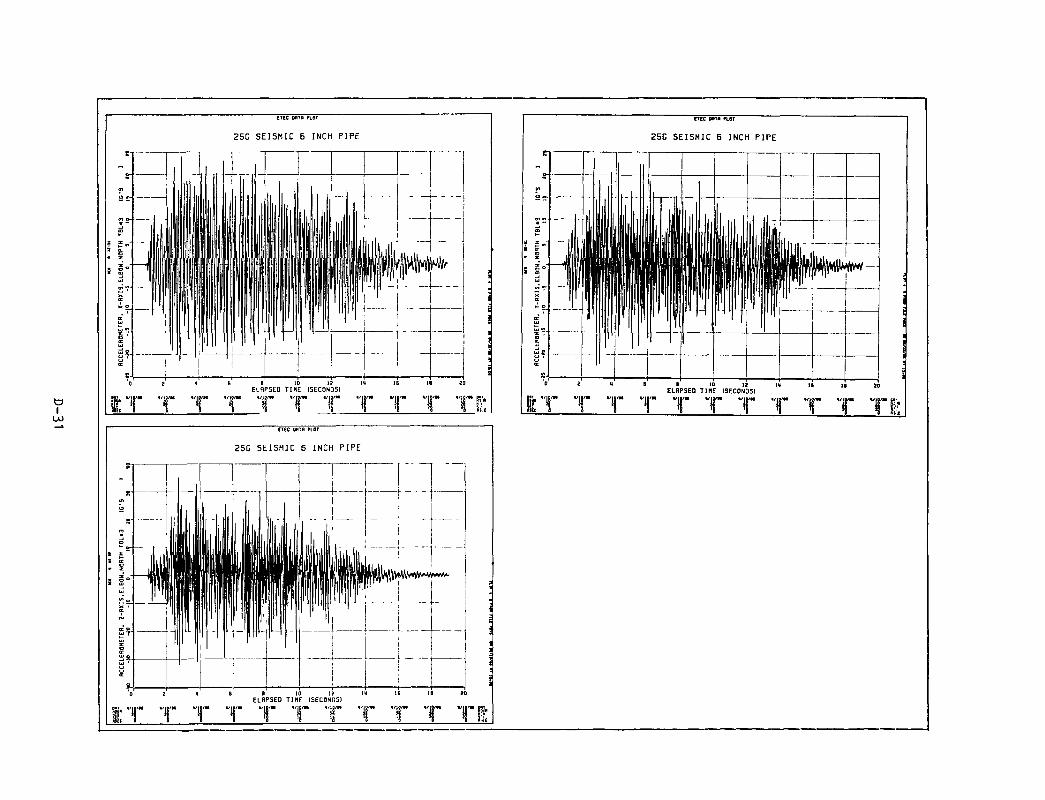
m —
7 ; « •
. i" „•«-a
a:
—
—
—1
1T
1 1
li 1
1
i i |
"r 1
ETEC DflTfl PLOT
25G SEISMIC 6 INCH PIPE
1
III , 1, 1 1 , I I I "In 1
. —
.1 1 1 .lull Jl : lU 1 m ni 1 ll 1 11 l l n 1 1 i n 1 . . 1
i l l lift lilli R III l i t] lllii
11 1 1 i 1 II 11 11! 1 1 II 1 i fl n 1 ly iiiin i 11 1 III 1 11 1 ~ i 1 1 1 1 1
I
i| ' " , ' (
— 1 -
I 1 1 I ' l 1 ._.
r II 1' ' | i ' '1 "1"!
1 !iiiiiiiiir ' 1 '
i< 1 1 1 ' 1
^ B 8 ID 12 14 IB ELAPSED TIME (SECONDS)
"f "r 1 - "j " "f "f "If"
_ —
—
4 —
t4k—
18 2 J
"f "if
•
i : i
I
5 t S
fi;.
CTEC DflTfl PLBT
25G SEISMIC 5 INCH PIPE
aai a/ig/«
I 1 ELAPSED TIHE (SECONDSI
"jj'- "ij'- "jj'- "jl'- "p'- "jj'- "I-- "«'- "jj' i'jc
ETEC OflTB PLOT
25C SEISMIC B INCH PIPE
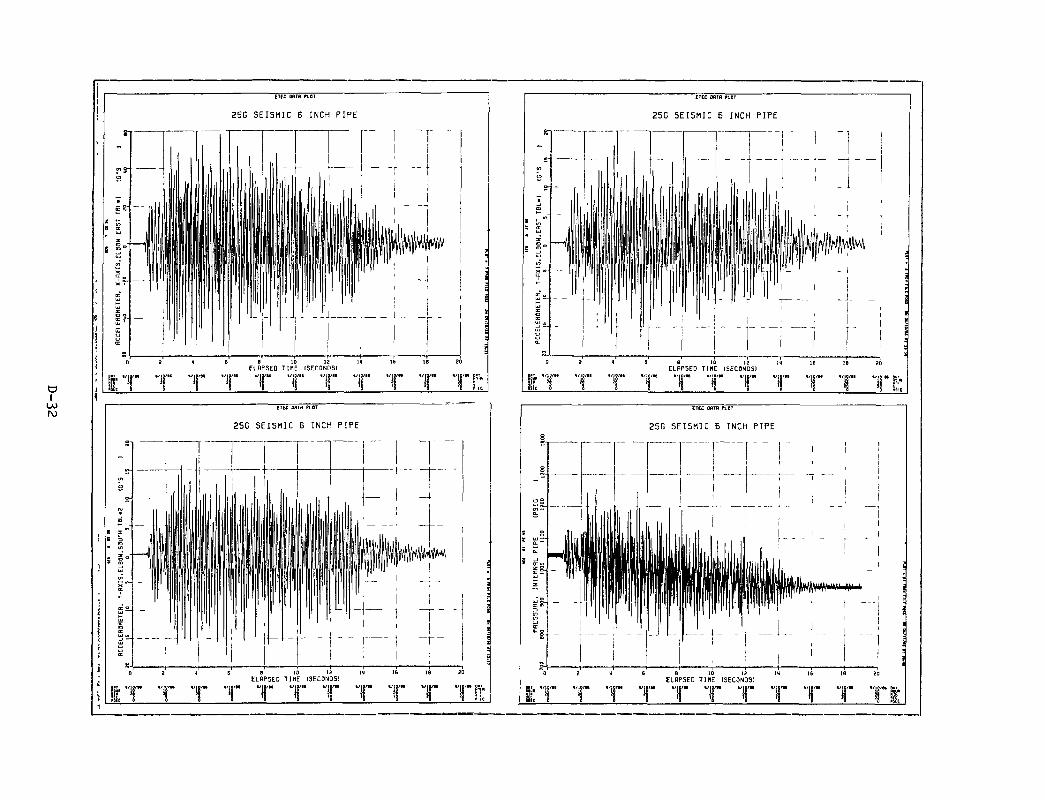
ETEC OflTfl PLOT
25G SEISMIC 6 INCH PIPE
ELAPSED TIHE (SECONDSI
"18'" " i r ' "W" "il'" "W" "ir" "!!'" "iS'" "!!'" 5'«
ETEC DBTfl PLOT
2SG SEISMIC B INCH PIPE
ELAPSED TIME ISECONDSI
'if "ii'" "jl" "j|'" " f "j| jf "jf "jl"!]"
ETEC OflTfl PLOT
25G SEISMIC 6 INCH PIPE
ETEC OflTB PLOT
25G SEISMIC B INCH PIPE
>fjffiHfm-t^iA
ELAPSED TIME ISECONDSI
1:1' i/at a/JS/a* *< [ p . / j | , - ./j|« 9/J|,» ,-J|/9. 9/^,« ,/J| / . ,/J|/9. „ ^ , - . , ^ / « | ,
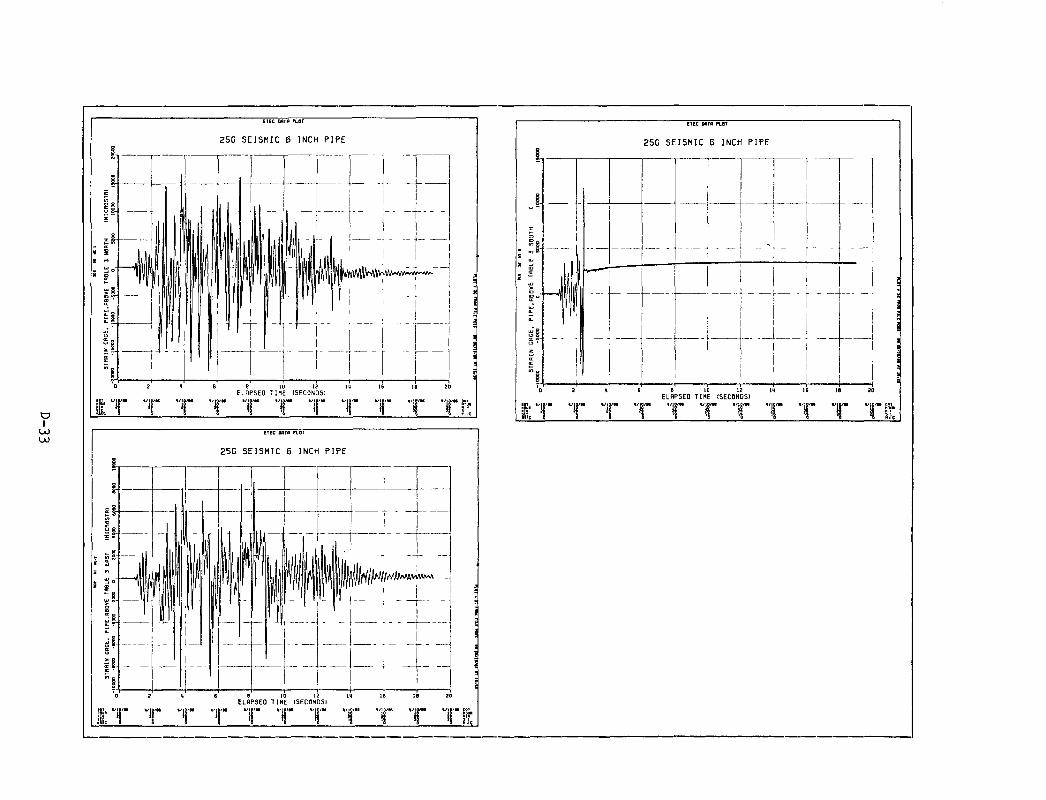
ETEC DATfl PLOT
25C SEISMIC B INCH PIPE
18 20
1*1 a/IO/aa a/ia/M a/io/M a/io/M a/io/M a/io/M a/io/H «/ig/M a/io/M a/iD'
i: ^ 1 'j I if i ij if ^ is l/M . / I f i /M DOT
ETEC OflTB PLOT
25G SEISMIC 6 INCH PIPE
ELAPSED TIHE (SECONDSI
I "T 1'" T T T T T T T T T •''"
§
UJ a -J
si cr •"-o '
cr
ETEC OflTfl PLOT
25G SEISMIC B INCH PIPE
i
J ^ i
1 1 [ \
i i .1 _ . 1 .
1 1 1 1
i
t
i i i
1
1
i 'o' S' u' G' $' 10 12 1*1 16 IB SO ELRPSED TIME (SECONDS)
.„.9/J^/. „ ^ , . . / j p ./J^/. 9/,^,. . , p 9/jJ/.. 9 /^ . . / j ^ . . / j ^ . ^ ^
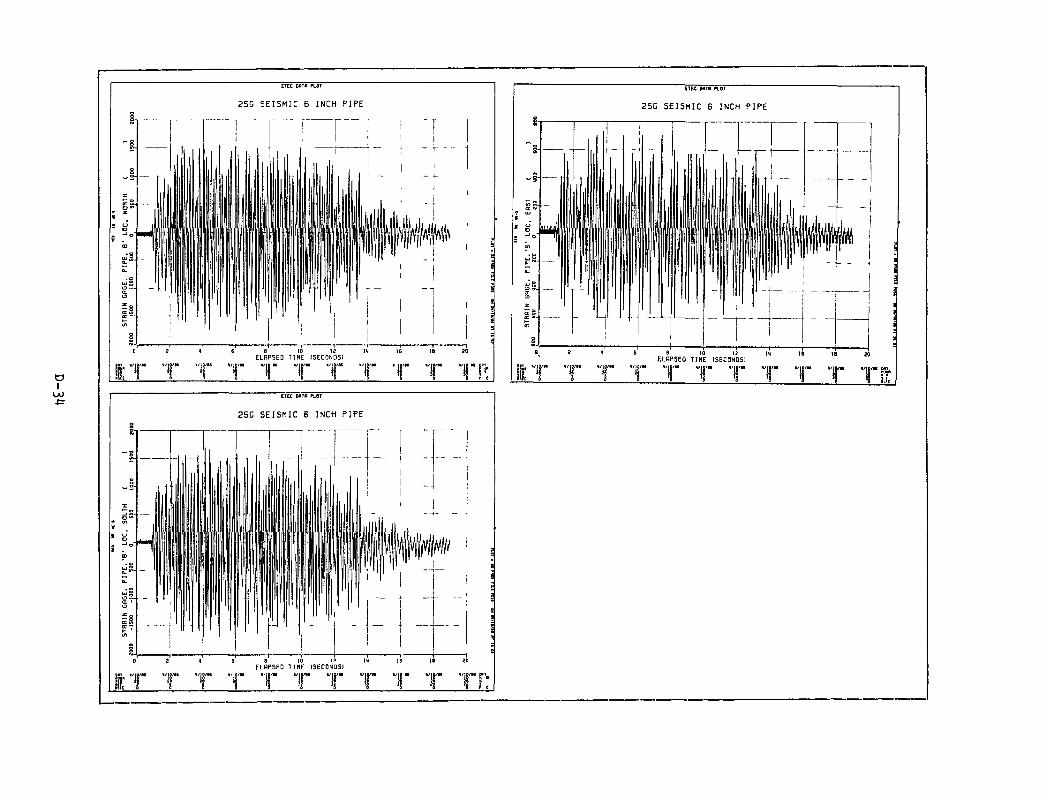
o UJ
ETEC OflTfl PLOT
25G SEISMIC B INCH PIPE
ELAPSED TIHE ISECONDSI IB 20
I T T T T 1" T T T 1 r TR
" -
_i X
- v> r 8 <->
03
uj'S
UJ S
- g
tn
° 0
—
—
i: T
—~l l
1
1 1 11
2
" i r
-
1
m
1
n
T
ETEC OflTB PLOT
25G SEISMIC B INCH PIPE
ll ll 1 III, 1 1 1
[ 11 III III III Ll I I I , ( I I
—
^ ' 1 l l 1
1 1 1 1 1 1
1 i 1 i 1 i ' ' 1 II ll 1 1 III ' * * 1 I y r y y g 1 ( ' < 1
'
1
' M
'l __.. • . . . _ ' ._ ._ i._ .______.
B a 10 1? i>i ELRPSED TIME (SECONDS)
"i|'" "jf "if "jf "jf •
1
1 ! 1
1 1
Mill
''
1
IE
r
-— —
J i
ll IJ
TOlMnI | l M' "
j
'
18
T
-
I i
1
2
T
:
J s
*
t
I T E C DflTfl PLOT
25G SEISMIC 6 INCH PIPE

CTEC OflTfl PLBT
25G SEISMIC B INCH PIPE
ELRPSED TIHE (SECONDS) ID/M *' |I '**
I T "f "T T T T T T "f " T ETEC DATA PLOT
25G SEISMIC B INCH PIPE
IT ELAPSED TIHE (SECONDSI
"tt" " I J ' " "tt" "li"
IB 20
ETEC Oflffl PLOT
25G SEISMIC 6 INCH PIPE
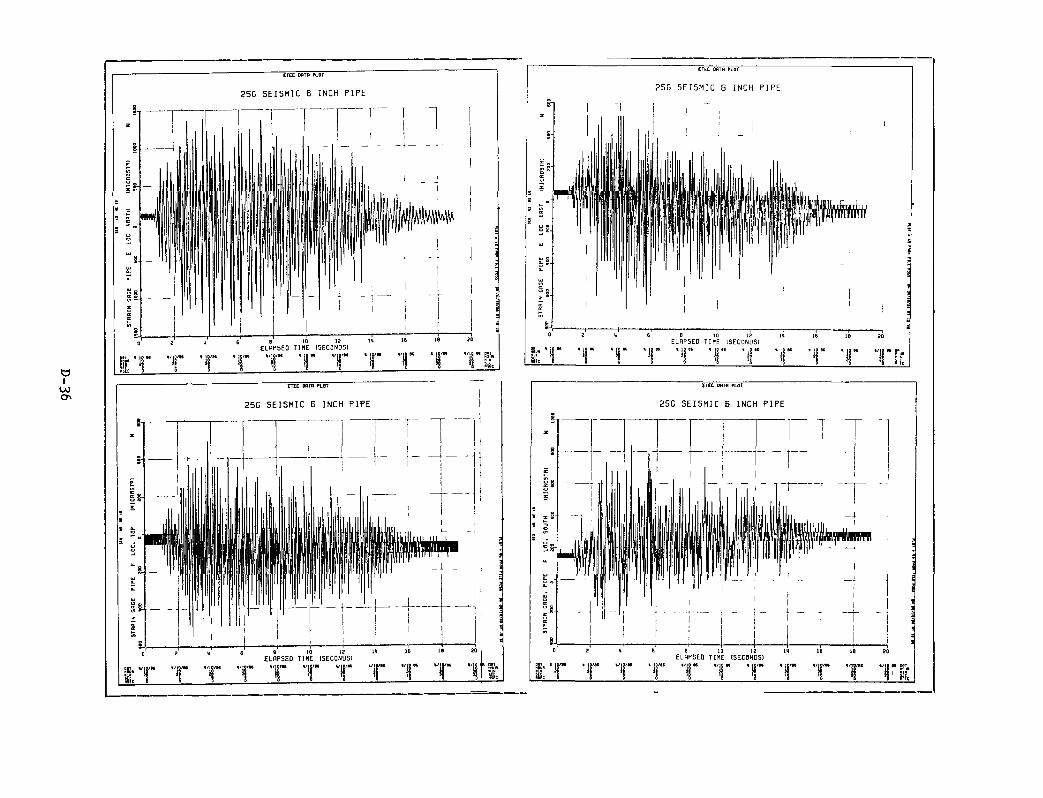
ETEC DBTB PLOT
25G SEISMIC B INCH PIPE
ELAPSED TIHE ISECONDSI
|-i|" y -if 'if "f -If "jf -f "jf -f r^
ETEC Onrd PLOT
25G SEISMIC B INCH PIPE
8 to 12 ELRPSED TIME (SECONDSI
16 IB 20
if -if 1" -ll" - f ' f 1 ' ETEC DflTfl PLOT
25G SEISMIC B INCH PIPE
ELAPSED TIHE (SECONDSI .'IS " 'ii I " "ij j | " "j |" "j|'" ' j f "j|'" "j|"
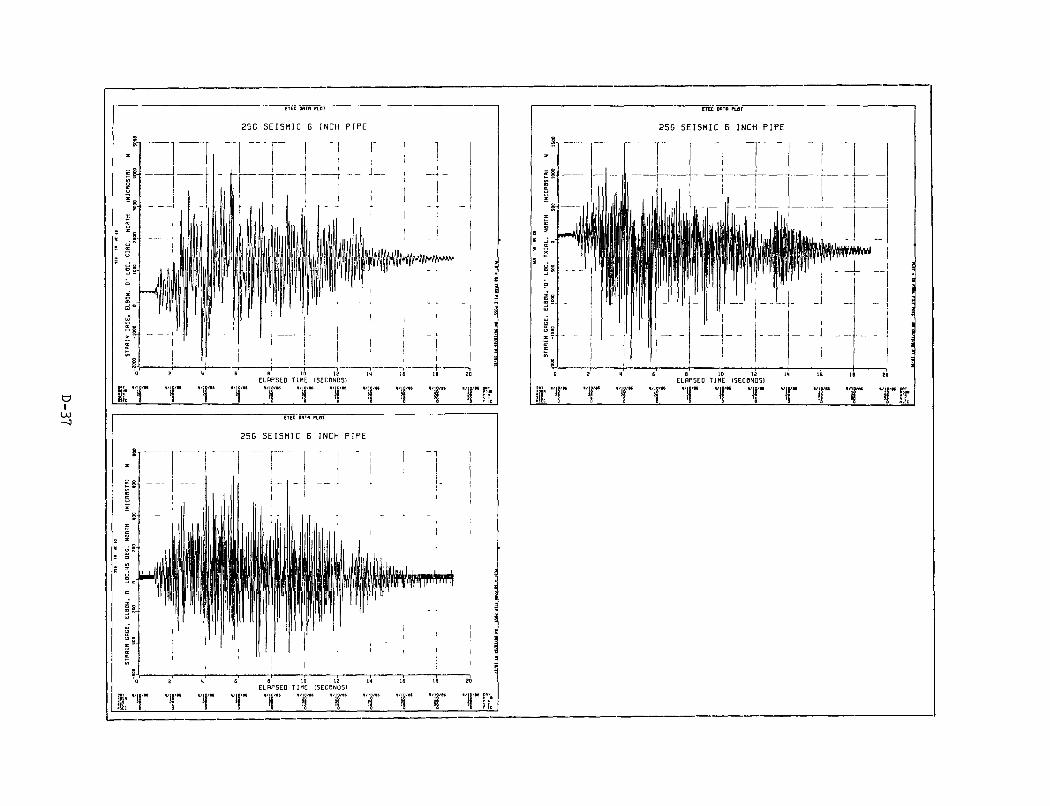
ETEC DflTfl PLOT
25C SEISMIC 6 INCH PIPE
UJ
ELAPSED TIHE ISECONDSI
I!'.. 9/lO/W 9/10/9. ./)D/M 9/ig/«I 9/)0/9B 9/10/9. 9/10/9. 9/ip/M ./ID/.C */IO/9
I ' ! i i ^ k ^l ^i i i i ETEC DO'fl PLOT
25G SEISMIC 5 INCH PIPE
nj a/iD/BB a/ig/Bt « / ID/M BBT a/ip/BB a/ig/Bi
Hie g S
ELRPSED TIME (SECONOSJ a/io/as a/ig/BB t/ig/BG
ETEC onrn PLOT
25G SEISMIC B INCH PIPE
Wtt^
"ir I
ELAPSED TIHE ISECONDSI
9/ID/9. . ' I S ' " . ' I R ' "
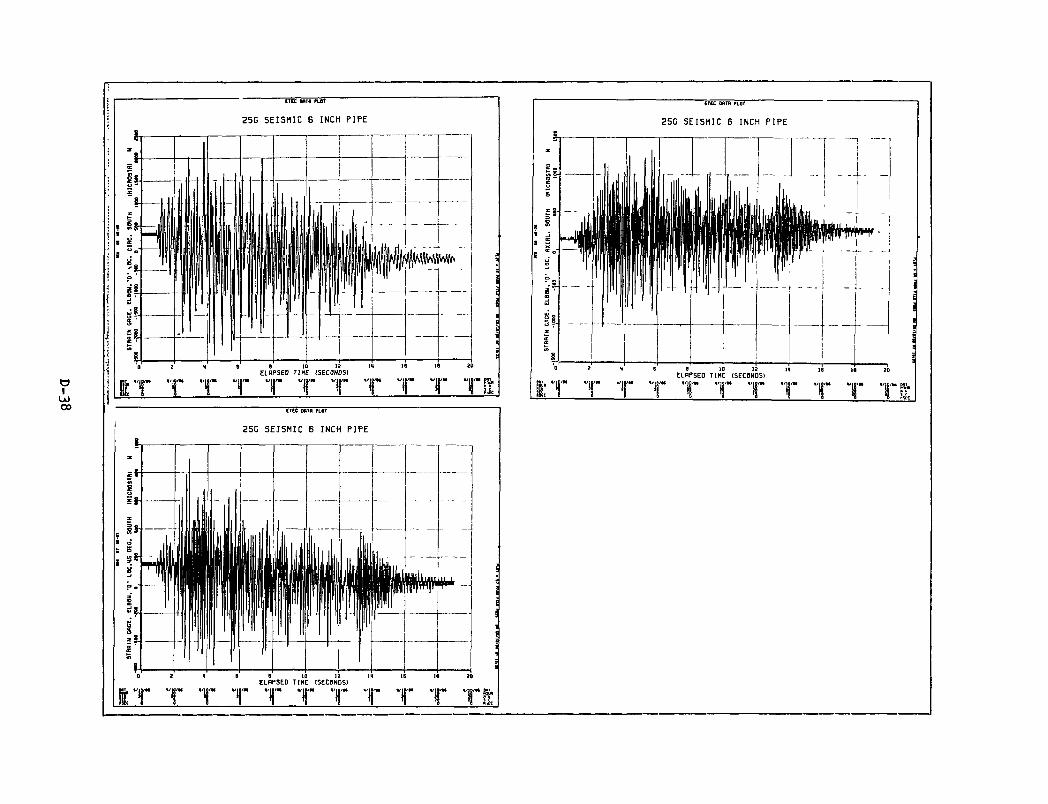
o I
LO 03
ETEC OflTB PLOT
25G SEISMIC 6 INCH PIPE
ELAPSED TIHE (SECONDSI
I "Ij" "i|'- "I" Y Y "f" "f" "f "f |/N «/]S
1 1
1 ^ »
° o
is-
, h i a £ g
i
i 5?-
i 0
ll
4 __
,
- j
i,yy i '
IT
1 -'
2
'11'*'
ETEC OflTB PLBT
25C SEISMIC B INCH PIPE
ll 1 ill It \uBii y
1 'I
l l
t 1 1 llli
It l l - 1 ll. T.
1 1 , 1 1
1 hi 1 1
i l l If
1 — 1 '
Ill 1 1
r^i
1 1 1 1 i
1 1
1
i 1
It 8 8 10 12 1 ELAPSED TIME (SECONDS)
"f "f "f "f "f "fl
i {
f 1
^
—
p
—
" "f
—
w
_
1 ^
-
-
18
Y 2
a i 9 i d 1 1 a
T l
ETEC OflTB PLOT
25G SEISMIC B INCH PIPE
ELAPSED TIHE (SECONDSI
| . " I " . ' I " .'jj'" .'i|'" .'|- " I - - 9/j|/" 9/j.,- ,/j./„ 9, ,.. 9/ /.
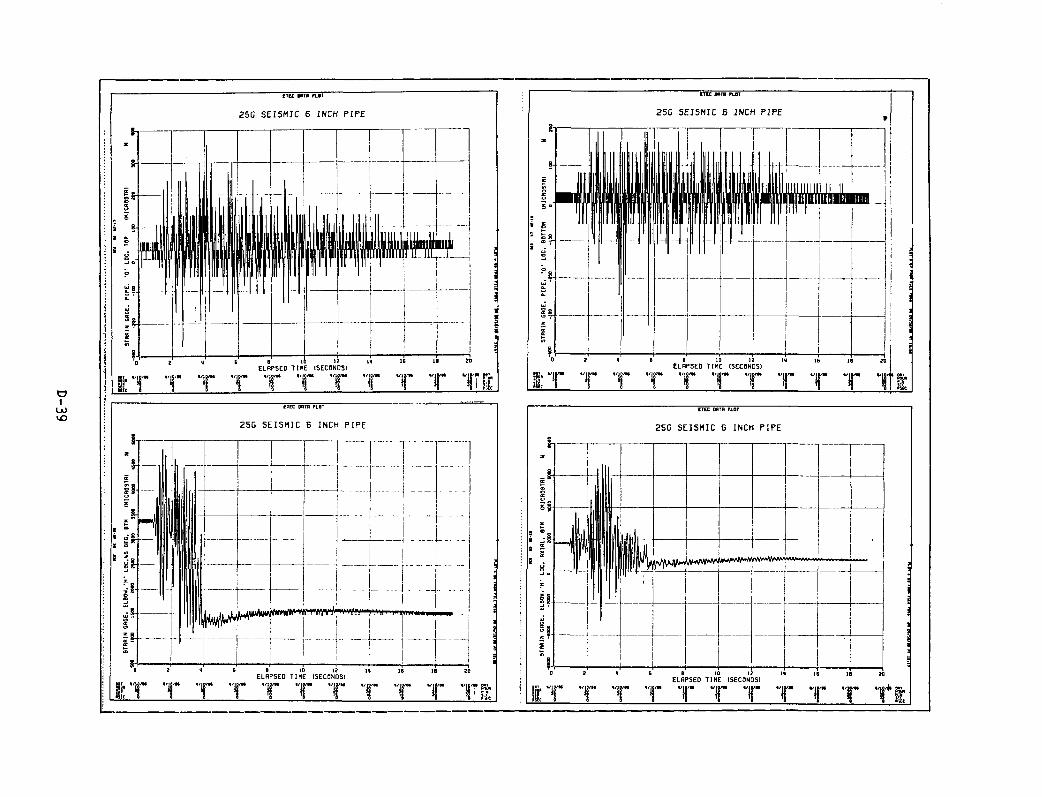
I IJO
4 I-
ETEC OflTB PLOT
25G SEISMIC 6 INCH PIPE
ELAPSED TIHE (SECONDSI
I T T T T "f T T T T T T
1 X
i-
X
J
5
1
1
EUC DflTA PLOT
25G SEISMIC B INCH PIPE
1
II 1
" " I 1 1
'1
l| 1 Ni> ffiff»'i>m iftini^My^-MJ
1
i
1 i
. - - -
""o' Z' <l' s' B" 10 12 u 16 IB 2 ELAPSED TIHE (SECONDSI
g,. /Jj / - . / j j , . ./jj/- . / j j / . 9/jj,. 9/jj/. . /p/. ./j j , . ./Jj/. ./Jj/. ,/
i 1
i
1 1
\ ! 1
!
' ll
ETEC OATH PLOT
25G SEISMIC B INCH PIPE
a/iD/M «']||/** « / ) l a/|0/M ,/u« ,/ m a/|o/M a/io/M a/jo/M ./JJ/M a/jj/M „>g,
i l
g. <c
I _j a
il.
1 0
-i
1T
ii
J il
~
1
2
Y
1
ll
n
"!
ETEC DflTfl PLOT
25C SEISMIC B INCH PIPE
lii ||lp|A
' fJfJ'ih' U«w>w f*"""^
— -~
i
B B 10 12 l l ELRPSED TIHE (SECONDS)
/. . / j j / . ./Jj/. ./Jj,. , / j j , . , / j j , -
16
T
- —
- - r -
18
"f 21
i i i i 1 1 i 1
-
T l
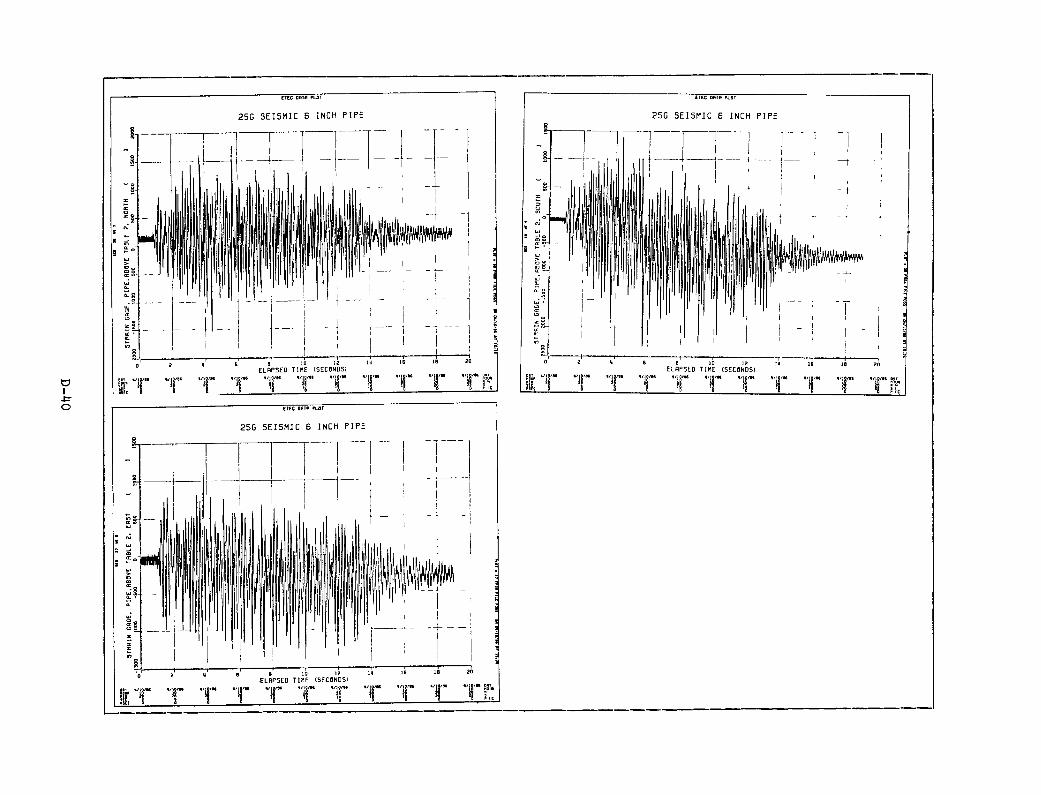
ETEC DBTfl PLOT
4r O
25G SEISMIC B INCH PIPE
!-"!|'" "i|'" Y T T 1 f" "T "f" 1" Tft ETEC OflTfl PLOT
25G SEISMIC B INCH PIPE
ETEC DATA PLOT
25C SEISMIC 6 INCH PIPE
mkiMk^
ELAPSED TIHE (SECONDSI "11 '" " U ' " "11 ' " "11 ' "
nij
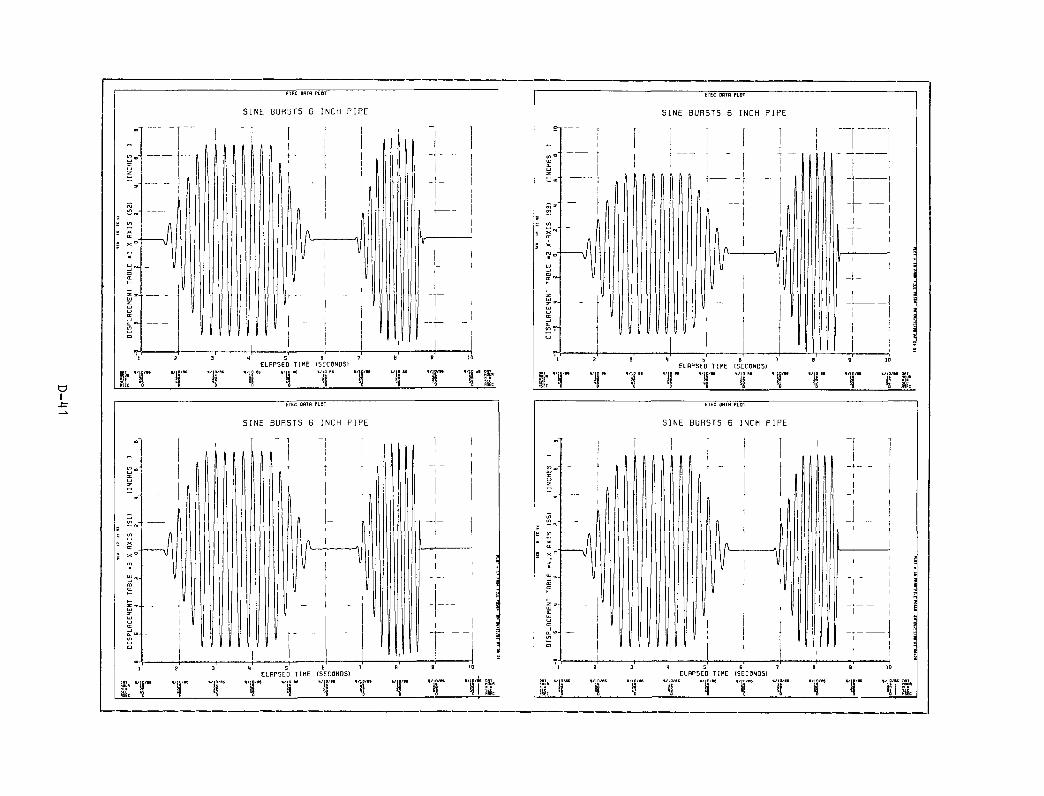
o I Jr
ETEC Df lTf l PLOT
SINE BURSTS B INCH PIPE
ELAPSED TIHE ISECONDSI DOT ./lO/R. 9/10/99 9/10/9. ./JO .9 9/10 .0 »/10 06 9/J0/99 9/10
E k ^ k k ^ ^ 1 I a/10 M DAT
p ST *l Sic
ETEC DOTH PLOT
SINE BURSTS 6 INCH PIPE
' [ I
ETEC DflTf l PLOT
SINE BURSTS 6 INCH PIPE
1: "f ELRPSED TIME (SECONDS)
BE a/jD/aa a/iD as
f 1" T Ti ETEC OflTB PLOT
SINE BURSTS 6 INCH PIPE
ELRPSED TIME (SECONDSI ID/N a/{
"I D/aS DAT
i ic
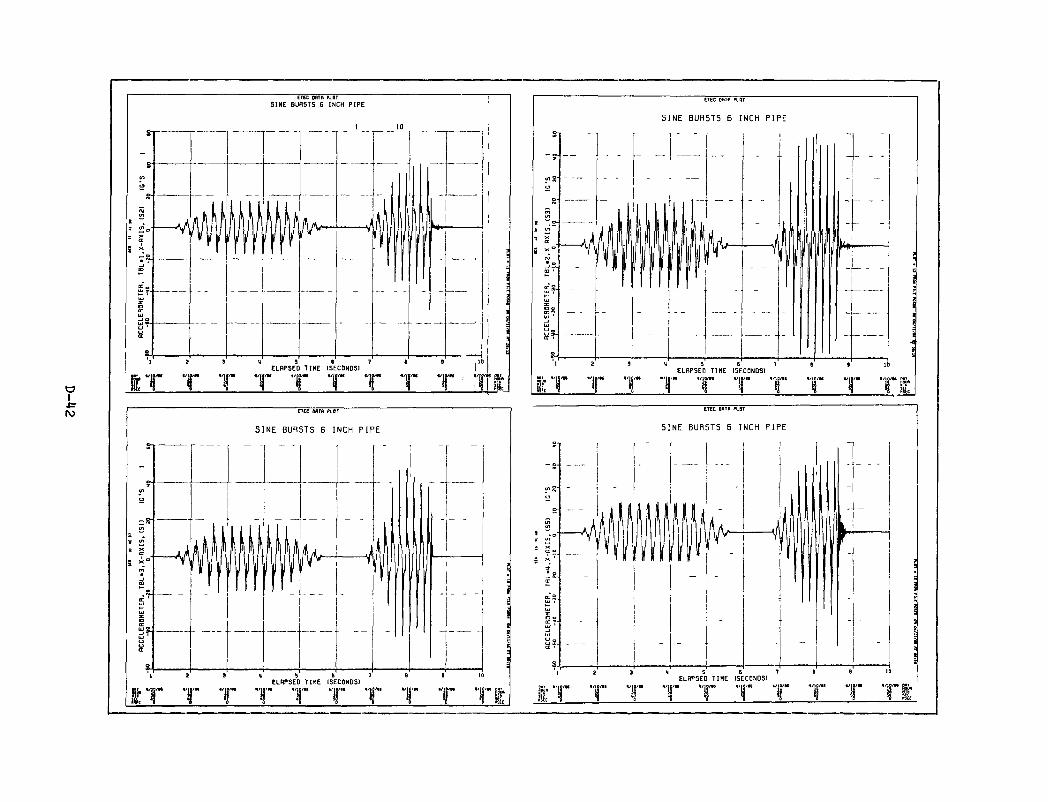
l\J
i n
u
s-r? in
" a: 5 n
-s.
• C o t - '
ds.
s_ 'T
IT
• A -v r
L I I
ml * w
M
i' >
"f "i
ETEC OflTB PLOT SINE BURSTS 6 INCH PIPE
1
__ ._
11 \\\ 1 V
\
"
1 1
11 ' 1
A A^ 1, M / V "
' t f t f 1
, -J V
1
.1 If 1
H 5 6 7 ELAPSED TIME (SECONDS)
Y "f "f "f
10
1 1
_ 1
1
1
1 1 1
»• >•
8 B
"f "f •
, J - . ,
1
1 1
i "
1
.ri
1
i
1
'
1 ?
! i 1 ''
1 s
1 ^ 1 c ^
1 ^
' BoUM
ETEC DflTfl PLOT
SINE BURSTS 6 INCH PIPE
ELAPSED TIHE (SECONDSI
I T T T T T T T T T T l
ETEC DflTfl PLOT
SINE BURSTS 6 INCH PIPE
ETEC OflTfl PLOT
SINE BURSTS 6 INCH PIPE
ELRPSED TIHE (SECONDSI
jr "if "jS i| || i f "jf "ij "jr Tr
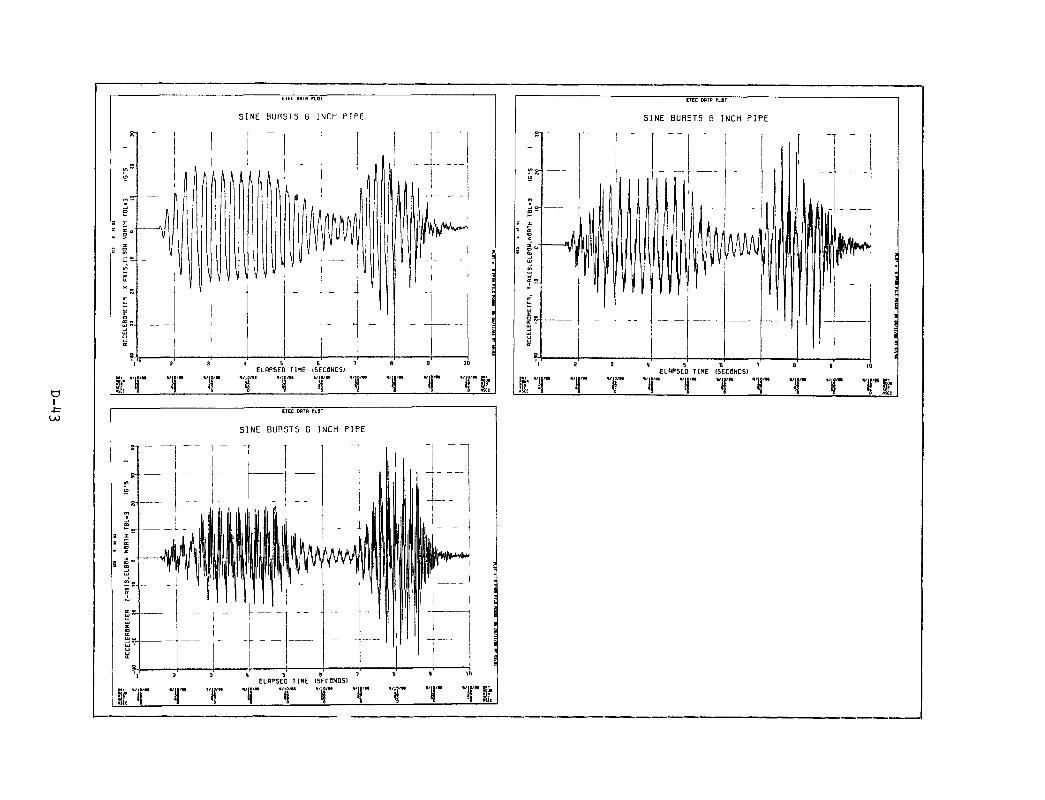
1 ll il I if I ^ I if I If 1 ./Bl/. ./if/. M/jl/9 90/81/. M/ol/. M/oI/. ./BI/9 .9/31/. »/BI/» 1.8 (SDN033SI 3HI1 DBSildTS
3dld H3NI 9 SiSUng 3NI5
lOTa tfmo 3313
./!!,. mAu ./!!/. ./!!/. ./!!/k .,1!/. ./!!/. ./IL •;!! (5DN033SI ami DiSdUTJ
3dld H3NI 9 SiSUng 3NIS
igTd mm J3i3
i ./L 9i/if/9 ./ll/. ./li. ./oM/. ./li. „/L ./li. ./li/. Ji. 'i (SDNII33SI 3HIi D3S<idT3
3did H3NI 9 Qisyna 3NIS
( 1
i' r j
"^ 1
1
1 iJ
, y—
' hUH
Pljll|/| 1 . ' y
|| r \ 1
—1—1—'-, 1
!
ndU . -
nnff 1 1
iOld HIM 33L3
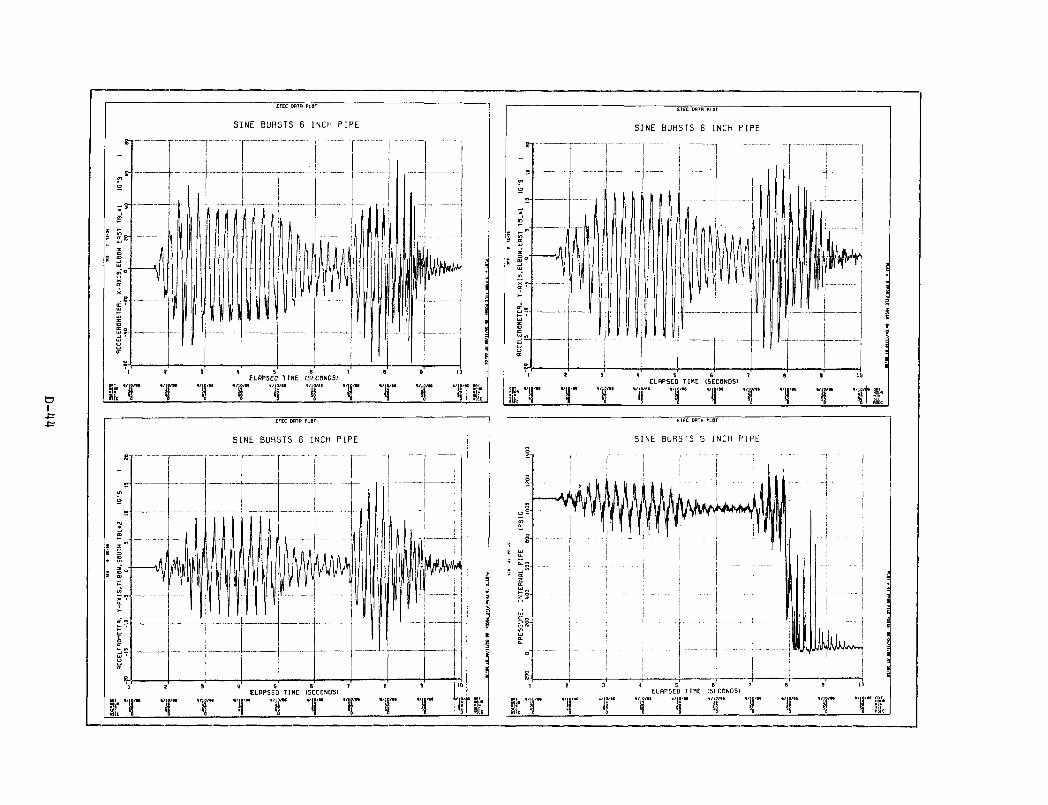
ETEC DflTfl PLOT
SINE BURSTS 6 INCH PIPE
ELAPSED TIHE (SECONDSI
I T T 1 i r T T T T T\ JiU
ETEC DflTB PLOT
SINE BURSTS 6 INCH PIPE
ELRPSED TIME ISECHNOS) a/jo/aa ana/N %noiu a/io/M a/io/M aqo/M " ! £ ' " " I E ' "
i •ij •! ij i H ^ ^ aic
ETEC DflTfl PLOT
SINE BURSTS 6 INCH PIPE
IK. " j p lie '!
ELAPSED TIHE (SECONDSI
"f "il ij if "ij"' "}| ^ f T l ETEC OflTfl PLOT
SINE BURSTS S INCH PIPE
ELAPSED TIHE ISECONDSI
1 i 1 1 : ! 1 '
j : j 1
""• l-" 1 1 1""-• i i
KMMj
-
1 I
1 1 •'"—""•— i
J 1
1 1 1 \
Ji l lJ jJ iw^ 1 i
«/ID/B« a/iD'M a/io/at a/io/w a/io/aa a/io/M %'iOiis mi^
51 k i i k 1 ^ i
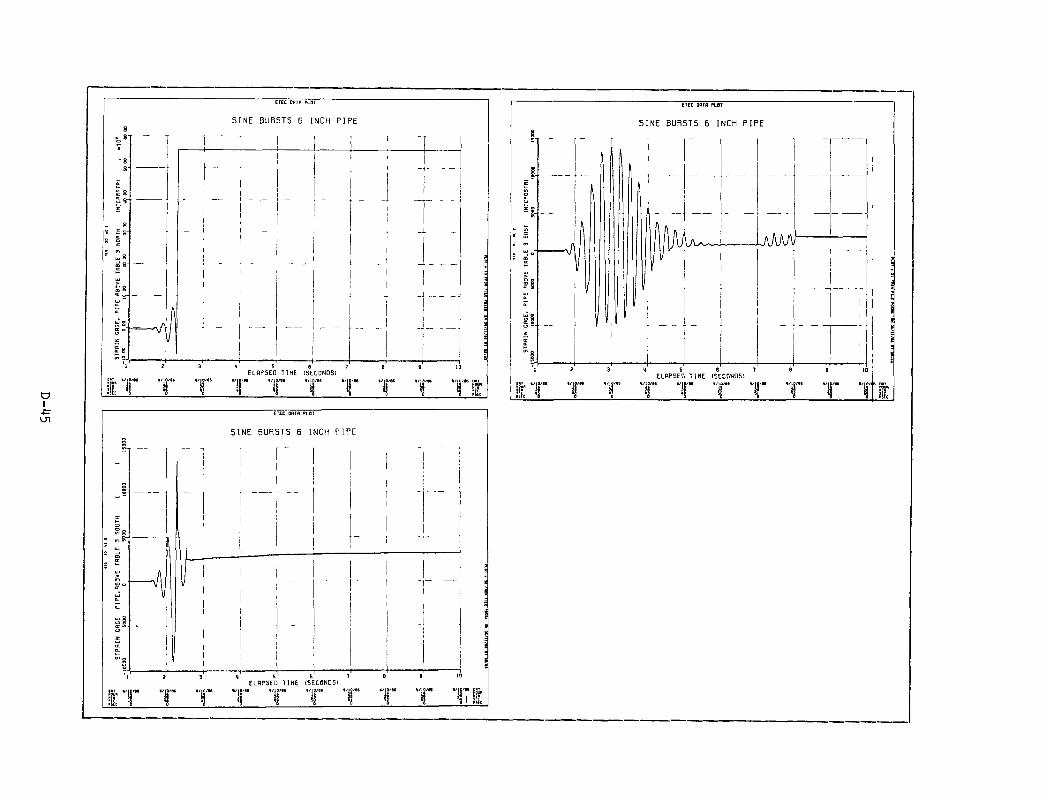
ETEC OBTfl PLOT
SINE BURSTS 6 INCH PIPE
ELRPSED TIME (SECONDS) it*T a/io/M a/io/aa a/io/aa a/io/aa a/io.
i l if ^ i| if k
' s
" s s-
s s
s s-
s
-g
g 2-
1
~
-\A \ (1
J
1 ^
'
1 1
1 1
1
1 1 i , 1 ,
-
1
1
'
. _ _
' i
-
— — -
1
I
1
t
1 1
' "
-
- -
-
—
r T T
"
g
"-^
£ *"
m o
•^g
EE *" a
-A I
1
I T T
ETEC OflTfl PLOT
SINE BURSTS 6 INCH PIPE
1 r 1 [ 1 ' 1 1 1
i
1, "
" 1
! M L — — •
1 ' 1 1 :
1
1
1
a' t' s' B' I ' ELRPSED TIME (SECONDS)
• "if" "ij'" "if 'li'- "If a
"1
1 1 1 . _ i
[
1 l
1 1 i
1 =
i I
1 ! 9 1 "
r T T l
ETEC DBTfl PLOT
SINE BURSTS 6 INCH PIPE
ELAPSED TIHE (SECONDSI
I T T T T T T T T T 1 w
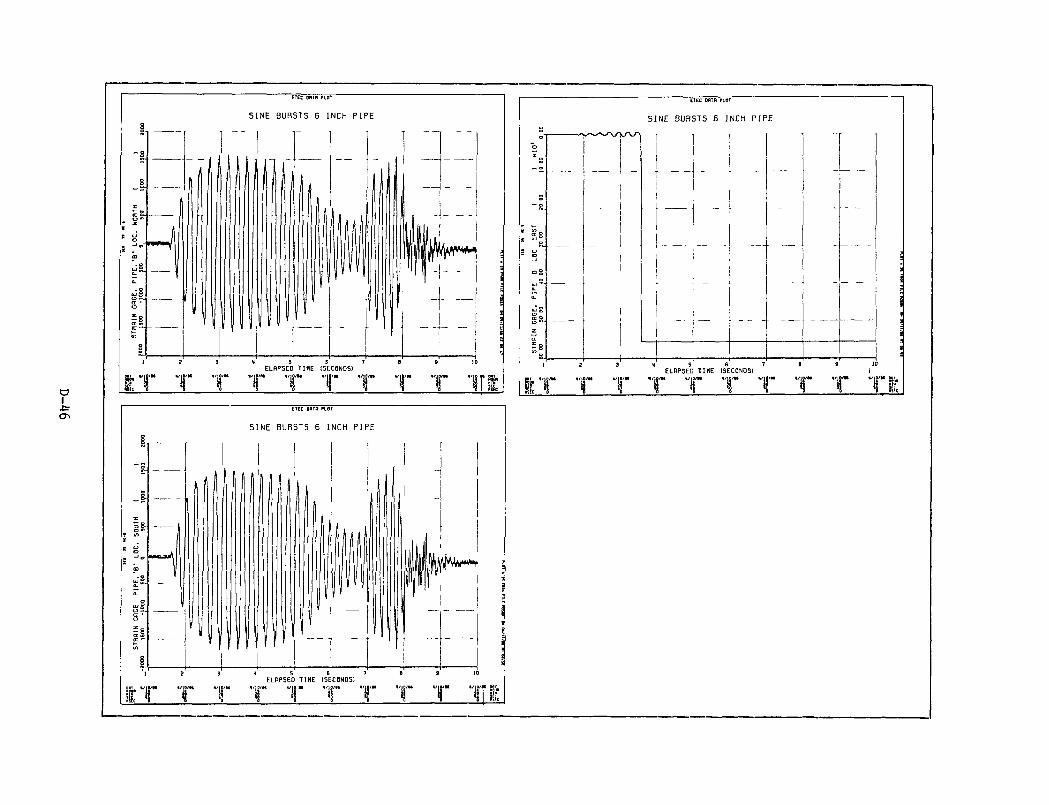
o I
ETEC DflTfl PLOT
SINE BURSTS 6 INCH PIPE
ELAPSED TIHE ISECONDSI I/n . ' I S ' .
IT T T T T T 1 ID/M "'I?'**
U l ETEC OflTfl PLOT
SINE BURSTS B INCH PIPE
ELAPSED TIHE ISECONDSI
l"f "f "f "if T T T T T T l
g
" g
0-
z
a:
-
—
ETEC DflTfl PLOT
SINE BURSTS 6 INCH PIPE
~
-
•
i
I
1 ?
B
1 8
i ' 2' i <*' 5' e' 7 ' B' 9' ID ELRPSED TIME (SECONDS) 1
,„. /Jj/- ./Jj/. Y Y T T T T r f l
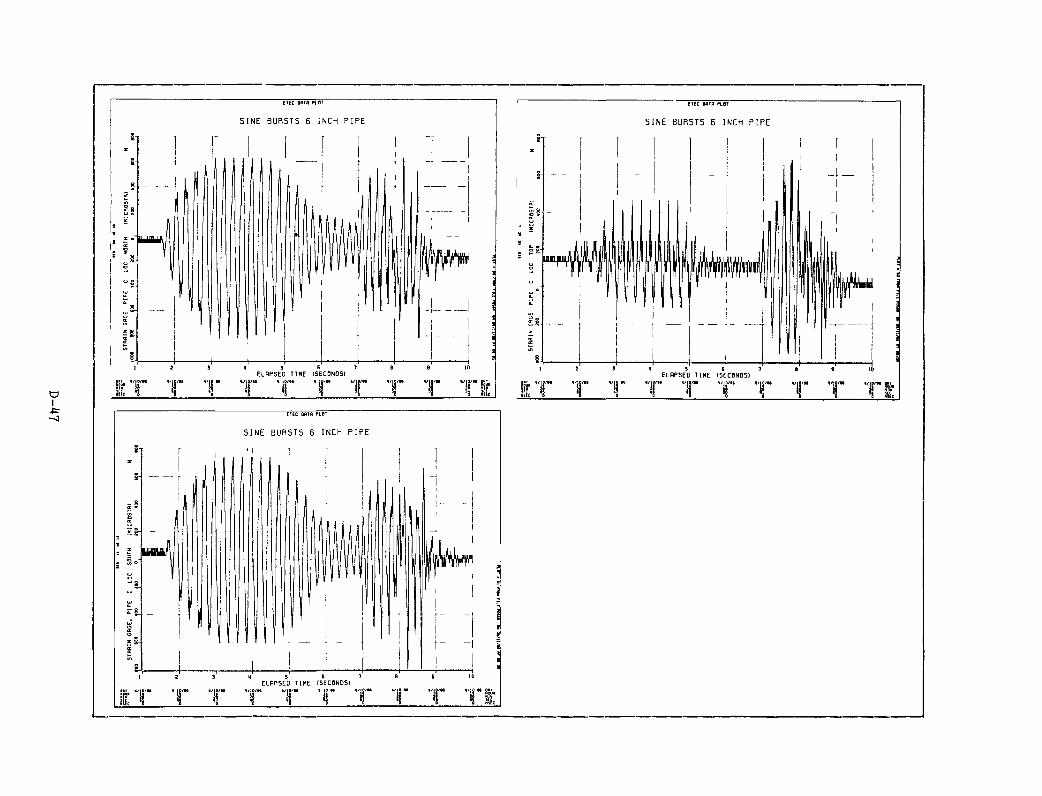
3did H3NI 9 sisang 3NIS
1 l| iwt M ol/a I ll I ^ ii 1 Et/a M/ai/a M SI a N/Ol/a aa/ol/a M/ol/a ISaN033S] 3HIi D3Sdtn3
JOTJ liiBO 33U
3did H3NI 9 sisyna 3NIS
IBId aiUO 3313
IL/L ./li. X ./If ll. -/I. 99/L X X .,li.l (S0Na035l 3WI1 03SdUT3
3dld H3N1 9 5iSUna 3NI5
lOld DIDO 3313
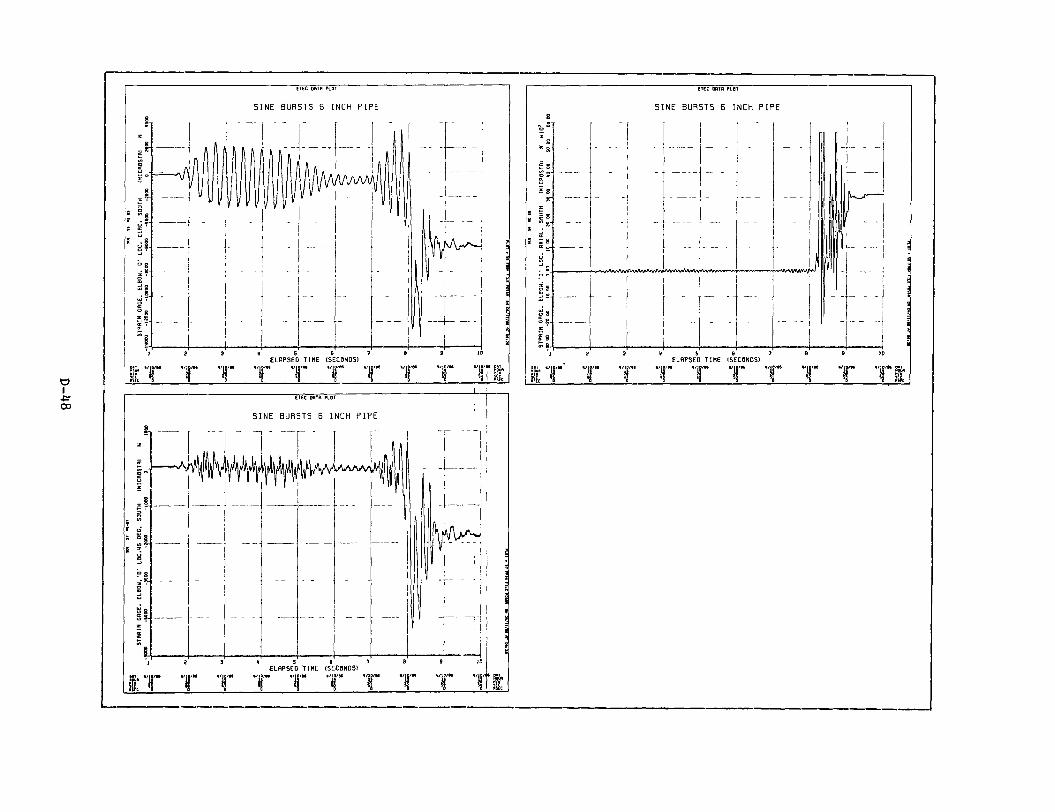
o I
00
ETEC DflTfl PLOT
SINE BURSTS 6 INCH PIPE
ELAPSED TIHE (SECONDSI ,10/99 9/10/1.
I T T 1 i r T T T T T l
8
z
£
s **
5 '
K 0
• °P
° 8
1 8 S f
% 1
1T
Al4lil ^ ^ 1
— - —
2
T
VkL Y T T 1 ' '
~
3'
T
ETEC DflTB PLOT
SINE BURSTS 6 INCH PIPE
LkLJLL . i i l nu . . A . .. . JUifl, »y»vwif tftiyvK fftf flru^-w-YV^^'^^^vvu^ I 1 , 1 1 '
— ] — ~
. .
I I
u w
,
«' 5' s' l ' B ELRPSED TIME (SECONDS)
"f "f T T "k
.
u ^ I I ^ A L nrVlA' v;
1
1
u —
9
/- Y
1
. 1 ' 1
1 i 1
1
i
. . 1
1 1
- t -
{ I
1 : ' 1
! ! 1 s 1 ~
«
10
1
! a
^1
8
'V £ e
'^J X
S 5 o
" S
CE o -
Ss
z
.
---
. . - V
—
2
I T T
1 1
J
1
v,vJ\An'W>AA
1
1
3
T
ETEC OflTfl PLOT
SINE BURSTS B INCH PIPE
— I — - - —
. _ . ^ l . u „ _
.-
— -
.wy.-^, , «^-.AVAV^A.^V
11 S 6 7 B ELAPSED TIME (SECONDS)
T 1 r T "^
1 1
I K 11 \m
1 f,
1
- - -
9
/aa * ' ! & ' * '
- -
^
:
1
i a
"f t

I
CTEC DBTfl PLOT
SINE BURSTS 6 INCH PIPE
.ww-^'V-
ELRPSED TIME (SECONDS)
I T T T T T T T "1 r T l ETEC DflTfl PLOT
ELRPSED TIME (SECONDS)
, . . 9 / J j / . 9 / ^ / . •/J./9. . / J j / . 9/JO/. 9 / J . . 9 ^ / . . - J j / . .^ / . ./^/.^.
ETEC DflTB PLOT
SINE BURSTS 6 INCH PIPE
j w V ' «
ELAPSED TIHE (SECONDSI
g . , . ^ / . ./Jj/. ./JO/. . / J j / . . / J j / . ./Jj/„ . / J j / . . / J j / . . / J j / . 9 / ^ / . ^
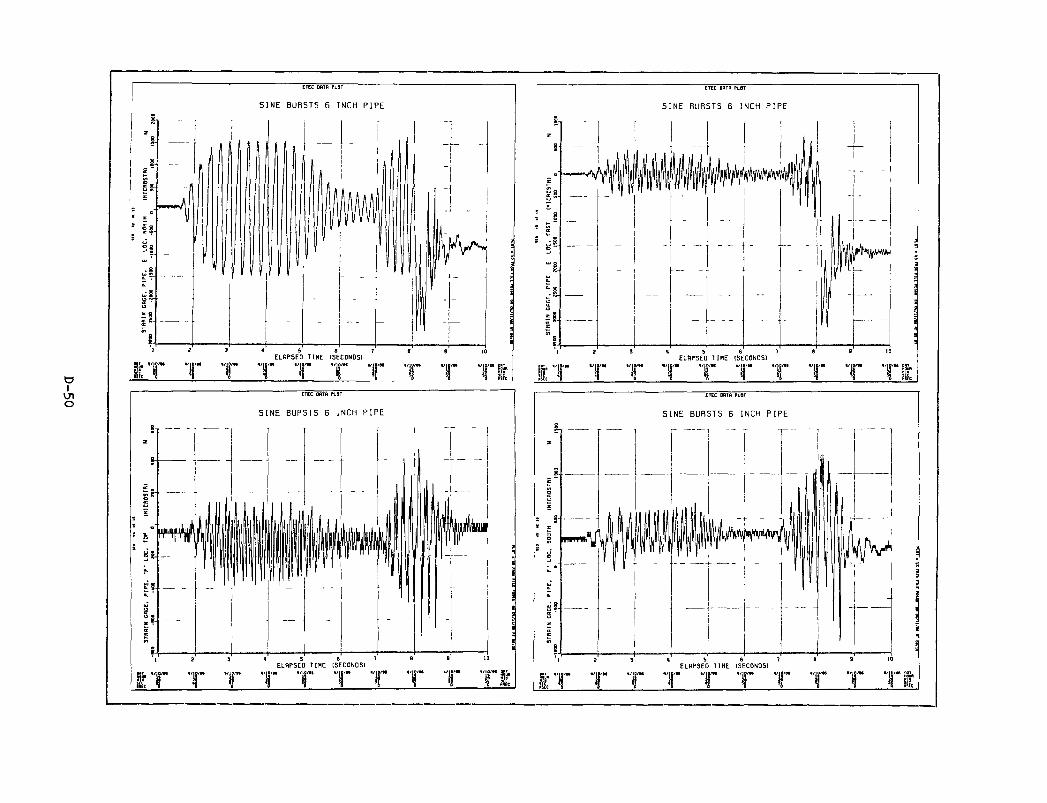
ETEC DflTfl PLOT
SINE BURSTS 6 INCH PIPE
<JI O
IT lO/M a/|(
ELRPSED TIME (SECONDS) aa a/Ia/aa a/io/aa iD/aa a/io
ETEC DflTR PLOT
SINE BURSTS 6 INCH PIPE
ELRPSED TIME (SECONDS)
lo/M a/io/M I
sr
^ , 9 / ^ 9,^0,. 9 , ^ , . 9 , ^ , . 9 , J j , . 9 , ^ , . 9 , J j ^ . , J j , . 9 , ^ - . 9 , J j , . ^ ^
ETEC DflTB PLOT
SINE BURSTS 6 INCH PIPE
I T - 1 r 1
8
i 1
i] -
l] . il
__ ,
1
—
-
i | | l i p | ^ ^
-
1 1
f
-1 _
I 2 3 ELAPSED TIHE (SECONDSI
IT 1 r 1 r 1 1 g/M a/1
ii 1 ETEC DflTfl PLOT
SINE BURSTS 6 INCH PIPE
Pfl^flwiry
1 i 3 ELRPSED TIME (SECONDS)
l/H a/IO/M '•'IS'** l/tD/M c
I T T T 1 r T T T "I liU
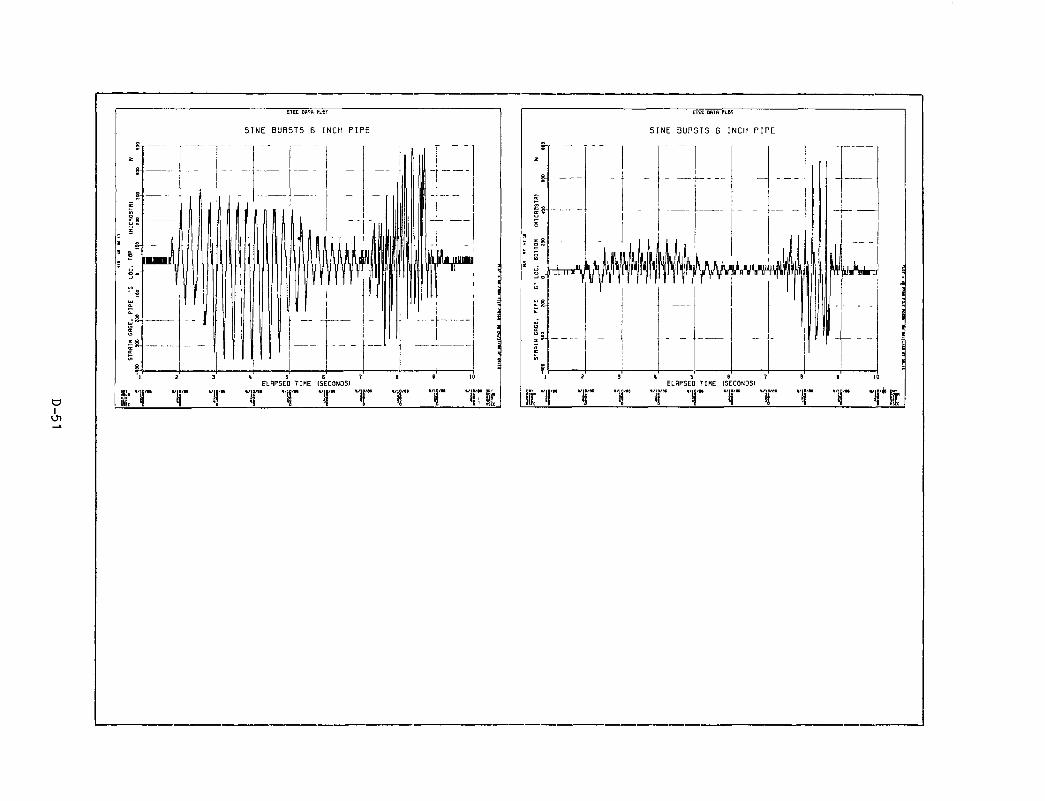
ETEC DflTfl PLOT
SINE BURSTS 6 INCH PIPE
z
i-
_8-
| i .
» 8-
O o' -1
a.
n|
-- — -
iiiiji II1 1 1 1
11 1 1 — 1 -
— -
1
1
— —
— 1
1
1
-
i l l
II
liJlJUlU
aat a/ifl/M « / | D / M a/io/as 1/1 o<
i ^ ^ ^ ^ ELRPSED TIME (SECONDS)
1/10/as a/io/M a/jD/M t / ig/M a/iD/M mi
ETEC OflTfl PLDT
SINE BURSTS 6 INCH PIPE
irpiinranT =
IT T 1 i ELRPSED TIME (SECONDS)
M a/io/ea « / ] O / M
r T l
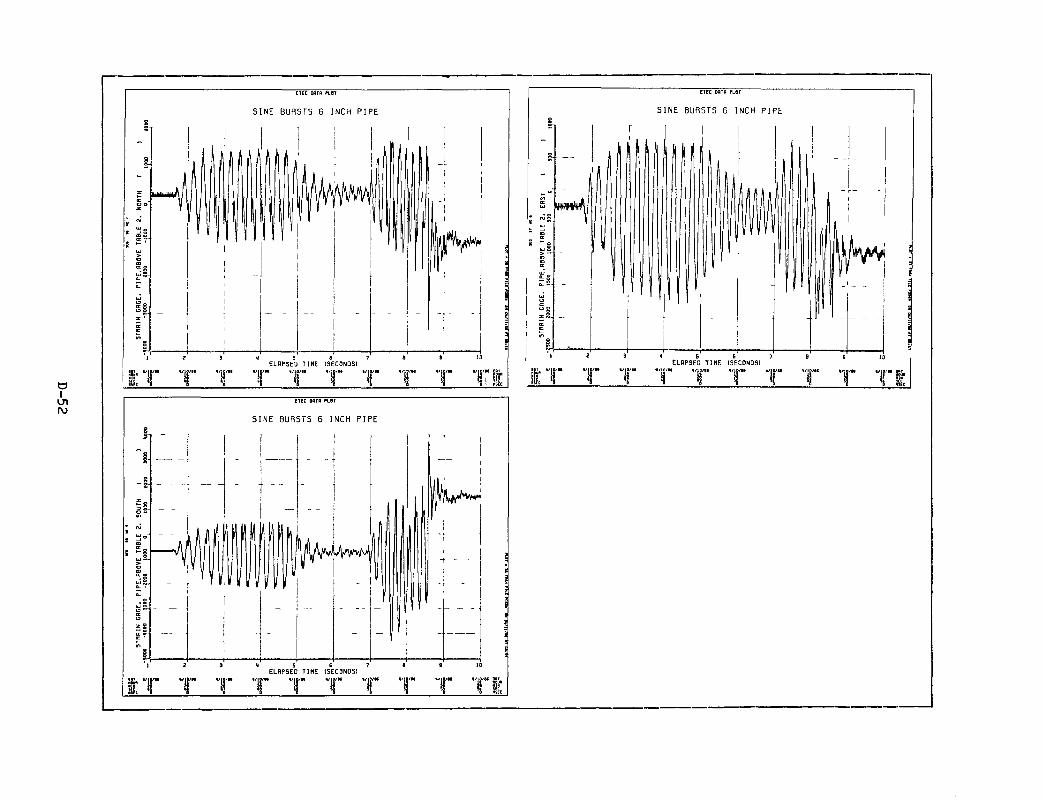
o I Ul ro
ETEC DflTfl PLOT
SINE BURSTS 6 INCH PIPE
IT ELAPSED TIME (SECONDS)
/lo/ae
ETEC OflTfl PLOT
SINE BURSTS 6 INCH PIPE
f Y "f "f "f "I '"' Wc
ELAPSED TIHE (SECONDSI
,9,9/ /. Y Y T T T T T T T
ETEC DflTfl PLOT
SINE BURSTS 6 INCH PIPE
ELRPSED TIHE (SECONDS) a/iB/|e DHT I "I" "I !| I" "'i|'" Y Y T T "I ?•

APPENDIX E
ESTIMATE OF SYSTEM EQUIVALENT VISCOUS DAMPING
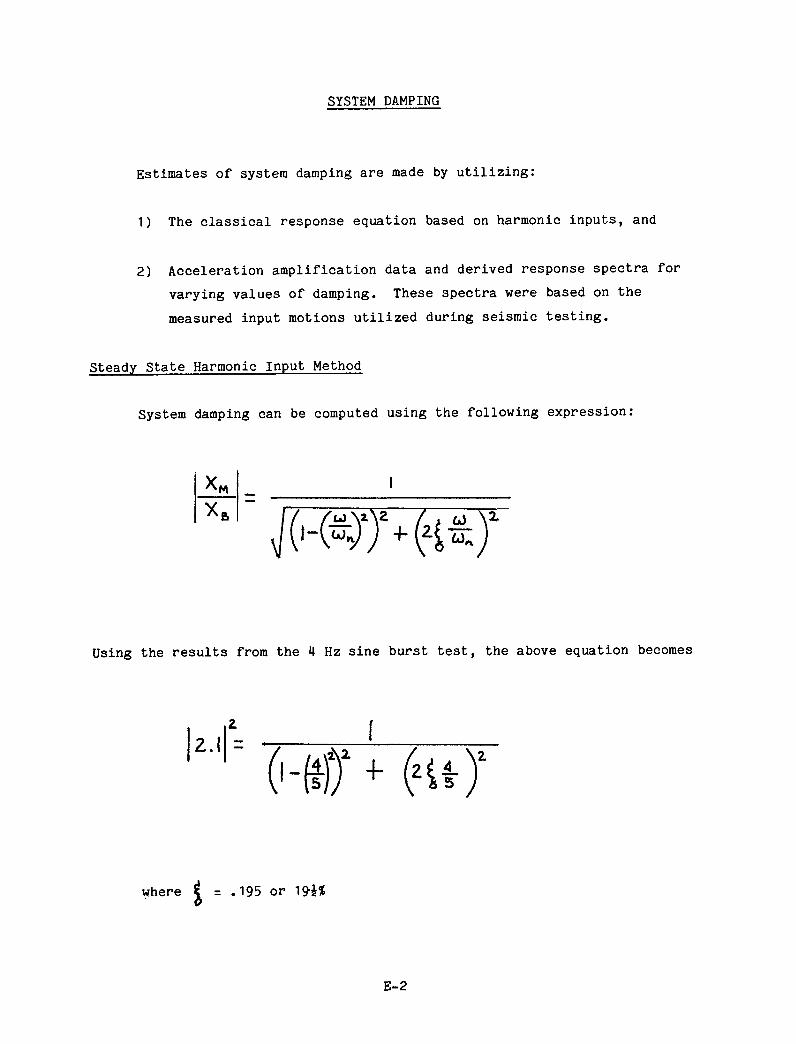
SYSTEM DAMPING
Estimates of system damping are made by utilizing:
1) The classical response equation based on harmonic inputs, and
2) Acceleration amplification data and derived response spectra for
varying values of damping. These spectra were based on the
measured input motions utilized during seismic testing.
Steady State Harmonic Input Method
System damping can be computed using the following expression:
XM
X & I-WTTS^
Using the results from the M Hz sine burst test, the above equation becomes
2.1
( ' - iff + Hi
where i- .195 or ^9i%
E-2

Response Spectrum Method
The response spectra shown in Figures E-1 through E-4 were used to
determine analytically computed amplification ratios. These spectra were
derived for varying values of damping on the basis of measured input
motions utilized during the seismic tests.
The plot shown in Figure E-5 shows analytically computed amplifica
tion ratios obtained from spectral data (Figures E-1 through E-4) for the
test article natural frequency (5 Hz) and for the peak response frequency
(7 Hz) of the response spectra.
Based on the following actual response amplifications observed during
the following tests:
3.3 for 5 g seismic (7.5 g ZPA) test
2.2 for 14 g seismic (13 g ZPA) test
1.3 for 25 g seismic (30 g ZPA) test
the estimated ranges of damping from Figure E-5 for these tests are as
follows:
1-6J for 5 g seismic
3-12t for 14 g seismic
13-22< for 25 g seismic
E-3
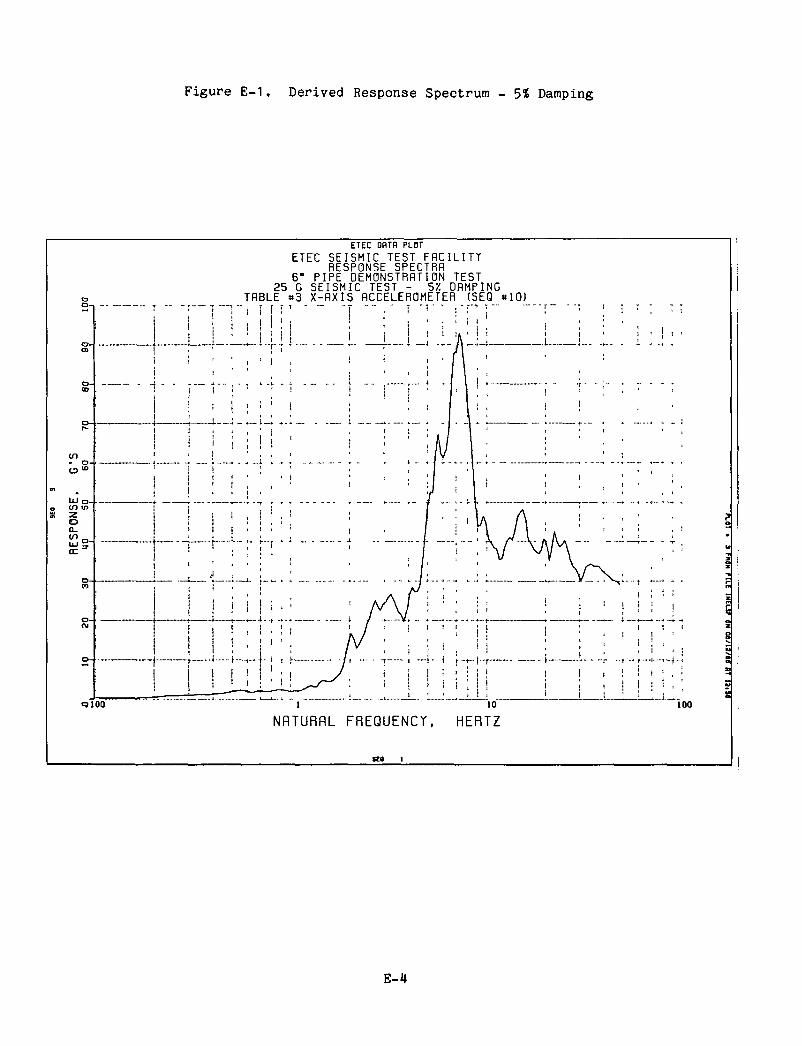
Figure E-1. Derived Response Spectrum - 5% Damping
QlOO
ETEC OHTfl PLBT
ETEC SEISMIC TEST FflCILITY RESPONSE SPECTRA
6- PIPE OEMONSTRflTION TEST 25 G SEISMIC TEST - SX DAMPING
TABLE «3 X-nXIS ACCELEROMETER (SEQ «>10)
O "o
UJ o -(D in Z D Q.
r»_
i
1 J i
i 1
"I—
i 1
— r
1
. - . 4 .
i i
! - r
1
I
10 100
NflTURflL FREQUENCY, HERTZ
E-4
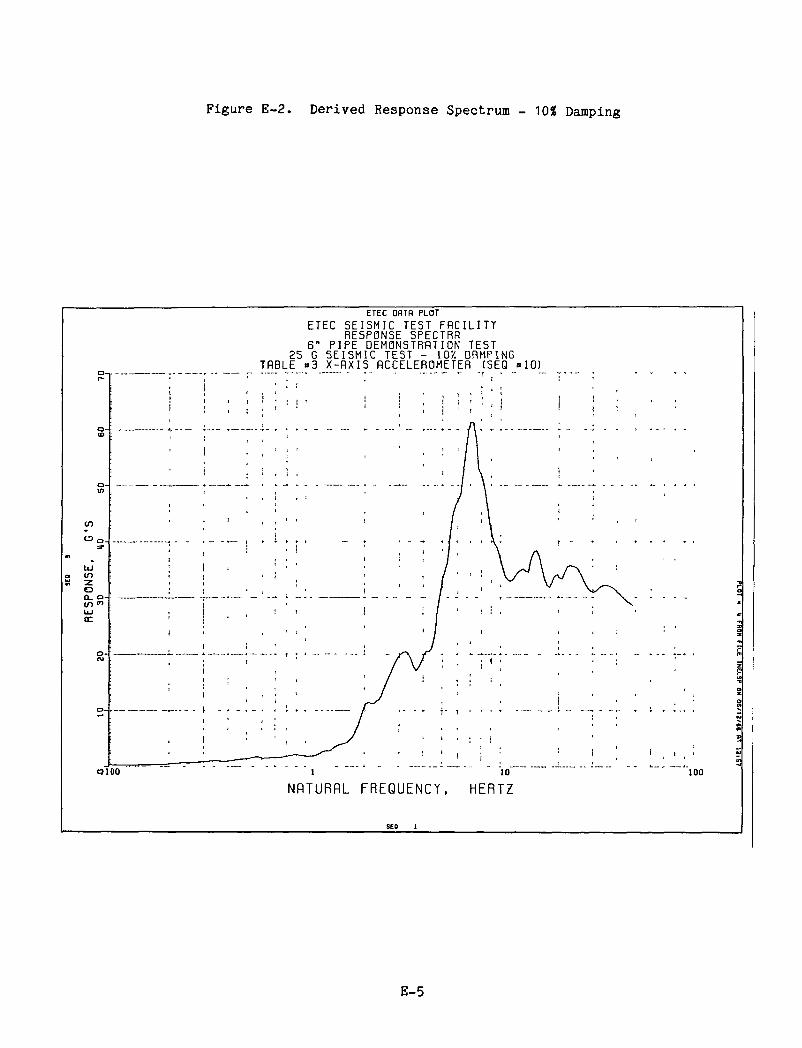
Figure E-2. Derived Response Spectrum - 1055 Damping
ETEC DflTfi PLOT
ETEC SEISMIC TEST FflCILITY RESPONSE SPECTRA
6" PIPE DEMONSTRATION TEST 25 G SEISMIC TEST - lOX DAMPING
TABLE »3 X-AXIS ACCELEROMETER (SEQ »10) r-
o-
CD
O -
tn
CO
• ^n-d*
. UJ (T) Z o 0- o -UJ tc
o-
o -
i I
i
•
:
, _ , I
' 1
1
•
, I
I
•
,
oioo 1 10
NflTURflL FREQUENCY. HERTZ 100
E-5
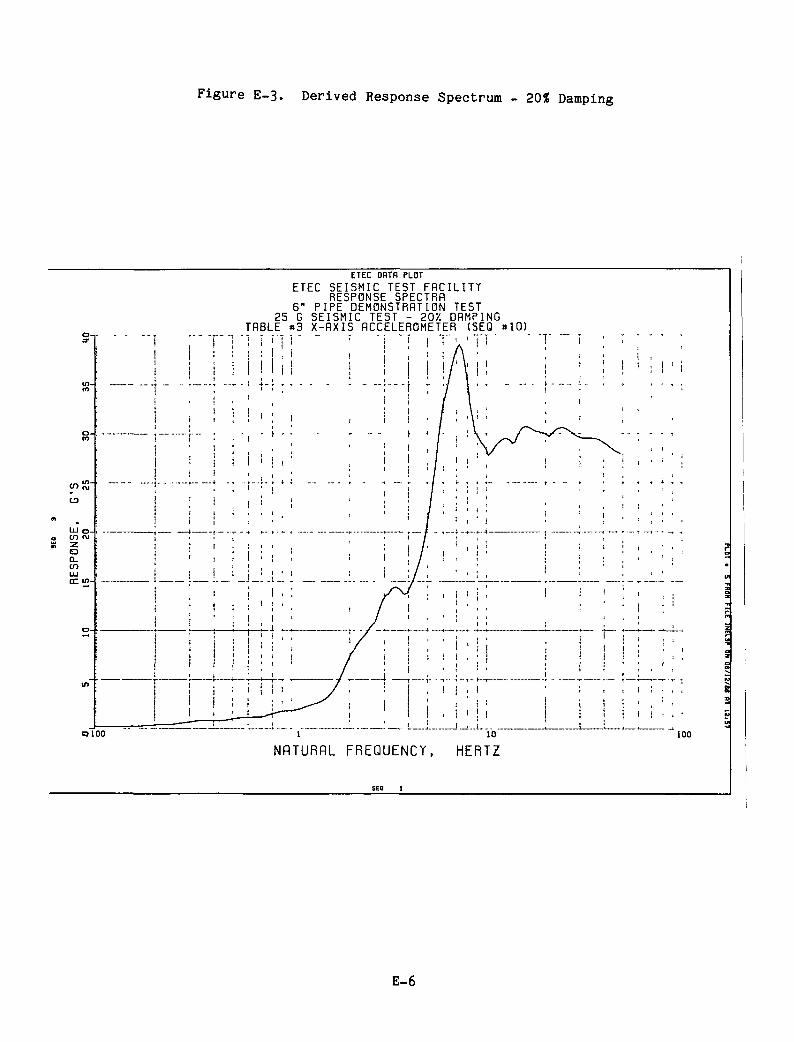
Figure E-3. Derived Response Spectrum - 20? Damping
O - i
into
o -
inS-C3
n
UJ o a cn <\l ii z
o cn UJ
i n
Q l
:
: — _..
00
1 • '
i
j
r" *
: ! i i i ! i r » - .
; i { 1 1
i 1
i ' :
i i i 1
• t ;
' i ^ 1 1 i 1 i >
1 , •
25 TABLE
•| i ' 1
! i i > I ' l l
1 I 1
i 1 1
' 1 " " •
i 1 1
- l - . l - [ i. ' ' 1
! •' ' ' ' <
1
i ' 1 • i ^ i
1 ; ! • 1 I i I ; i • !
t 1 '
1 f
ETEC OHTfl PLOT
ETEC SEISMIC TEST FACILITY RESPONSE SPECTRA
6" PIPE DEMONSTRATION TEST G SEISMIC TEST - 20% DAMPING
«3 X-AXIS ACCELEROMETER (SEQ « I - " : -| -f 5 T-. • T i -
1 ! i 1 1 ! / ' \i ! 1
j
i
!
!
•
1
1 i
" r
1 i ' /
i i ' /
.. _ . . ! . : . . . [ ; /:
; '• 1 •
' 1 ! i /' 1
i /
1 / I
/ 1
1
1 1
i
i .
NflTURflL FREQUENCY,
SEa 1
l -
1 . ' ^
• i
1 1 1 ! i I i
1 1 ' 1
i ,
1 ; i '
1 • ' , ' i 1
M 1 i ! I !
10
HERTZ
10)
' • i . 1 i 1 1 , 1 1 !
i i !
J i ^ 1
1 ' 1 i . 1 ' ' 1 ; ! ' 1
! , 1
' i 1 ' 1 '
! ' ' • ' ' ! ' ,
1 • ' '
1 ' ' 1
1 , . ! { ' . ,
i I i ; 1 ;:• 1 i . .
100
? s V
•n
m z m
a z
s
x>
u
E-6
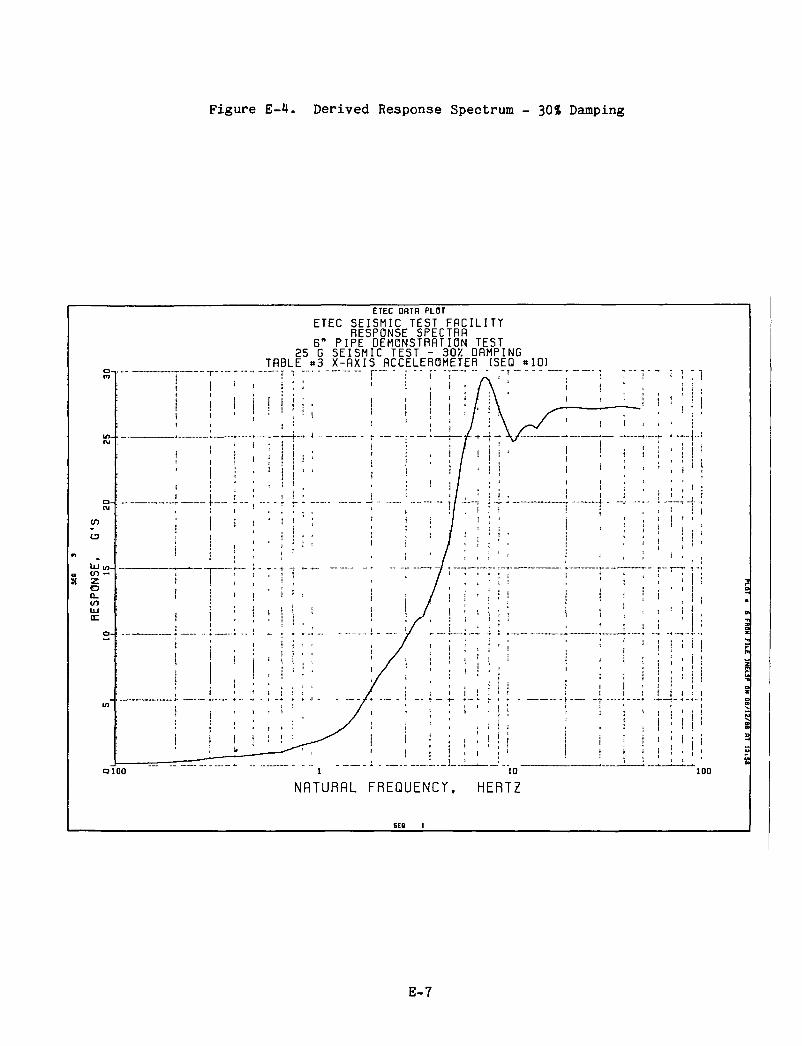
Figure E-4. Derived Response Spectrum - 30< Damping
QlOO
ETEC OflTfl PLOT
ETEC SEISMIC TEST FflCILITY RESPONSE SPECTRfl
6" PIPE DEMONSTRATION TEST 25 G SEISMIC TEST - 30/; DAMPING
TABLE »3 X-AXIS ACCELEROMETER (SEQ <«10)
100
NflTURflL FREQUENCY, HERTZ
E-7
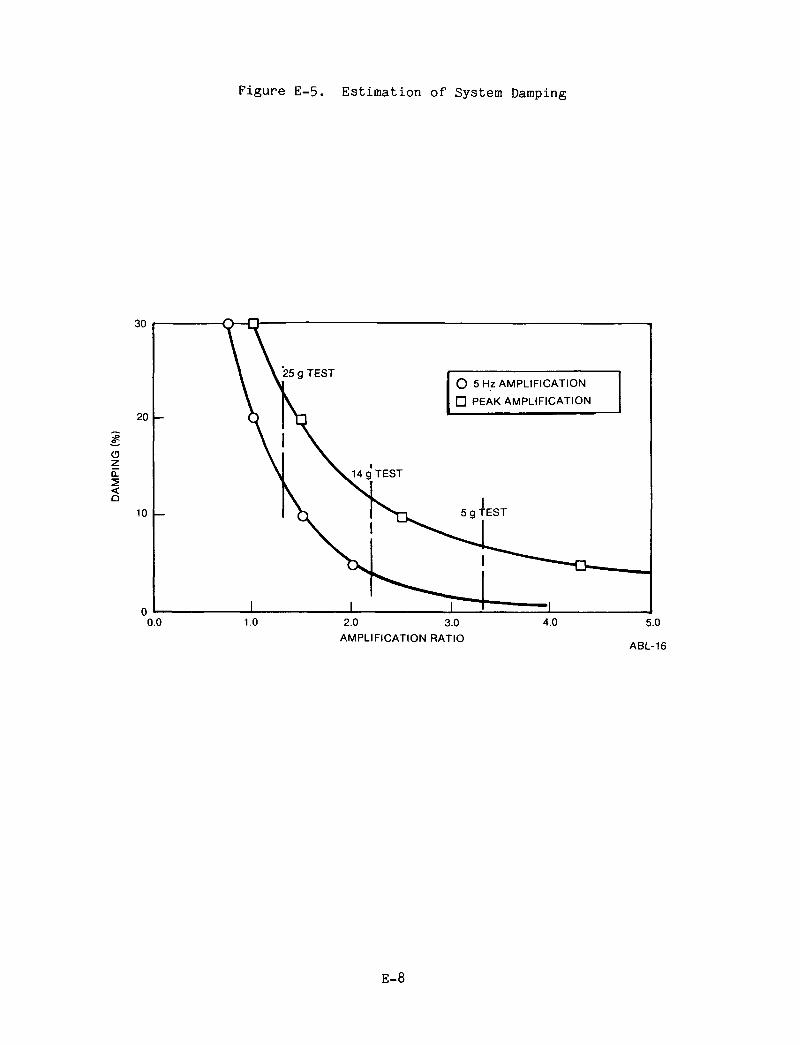
Figure E-5. Estimation of System Damping
30
20 k
CD
z
< D 10
\ \
- \ 1 \
1
25 g TEST
^ ^ 4 c
1
TEST
O 5 Hz AMPLIFICATION
n PEAK AMPLIFICATION
5 g TEST
1 ' 1 0.0 1.0 2.0 3.0
AMPLIFICATION RATIO
4.0 5.0
ABL-16
E-8

APPENDIX F
STRAIN RATCHETTING DURING TEST
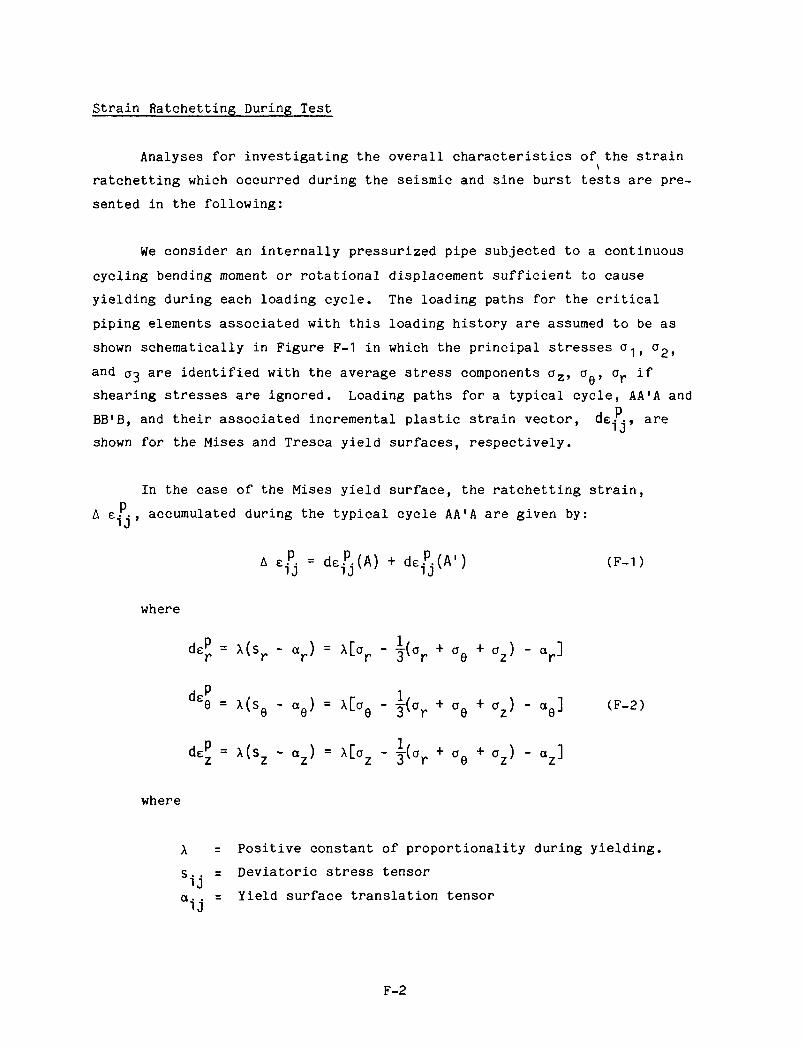
strain Ratchetting During Test
Analyses for investigating the overall characteristics of the strain
ratchetting which occurred during the seismic and sine burst tests are pre
sented in the following:
We consider an internally pressurized pipe subjected to a continuous
cycling bending moment or rotational displacement sufficient to cause
yielding during each loading cycle. The loading paths for the critical
piping elements associated with this loading history are assumed to be as
shown schematically in Figure F-1 in which the principal stresses a^^ a^,
and CT^ ai e identified with the average stress components a^, o^,, o^ if
shearing stresses are ignored. Loading paths for a typical cycle, AA'A and J P BB'B, and their associated incremental plastic strain vector, QE-;-;* are
shown for the Mises and Tresca yield surfaces, respectively.
In the case of the Mises yield surface, the ratchetting strain,
A e--, accumulated during the typical cycle AA'A are given by: * J
A e.Pj = de.Pj(A) + cle.Pj(A') (F-1)
where
deP = X(S^ - a^) = X[a^ - |(o^ + a^ + a^) - a^]
^^e = X(Sg - ag) = xEag - i(a^ + a^ + a^) - a^] (F-2)
deP = X(S^ - a^) = X[a^ - \{o^ + a^ + a^) - a^]
where
X = Positive constant of proportionality during yielding.
S.. = Deviatoric stress tensor "IJ
a.. = Yield surface translation tensor "IJ
F-2

However, since
"ij = i j
it may be assumed that subsequent to repeated cycling, during each cycle
e.,j(A)=c.,j(A') <F-3)
Similarly, it may be assumed that under the same conditions for F-3
that
X(A) = X(A') = X (F-4)
Consequently F-1, with the aid of F-2 through F-4, becomes
AeP = X[S^(A) + s^(A')]
A£P = XLSgCA) + SgCA')] (F-5)
AeP = X[s^(A) + s^(A')]
Since for az > 0 at A and Oz < 0 at A'
kzl» kg I » o^ = 0
it follows that:
S^ = -1/3 (CTQ + o^)
SQ = 1/3 (2aQ - a^)
Sz = 1/3 (20^ - ag)
F-3

Setting
o^U) - ae(A')=a3
a^U) = iag ^ a^
a^(A') = io^ -a^
equations F-5 give . P _ -, Ae : - -XffQ
AeP = XCg
As^ = 0 (F-6)
Similar results were obtained for a related analysis based on loading
path BB'B and the Tresca yield surface shown in Figure F-1. This analysis
indicated, however, that:
At B, i.e. a > 0'.
deP = -deP, dig = 0
At B', i.e. a < 0: z
deP = 0, deP = -deP
i.e., the radial and circumferential ratchetting strains are accumu
lated during different half cycles of loading.
In contrast, the radial and circumferential plastic strains during
each half cycle contributed to the ratchetting strain for the cycle in the
case of the Mises yield surface.
This difference in behavior between the analyses is apparent by exa-. p
mining the orientation of the incremental plastic strain vector dej., with
respect to the stress and strain axes shown in Figure F-1.
F-4
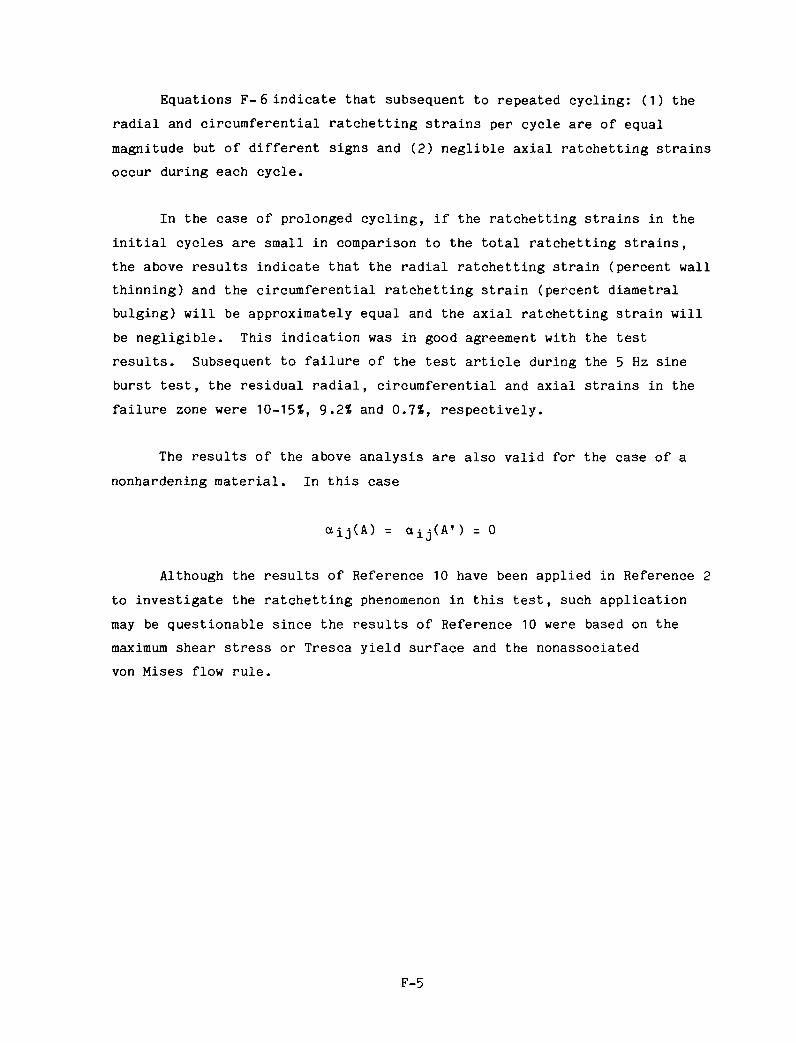
Equations F-6 indicate that subsequent to repeated cycling: (1) the
radial and circumferential ratchetting strains per cycle are of equal
magnitude but of different signs and (2) neglible axial ratchetting strains
occur during each cycle.
In the case of prolonged cycling, if the ratchetting strains in the
initial cycles are small in comparison to the total ratchetting strains,
the above results indicate that the radial ratchetting strain (percent wall
thinning) and the circumferential ratchetting strain (percent diametral
bulging) will be approximately equal and the axial ratchetting strain will
be negligible. This indication was in good agreement with the test
results. Subsequent to failure of the test article during the 5 Hz sine
burst test, the residual radial, circumferential and axial strains in the
failure zone were 10-15t, 9.2t and 0.7%, respectively.
The results of the above analysis are also valid for the case of a
nonhardening material. In this case
aij(A) = aij(A') = 0
Although the results of Reference 10 have been applied in Reference 2
to investigate the ratchetting phenomenon in this test, such application
may be questionable since the results of Reference 10 were based on the
maximum shear stress or Tresca yield surface and the nonassociated
von Mises flow rule.
F-5
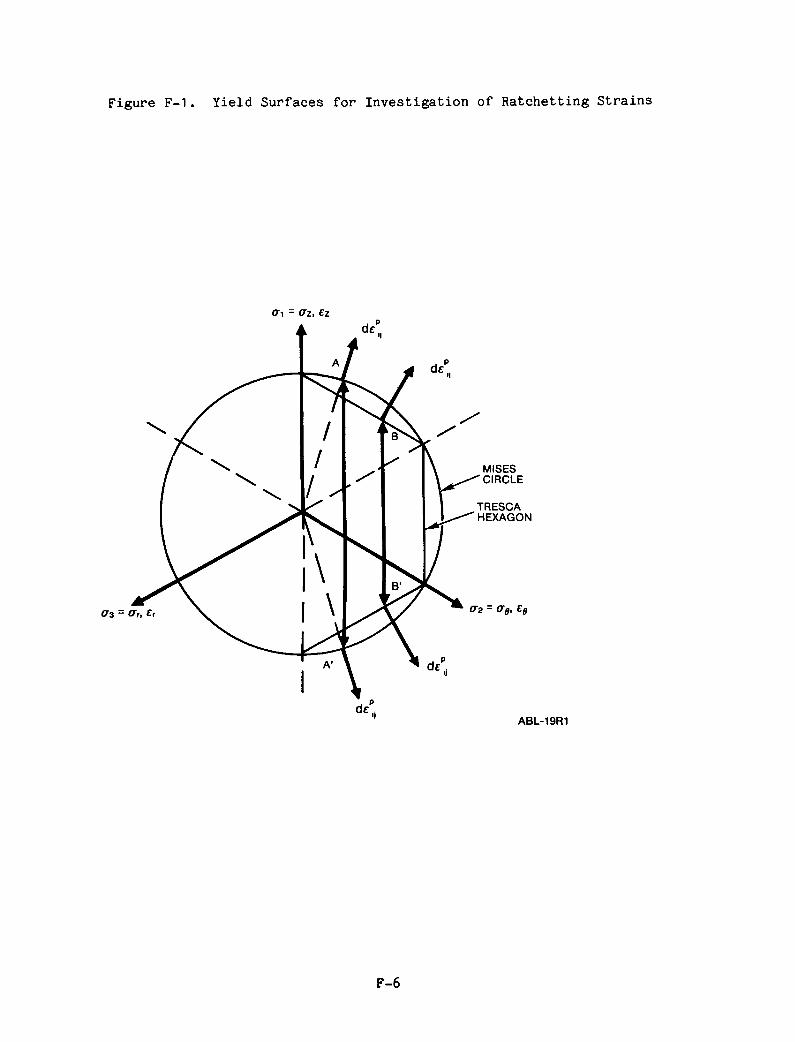
Figure F-1. Yield Surfaces for Investigation of Ratchetting Strains
0\ - Oz, tz
as = a,, E,
de:
A
7 /
/
\
\
L 1
x ^ ^
\
1
/
h y^
R' ^ 3
MISES •CIRCLE
TRESCA HEXAGON
^2 = Cfg, tg
dc:
ABL-19R1
F-6

APPENDIX G
WELDING PROCUREMENT SPECIFICATION
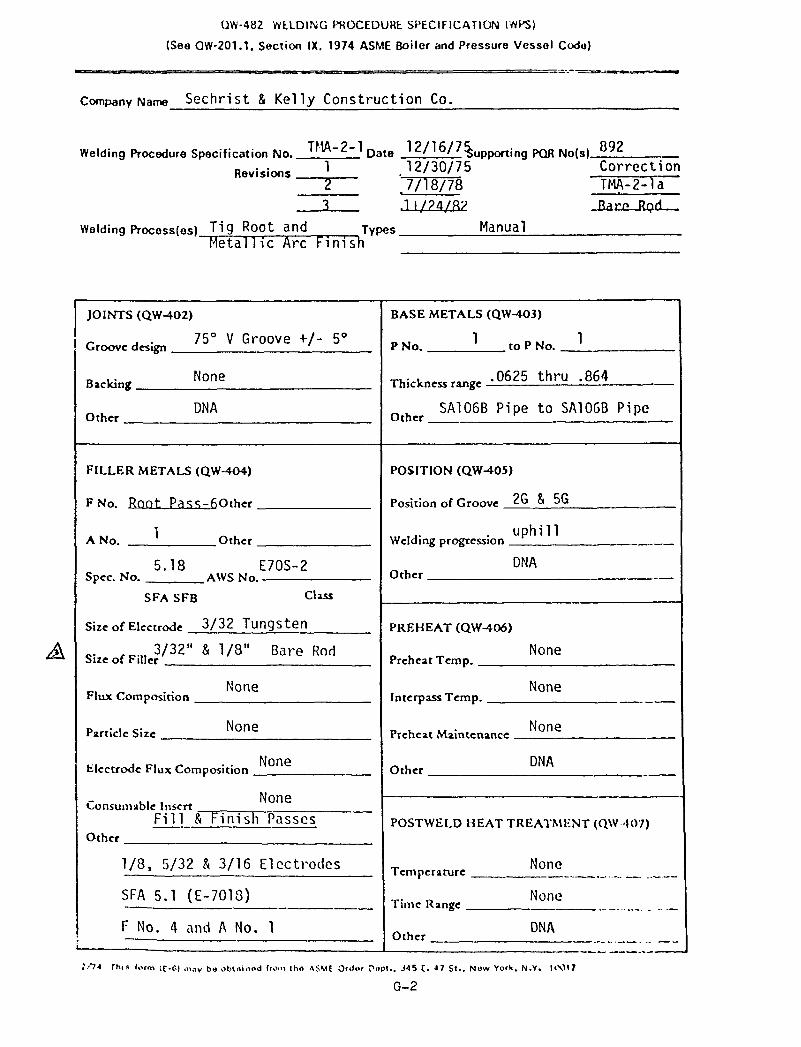
QW-482 WtLDING PKOCEDURE SPECIFICATION (WPS)
(See QW-201.1. Section IX, 1974 ASME Boiler and Pressure Vessel Code)
Company Name Sechrist & Kel ly Construct ion Co.
Welding Procedure Specification No. T f l A - Z - l Qgj^ _22 /26 /7 |uppor t i ng PQR No{s)_£2^ 1 12/30/75 Correct ion Revisions
.7/18/78
Welding Process(es) TTQ Root and Types Metall10 Arc Fin ish
Manual
TMA-2-1a "
-Bare Rgd—
JOINTS (QW-402)
Groove design
Backing
Other
75° V Groove + / - 5=
None
DNA
BASE METALS (QW-*03)
1 PNo. to P No.
Thickness range ,0625 thru .864
Other SA106B Pipe to SA106B Pipe
FILLER METALS (QW-404)
F N o . fiQQt_RaSS^Other
1 A No. Other
5.18 E70S-2 Spec. No. AWS No.
SFA SFB Class
Size of Electrode 3 / 3 2 T u n g s t e n
3/32" Size of Filler
Flux Composition
Particle Size
& 1/8" Bare Rod
None
None
ticctrodc Flux Composition None
. , , None <.x)nsumable Insert
F i l l & Finish Passes Other
1/8. 5/32 & 3/16 Electrodes
SFA_5.1 (E-7018)
F No. 4 and A No. 1
POSITION (QW^OS)
Position of Groove '-" ° 5u
Welding progression uph i l l
Other DNA
PREHEAT (QW-406)
Preheat Temp.
Jntcrpass Temp.
None
None
Preheat Maintenance
Other
None
DNA
POSTWELD HEAT TREATMENT (QW U)/)
None Temperature
Time Range _
Other
None
DNA
.•74 This (orm i f - e ) ,„i,y (,« obl . i inod (lo.n tt\o -VSME O'ltof Copt. , J45 C. 47 S t . . Now YofV, N.V. UXI I?
G-2
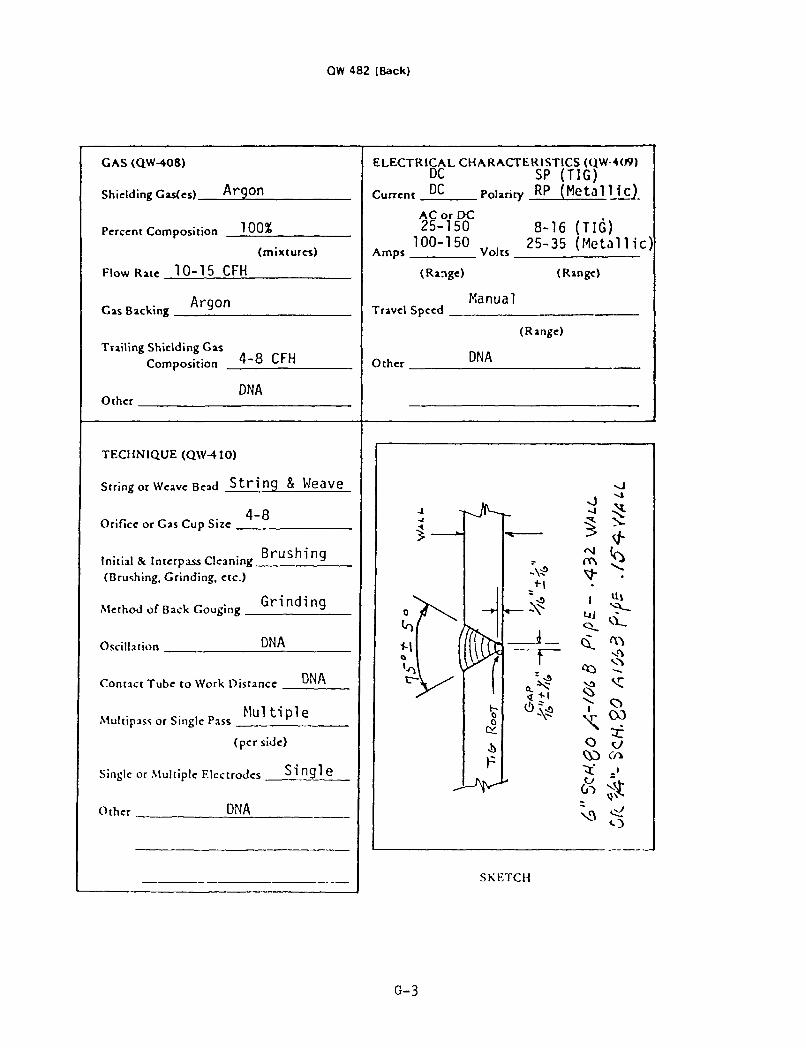
QW 482 (Back)
GAS (QW-408)
Shielding Gas(es) A r g o n
Percent Composi t ion 100%
(mix tures)
F low Rate 1 0 - 1 5 CFH
Gas Backing . Argon
Trai l ing Shielding Gas
Composi t ion 4 - 8 CFH
Other DNA
ELECTRICAL CHARACTERISTICS (UW-4()9)
DC SP ( T I G ) _DC Polarity RP (Meta l l i c ) Current
A C or DC 25-150
100-150 Amps Vol ts
(Range)
8-16 (TI(3) 25-35 (Meta l l i c )
(Range)
Travel Speed
Other
Manua l
(Range)
DNA
TECHNIQUE (QW-HO)
String or Weave Bead S t r i n g & Weave
4-8 Orif ice or Gas Cup Size
, . . , , , „, . Brushing In i t ia l & Intcrpass Cleaning ±_ (Brushing, Gr ind ing, etc.)
Kt u A ei, t ^ • G r i n d i n g Method of Back Gouging ±_
Oscil lat ion DNA
Contact Tube to Work Distance DNA
Multipass or Single Pass Multiple
(per side)
Single or .Multiple Electrodes S i n g l e
Other DNA
SKETCH
G-3

QW-484 MANUFACTURER'S RECORD OF WELDER OR WELDING OPERATOR QUALIFICATION TESTS
(See a W - 3 0 1 , Section IX, 1974 ASME Boiler and Pressure Vessel Code)
Welder Name _ M I C h a c l . . Co_Ok Check No. . j : - _ - - Stamp No 6_2_ Welding Process ..T i 0 & . M e t a j _1 i C__Arj: Type i l a n u a 1
In accordance with Welding Procedure Specifica'tion (WPS) T " A - 2 - 1
Backing (OW-402) N Q R E , Material (QW-403) Spec. S A - 1 0 6 „ f \ J l . . £ , t n S A - 1 0 6 G R , P of P No ] to P No L
Th ickness -^280 . ! ! D i a . _ 6 ^ 5 2 S _ " Q I ' ^ S - C J U - 4 0 . c \ / s 1 6 6 1 p i p e
Filler Metal (QW-404) Spec No. _ S £ A . - 5 . , I S Class No. _ £ 2 i l S _R 0 0 - t — — F No
Other._5fA-_5^ 1 F-yniR F i lJ -ec-A-Ei j i i s i i_J la-S^es-Position (aW-405) (1G. 2G. 6G) &G
Gas (QW-408) Type A r q QJl % Composition ^10-0^
Electrical Characteristics (OW-409) Current 4 5 - 1 2 5 & 1 0 0 - 1 3 5 Polarity D C - ^ i ^ — S — H C - S - P
Weld Progression (QW-410) £ G P o S l t J O n
Other Oual i f i -e-S_thJc. ,_ra j i^e-^I1625" t h r u .560" For Information Only
Filler Metal Diameter and Trade Name F 7 0 S - 3 / 3 2 " pf f Or r o o t F - 7 m R 1 / 8 H^ SJ.32:L!i3J^£L!lf±Clish- pa S • Submerged Arc Flux Trade Name DAA S e S Gas Metal Arc Welding Shield Gas Trade Name A r q o n - G e n e r a l V i p l d i r T ]
Guided Bend Test Results QW-462.2(a), QW-462.3(a), QW^62.3(b) Type and Fig. No. Result
Radiographic Test Results (aW-304 & QW-305)
For alternative qualification of groove welds by radiography Radiographic Results: By D a v j s H u a l i t v F m r . C o . C o n t r o l N o . 0 4 3 1 - 1 1 1 1 d t d . 7 -_2-c? - : 3
Fillet Weld Test Results [See QW<462.4(a), QW-462.4(b)] Fracture Test (Describe the location, nature and size of any crack or tearing of the specimen) .
Length and Per Cent of Defects inches % Macro Test—Fusion
Appearance—Fillet Size (leg) in. X in. Convexity in or Concavity.
Test Conducted by Laboratory—Test No
We certify that the statements in this record are correct and that the test welds were prepared, weldechand tested in accordance with the
requirements of Sections IX of the ASME Code. ^_^
P y ^ . v ^ ^ - - . ^ ^ l/.'y^^/J^-^ Dav i s f^uf t l .Ff Organization _ 5 e c l
Date _Ju.Ly _2"U-J-5a i By / < ' /i^ (Detail of record of tests are Illustrative only and may be modified to conform to the type and number of tests required by the Code.) NOTE: Any essential variables in addition to those above shall be recorded.
.^^ Ify/zCM-K Dav i s f ^ u a l . I'rSs t.^'^. y l l l - y l C Q-tLSLtU C t T p n C 0 .
G - 4
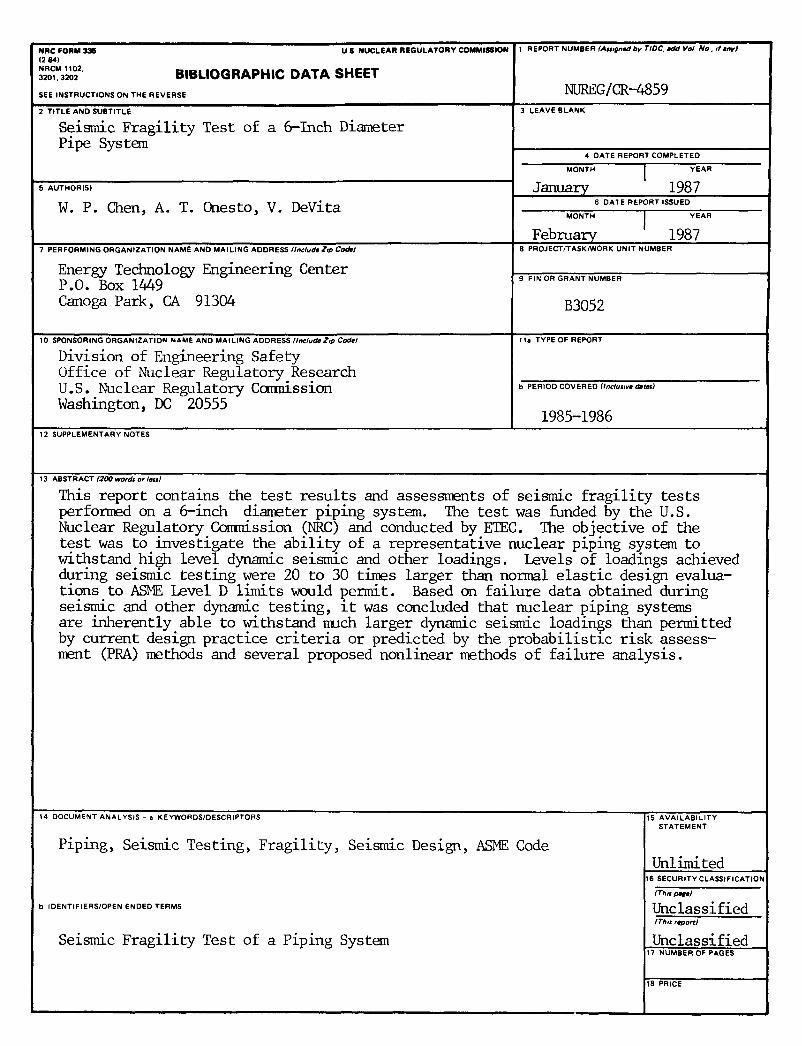
NRC FORM 336 U S NUCLEAR REGULATORY COMMISSION I2S4I
ZT3^2- BIBLIOGRAPHIC DATA SHEET SEE INSTRUCTIONS ON THE REVERSE
2 TITLE AND SUBTITLE
Seismic F rag i l i t y Test of a 6-Inch Diameter Pipe System
S AUTHORIS)
W. P. Chen, A. T. Onesto, V. DeVita
7 PERFORMING ORGANIZATION NAME ANO MAILING ADDRESS (Include Zip Codel
Energy Technology Engineering Center P.O. Box 1449 Canoga Park, CA 91304
10 SPONSORING ORGANIZATION NJtUE AND MAILING ADDRESS (IneludtZip Cadtl
Division of Engineering Safety Office of Nuclear Regulatory Research U.S. Nuclear Regulatory Cuninission Washington, DC 20555
1 REPORT NUMBER lAuigntd by TIDC. tM Vol No. il tnyl
NUREG/CR-4859 3 LEAVE BLANK
4 DATE REPORT COMPLETED
MONTH 1 YEAR
January 1987 6 DATE REPORT ISSUED
MONTH YEAR
February 1987 8 PROJECT/TASK/WORK UNIT NUMBER
9 FIN OR GRANT NUMBER
B3052
11a TYPE OF REPORT
b PERIOD COVERED ^/nc/uowlKitnJ
1985-1986 12 SUPPLEMENTARY NOTES
13 ABSTRACT r^OOwon/i or/«ii/
This report contains the t e s t r e s u l t s and assessments of seismic f r ag i l i t y t e s t s performed on a 6-inch diameter piping system. The t e s t was funded by the U.S. Nuclear Regulatory Connission (NRC) and conducted by ETEC. The objective of the t e s t was to inves t iga te the a b i l i t y of a representa t ive nuclear piping system to withstand high level dynamic seismic and other loadings. Tpvels of loadings achieved during seismic t e s t ing were 20 to 30 times larger than normal e l a s t i c design evaluat ions to ASME Level D l imi t s would permit. Based on fa i lu re data obtained during seismic and other dynamic t e s t i n g , i t was concluded that nuclear piping systems are inherently able to withstand much larger djnriamic seismic loadings than permitted by current design prac t ice c r i t e r i a or predicted by the p robab i l i s t i c r i s k assess ment (PM) methods and several proposed nonlinear methods of fa i lure analys is .
14 DOCUMENT ANALYSIS - a KEYWORDS/DESCRIPTORS
Piping, Seismic Testing, F r a g i l i t y , Seismic Design, ASME Code
b IDENTIFIERS/OPEN ENDED TERMS
Seismic F rag i l i t y Test of a Piping System
15 AVAILABILITY STATEMENT
Unlimited 16 SECURITY CLASSIFICATION
IThaptgtl
Unclassified (Thi$ rtporO
Unclassified 17 NUMBER OF PAGES
18 PRICE