Seismic Fragility Functions of Stone Masonry Buildings · Seismic Fragility Functions of Stone...
10
Seismic Fragility Functions of Stone Masonry Buildings F. Karantoni, F. Lyrantzaki, G. Tsionis & M.N. Fardis University of Patras, Greece SUMMARY: Fragility curves are developed for stone masonry buildings with rigid or flexible floors and varying number of storeys, plan dimensions, number of interior cross-walls, storey height, percentage of side length of exterior walls taken up by openings and wall height-to-thickness ratio. Linear Finite Element analysis in 3D is performed and a nonlinear biaxial failure criterion for masonry is used. Buildings with rigid floors and higher percentage of load-bearing walls are less vulnerable. Larger openings, taller storeys, larger number of storeys, higher wall slenderness and higher ratio of clear height to the horizontal dimension of the walls increase the vulnerability. Keywords: masonry, fragility curves, damage 1. INTRODUCTION Old masonry buildings constitute a large part of the building stock in Europe and have shown to be very vulnerable to earthquakes. Hence, they are an important component in vulnerability studies for cities or larger areas that aim to predict the extent of damage for different earthquake scenarios. In this context it is necessary to employ fragility curves that are representative of the local building typologies and accurate enough so as not to over- or underestimate the expected damage. Empirical fragility curves based on damage data collected after earthquakes, e.g. (Penelis et al, 2002; Colombi et al, 2008; Rota et al, 2008), often suffer from incomplete data and are normally applicable only to areas with similar characteristics. Limit state analysis for a given number of in-plane and out- of-plane collapse mechanisms has been shown to produce results in agreement with observed damage (D’Ayala et al, 1997). Fragility curves described by a lognormal distribution with uniform standard deviation are developed by applying the capacity spectrum method with bilinear capacity curves estimated from semi-empirical analytical expressions based on the geometry and materials (Cattari et al, 2004), or calculated by pushover analysis of plane frame models with rigid floors in the framework of a hybrid method (Kappos et al, 2006). Plane frame modelling with rigid floors is also used for a large set of time-history analyses that allow to account for the variability of important parameters, e.g. the earthquake input and the masonry strength (Erberik, 2008). In the work presented herein, three-dimensional (3D) analysis with finite element (FE) modelling and a nonlinear biaxial failure criterion is used to produce fragility curves for stone masonry buildings that consider both in-plane and out-of-plane response and failure modes. The large number of analyses makes it possible to study the effect of important geometric characteristics on the seismic fragility. 2. BUILDING TYPOLOGIES A total of 216 prototype regular buildings are analysed. They are built of modules, modified in plan and repeated in height so as to cover the practical range of the following parameters:
Transcript of Seismic Fragility Functions of Stone Masonry Buildings · Seismic Fragility Functions of Stone...

Seismic Fragility Functions of Stone Masonry Buildings F. Karantoni, F. Lyrantzaki, G. Tsionis & M.N. Fardis University of Patras, Greece
SUMMARY: Fragility curves are developed for stone masonry buildings with rigid or flexible floors and varying number of storeys, plan dimensions, number of interior cross-walls, storey height, percentage of side length of exterior walls taken up by openings and wall height-to-thickness ratio. Linear Finite Element analysis in 3D is performed and a nonlinear biaxial failure criterion for masonry is used. Buildings with rigid floors and higher percentage of load-bearing walls are less vulnerable. Larger openings, taller storeys, larger number of storeys, higher wall slenderness and higher ratio of clear height to the horizontal dimension of the walls increase the vulnerability. Keywords: masonry, fragility curves, damage 1. INTRODUCTION Old masonry buildings constitute a large part of the building stock in Europe and have shown to be very vulnerable to earthquakes. Hence, they are an important component in vulnerability studies for cities or larger areas that aim to predict the extent of damage for different earthquake scenarios. In this context it is necessary to employ fragility curves that are representative of the local building typologies and accurate enough so as not to over- or underestimate the expected damage. Empirical fragility curves based on damage data collected after earthquakes, e.g. (Penelis et al, 2002; Colombi et al, 2008; Rota et al, 2008), often suffer from incomplete data and are normally applicable only to areas with similar characteristics. Limit state analysis for a given number of in-plane and out-of-plane collapse mechanisms has been shown to produce results in agreement with observed damage (D’Ayala et al, 1997). Fragility curves described by a lognormal distribution with uniform standard deviation are developed by applying the capacity spectrum method with bilinear capacity curves estimated from semi-empirical analytical expressions based on the geometry and materials (Cattari et al, 2004), or calculated by pushover analysis of plane frame models with rigid floors in the framework of a hybrid method (Kappos et al, 2006). Plane frame modelling with rigid floors is also used for a large set of time-history analyses that allow to account for the variability of important parameters, e.g. the earthquake input and the masonry strength (Erberik, 2008). In the work presented herein, three-dimensional (3D) analysis with finite element (FE) modelling and a nonlinear biaxial failure criterion is used to produce fragility curves for stone masonry buildings that consider both in-plane and out-of-plane response and failure modes. The large number of analyses makes it possible to study the effect of important geometric characteristics on the seismic fragility. 2. BUILDING TYPOLOGIES A total of 216 prototype regular buildings are analysed. They are built of modules, modified in plan and repeated in height so as to cover the practical range of the following parameters:

number of storeys: 2, 4 and 6; percentage of side length in exterior walls taken up by openings: 25% to 50% (see Table 2.1); wall thickness, tef: 0.60 m to 1.45 m (see Table 2.2); plan dimensions: 15.5×15.5 m or 22.0×22.0 m (see Figure 2.1) and interior walls: always none in
one direction (x in Figure 2.1), one in the other (y in Figure 2.1) in the 15.5×15.5 m buildings, two in the 22.0×22.0 m ones;
type of floor: flexible (wood or steel beams) or rigid (concrete slab); wall pier height-to-length ratio, h/l, where h is the greater clear height of the openings adjacent to
the pier; h/l ranges from 1.0 to 2.0 in building where all openings are effectively doors owing to a spandrel of reduced height, or from 0.5 to 1.0 in buildings in which there is one door at the ground storey and all other openings are windows (see Figure 2.2 for examples). The recommendation of Eurocode 8 (CEN, 2004) for h/l ≤ 2.0 is respected in all buildings examined.
Figure 2.1. Plan of buildings with one interior wall and 40% of external walls taken up by openings (left) or two internal walls and 35% of external walls taken up by openings (right)
Figure 2.2. Buildings with storey height hst = 3.5 m and low h/l ratio (left) or hst = 4.5 m and high h/l ratio (right) Table 2.1. Length of piers, l, and corresponding percentage of openings in external walls
One internal wall Two internal walls Pier length, l (m) 1.50 2.00 2.50 2.00 2.50 3.00
Percentage of openings 50% 40% 25% 45% 35% 25%
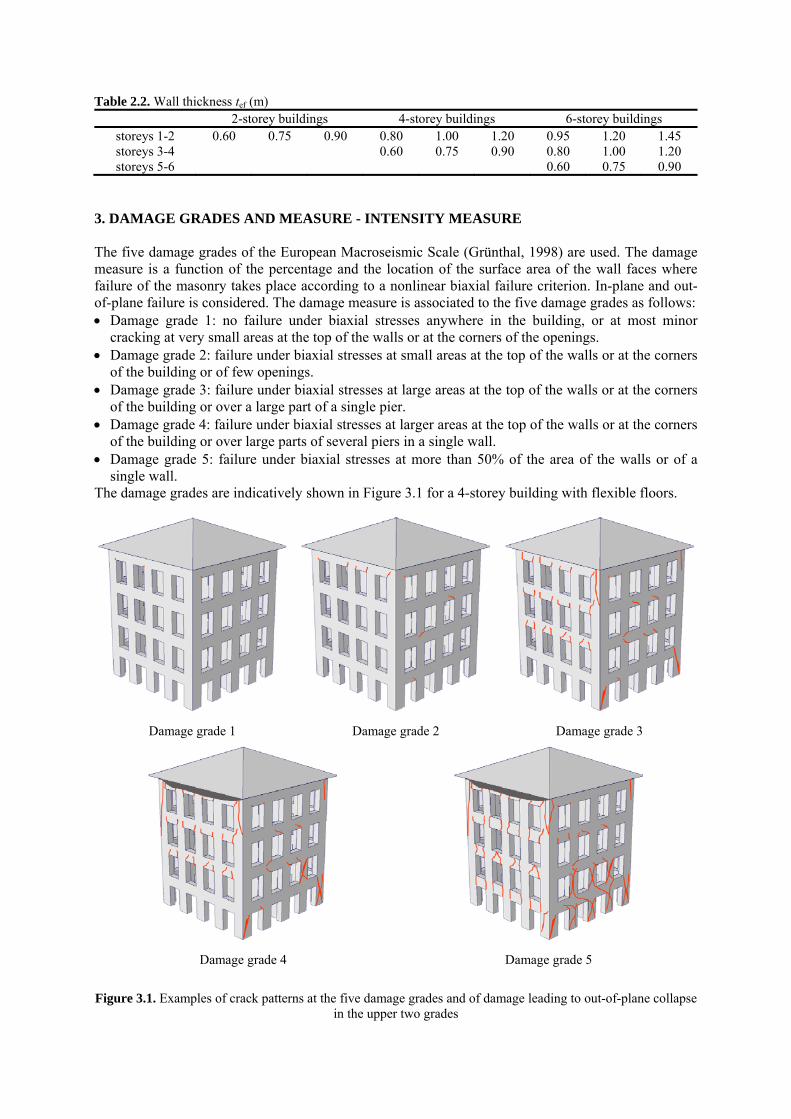
Table 2.2. Wall thickness tef (m) 2-storey buildings 4-storey buildings 6-storey buildings
storeys 1-2 0.60 0.75 0.90 0.80 1.00 1.20 0.95 1.20 1.45 storeys 3-4 0.60 0.75 0.90 0.80 1.00 1.20 storeys 5-6 0.60 0.75 0.90
3. DAMAGE GRADES AND MEASURE - INTENSITY MEASURE The five damage grades of the European Macroseismic Scale (Grünthal, 1998) are used. The damage measure is a function of the percentage and the location of the surface area of the wall faces where failure of the masonry takes place according to a nonlinear biaxial failure criterion. In-plane and out-of-plane failure is considered. The damage measure is associated to the five damage grades as follows: Damage grade 1: no failure under biaxial stresses anywhere in the building, or at most minor
cracking at very small areas at the top of the walls or at the corners of the openings. Damage grade 2: failure under biaxial stresses at small areas at the top of the walls or at the corners
of the building or of few openings. Damage grade 3: failure under biaxial stresses at large areas at the top of the walls or at the corners
of the building or over a large part of a single pier. Damage grade 4: failure under biaxial stresses at larger areas at the top of the walls or at the corners
of the building or over large parts of several piers in a single wall. Damage grade 5: failure under biaxial stresses at more than 50% of the area of the walls or of a
single wall. The damage grades are indicatively shown in Figure 3.1 for a 4-storey building with flexible floors.
Damage grade 1
Damage grade 2
Damage grade 3
Damage grade 4
Damage grade 5
Figure 3.1. Examples of crack patterns at the five damage grades and of damage leading to out-of-plane collapse
in the upper two grades

An effective spectral acceleration given by Eq. (3.1) is adopted as intensity measure:
Sa,eff = 2.5ag/q(DG) (3.1) where ag is the peak ground acceleration of the earthquake input (in g) and q(DG) an effective behaviour factor that accounts for the different levels of damping associated to each damage grade (DG). The proposed values of the effective behaviour factor are given in Table 3.1. Damage grade 1 corresponds to (almost) elastic response, thus the behaviour factor is q(1) = 1. A basic value of the behaviour factor qRo(5) = 2.0 is adopted for buildings with rigid floors. It is then multiplied by an overstrength factor αu/α1 = 2.0 to account for the actual behaviour of masonry structures after the first structural element fails (Magenes, 2006), resulting in qR(5) = 4.0. Buildings with flexible floors are expected to reach damage grade 5 with less energy dissipation and lower ductility; for this reason a lower value of the effective behaviour factor is proposed, qF(5) = 3.0. Linear interpolation is used for the behaviour factor of the intermediate damage grades (see Table 3.1). Table 3.1. Effective q factor
Damage grade 1 2 3 4 5 Flexible floors, qF 1.00 1.50 2.00 2.50 3.00 Rigid floors, qR 1.00 1.75 2.50 3.25 4.00
Parametric analyses showed that damage depends on the ratio of Sa,eff to the compressive strength of masonry, fwc. 4. FE ANALYSIS Finite element (FE) models with shell elements are built for the 216 buildings. For the case of flexible floors, the wood beams are supported by the walls parallel to the internal ones, while the roof is supported by the four perimeter walls. The vertical loads from the floors and the roof are applied to the corresponding nodes of the walls. The compressive and tensile strength of masonry are taken in the analyses as fwc = 3.5 MPa and fwt = 0.085fwc ≈ 0.3 MPa, respectively. However, the results may be generalised to other values of masonry strength, thanks to the observation that damage depends on Sa,eff/fwc. The modulus of elasticity of uncracked masonry is E = 1000fwc = 3.5 GPa, according to Eurocode 6 (CEN, 2005); it is reduced in the analysis by 50% to account for distributed minor cracking before failure, as in Eurocode 8. A nonlinear biaxial failure criterion based on the stresses at the two faces of the masonry wall (Karantoni et al., 1993) is used. The criterion is an extension of the four-parameter model by Ottosen (Ottosen, 1977) for the failure of concrete under triaxial stresses. The parameters were obtained from experimental data for brick masonry, adjusted to the isotropic behaviour of rubble masonry. Static analysis is performed with an inverted triangular distribution of lateral forces. The horizontal components of the seismic action in the two main directions, Ex and Ey along the axes x (: normal to the interior walls) and y (: parallel to them) in Figure 2.1, are combined as “Ex + 0.3Ey” and “0.3Ex + Ey”. Each building is analysed for several levels of the seismic action, aiming to achieve all five damage grades. In total more than 1100 analyses are performed, so that the 216 buildings reach the five damage grades for each combination of horizontal components of the seismic action. Indicative results of the FE analyses for a 4-storey building with flexible or rigid floors are shown in Figure 4.1 for the five damage grades. In red are shown the areas where the failure criterion is reached. Due to the absence of effective connection, the building with flexible floors undergoes damage at the corners. It also suffers out-of-plane failure at the upper part of walls having large spacing between cross-walls. By contrast, the building with rigid floors shows a damage pattern with in-plane failures.

Damage grade 1
Damage grade 2
Damage grade 1
Damage grade 2
Damage grade 3 Damage grade 4
Damage grade 3
Damage grade 4
Damage grade 5
Damage grade 5
(a) (b)
Figure 4.1. Results of FEM analyses for a 4-storey building with flexible (a) or rigid (b) floors 5. SEISMIC FRAGILITY OF MASONRY BUILDINGS Based on the FE analyses, fragility curves are developed for building classes described by three parameters, namely the number of storeys (2, 4 and 6), the type of floors (flexible or rigid) and the aspect ratio of openings (h/l higher or lower than 1.0). For each class and value of effective spectral acceleration, the number of buildings that reach each damage grade is counted and the corresponding probability of exceedance is calculated. Assuming a log-normal distribution, a continuous curve is fitted to the discrete data points and its median, μ, and standard deviation, β', are calculated for each class. The standard deviation reflects variations of the geometry of the building (wall thickness, plan dimensions, number of interior walls, percentage of side length in exterior walls taken up by openings) within the class and concerning the effect of the direction of the principal horizontal seismic action component. In order to account for other sources of uncertainty, e.g. the characteristics of the seismic input, the variability of resistance, etc., the standard deviation calculated on the basis of the FE analysis is combined with the value 0.6 commonly assumed in fragility analysis, i.e. β = √(β'2 + 0.62). The values of μ and β for each building class and the five damage grades are given in Table 5.1.
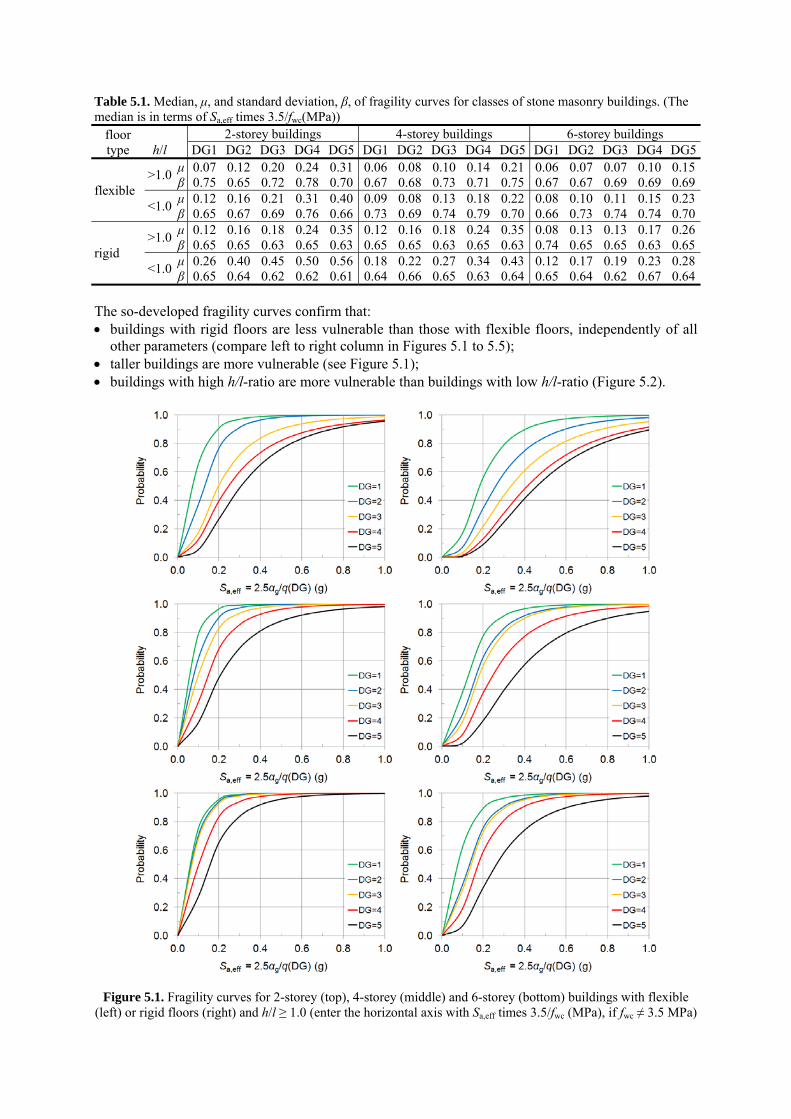
Table 5.1. Median, μ, and standard deviation, β, of fragility curves for classes of stone masonry buildings. (The median is in terms of Sa,eff times 3.5/fwc(MPa))
floor type h/l
2-storey buildings 4-storey buildings 6-storey buildings DG1 DG2 DG3 DG4 DG5 DG1 DG2 DG3 DG4 DG5 DG1 DG2 DG3 DG4 DG5
flexible >1.0
μ 0.07 0.12 0.20 0.24 0.31 0.06 0.08 0.10 0.14 0.21 0.06 0.07 0.07 0.10 0.15β 0.75 0.65 0.72 0.78 0.70 0.67 0.68 0.73 0.71 0.75 0.67 0.67 0.69 0.69 0.69
<1.0 μ 0.12 0.16 0.21 0.31 0.40 0.09 0.08 0.13 0.18 0.22 0.08 0.10 0.11 0.15 0.23β 0.65 0.67 0.69 0.76 0.66 0.73 0.69 0.74 0.79 0.70 0.66 0.73 0.74 0.74 0.70
rigid >1.0
μ 0.12 0.16 0.18 0.24 0.35 0.12 0.16 0.18 0.24 0.35 0.08 0.13 0.13 0.17 0.26β 0.65 0.65 0.63 0.65 0.63 0.65 0.65 0.63 0.65 0.63 0.74 0.65 0.65 0.63 0.65
<1.0 μ 0.26 0.40 0.45 0.50 0.56 0.18 0.22 0.27 0.34 0.43 0.12 0.17 0.19 0.23 0.28β 0.65 0.64 0.62 0.62 0.61 0.64 0.66 0.65 0.63 0.64 0.65 0.64 0.62 0.67 0.64
The so-developed fragility curves confirm that: buildings with rigid floors are less vulnerable than those with flexible floors, independently of all
other parameters (compare left to right column in Figures 5.1 to 5.5); taller buildings are more vulnerable (see Figure 5.1); buildings with high h/l-ratio are more vulnerable than buildings with low h/l-ratio (Figure 5.2).
Figure 5.1. Fragility curves for 2-storey (top), 4-storey (middle) and 6-storey (bottom) buildings with flexible (left) or rigid floors (right) and h/l ≥ 1.0 (enter the horizontal axis with Sa,eff times 3.5/fwc (MPa), if fwc ≠ 3.5 MPa)
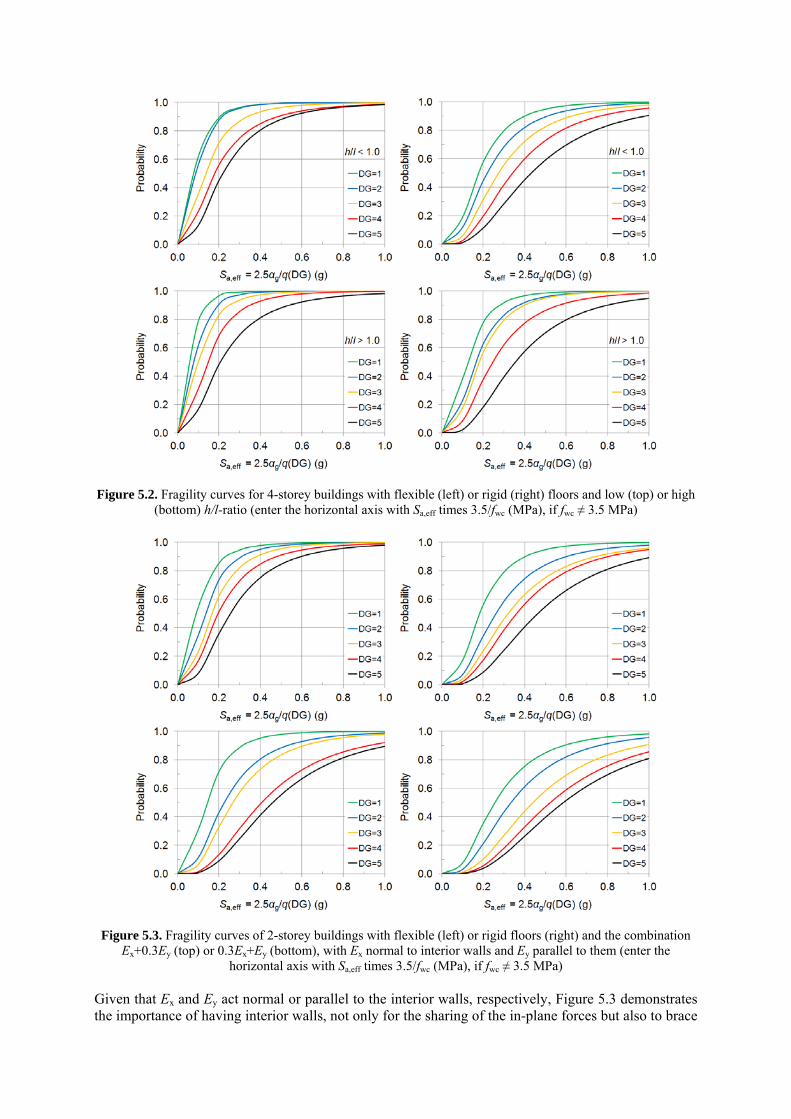
Figure 5.2. Fragility curves for 4-storey buildings with flexible (left) or rigid (right) floors and low (top) or high (bottom) h/l-ratio (enter the horizontal axis with Sa,eff times 3.5/fwc (MPa), if fwc ≠ 3.5 MPa)
Figure 5.3. Fragility curves of 2-storey buildings with flexible (left) or rigid floors (right) and the combination Ex+0.3Ey (top) or 0.3Ex+Ey (bottom), with Ex normal to interior walls and Ey parallel to them (enter the
horizontal axis with Sa,eff times 3.5/fwc (MPa), if fwc ≠ 3.5 MPa)
Given that Ex and Ey act normal or parallel to the interior walls, respectively, Figure 5.3 demonstrates the importance of having interior walls, not only for the sharing of the in-plane forces but also to brace
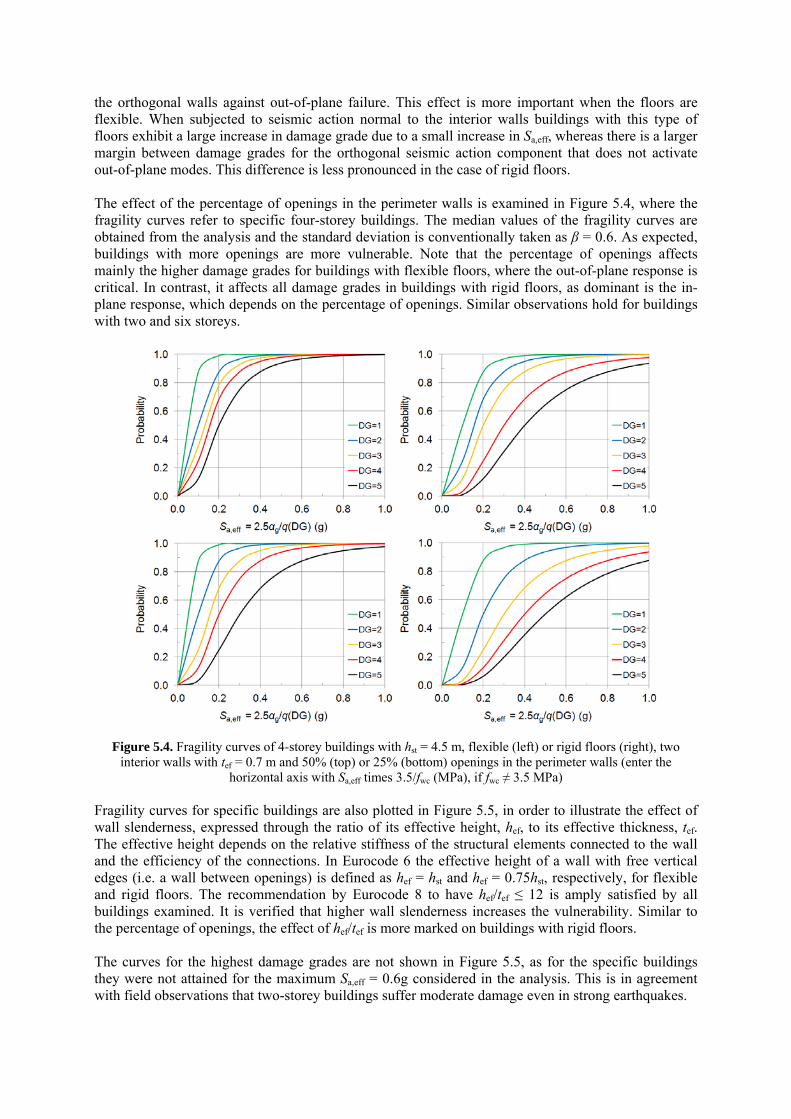
the orthogonal walls against out-of-plane failure. This effect is more important when the floors are flexible. When subjected to seismic action normal to the interior walls buildings with this type of floors exhibit a large increase in damage grade due to a small increase in Sa,eff, whereas there is a larger margin between damage grades for the orthogonal seismic action component that does not activate out-of-plane modes. This difference is less pronounced in the case of rigid floors. The effect of the percentage of openings in the perimeter walls is examined in Figure 5.4, where the fragility curves refer to specific four-storey buildings. The median values of the fragility curves are obtained from the analysis and the standard deviation is conventionally taken as β = 0.6. As expected, buildings with more openings are more vulnerable. Note that the percentage of openings affects mainly the higher damage grades for buildings with flexible floors, where the out-of-plane response is critical. In contrast, it affects all damage grades in buildings with rigid floors, as dominant is the in-plane response, which depends on the percentage of openings. Similar observations hold for buildings with two and six storeys.
Figure 5.4. Fragility curves of 4-storey buildings with hst = 4.5 m, flexible (left) or rigid floors (right), two interior walls with tef = 0.7 m and 50% (top) or 25% (bottom) openings in the perimeter walls (enter the
horizontal axis with Sa,eff times 3.5/fwc (MPa), if fwc ≠ 3.5 MPa) Fragility curves for specific buildings are also plotted in Figure 5.5, in order to illustrate the effect of wall slenderness, expressed through the ratio of its effective height, hef, to its effective thickness, tef. The effective height depends on the relative stiffness of the structural elements connected to the wall and the efficiency of the connections. In Eurocode 6 the effective height of a wall with free vertical edges (i.e. a wall between openings) is defined as hef = hst and hef = 0.75hst, respectively, for flexible and rigid floors. The recommendation by Eurocode 8 to have hef/tef ≤ 12 is amply satisfied by all buildings examined. It is verified that higher wall slenderness increases the vulnerability. Similar to the percentage of openings, the effect of hef/tef is more marked on buildings with rigid floors. The curves for the highest damage grades are not shown in Figure 5.5, as for the specific buildings they were not attained for the maximum Sa,eff = 0.6g considered in the analysis. This is in agreement with field observations that two-storey buildings suffer moderate damage even in strong earthquakes.

Figure 5.5. Fragility curves of 2-storey buildings with flexible (left) or rigid floors (right), hst = 3.5 m and one interior wall with tef = 0.6 m (top) or tef = 0.9 m (bottom) (enter the horizontal axis with Sa,eff times 3.5/fwc (MPa),
if fwc ≠ 3.5 MPa) 6. CONCLUSIONS Three-dimensional Finite Element analysis with a nonlinear biaxial failure criterion for masonry was used to investigate the seismic fragility of prototype stone masonry buildings. This refined and onerous modelling and analysis approach permitted to account for out-of-plane failure modes, which could not have been captured by equivalent plane frame models. As a matter of fact, when such failure modes were activated, they markedly increased the vulnerability and weakened the favourable effects of low pier aspect ratio, h/l, and low wall slenderness, hef/tef. Fragility curves were developed based on the results of over 1100 analyses, that cover the practical range of several parameters, namely the number of storeys, the percentage of side length in exterior walls taken up by openings, the wall thickness, plan dimensions and number of interior walls, the type of floor and the pier height-to-length ratio. Buildings with rigid floors are found to be consistently less vulnerable than those with flexible floors. Taller buildings are likely to suffer more severe damage. Higher wall slenderness and pier aspect ratio increase the vulnerability of stone masonry buildings, mainly of those with rigid floors. Higher percentage of load-bearing walls is also beneficial for the seismic fragility. Although it cannot be claimed that these effects were unknown or unexpected, in this paper they are quantified in generic terms over a range of parameters that covers almost all practical cases. ACKNOWLEDGEMENT The research leading to these results receives funding from the European Community’s 7th Framework Programme (FP7/2007-2013) under grant agreement n° 244061 (SYNER-G).
REFERENCES Cattari, S., Curti, E., Giovinazzi, S., Lagomarsino, S., Parodi, S. and Penna, A. (2004). Un modello meccanico
per l’analisi di vulnerabilità del costruito in muratura a scala urbana. XI Congresso Nazionale “L’ingegneria Sismica in Italia”.
CEN. (2004). EN 1998-1 Eurocode 8: Design of Structures for Earthquake Resistance - Part 1: General Rules, Seismic Actions and Rules for Buildings, European Committee for Standardization, Brussels.
CEN. (2005). EN 1996-1-1 Eurocode 6: Design of Masonry Structures - Part 1-1: General Rules for Reinforced and Unreinforced Masonry Structures, European Committee for Standardization, Brussels.
Colombi, M., Borzi, B., Crowley, H., Onida, M., Meroni, F. and Pinho, R. (2008). Deriving vulnerability curves using Italian earthquake damage data. Bulletin of Earthquake Engineering 6:3,485-504.
D’Ayala, D., Spence, R., Oliveira, C. and Pomonis, A. (1997). Earthquake loss estimation for Europe’s historic town centres. Earthquake Spectra 13:4,773-793.
Erberik, M.A. (2008). Generation of fragility curves for Turkish masonry buildings considering in-plane failure modes. Earthquake Engineering & Structural Dynamics 37:3,387-405.
Grünthal, G. (1998). European Macroseismic Scale 1998 (EMS-98). Cahiers du Centre Européen de Géodynamique et de Séismologie 15.
Kappos, A.J., Panagopoulos, G., Panagiotopoulos C. and Penelis, G. (2006). A hybrid method for the vulnerability assessment of R/C and URM buildings. Bulletin of Earthquake Engineering 4:4,391-413.
Karantoni, F.V., Fardis, M.N., Vintzeleou E. and Harisis, A. (1993). Effectiveness of seismic strengthening interventions. IABSE Symposium on Structural Preservation of the Architectural Heritage.
Magenes, G. (2006). Masonry building design in seismic areas: recent experiences and prospects from a European point of view. 1st European Conference on Earthquake Engineering and Seismology.
Ottosen, N. (1977). A failure criterion for concrete. ASCE Journal of Engineering Mechanics 103:4,527-535. Penelis, G.G., Kappos, A.J. and Stylianidis, K.C. (2002). Unreinforced masonry buildings – 1st level analysis.
RISK-UE report, University of Thessaloniki. Rota, M., Penna, A. and Strobbia, C.L. (2008). Processing Italian damage data to derive typological fragility
curves. Soil Dynamics and Earthquake Engineering 28:10-11,933-947.