seewave: Sound Analysis and Synthesis
221
Package ‘seewave’ July 14, 2021 Type Package Title Sound Analysis and Synthesis Version 2.1.8 Date 2021-07-14 Author Jerome Sueur <[email protected]> [cre, au], Thierry Aubin [au], Caroline Simonis [au], Laurent Lellouch [main ctrb], Pierre Aumond [ctrb], Ethan C. Brown [ctrb], Guillaume Corbeau [ctrb], Marion Depraetere [ctrb], Camille Desjonqueres [ctrb], Francois Fabianek [ctrb], Amandine Gasc [ctrb], Eric Kasten [ctrb], Stefanie LaZerte [ctrb], Jonathan Lees [ctrb], Jean Marchal [ctrb], Andre Mikulec [ctrb], Sandrine Pavoine [ctrb], David Pinaud [ctrb], Alicia Stotz [ctrb], Luis J. Villanueva-Rivera [ctrb], Zev Ross [ctrb], Carl G. Witthoft [ctrb], Hristo Zhivomirov [ctrb]. Maintainer Jerome Sueur <[email protected]> Encoding UTF-8 SystemRequirements LIBSNDFILE Imports graphics, grDevices, stats, utils, tuneR Suggests audio, fftw, ggplot2, rgl, rpanel, phonTools, signal ZipData no Description Functions for analysing, manipulating, displaying, editing and synthesiz- ing time waves (particularly sound). This package processes time analysis (oscillograms and en- velopes), spectral content, resonance quality factor, entropy, cross correlation and autocorrela- tion, zero-crossing, dominant frequency, analytic signal, frequency coherence, 2D and 3D spec- trograms and many other analy- ses. See Sueur et al. (2008) <doi:10.1080/09524622.2008.9753600> and Sueur (2018) <doi:10.1007/978- 3-319-77647-7>. License GPL (>= 2) URL http://rug.mnhn.fr/seewave/ NeedsCompilation no Repository CRAN Date/Publication 2021-07-14 13:00:02 UTC 1
Transcript of seewave: Sound Analysis and Synthesis

Package ‘seewave’July 14, 2021
Type Package
Title Sound Analysis and Synthesis
Version 2.1.8
Date 2021-07-14
Author Jerome Sueur <[email protected]> [cre, au], Thierry Aubin [au],Caroline Simonis [au], Laurent Lellouch [main ctrb],Pierre Aumond [ctrb],Ethan C. Brown [ctrb], Guillaume Corbeau [ctrb], Marion Depraetere [ctrb],Camille Desjonqueres [ctrb], Francois Fabianek [ctrb],Amandine Gasc [ctrb], Eric Kasten [ctrb], Stefanie LaZerte [ctrb],Jonathan Lees [ctrb], Jean Marchal [ctrb], Andre Mikulec [ctrb],Sandrine Pavoine [ctrb], David Pinaud [ctrb], Alicia Stotz [ctrb],Luis J. Villanueva-Rivera [ctrb], Zev Ross [ctrb],Carl G. Witthoft [ctrb], Hristo Zhivomirov [ctrb].
Maintainer Jerome Sueur <[email protected]>
Encoding UTF-8
SystemRequirements LIBSNDFILE
Imports graphics, grDevices, stats, utils, tuneR
Suggests audio, fftw, ggplot2, rgl, rpanel, phonTools, signal
ZipData no
Description Functions for analysing, manipulating, displaying, editing and synthesiz-ing time waves (particularly sound). This package processes time analysis (oscillograms and en-velopes), spectral content, resonance quality factor, entropy, cross correlation and autocorrela-tion, zero-crossing, dominant frequency, analytic signal, frequency coherence, 2D and 3D spec-trograms and many other analy-ses. See Sueur et al. (2008) <doi:10.1080/09524622.2008.9753600> and Sueur (2018) <doi:10.1007/978-3-319-77647-7>.
License GPL (>= 2)
URL http://rug.mnhn.fr/seewave/
NeedsCompilation no
Repository CRAN
Date/Publication 2021-07-14 13:00:02 UTC
1

2 R topics documented:
R topics documented:ACI . . . . . . . . . . . . . . . . . . . . . . . . . . . . . . . . . . . . . . . . . . . . . 5acoustat . . . . . . . . . . . . . . . . . . . . . . . . . . . . . . . . . . . . . . . . . . . 6addsilw . . . . . . . . . . . . . . . . . . . . . . . . . . . . . . . . . . . . . . . . . . . 8afilter . . . . . . . . . . . . . . . . . . . . . . . . . . . . . . . . . . . . . . . . . . . . 9akamatsu . . . . . . . . . . . . . . . . . . . . . . . . . . . . . . . . . . . . . . . . . . 11ama . . . . . . . . . . . . . . . . . . . . . . . . . . . . . . . . . . . . . . . . . . . . . 13AR . . . . . . . . . . . . . . . . . . . . . . . . . . . . . . . . . . . . . . . . . . . . . . 14attenuation . . . . . . . . . . . . . . . . . . . . . . . . . . . . . . . . . . . . . . . . . . 16audiomoth . . . . . . . . . . . . . . . . . . . . . . . . . . . . . . . . . . . . . . . . . . 17audiomoth.rename . . . . . . . . . . . . . . . . . . . . . . . . . . . . . . . . . . . . . 18autoc . . . . . . . . . . . . . . . . . . . . . . . . . . . . . . . . . . . . . . . . . . . . . 19beep . . . . . . . . . . . . . . . . . . . . . . . . . . . . . . . . . . . . . . . . . . . . . 21bwfilter . . . . . . . . . . . . . . . . . . . . . . . . . . . . . . . . . . . . . . . . . . . 22ccoh . . . . . . . . . . . . . . . . . . . . . . . . . . . . . . . . . . . . . . . . . . . . . 23ceps . . . . . . . . . . . . . . . . . . . . . . . . . . . . . . . . . . . . . . . . . . . . . 26cepstro . . . . . . . . . . . . . . . . . . . . . . . . . . . . . . . . . . . . . . . . . . . . 28coh . . . . . . . . . . . . . . . . . . . . . . . . . . . . . . . . . . . . . . . . . . . . . . 30combfilter . . . . . . . . . . . . . . . . . . . . . . . . . . . . . . . . . . . . . . . . . . 31convSPL . . . . . . . . . . . . . . . . . . . . . . . . . . . . . . . . . . . . . . . . . . . 33corenv . . . . . . . . . . . . . . . . . . . . . . . . . . . . . . . . . . . . . . . . . . . . 34corspec . . . . . . . . . . . . . . . . . . . . . . . . . . . . . . . . . . . . . . . . . . . 36covspectro . . . . . . . . . . . . . . . . . . . . . . . . . . . . . . . . . . . . . . . . . . 38crest . . . . . . . . . . . . . . . . . . . . . . . . . . . . . . . . . . . . . . . . . . . . . 40csh . . . . . . . . . . . . . . . . . . . . . . . . . . . . . . . . . . . . . . . . . . . . . . 41cutspec . . . . . . . . . . . . . . . . . . . . . . . . . . . . . . . . . . . . . . . . . . . 43cutw . . . . . . . . . . . . . . . . . . . . . . . . . . . . . . . . . . . . . . . . . . . . . 44dBscale . . . . . . . . . . . . . . . . . . . . . . . . . . . . . . . . . . . . . . . . . . . 45dBweight . . . . . . . . . . . . . . . . . . . . . . . . . . . . . . . . . . . . . . . . . . 47deletew . . . . . . . . . . . . . . . . . . . . . . . . . . . . . . . . . . . . . . . . . . . 48dfreq . . . . . . . . . . . . . . . . . . . . . . . . . . . . . . . . . . . . . . . . . . . . . 50diffcumspec . . . . . . . . . . . . . . . . . . . . . . . . . . . . . . . . . . . . . . . . . 51diffenv . . . . . . . . . . . . . . . . . . . . . . . . . . . . . . . . . . . . . . . . . . . . 53diffspec . . . . . . . . . . . . . . . . . . . . . . . . . . . . . . . . . . . . . . . . . . . 55diffwave . . . . . . . . . . . . . . . . . . . . . . . . . . . . . . . . . . . . . . . . . . . 57discrets . . . . . . . . . . . . . . . . . . . . . . . . . . . . . . . . . . . . . . . . . . . 59drawenv . . . . . . . . . . . . . . . . . . . . . . . . . . . . . . . . . . . . . . . . . . . 60drawfilter . . . . . . . . . . . . . . . . . . . . . . . . . . . . . . . . . . . . . . . . . . 61duration . . . . . . . . . . . . . . . . . . . . . . . . . . . . . . . . . . . . . . . . . . . 63dynoscillo . . . . . . . . . . . . . . . . . . . . . . . . . . . . . . . . . . . . . . . . . . 64dynspec . . . . . . . . . . . . . . . . . . . . . . . . . . . . . . . . . . . . . . . . . . . 65dynspectro . . . . . . . . . . . . . . . . . . . . . . . . . . . . . . . . . . . . . . . . . . 67echo . . . . . . . . . . . . . . . . . . . . . . . . . . . . . . . . . . . . . . . . . . . . . 70env . . . . . . . . . . . . . . . . . . . . . . . . . . . . . . . . . . . . . . . . . . . . . . 71export . . . . . . . . . . . . . . . . . . . . . . . . . . . . . . . . . . . . . . . . . . . . 73fadew . . . . . . . . . . . . . . . . . . . . . . . . . . . . . . . . . . . . . . . . . . . . 74fbands . . . . . . . . . . . . . . . . . . . . . . . . . . . . . . . . . . . . . . . . . . . . 75

R topics documented: 3
fdoppler . . . . . . . . . . . . . . . . . . . . . . . . . . . . . . . . . . . . . . . . . . . 77ffilter . . . . . . . . . . . . . . . . . . . . . . . . . . . . . . . . . . . . . . . . . . . . . 79field . . . . . . . . . . . . . . . . . . . . . . . . . . . . . . . . . . . . . . . . . . . . . 80fir . . . . . . . . . . . . . . . . . . . . . . . . . . . . . . . . . . . . . . . . . . . . . . 82fma . . . . . . . . . . . . . . . . . . . . . . . . . . . . . . . . . . . . . . . . . . . . . 83fpeaks . . . . . . . . . . . . . . . . . . . . . . . . . . . . . . . . . . . . . . . . . . . . 85ftwindow . . . . . . . . . . . . . . . . . . . . . . . . . . . . . . . . . . . . . . . . . . 87fund . . . . . . . . . . . . . . . . . . . . . . . . . . . . . . . . . . . . . . . . . . . . . 89gammatone . . . . . . . . . . . . . . . . . . . . . . . . . . . . . . . . . . . . . . . . . 90ggspectro . . . . . . . . . . . . . . . . . . . . . . . . . . . . . . . . . . . . . . . . . . 92H . . . . . . . . . . . . . . . . . . . . . . . . . . . . . . . . . . . . . . . . . . . . . . 94hilbert . . . . . . . . . . . . . . . . . . . . . . . . . . . . . . . . . . . . . . . . . . . . 95ifreq . . . . . . . . . . . . . . . . . . . . . . . . . . . . . . . . . . . . . . . . . . . . . 96istft . . . . . . . . . . . . . . . . . . . . . . . . . . . . . . . . . . . . . . . . . . . . . 98itakura.dist . . . . . . . . . . . . . . . . . . . . . . . . . . . . . . . . . . . . . . . . . 100kl.dist . . . . . . . . . . . . . . . . . . . . . . . . . . . . . . . . . . . . . . . . . . . . 101ks.dist . . . . . . . . . . . . . . . . . . . . . . . . . . . . . . . . . . . . . . . . . . . . 102lfs . . . . . . . . . . . . . . . . . . . . . . . . . . . . . . . . . . . . . . . . . . . . . . 104listen . . . . . . . . . . . . . . . . . . . . . . . . . . . . . . . . . . . . . . . . . . . . . 106localpeaks . . . . . . . . . . . . . . . . . . . . . . . . . . . . . . . . . . . . . . . . . . 107logspec.dist . . . . . . . . . . . . . . . . . . . . . . . . . . . . . . . . . . . . . . . . . 108lts . . . . . . . . . . . . . . . . . . . . . . . . . . . . . . . . . . . . . . . . . . . . . . 110M . . . . . . . . . . . . . . . . . . . . . . . . . . . . . . . . . . . . . . . . . . . . . . 112meandB . . . . . . . . . . . . . . . . . . . . . . . . . . . . . . . . . . . . . . . . . . . 113meanspec . . . . . . . . . . . . . . . . . . . . . . . . . . . . . . . . . . . . . . . . . . 114mel . . . . . . . . . . . . . . . . . . . . . . . . . . . . . . . . . . . . . . . . . . . . . 116melfilterbank . . . . . . . . . . . . . . . . . . . . . . . . . . . . . . . . . . . . . . . . 118micsens . . . . . . . . . . . . . . . . . . . . . . . . . . . . . . . . . . . . . . . . . . . 119moredB . . . . . . . . . . . . . . . . . . . . . . . . . . . . . . . . . . . . . . . . . . . 120mutew . . . . . . . . . . . . . . . . . . . . . . . . . . . . . . . . . . . . . . . . . . . . 121NDSI . . . . . . . . . . . . . . . . . . . . . . . . . . . . . . . . . . . . . . . . . . . . 122noisew . . . . . . . . . . . . . . . . . . . . . . . . . . . . . . . . . . . . . . . . . . . . 123notefreq . . . . . . . . . . . . . . . . . . . . . . . . . . . . . . . . . . . . . . . . . . . 124octaves . . . . . . . . . . . . . . . . . . . . . . . . . . . . . . . . . . . . . . . . . . . 125orni . . . . . . . . . . . . . . . . . . . . . . . . . . . . . . . . . . . . . . . . . . . . . 126oscillo . . . . . . . . . . . . . . . . . . . . . . . . . . . . . . . . . . . . . . . . . . . . 127oscilloST . . . . . . . . . . . . . . . . . . . . . . . . . . . . . . . . . . . . . . . . . . 130pastew . . . . . . . . . . . . . . . . . . . . . . . . . . . . . . . . . . . . . . . . . . . . 131peewit . . . . . . . . . . . . . . . . . . . . . . . . . . . . . . . . . . . . . . . . . . . . 133pellucens . . . . . . . . . . . . . . . . . . . . . . . . . . . . . . . . . . . . . . . . . . 134phaseplot . . . . . . . . . . . . . . . . . . . . . . . . . . . . . . . . . . . . . . . . . . 134phaseplot2 . . . . . . . . . . . . . . . . . . . . . . . . . . . . . . . . . . . . . . . . . . 136playlist . . . . . . . . . . . . . . . . . . . . . . . . . . . . . . . . . . . . . . . . . . . . 137preemphasis . . . . . . . . . . . . . . . . . . . . . . . . . . . . . . . . . . . . . . . . . 138pulsew . . . . . . . . . . . . . . . . . . . . . . . . . . . . . . . . . . . . . . . . . . . . 139Q . . . . . . . . . . . . . . . . . . . . . . . . . . . . . . . . . . . . . . . . . . . . . . 140read.audacity . . . . . . . . . . . . . . . . . . . . . . . . . . . . . . . . . . . . . . . . 142repw . . . . . . . . . . . . . . . . . . . . . . . . . . . . . . . . . . . . . . . . . . . . . 143

4 R topics documented:
resamp . . . . . . . . . . . . . . . . . . . . . . . . . . . . . . . . . . . . . . . . . . . . 144revw . . . . . . . . . . . . . . . . . . . . . . . . . . . . . . . . . . . . . . . . . . . . . 145rmam . . . . . . . . . . . . . . . . . . . . . . . . . . . . . . . . . . . . . . . . . . . . 146rmnoise . . . . . . . . . . . . . . . . . . . . . . . . . . . . . . . . . . . . . . . . . . . 148rmoffset . . . . . . . . . . . . . . . . . . . . . . . . . . . . . . . . . . . . . . . . . . . 149rms . . . . . . . . . . . . . . . . . . . . . . . . . . . . . . . . . . . . . . . . . . . . . 150roughness . . . . . . . . . . . . . . . . . . . . . . . . . . . . . . . . . . . . . . . . . . 151rugo . . . . . . . . . . . . . . . . . . . . . . . . . . . . . . . . . . . . . . . . . . . . . 152savewav . . . . . . . . . . . . . . . . . . . . . . . . . . . . . . . . . . . . . . . . . . . 153SAX . . . . . . . . . . . . . . . . . . . . . . . . . . . . . . . . . . . . . . . . . . . . . 154sddB . . . . . . . . . . . . . . . . . . . . . . . . . . . . . . . . . . . . . . . . . . . . . 156seedata . . . . . . . . . . . . . . . . . . . . . . . . . . . . . . . . . . . . . . . . . . . . 157seewave . . . . . . . . . . . . . . . . . . . . . . . . . . . . . . . . . . . . . . . . . . . 158setenv . . . . . . . . . . . . . . . . . . . . . . . . . . . . . . . . . . . . . . . . . . . . 159sfm . . . . . . . . . . . . . . . . . . . . . . . . . . . . . . . . . . . . . . . . . . . . . 160sh . . . . . . . . . . . . . . . . . . . . . . . . . . . . . . . . . . . . . . . . . . . . . . 161sheep . . . . . . . . . . . . . . . . . . . . . . . . . . . . . . . . . . . . . . . . . . . . 163simspec . . . . . . . . . . . . . . . . . . . . . . . . . . . . . . . . . . . . . . . . . . . 164smoothw . . . . . . . . . . . . . . . . . . . . . . . . . . . . . . . . . . . . . . . . . . . 166songmeter . . . . . . . . . . . . . . . . . . . . . . . . . . . . . . . . . . . . . . . . . . 167songmeterdiag . . . . . . . . . . . . . . . . . . . . . . . . . . . . . . . . . . . . . . . . 169soundscapespec . . . . . . . . . . . . . . . . . . . . . . . . . . . . . . . . . . . . . . . 172sox . . . . . . . . . . . . . . . . . . . . . . . . . . . . . . . . . . . . . . . . . . . . . . 173spec . . . . . . . . . . . . . . . . . . . . . . . . . . . . . . . . . . . . . . . . . . . . . 174specflux . . . . . . . . . . . . . . . . . . . . . . . . . . . . . . . . . . . . . . . . . . . 177specprop . . . . . . . . . . . . . . . . . . . . . . . . . . . . . . . . . . . . . . . . . . . 179spectro . . . . . . . . . . . . . . . . . . . . . . . . . . . . . . . . . . . . . . . . . . . . 181spectro3D . . . . . . . . . . . . . . . . . . . . . . . . . . . . . . . . . . . . . . . . . . 186squarefilter . . . . . . . . . . . . . . . . . . . . . . . . . . . . . . . . . . . . . . . . . 188symba . . . . . . . . . . . . . . . . . . . . . . . . . . . . . . . . . . . . . . . . . . . . 189synth . . . . . . . . . . . . . . . . . . . . . . . . . . . . . . . . . . . . . . . . . . . . . 191synth2 . . . . . . . . . . . . . . . . . . . . . . . . . . . . . . . . . . . . . . . . . . . . 194TFSD . . . . . . . . . . . . . . . . . . . . . . . . . . . . . . . . . . . . . . . . . . . . 196th . . . . . . . . . . . . . . . . . . . . . . . . . . . . . . . . . . . . . . . . . . . . . . 197tico . . . . . . . . . . . . . . . . . . . . . . . . . . . . . . . . . . . . . . . . . . . . . 199timelapse . . . . . . . . . . . . . . . . . . . . . . . . . . . . . . . . . . . . . . . . . . 200timer . . . . . . . . . . . . . . . . . . . . . . . . . . . . . . . . . . . . . . . . . . . . . 201TKEO . . . . . . . . . . . . . . . . . . . . . . . . . . . . . . . . . . . . . . . . . . . . 203wasp . . . . . . . . . . . . . . . . . . . . . . . . . . . . . . . . . . . . . . . . . . . . . 205wav2flac . . . . . . . . . . . . . . . . . . . . . . . . . . . . . . . . . . . . . . . . . . . 207wf . . . . . . . . . . . . . . . . . . . . . . . . . . . . . . . . . . . . . . . . . . . . . . 208write.audacity . . . . . . . . . . . . . . . . . . . . . . . . . . . . . . . . . . . . . . . . 210zapsilw . . . . . . . . . . . . . . . . . . . . . . . . . . . . . . . . . . . . . . . . . . . 211zc . . . . . . . . . . . . . . . . . . . . . . . . . . . . . . . . . . . . . . . . . . . . . . 212zcr . . . . . . . . . . . . . . . . . . . . . . . . . . . . . . . . . . . . . . . . . . . . . . 214
Index 217

ACI 5
ACI Acoustic Complexity Index
Description
This function computes the Acoustic Complexity Index (ACI) as described in Pieretti et al. (2011)
Usage
ACI(wave, f, channel = 1, wl = 512, ovlp = 0, wn = "hamming", flim = NULL, nbwindows = 1)
Arguments
wave an R object.
f sampling frequency of wave (in Hz). Does not need to be specified if embeddedin wave.
channel channel of the R object, by default left channel (1).
wl window length for the analysis (even number of points) (by default = 512).
ovlp overlap between two successive windows (in %).
wn window name, see ftwindow (by default "hanning").
flim a numeric vector of length 2 to select a frequency band (in kHz).
nbwindows a numeric vector of length 1 specifying the number of windows (by default 1, iea single window including the complete wave object.
Details
The function computes first a short-term Fourier transform and then the ACI index.The function returns only the ACI total, ACI tot in Pieretti et al. (2010).See the references for details on computation.
Value
A vector of length 1 returning the ACI total.
Note
Values returned were checked with the results provided by the add-on Soundscapemeter for thesoftware Wavesurfer https://www.speech.kth.se/wavesurfer/.
Author(s)
Laurent Lellouch, improved by Amandine Gasc and Morgane Papin

6 acoustat
References
Pieretti N, Farina A, Morri FD (2011) A new methodology to infer the singing activity of an aviancommunity: the Acoustic Complexity Index (ACI). Ecological Indicators, 11, 868-873.Farina A, Pieretti N, Piccioli L (2011) The soundscape methodology for long-term bird monitoring:a Mediterranean Europe case-study. Ecological Informatics, 6, 354-363.
See Also
spectro, specflux
Examples
data(tico)ACI(tico)## dividing the sound sample into 4 windows of equal durationACI(tico, nbwindows=4)## selection of a frequency bandACI(tico, flim=c(2,6))
acoustat Statistics on time and frequency STFT contours
Description
This function returns statistics based on STFT time and frequency contours.
Usage
acoustat(wave, f, channel = 1, wl = 512, ovlp = 0, wn = "hanning",tlim = NULL, flim = NULL,aggregate = sum, fraction = 90,plot = TRUE, type = "l", ...)
Arguments
wave an R object.
f sampling frequency of wave (in Hz). Does not need to be specified if embeddedin wave.
channel channel of the R object, by default left channel (1).
wl window length for the analysis (even number of points) (by default = 512).
ovlp overlap between two successive windows (in %).
wn window name, see ftwindow (by default "hanning").
tlim modifications of the time limits of the analysis (in s).
flim modifications of the frequency limits of the analysis (in kHz).

acoustat 7
aggregate a character vector of length 1 specifying the function to be applied on the rows(time) and columns (frequency) of the STFT matrix. By default set to sum.
fraction a numeric vector of length 1, specifying a particular fraction of the contoursamplitude to be captured by the initial and terminal percentile values (in %).See details.
plot a logical, if TRUE a two-frame plot is returned with the time and frequency con-tours and percentiles displayed.
type if plot is TRUE, type of plot that should be drawn. See plot for details (bydefault "l" for lines).
... other plot graphical parameters.
Details
The principle of acoustat is as follows:
1. Compute the short-term Fourier transform (STFT) with usual parameters (wl for windowlength, ovlp for overlap of successive windows, and wn for the name of window shape).
2. This results in a time * frequency matrix.3. Compute an aggregation function (specified with the argument aggregate set by default to
sum) accross rows and columns of time * frequency matrix.)4. This results in two components: (i) the time contour, and (ii) the frequency contour.5. Each contour is considered as a probability mass function (PMF) and transformed into a cu-
mulated distribution function (CDF).6. Measures are extracted from each CDF: median (M), initial percentile (P1) value, terminal
percentile (P2) value, interpercentile range (IPR). P1, P2 and IPR are defined using a fractionparameter (fraction) that sets the percent of the contour amplitude to be captured by theinitial and terminal percentile values. A fraction of 50% would result in the familiar quartilesand interquartile range. An energy fraction of 80% would return the 10th and 90th percentilevalues, and the width of the range in between.
Value
The function returns a list with 10 items:
time.contour the time contour as a two-column matrix, the first colum being time (s) and thesecond colum being the amplitude probability mass function (no scale).
freq.contour the frequency contour as a two-column matrix, the first colum being frequency(kHz) and the second colum being the amplitude probability mass function (noscale).
time.P1 the time initial percentiletime.M the time mediantime.P2 the time terminal percentiletime.IPR the time interpercentile rangefreq.P1 the frequency initial percentilefreq.M the frequency medianfreq.P2 the frequency terminal percentilefreq.IPR the frequency interpercentile range

8 addsilw
Note
acoustat was originally developped in Matlab language by Kurt Fristrup and XXXX Watkins(1992) .The R function was kindly checked by Kurt Fristrup.
Author(s)
Jerome Sueur
References
Fristrup, K. M. and Watkins, W. A. 1992. Characterizing acoustic features of marine animal sounds.Woods Hole Oceanographic Institution Technical Report WHOI-92-04.
See Also
meanspec, specprop
Examples
data(tico)note <- cutw(tico, from=0.5, to=0.9, output="Wave")## default settingacoustat(note)## change the percentile fractionacoustat(note, fraction=50)## change the STFT parametersacoustat(note, wl=1024, ovlp=80)## change the function to compute the aggregate contours## standard deviation instead of sumacoustat(note, aggregate=sd)## direct time and frequency selectionacoustat(tico, tlim=c(0.5,0.9), flim=c(3,6))## some useless graphical changesacoustat(note, type="o", col="blue")
addsilw Add or insert a silence section
Description
Add or insert a silence section to a time wave.
Usage
addsilw(wave, f, channel = 1, at = "end", choose = FALSE, d = NULL,plot = FALSE, output = "matrix", ...)

afilter 9
Arguments
wave an R object.
f sampling frequency of wave (in Hz). Does not need to be specified if embeddedin wave.
channel channel of the R object, by default left channel (1).
at position where to add the silence section (in s). Can be also specified as "start","middle" or "end".
choose logical, if TRUE the point where silence will be added into wave2 (=at) can begraphically chosen with a cursor.
d duration of the silence section to add (in s).
plot logical, if TRUE returns an oscillographic plot of wave with the new silence sec-tion (by default TRUE).
output character string, the class of the object to return, either "matrix", "Wave","Sample", "audioSample" or "ts".
... other oscillo graphical parameters.
Value
If plot is FALSE, a new wave is returned. The class of the returned object is set with the argumentoutput.
Author(s)
Jerome Sueur <[email protected]>
See Also
oscillo, cutw,deletew, fadew,pastew, mutew,revw, zapsilw
afilter Amplitude filter
Description
This function deletes all signal which amplitude is below a selected threshold.
Usage
afilter(wave, f, channel = 1, threshold = 5, plot = TRUE,listen = FALSE, output = "matrix", ...)

10 afilter
Arguments
wave an R object.
f sampling frequency of wave (in Hz). Does not need to be specified if embeddedin wave.
channel channel of the R object, by default left channel (1).
threshold amplitude threshold (in %).
plot logical, if TRUE plots the new oscillogram (by default TRUE).
listen if TRUE the new sound is played back.
output character string, the class of the object to return, either "matrix", "Wave","Sample", "audioSample" or "ts".
... other oscillo graphical parameters.
Details
The threshold value is in % relative to the maximal value of wave. Signal inferior to this value isclipped.
Value
If plot is FALSE, a new wave is returned. The class of the returned object is set with the argumentoutput.
Note
This function is used as an argument (threshold) in the following functions: autoc, csh, dfreq,timer and zc.
Author(s)
Jerome Sueur <[email protected]>
See Also
oscillo
Examples
data(orni)op<-par(mfrow=c(2,1))afilter(orni,f=22050)title(main = "threshold level = 5")afilter(orni,f=22050,threshold=0.5,colwave="blue")title(main = "threshold level = 0.5")par(op)

akamatsu 11
akamatsu Water tank minimum resonant and cutoff frequencies
Description
This function computes the resonant and cutoff frequencies when recording in a given aquariumaccording to the criteria explained in Akamatsu et al. (2002)
Usage
akamatsu(Lx, Ly, Lz, mode = c(1,1,1),c = 148000, plot = FALSE, xlab = "Frequency (kHz)",ylab = "Attenuation distance (cm)", ...)
Arguments
Lx watertank length (in cm).
Ly watertank width (in cm).
Lz watertank height (in cm).
mode mode, see details.
c sound velocity in cm/s (by default 148000 cm/s in water).
plot logical, if TRUE plots the attenuation distance in function of frequency.
xlab title of the x axis if plot is TRUE.
ylab title of the y axis if plot is TRUE.
... other plot graphical parameters.
Details
From Akamatsu et al. (2002):
1. Resonant frequency
The calculated resonant frequencies of a rectangular glass tank with the dimension of Lx , Ly ,and Lz (in centimeters) can be described by the following equation:
frectangularlmn =c
2×
√(l
Lx
)2
+
(m
Ly
)2
+
(n
Lz
)2
where c is the sound velocity (cm/s) and each l, m, n reprents an integer, and the combination ofthese paramameters designates the ’mode number’. The mode (1, 1, 1) represents the resonancewave of minimum frequency. The mode (2, 1, 1) represents one of the higher order of resonantcomponent and has additional node of the soundpressure level at the middle of the X axis, i.e.,Lx/2.

12 akamatsu
2. Cutoff frequency
The cutoff frequency can be calculated as follows:
frectangularcutoff =c
2×
√(1
Ly
)2
+
(1
Lz
)2
3. Attenuation distance
The theoretical attenuation distance D can be expressed in function of the cutoff frequency andthe projected frequency following:
Drectangular(f) = 2× log10 ×c
4πfrectangularcutoff
× 1√1−
(f
frectangularcutoff
)2
Value
A list of two items:
res Resonant frequency (in Hz). See Details
cut Cut frequency (in Hz). See Details
Author(s)
Camille Desjonqueres
References
Akamatsu T, Okumura T, Novarini N, Yan HY (2002) Emprical refinements applicable to therecording of fish sounds in small tanks. Journal of the Acoustical Society of America, 112, 3073-3082.
Examples
akamatsu(60, 30, 40)
ama 13
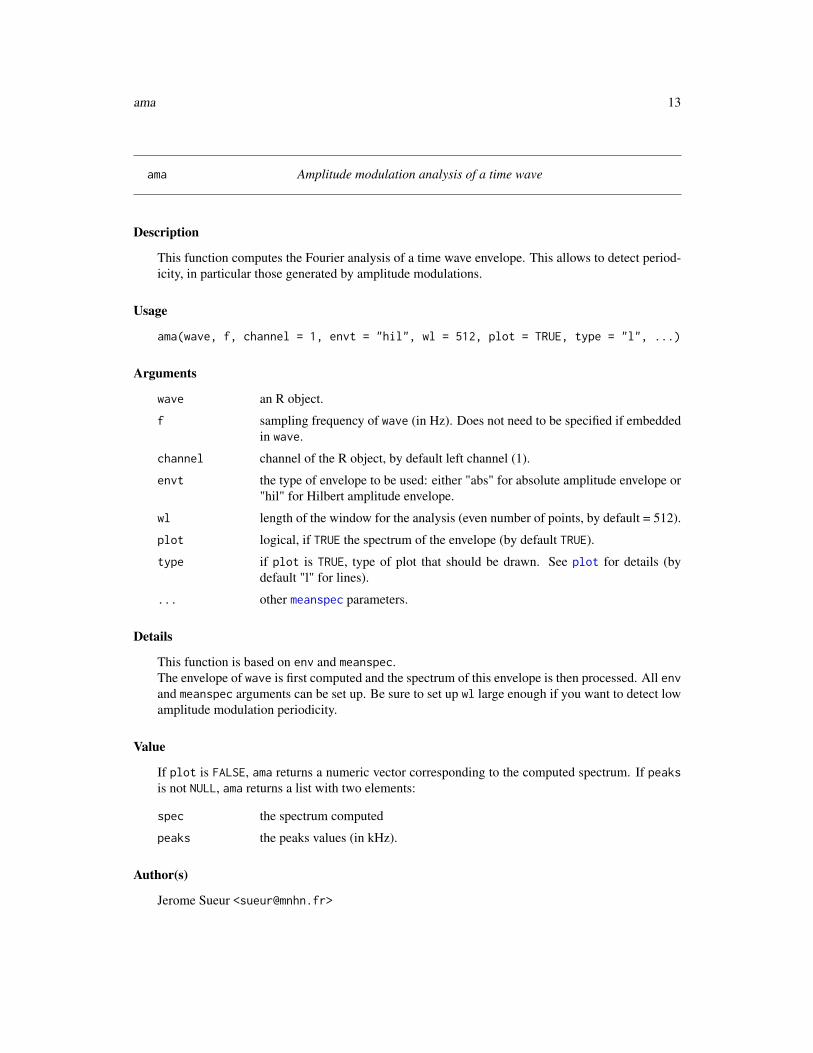
ama Amplitude modulation analysis of a time wave
Description
This function computes the Fourier analysis of a time wave envelope. This allows to detect period-icity, in particular those generated by amplitude modulations.
Usage
ama(wave, f, channel = 1, envt = "hil", wl = 512, plot = TRUE, type = "l", ...)
Arguments
wave an R object.
f sampling frequency of wave (in Hz). Does not need to be specified if embeddedin wave.
channel channel of the R object, by default left channel (1).
envt the type of envelope to be used: either "abs" for absolute amplitude envelope or"hil" for Hilbert amplitude envelope.
wl length of the window for the analysis (even number of points, by default = 512).
plot logical, if TRUE the spectrum of the envelope (by default TRUE).
type if plot is TRUE, type of plot that should be drawn. See plot for details (bydefault "l" for lines).
... other meanspec parameters.
Details
This function is based on env and meanspec.The envelope of wave is first computed and the spectrum of this envelope is then processed. All envand meanspec arguments can be set up. Be sure to set up wl large enough if you want to detect lowamplitude modulation periodicity.
Value
If plot is FALSE, ama returns a numeric vector corresponding to the computed spectrum. If peaksis not NULL, ama returns a list with two elements:
spec the spectrum computed
peaks the peaks values (in kHz).
Author(s)
Jerome Sueur <[email protected]>
14 AR
See Also
env, fma, meanspec
Examples
data(orni)# detection of the main amplitude modulation in a cicada song:# one with a 0.258 kHz frequency (due to pulses in the echemes)# one with a 2.369 kHz frequency (fundamental frequency)ama(orni,f=22050,wl=1024)# these amplitude modulations can be identify with a cursor:ama(orni,f=22050,wl=1024,identify=TRUE)
AR Acoustic Richness index
Description
This function computes the Acoustic Richness index based on M and Ht indices
Usage
AR(..., datatype = "objects", envt = "hil",msmooth = NULL, ksmooth = NULL, ssmooth = NULL,pattern = "[wav]$|[WAV]$|[mp3]$")
Arguments
... Wave, WaveMC, audioSample objects if datatype="objects", or a path as acharacter string to a directory including .wav and/or .mp3 files if datatype="files".
datatype A character string to specify if inputs are either R objects (datatype="objects",default) or files (datatype="files").
envt the type of envelope to be returned: either "abs" for absolute amplitude enve-lope or "hil" for Hilbert (default) amplitude envelope. See env.
msmooth mean smooth. See env.
ksmooth kernel smooth via kernel. See env.
ssmooth sum smooth. See env.
pattern an optional regular expression. Only file names which match the regular expres-sion will be returned when datatype="files". By default .wav or .mp3 files.See dir.
AR 15
Details
AR is ranked index based on the rank of the M and Ht indices obtained with the functions M and threspectively following:
AR =rank(M)× rank(Ht)
n2
with0 ≤ AR ≤ 1
Value
A data.frame with three columns (M, Ht, AR) and n columns, with n the number of objects(respectively files) used as input.
Note
As a ranked index, the results returned by AR strongly depends with the set of objects (respectivelyfiles) used as input. Comparaison between different data sets may be spurious. Computing AR ona set of a single object does not make any sense but is allowed.
Author(s)
Jerome Sueur and Marion Depraetere
References
Depraetere M, Pavoine S, Jiguet F, Gasc A, Duvail S, Sueur J (2012) Monitoring animal diversityusing acoustic indices: implementation in a temperate woodland. Ecological Indicators, 13, 46-54.
See Also
M, th, env
Examples
## input as R objectsdata(orni)data(tico)AR(orni, tico)## give names to objects if you wish to have them as row names of the returned data.frameAR(orni=orni, tico=tico)## input as files stored in the working directory## file names will be used as row names of the returned data.frame## Not run:require(tuneR)AR(getwd(), datatype="files")
## End(Not run)

16 attenuation
attenuation Generate sound intensity attenuation data
Description
This function generates dB data following theoretical spherical attenuation of sound.
Usage
attenuation(lref, dref = 1, dstop, n, plot = TRUE,xlab = "Distance (m)", ylab = "dB", type = "l", ...)
Arguments
lref reference intensity or pressure level (in dB).
dref reference distance corresponding to lref (in m.) (by default = 1).
dstop maximal distance of propagation (in m.).
n number of points generated between dref and dstop.
plot logical, if TRUE plots attenuation against distance of propagation (by defaultTRUE).
xlab title of the x axis.
ylab title of the y axis.
type if plot is TRUE, type of plot that should be drawn. See plot for details (bydefault "l" for lines).
... other plot graphical parameters.
Value
If plot is FALSE return a numeric vector with the data generated.
Note
Sound attenuation in a free, unbounded medium behaves in accordance with the inverse squarelaw. attenuation generates data following this rule from a reference point where sound intensitylevel (SIL) or sound pressure level (SPL) is known. Such theoretical data can be compared withexperimental data collected in a real environment.
Author(s)
Jerome Sueur
References
Hartmann, W. M. 1998 Signals, sound and sensation. New York: Springer.

audiomoth 17
See Also
convSPL, moredB
Examples
# theoretical attenuation up to 150 m of a 100 dB/1m sound sourceattenuation(lref=100, dref=1, dstop=150, n=200)
audiomoth Reading and interpreting Audiomoth file name
Description
This function reads and decomposes the files names generated by an Audiomoth device, audio digalrecorders produced by the society Open Acoustic Devices.
Usage
audiomoth(x, tz = "")
Arguments
x a character vector with .wav file names.
tz a character vector defining a time zone specification. See as.POSIXct
Details
The digital recorder Audiomoth produced by Open Acoustic Devices (https://www.openacousticdevices.info/) generates .wav files which names contains information about the time of recording. The in-formation is encoded in hexadecimal (e.g. "5E9089F0"). The function audiomoth decodes thisinformation so that time of recording can be retrieved in numeric or time format.
Value
The function returns a data.frame with the following columns:
year year of recording, numeric
month month of recording, numeric
day day of recording, numeric
hour hour of recording, numeric
min minute of recording, numeric
sec second of recording, numeric
time time in POSIX format

18 audiomoth.rename
Note
For the time zone see the 607 time zone names stored in OlsonNames.The file names of Audiomoth may change with time. There is no guarantee that the function willbe updated on time.
Author(s)
Jerome Sueur
References
See Open Acoustic Devices website for details regarding the Audiomoth: https://www.openacousticdevices.info/.
See Also
audiomoth.rename, as.POSIXct, OlsonNames, songmeter
Examples
## recording done on Friday 10 April 2020 16:54:44 UTC## computer time zone (local time, Europe, Paris for the test)audiomoth("5E90A4D4.WAV")## UTCaudiomoth("5E90A4D4.WAV", tz="UTC")## GMT (= UTC as UTC and GMT are synonyms)audiomoth("5E90A4D4.WAV", tz="GMT")## UTC -2audiomoth("5E90A4D4.WAV", tz="Etc/GMT-2")## in Asia, Japanaudiomoth("5E90A4D4.WAV", tz="Japan")## in South-America, Cayenneaudiomoth("5E90A4D4.WAV", tz="America/Cayenne")## several filesfilenames <- c("5E914ED0.WAV", "5E915128.WAV","5E915380.WAV", "5E9155D8.WAV", "5E915830.WAV","5E915A88.WAV", "5E915CE0.WAV", "5E915F38.WAV","5E916190.WAV", "5E9163E8.WAV")audiomoth(filenames)
audiomoth.rename Rename audiomoth files in a readable format
Description
This function renames or copies files created with an Audiomoth device in a readable format in-cluding the data and time of recording.

autoc 19
Usage
audiomoth.rename(dir, overwrite = FALSE, tz = "", prefix = "")
Arguments
dir a character vector, path to directory where the .WAV files are stored.
overwrite a logical, to specify if the files should be renamed or copied, if TRUE the files arecopied, if FALSE the files are renamed.
tz a character vector defining a time zone specification. See as.POSIXct
prefix a charcter vector for a prefix name to be added at the beginning of the file name.
Details
The format of the new file names follows the format of the SongMeter SM2/SM4 deveices: PREFIX_YYYYMMDD_HHMMSS.wav.
Value
1 logical vector indicating which operation succeeded for each of the files attempted.
Note
Be careful if you overwrite the files.
Author(s)
Jerome Sueur
See Also
audiomoth, songmeter
autoc Short-term autocorrelation of a time wave
Description
This function returns the fundamental frequency of a harmonic time wave. This is achieved bycomputing a correlation of the signal with itself after a time delay.
Usage
autoc(wave, f, channel = 1, wl = 512, fmin, fmax, threshold = NULL, plot = TRUE,xlab = "Time (s)", ylab = "Frequency (kHz)", ylim = c(0, f/2000), pb =FALSE, ...)

20 autoc
Arguments
wave an R object.f sampling frequency of wave (in Hz). Does not need to be specified if embedded
in wave.channel channel of the R object, by default left channel (1).wl length of the window for the analysis (even number of points, by default = 512).fmin the minimum frequency to detect (in Hz). See details.fmax the maximum frequency to detect (in Hz). See detailsthreshold amplitude threshold for signal detection (in %).plot logical, if TRUE plots the fundamental frequency against time (by default TRUE).xlab title of the x-axis.ylab title of the y-axis.ylim the range of y values.pb if TRUE returns a text progress bar in the console.... other plot graphical parameters.
Details
’fmin’ and ’fmax’ can help by reducing computing time but can also produce less accurate results.
Value
When plot is FALSE, autoc returns a two-column matrix, the first column corresponding to time inseconds (x-axis) and the second column corresponding to to fundamental frequency in kHz (y-axis).NA corresponds to pause sections in wave (see threshold).
Author(s)
Jerome Sueur <[email protected]> and Thierry Aubin <[email protected]>
References
Hopp, S. L., Owren, M. J. and Evans, C. S. (Eds) 1998. Animal acoustic communication. Springer,Berlin, Heidelberg.
See Also
ceps, acf
Examples
data(sheep)# fundamental frequency of a sheepres <- autoc(sheep, f=8000, threshold=5, fmin=100, fmax=700, plot=FALSE)spectro(sheep, f=8000, ovlp=75, scale=FALSE)points(res, pch=20)legend(0.5, 3.6, "Fundamental frequency", pch=20, bty=0, cex=0.7)

beep 21
beep Beep sound
Description
Generate a simple beep to be used as an alert, for instance at the end of a loop of when ending up along script.
Usage
beep(d = 0.5, f = 8000, cf = 1000)
Arguments
d duration (in s)
f sampling frequency (in Hz)
cf carrier frequency (in Hz)
Value
Nothing returned, a pure tone sound is played back. The default duration is 0.5 s and the defaultfrequency is 1000 Hz
Note
The function uses listen of seewave which calls play of tuneR. You might need to set up yoursound player with setWavPlayer of tuneR.
Author(s)
Jerome Sueur
Examples
## Not run:# default settingsbeep()# change the duration and the frequencybeep(d=1, cf=880)
## End(Not run)

22 bwfilter
bwfilter Butterworth frequency filter
Description
This function is a Butterworth frequency filter that filters out a selected frequency section of of atime wave (low-pass, high-pass, low-stop, high-stop, bandpass or bandstop frequency filter).
Usage
bwfilter(wave, f, channel = 1, n = 1, from = NULL, to = NULL,bandpass = TRUE, listen = FALSE, output = "matrix")
Arguments
wave an R object.
f sampling frequency of wave (in Hz). Does not need to be specified if embeddedin wave.
channel channel of the R object, by default left channel (1).
n Order of the filter. See details.
from start frequency (in Hz) where to apply the filter.
to end frequency (in Hz) where to apply the filter.
bandpass if TRUE a band-pass filter is applied between from and to, if not NULL a band-stopfilter is applied between from and to (by default NULL).
listen if TRUE the new sound is played back.
output character string, the class of the object to return, either "matrix", "Wave","Sample", "audioSample" or "ts".
Details
The order of the filter determines the value of the roll-off value, that is the dB decrease per octaveof the transfer function. A filter of order n will have a transfer function with a roll-off value of - n*6dB.
Value
A new wave is returned. The class of the returned object is set with the argument output.
Note
This function mainly uses the functions filter() and filtfilt() from the package signal
Author(s)
Jerome Sueur, functions filter() and filtfilt() from the package signal.

ccoh 23
References
Stoddard, P. K. (1998). Application of filters in bioacoustics. In: Hopp, S. L., Owren, M. J. andEvans, C. S. (Eds), Animal acoustic communication. Springer, Berlin, Heidelberg,pp. 105-127.
See Also
ffilter, bwfilter, preemphasis, lfs, afilter
Examples
require(signal)f <- 8000a <- noisew(f=f, d=1)## low-pass# 1st order filterres <- bwfilter(a, f=f, n=1, to=1500)# 8th order filterres <- bwfilter(a, f=f, n=8, to=1500)## high-passres <- bwfilter(a, f=f, from=2500)## band-passres <- bwfilter(a, f=f, from=1000, to=2000)## band-stopres <- bwfilter(a, f=f, from=1000, to=2000,bandpass=FALSE)
ccoh Continuous coherence function between two time waves
Description
This function returns a two-dimension coherence representation between two time waves. Thefunction corresponds to a sliding coherence function along the two signals. This produces a 2-Ddensity plot. An amplitude contour plot can be overlaid.
Usage
ccoh(wave1, wave2, f, channel = c(1,1), wl = 512, ovlp = 0, plot = TRUE,grid = TRUE, scale = TRUE, cont = FALSE,collevels = seq(0, 1, 0.01), palette = reverse.heat.colors,contlevels = seq(0, 1, 0.01), colcont = "black",colbg="white", colgrid = "black",colaxis = "black", collab="black",xlab = "Time (s)", ylab = "Frequency (kHz)",scalelab = "Coherence",main = NULL,scalefontlab = 1, scalecexlab =0.75, axisX = TRUE, axisY = TRUE,flim = NULL, flimd = NULL,...)

24 ccoh
Arguments
wave1 a first R object
wave2 a second R object
f sampling frequency of wave (in Hz). Does not need to be specified if embeddedin wave.
channel channel of the R objects, by default left channel (1) for each object.
wl window length for the analysis (even number of points, by default = 512).
ovlp overlap between two successive windows (in %).
plot logical, if TRUE plots the continuous coherence function (by default TRUE).
grid logical, if TRUE plots a y-axis grid (by default TRUE).
scale logical, if TRUE plots a dB colour scale on the right side of the plot (by defaultTRUE).
cont logical, if TRUE overplots contour lines on the plot (by default FALSE).
collevels a set of levels which are used to partition the amplitude range of the coherence(should be between 0 and 1.
palette a color palette function to be used to assign colors in the plot, see Details.
contlevels a set of levels which are used to partition the amplitude range for contour over-plot (in dB).
colcont colour for cont plotting.
colbg background colour.
colgrid colour for grid plotting.
colaxis color of the axes.
collab color of the labels.
xlab label of the time axis.
ylab label of the frequency axis.
scalelab label fo the amplitude scale.
main label of the main title.
scalefontlab font of the amplitude scale label.
scalecexlab cex of the amplitude scale label.
axisX logical, if TRUE plots time X-axis (by default TRUE).
axisY logical, if TRUE plots frequency Y-axis (by default TRUE).
flim modifications of the frequency Y-axis limits.
flimd dynamic modifications of the frequency Y-axis limits. New wl and ovlp argu-ments are applied to increase time/frequency resolution.
... other contour and oscillo graphical parameters.

ccoh 25
Details
Coherence is a frequency domain function computed to show the degree of a relationship betweentwo signals. The value of the coherence function ranges between zero and one, where a value ofzero indicates there is no causal relationship between the signals. A value of one indicates the ex-istence of linear frequency response between the two signals. This can be used, for instance, tocompare the input and output signals of a system.Any colour palette can be used. In particular, it is possible to use other palettes coming withseewave: temp.colors, reverse.gray.colors.1, reverse.gray.colors.2, spectro.colors,reverse.terrain.colors, reverse.topo.colors, reverse.cm.colors corresponding to the re-verse of terrain.colors, topo.colors, cm.colors.Use locator to identify points.
Value
This function returns a list of three items:
time a numeric vector corresponding to the time axis.
freq a numeric vector corresponding to the frequency axis.
amp a numeric matrix corresponding to the coherence. Each column corresponds toa coherence function of length wl.
Note
This function is based on spec.pgram, contour and filled.contour. See spectro for graphicalchanges.
Author(s)
Jerome Sueur <[email protected]> but this function is mainly based on spec.pgram by Martyn Plum-mer, Adrian Trapletti and B.D. Ripley
See Also
coh, spectro, spec.pgram.
Examples
wave1<-synth(d=1,f=4000,cf=500)wave2<-synth(d=1,f=4000,cf=800)ccoh(wave1,wave2,f=4000)

26 ceps
ceps Cepstrum or real cepstrum
Description
This function returns the cepstrum of a time wave allowing fundamental frequency detection.
Usage
ceps(wave, f, channel = 1, phase = FALSE, wl = 512, at = NULL, from = NULL, to = NULL,tidentify = FALSE, fidentify = FALSE, col = "black", cex = 1, plot = TRUE,qlab = "Quefrency (bottom: s, up: Hz)", alab = "Amplitude",qlim = NULL, alim = NULL, type = "l", ...)
Arguments
wave an R object.
f sampling frequency of wave (in Hz). Does not need to be specified if embeddedin wave.
channel channel of the R object, by default left channel (1).
phase if TRUE than the phase is taken into account in the computation of the cepstrum.
wl if at is not null, length of the window for the analysis (even number of points,by defaults = 512).
at position where to compute the cepstrum (in s).
from start position where to compute the cepstrum (in s).
to end position to compute the cepstrum (in s).
tidentify to identify time values on the plot with the help of a cursor.
fidentify to identify frequency values on the plot with the help of a cursor.
col colour of the cepstrum.
cex pitch size of the cepstrum.
plot logical, if TRUE plots the cepstrum.
qlab title of the quefrency axis (in s).
alab title of the amplitude axis.
qlim range of quefrency axis.
alim range of amplitude axis.
type if plot is TRUE, type of plot that should be drawn. See plot for details (bydefault "l" for lines).
... other plot graphical parameters.

ceps 27
Details
The cepstrum of a time wave is the inverse Fourier transform of the logarithm of the Fourier trans-form. The cepstrum of a wave s is then calculated as follows:
C(s) = Re[FFT−1(log (|FFT (s)|)]
The independent variable of a cepstral graph is called the quefrency. The quefrency is a measure oftime, though not in the sense of a signal in the time domain. A correspondence with the frequencydomain is obtained by simply computing the reverse of the temporal x coordinate. For instance if apeak appears at 0.005 s, this reveals a frequency peak at 200 Hz (=1/0.005). This explain the twoscales plotted when plot is TRUE.If at, from or to are FALSE then ceps computes the cepstrum of the whole signal.When using tidentify or tidentify, press ‘stop’ tools bar button to return values in the console.
Value
When plot is FALSE, ceps returns the cesptral profile as a two-column matrix, the first columncorresponding to quefrency (x-axis) and the second corresponding to amplitude (y-axis).
Warning
The argument peaks is no more available (version > 1.5.6). See the function fpeaks for peak(s)detection.
Note
Cepstral analysis is mainly used in speech processing. This analysis allows to extract the funda-mental frequency, see the examples.This function is based on fft.
Author(s)
Jerome Sueur <[email protected]>
References
Oppenheim, A.V. and Schafer, R.W. 2004. From frequency to quefrency: a history of the cepstrum.Signal Processing Magazine IEEE, 21: 95-106.
See Also
cepstro, fund, autoc

28 cepstro
Examples
data(sheep)par(mfrow=c(2,1))# phase not taken into accountceps(sheep,f=8000,at=0.4,wl=1024)# phase taken into accountceps(sheep,f=8000,at=0.4,wl=1024, phase=TRUE)
cepstro 2D-cepstrogram of a time wave
Description
This function returns a two-dimension cepstrographic representation of a time wave. The functioncorresponds to a short-term cepstral transform. An amplitude contour plot can be overlaid.
Usage
cepstro(wave, f, channel = 1, wl = 512, ovlp = 0, plot = TRUE, grid = TRUE,scale = TRUE, cont = FALSE, collevels = seq(0, 1, 0.01),palette = reverse.heat.colors, contlevels = seq(0, 1, 0.01),colcont = "black", colbg="white", colgrid = "black",colaxis = "black", collab = "black",xlab = "Time (s)", ylab = "Quefrency (ms)",scalelab = "Amplitude", main = NULL, scalefontlab = 1, scalecexlab = 0.75,axisX = TRUE, axisY = TRUE, tlim = NULL, qlim = NULL, ...)
Arguments
wave an R object.
f sampling frequency of wave (in Hz). Does not need to be specified if embeddedin wave.
channel channel of the R object, by default left channel (1).
wl if at is not null, length of the window for the analysis (even number of points,by defaults = 512).
ovlp overlap between two successive windows (in %).
plot logical, if TRUE plots the cepstrogram (by default TRUE).
grid logical, if TRUE plots a y-axis grid (by default TRUE).
scale logical, if TRUE plots a dB colour scale on the right side of the cesptrogram (bydefault TRUE).
cont logical, if TRUE overplots contour lines on the cepstrogram (by default FALSE).
collevels a set of levels which are used to partition the amplitude range of the cepstrogram(in dB).
palette a color palette function to be used to assign colors in the plot.

cepstro 29
contlevels a set of levels which are used to partition the amplitude range for contour over-plot (in dB).
colcont colour for cont plotting.
colbg background colour.
colgrid colour for grid plotting.
colaxis color of the axes.
collab color of the labels.
xlab label of the time axis.
ylab label of the quefrency axis.
main label of the main title.
scalelab amplitude scale label.
scalefontlab font of the amplitude scale label.
scalecexlab cex of the amplitude scale label.
axisX if TRUE plots time X-axis (by default TRUE).
axisY if TRUE plots frequency Y-axis (by default TRUE).
tlim modifications of the time X-axis limits.
qlim modifications of the quefrency Y-axis limits (in ms).
... other contour graphical parameters.
Details
It is unfortunately not possible to turn the y-axis to a frequency scale.See spectro for the use of the graphical arguments.
Value
This function returns a list of three items:
time a numeric vector corresponding to the time axis.
freq a numeric vector corresponding to the quefrency axis.
amp a numeric matrix corresponding to the the successive cepstral profiles computedalong time.
Note
This function is based on ceps.
Author(s)
Jerome Sueur <[email protected]>.
References
Oppenheim, A.V. and Schafer, R.W. 2004. From frequency to quefrency: a history of the cepstrum.Signal Processing Magazine IEEE, 21: 95-106.

30 coh
See Also
ceps, fund, autoc
Examples
data(sheep)sheepc <- cutw(sheep, f=8000, from = 0.19, to = 2.3)cepstro(sheepc,f=8000)
coh Coherence between two time waves
Description
This function returns the frequency coherence between two time waves.
Usage
coh(wave1, wave2, f, channel=c(1,1), plot =TRUE, xlab = "Frequency (kHz)",ylab = "Coherence", xlim = c(0,f/2000), type = "l",...)
Arguments
wave1 a first R object.
wave2 a second R object.
f sampling frequency of wave (in Hz). Does not need to be specified if embeddedin wave.
channel channel of the R objects, by default left channel (1) for each object.
plot logical, if TRUE plots the continuous coherence function (by default TRUE).
xlab title of the frequency X-axis.
ylab title of the coherence Y-axis.
xlim range of frequency X-axis.
type if plot is TRUE, type of plot that should be drawn. See plot for details (bydefault "l" for lines).
... other plot graphical parameters.
Details
Coherence is a frequency domain function computed to show the degree of a relationship betweentwo signals. The value of the coherence function ranges between zero and one, where a value ofzero indicates there is no causal relationship between the signals. A value of one indicates theexistence of linear frequency response between the two signals. This can be used, for instance, tocompare the input and output signals of a system.

combfilter 31
Value
When plot is FALSE, this coh returns a two-column matrix, the first column being the frequencyaxis in kHz (x-axis) and the second column being the coherence (y-axis).
Note
This function is based on spec.pgram.
Author(s)
Jerome Sueur <[email protected]> but this function is based on spec.pgram by Martyn Plummer,Adrian Trapletti and B.D. Ripley.
See Also
ccoh, spectro, spec.pgram.
Examples
wave1<-synth(d=1,f=4000,cf=500)wave2<-synth(d=1,f=4000,cf=800)coh(wave1,wave2,f=4000)
combfilter Comb filter
Description
This function processes a feedforward comb filter and plots a spectrogram of the filtered wave asso-ciated with the frequency response of the filter.
Usage
combfilter(wave, f, channel = 1, alpha, K, units = c("samples", "seconds"),plot = FALSE, output = "matrix", ...)
Arguments
wave an R object
f sampling frequency (in Hz). Does not need to be specified if embedded in wave.
channel channel of the R object, by default left channel (1).
alpha a numeric vector of length 1 for the scaling factor. See Details.
K a numeric vector of lenght 1 for the delay length, in units. See Details.
units units in which K is given, the default is 'samples' but can be set to 'seconds'.
plot a logical, if TRUE plots the spectrogram of the filtered wave and the frequencyresponse of the comb filter.

32 combfilter
output character string, the class of the object to return, either 'matrix', 'Wave','Sample', 'audioSample' or 'ts'.
... other arguments to be passed to spectro except scale and osc that are set bydefault to FALSE.
Details
A comb filter consists in adding a delayed version of a signal to itself resulting in constructive anddestructive interference. The feedforward version of a comb filter can be written following:
y(n) = x(n) + α× x(n−K)
where alpha is the scaling factor and K the delay length. The frequency response of the filter isobtained with:
H(f) =√
(1 + α2) + 2× cos(ωK)
The frequency response is periodic. The depth of the cycles is controlled with alpha and the numberof cycles with K.
Value
A new wave is returned. The class of the returned object is set with the argument output.
Note
Setting K to high values may generate unwanted results.The feedback form of the combfilter is not implemented yet.
Author(s)
Jerome Sueur
See Also
combfilter, fir, squarefilter, drawfilter, ffilter, bwfilter
Examples
## Not run:f <- 44100## chirps1 <- synth(f=f, cf=1, d=2, fm=c(0,0,f/2,0,0), out="Wave")combfilter(s1, alpha=1, K=50, plot=TRUE)## harmonic sounds2 <- synth(f=f, d=2, cf=600, harmonics=rep(1, 35), output="Wave")combfilter(s2, alpha=1, K=10, plot=TRUE)## noise, units in secondss3 <- noisew(d=2, f=44100, out="Wave")combfilter(s3, alpha=0.5, K=1e-4, units="seconds", plot=TRUE)
## End(Not run)

convSPL 33
convSPL Convert sound pressure level in other units
Description
This function converts sound pressure level (in dB) in sound power (Watt), intensity (Watt/m2) andpressure (Pa). By default, these conversions are applied to air-borne sound.
Usage
convSPL(x, d = 1, Iref = 10^-12, pref = 2*10^-5)
Arguments
x a numeric vector or a matrix describind SPL values (in dB).d the distance from the sound source where SPL values have been measured (in
meter) (by default = 1m)Iref reference intensity (in Watt/m2) (by default = 10^-12)pref reference pressure (in Pa) (by default = 2*10^-5)
Value
convSPL returns a list containing three components:
P data converted in sound power (in Watt).I data converted in sound intensity (in Watt/m2).p data converted in sound pressure (in Pa).
Note
Iref and pref correspond to a 1 kHz sound in air.
Author(s)
Jerome Sueur <[email protected]>
References
Hartmann, W. M. 1998 Signals, sound and sensation. New York: Springer.
See Also
moredB, dBweight, attenuation
Examples
# conversion of two SPL measurements taken at 0.5 m from the sourceconvSPL(c(80,85),d=0.5)

34 corenv
corenv Cross-correlation between two time wave envelopes
Description
This function tests the similarity between two time wave envelopes by returning their maximalcorrelation and the time shift related to it.
Usage
corenv(wave1, wave2, f, channel=c(1,1), envt="hil", msmooth = NULL, ksmooth = NULL,ssmooth = NULL, plot = TRUE, plotval = TRUE,method = "spearman", col = "black", colval = "red",cexval = 1, fontval = 1, xlab = "Time (s)",ylab = "Coefficient of correlation (r)", type = "l", pb = FALSE, ...)
Arguments
wave1 a first R object.
wave2 a second R object.
f sampling frequency of wave (in Hz). Does not need to be specified if embeddedin wave.
channel channel of the R objects, by default left channel (1) for each object.
envt the type of envelope to be used: either "abs" for absolute amplitude envelope or"hil" for Hilbert amplitude envelope. See env.
msmooth a vector of length 2 to smooth the amplitude envelope with a mean sliding win-dow. The first component is the window length (in number of points). Thesecond component is the overlap between successive windows (in %). See env.
ksmooth kernel smooth via kernel. See env.
ssmooth sum smooth. See env.
plot logical, if TRUE plots r values against frequency shift (by default TRUE).
plotval logical, if TRUE adds to the plot maximum r value and frequency offset (by de-fault TRUE).
method a character string indicating which correlation coefficient is to be computed("pearson", "spearman", or "kendall") (see cor).
col colour of r values.
colval colour of r max and frequency offset values.
cexval character size of r max and frequency offset values.
fontval font of r max and frequency offset values.
xlab title of the frequency axis.
ylab title of the r axis.

corenv 35
type if plot is TRUE, type of plot that should be drawn. See plot for details (bydefault "l" for lines).
pb if TRUE returns a text progress bar in the console.
... other plot graphical parameters.
Details
Successive correlations between the envelopes of wave1 and wave2 are computed when regularlysliding forward and backward wave2 along wave1.The maximal correlation is obtained at a particular shift (time offset). This shift may be positive ornegative.The higher smooth is set up, the faster will be the computation but less precise the results will be.The corresponding p value, obtained with cor.test, is plotted. Inverting wave1 and wave2 maygive slight different results.
Value
If plot is FALSE, corenv returns a list containing four components:
r a two-column matrix, the first colum corresponding to the time shift (frequencyx-axis) and the second column corresponding to the successive r correlation val-ues between env1 and env2 (correlation y-axis).
rmax the maximum correlation value between x and y.
p the p value corresponding to rmax.
t the time offset corresponding to rmax.
Author(s)
Jerome Sueur
See Also
env,corspec,covspectro, cor,cor.test.
Examples
## Not run:data(orni)# cross-correlation between two echemes of a cicada songwave1<-cutw(orni,f=22050,from=0.3,to=0.4,plot=FALSE)wave2<-cutw(orni,f=22050,from=0.58,to=0.68,plot=FALSE)corenv(wave1,wave2,f=22050)
## End(Not run)

36 corspec
corspec Cross-correlation between two frequency spectra
Description
This function tests the similarity between two frequency spectra by returning their maximal corre-lation and the frequency shift related to it.
Usage
corspec(spec1, spec2, f = NULL, mel = FALSE, plot = TRUE, plotval = TRUE,method = "spearman", col = "black", colval = "red",cexval = 1, fontval = 1, xlab = NULL,ylab = "Coefficient of correlation (r)", type="l",...)
Arguments
spec1 a first data set resulting of a spectral analysis obtained with spec or meanspec(not in dB). This can be either a two-column matrix (col1 = frequency, col2 =amplitude) or a vector (amplitude).
spec2 a first data set resulting of a spectral analysis obtained with spec or meanspec(not in dB). This can be either a two-column matrix (col1 = frequency, col2 =amplitude) or a vector (amplitude).
f sampling frequency of waves used to obtain spec1 and spec2 (in Hz). Notnecessary if spec1 and/or spec2 is a two columns matrix obtained with spec ormeanspec.
mel a logical, if TRUE the (htk-)mel scale is used.
plot logical, if TRUE plots r values against frequency shift (by default TRUE).
plotval logical, if TRUE adds to the plot maximum r value and frequency offset (by de-fault TRUE).
method a character string indicating which correlation coefficient is to be computed("pearson", "spearman", or "kendall") (see cor).
col colour of r values.
colval colour of r max and frequency offset values.
cexval character size of r max and frequency offset values.
fontval font of r max and frequency offset values.
xlab title of the frequency axis.
ylab title of the r axis.
type if plot is TRUE, type of plot that should be drawn. See plot for details (bydefault "l" for lines).
... other plot graphical parameters.
corspec 37
Details
It is important not to have data in dB.Successive correlations between spec1 and spec2 are computed when regularly shifting spec2towards lower or higher frequencies.The maximal correlation is obtained at a particular shift (frequency offset). This shift may bepositive or negative.The corresponding p value, obtained with cor.test, is plotted.Inverting spec1 and spec2 may give slight different results, see examples.
Value
If plot is FALSE, corspec returns a list containing four components:
r a two-column matrix, the first colum corresponding to the frequency shift (fre-quency x-axis) and the second column corresponding to the successive r corre-lation values between spec1 and spec2 (correlation y-axis).
rmax the maximum correlation value between spec1 and spec2.
p the p value corresponding to rmax.
f the frequency offset corresponding to rmax.
Author(s)
Jerome Sueur, improved by Laurent Lellouch
References
Hopp, S. L., Owren, M. J. and Evans, C. S. (Eds) 1998. Animal acoustic communication. Springer,Berlin, Heidelberg.
See Also
spec, meanspec, corspec, covspectro, cor, cor.test.
Examples
## Not run: data(tico)## compare the two first notes spectraa<-spec(tico,f=22050,wl=512,at=0.2,plot=FALSE)c<-spec(tico,f=22050,wl=512,at=1.1,plot=FALSE)op<-par(mfrow=c(2,1), mar=c(4.5,4,3,1))spec(tico,f=22050,at=0.2,col="blue")par(new=TRUE)spec(tico,f=22050,at=1.1,col="green")legend(x=8,y=0.5,c("Note A", "Note C"),lty=1,col=c("blue","green"),bty="o")par(mar=c(5,4,2,1))corspec(a,c, ylim=c(-0.25,0.8),xaxs="i",yaxs="i",las=1)par(op)## different correlation methods give different results...op<-par(mfrow=c(3,1))corspec(a,c,xaxs="i",las=1, ylim=c(-0.25,0.8))
38 covspectro
title("spearmann correlation (by default)")corspec(a,c,xaxs="i",las=1,ylim=c(0,1),method="pearson")title("pearson correlation")corspec(a,c,xaxs="i",las=1,ylim=c(-0.23,0.5),method="kendall")title("kendall correlation")par(op)## inverting x and y does not give exactly similar resultsop<-par(mfrow=c(2,1),mar=c(2,4,3,1))corspec(a,c)corspec(c,a)par(op)## mel scalerequire(tuneR)data(orni)orni.mel <- melfcc(orni, nbands = 256, dcttype = "t3", fbtype = "htkmel", spec_out=TRUE)orni.mel.mean <- apply(orni.mel$aspectrum, MARGIN=2, FUN=mean)tico.mel <- melfcc(tico, nbands = 256, dcttype = "t3", fbtype = "htkmel", spec_out=TRUE)tico.mel.mean <- apply(tico.mel$aspectrum, MARGIN=2, FUN=mean)corspec(orni.mel.mean, tico.mel.mean, f=22050, mel=TRUE, plot=TRUE)
## End(Not run)
covspectro Covariance between two spectrograms
Description
This function tests the similarity between two spectrograms by returning their maximal covarianceand the time shift related to it.
Usage
covspectro(wave1, wave2, f, channel = c(1,1), wl = 512, wn = "hanning", n,plot = TRUE, plotval = TRUE,method = "spearman", col = "black", colval = "red", cexval = 1,fontval = 1, xlab = "Time (s)",ylab = "Normalised covariance (cov)", type = "l", pb = FALSE, ...)
Arguments
wave1 a first R object.
wave2 a second R object.
f sampling frequency of wave (in Hz). Does not need to be specified if embeddedin wave.
channel channel of the R objects, by default left channel (1) for each object.
wl length of the window for the analysis (even number of points, by default = 512).
wn window name, see ftwindow (by default "hanning").

covspectro 39
n number of covariances computed between wave1 and wave2 when sliding wave2along wave1.
plot logical, if TRUE plots r values against frequency shift (by default TRUE).
plotval logical, if TRUE adds to the plot maximum R value and frequency offset (bydefault TRUE).
method a character string indicating which correlation coefficient is to be computed("pearson", "spearman", or "kendall") (see cor).
col colour of r values.
colval colour of r max and frequency offset values.
cexval character size of r max and frequency offset values.
fontval font of r max and frequency offset values.
xlab title of the frequency axis.
ylab title of the r axis.
type if plot is TRUE, type of plot that should be drawn. See plot for details (bydefault "l" for lines).
pb if TRUE returns a text progress bar in the console.
... other plot graphical parameters.
Details
Successive covariances between the spectrogram of wave1 and the spectrogram of wave2 are com-puted when regularly sliding forward and backward wave2 along wave1.The maximal covariance is obtained at a particular shift (time offset). This shift may be positive ornegative.n sets in how many steps wave2 will be slided along wave1. Time process can be then decreased bysetting low n value.Inverting wave1 and wave2 may give slight different results.
Value
If plot is FALSE, covspectro returns a list containing three components:
cov the successive covariance values between wave1 and wave2.
covmax the maximum covariance between wave1 and wave2.
t the time offset corresponding to cov.
Author(s)
Jerome Sueur <[email protected]>
References
Hopp, S. L., Owren, M. J. and Evans, C. S. (Eds) 1998. Animal acoustic communication. Springer,Berlin, Heidelberg.

40 crest
See Also
corspec, corenv, spectro, cor,
Examples
# covariance between two notes of a birdsong## Not run:data(tico)note1<-cutw(tico, f=22050, from=0.5, to=0.9)note2<-cutw(tico, f=22050, from=0.9, to=1.3)covspectro(note1,note2,f=22050,n=37)
## End(Not run)
crest Crest factor and visualization
Description
This function returns the crest factor and localizes the different crest(s).
Usage
crest(wave, f, channel = 1, plot = FALSE, col = 2, cex = 3, symbol = "*", ...)
Arguments
wave an R object.
f sampling frequency of wave (in Hz). Does not need to be specified if embeddedin wave.
channel channel of the R object, by default left channel (1).
plot if TRUE plots the oscillogram of wave and indicates the location of the crest(s)
col color of the symbol indicating the localisation of the crest(s)
cex symbol magnification
symbol symbol indicating the localisation of the crest(s)
... other
Details
The crest factor of a time series s is calculated according to:
C =max(s)
rms(s)
with rms the root-mean-square (see rms).

csh 41
Value
The function returns a list of three items
C crest factor
val value of the crest(s)
loc location of the crest(s)
Note
There might be several crests (maxima) along the time wave but there is a single crest factor.
Author(s)
Jerome Sueur <[email protected]>
References
Hartmann, W. M. 1998 Signals, sound and sensation. New York: Springer.
See Also
oscillo, rms
Examples
data(tico)crest(tico, f=22050)# see the crest location and change the default graphical parameterscrest(tico, f=22050, plot=TRUE, sym="-")
csh Continuous spectral entropy
Description
This function computes the continuous spectral entropy (H) of a time wave.
Usage
csh(wave, f, channel = 1, wl = 512, wn = "hanning", ovlp = 0,fftw = FALSE, threshold = NULL,plot = TRUE, xlab = "Times (s)", ylab = "Spectral Entropy",ylim = c(0, 1.1), type = "l", ...)

42 csh
Arguments
wave an R object.
f sampling frequency of wave (in Hz). Does not need to be specified if embeddedin wave.
channel channel of the R object, by default left channel (1).
wl if at is not null, length of the window for the analysis (even number of points,by default = 512).
wn window name, see ftwindow (by default "hanning").
ovlp overlap between two successive windows (in %).
fftw if TRUE calls the function FFT of the library fftw. See Notes of the spectro.
threshold amplitude threshold for signal detection (in %).
plot logical, if TRUE plots the spectral entropy against time (by default TRUE).
xlab title of the x axis.
ylab title of the y axis.
ylim the range of y values.
type if plot is TRUE, type of plot that should be drawn. See plot for details (bydefault "l" for lines).
... other plot graphical parameters.
Details
See sh for computing method.
Value
When plot is FALSE, csh returns a two-column matrix, the first column being time in seconds (x-axis) and the second column being the spectral entropy (y-axis) computed along time.NA corresponds to pause sections in wave (see threshold).
Note
The spectral entropy of a noisy signal will tend towards 1 whereas the spectral entropy of a puretone signal will tend towards 0.
Author(s)
Jerome Sueur <[email protected]>
References
Toh, A. M., Togneri, R. & Nordholm, S. 2005 Spectral entropy as speech features for speech recog-nition. Proceedings of PEECS, pp. 60-65.
See Also
sh, th

cutspec 43
Examples
data(orni)csh(orni,f=22050,wl=512,ovlp=50)# using the threshold argument can lead to some edge effets# here sh=1 at the end of echemescsh(orni,f=22050,wl=512,ovlp=50,threshold=5)
cutspec Cut a frequency spectrum
Description
This function can be used to select (cut) a specific part of a frequency spectrum.
Usage
cutspec(spec, f = NULL, flim, mel = FALSE, norm = FALSE, PMF = FALSE)
Arguments
spec a vector or a two-column matrix set resulting of a spectral analysis. This can bethe value obtained with spec or meanspec.
f sampling frequency of spec (in Hz).
flim a vector of length 2 to specify the new frequency range (in kHz).
mel a logical, if TRUE the (htk-)mel scale is used.
norm a logical, if TRUE the spectrum returned is normalised between 0 and 1.
PMF a logical, if TRUE the spectrum returned is a probability mass function.
Value
A new spectrum is returned. The class of the returned object is the one of the input object (spec)
Note
The sampling frequency f is not necessary if spec has been obtained with either spec or meanspec.This function can be used before calling analysis function like sh or sfm. See examples.
Author(s)
Jerome Sueur, improved by Laurent Lellouch
See Also
spec, meanspec

44 cutw
Examples
data(orni)a <- meanspec(orni,f=22050,plot=FALSE)b <- cutspec(a,flim=c(4,8))## quick check with a plotplot(b,type="l")## effects on spectral entropysfm(a)sfm(b)## mel scalerequire(tuneR)mel <- melfcc(orni, nbands = 256, dcttype = "t3", fbtype = "htkmel", spec_out=TRUE)melspec.mean <- apply(mel$aspectrum, MARGIN=2, FUN=mean)c <- cutspec(melspec.mean, f=22050, flim=c(4000,8000), mel=TRUE)
cutw Cut a section of a time wave
Description
This function selects and cuts a section of data describing a time wave. Original and cut sectionscan be plotted as oscillograms for comparison.
Usage
cutw(wave, f, channel=1, from = NULL, to = NULL, choose = FALSE,plot = FALSE, marks = TRUE, output="matrix", ...)
Arguments
wave an R object.
f sampling frequency of wave (in Hz). Does not need to be specified if embeddedin wave.
channel channel of the R object, by default left channel (1).
from start mark (in s).
to end mark (in s).
choose logical, if TRUE start (=from) and end (=to) points can be graphically chosenwith a cursor on the oscillogram.
plot logical, if TRUE returns an oscillographic plot of original and cut sections (bydefault FALSE).
marks logical, if TRUE shows the start and end mark on the plot (by default TRUE).
output character string, the class of the object to return, either "matrix", "Wave","Sample", "audioSample" or "ts".
... other oscillo graphical parameters.

dBscale 45
Details
If plot is TRUE returns a two-frame plot with both original and cut sections.
Value
If plot is FALSE, a new wave is returned. The class of the returned object is set with the argumentoutput.
Author(s)
Jerome Sueur
See Also
oscillo, addsilw,deletew, fadew,mutew,pastew,revw, zapsilw
Examples
# a 0.4 s section in a bird songdata(tico)a<-cutw(tico,f=22050,from=0.5,to=0.9)oscillo(a,22050)# a direct way to see what has been cutcutw(tico,f=22050,from=0.5,to=0.9,plot=TRUE)
dBscale dB colour scale for a spectrogram display
Description
This function displays a vertical or horizontal dB colour scale to be used with spectro plots.
Usage
dBscale(collevels, palette = spectro.colors, side = 4,textlab = "Amplitude\n(dB)", cexlab = 0.75,fontlab = 1, collab = "black", colaxis = "black",...)
Arguments
collevels a set of levels which are used to partition the amplitude range of the spectrogram(in dB).
palette a color palette function to be used to assign colors in the plot, see note.
side side of the axis.
textlab text of the label.
cexlab character size of the label.

46 dBscale
fontlab font of the label.
collab colour of the label.
colaxis colour of the axis.
... other axis arguments.
Note
This function, based on filled.contour by Ross Ihaka, is not supposed to be used by itself but asa legend of spectro.Any colour palette can be used. In particular, it is possible to use other palettes coming withseewave: rev.gray.colors.1, rev.gray.colors.2, rev.heat.colors, rev.terrain.colors,rev.topo.colors, rev.cm.colors corresponding to the reverse of heat.colors, terrain.colors,topo.colors, cm.colors.
Author(s)
Jerome Sueur <[email protected]> and Caroline Simonis <[email protected]>.
See Also
spectro.
Examples
data(pellucens)# place the scale on the left and not on the right as spectro() doesdef.par <- par(no.readonly = TRUE)layout(matrix(c(1, 2), nc = 2), widths = c(1, 5))par(mar=c(5,3,4,2))dBscale(collevels=seq(-30,0,1),side=2)par(mar=c(5,4,4,2))spectro(pellucens, f=22050,wl=512,scale=FALSE)par(def.par)# place the scale on the top and not on the right as spectro() doesdef.par <- par(no.readonly = TRUE)layout(matrix(c(0,1,2,2), nc = 2, byrow=TRUE),widths=c(1,2),heights=(c(1,5.5)))par(mar=c(0.5,3,4,2))dBscale(collevels=seq(-30,0,1), textlab = "",side=3)mtext("Amplitude (dB)",side=2,line = 1,at=0.6,cex=0.75)par(mar=c(5,4,0.5,2))spectro(pellucens, f=22050,wl=512,scale=FALSE)par(def.par)

dBweight 47
dBweight dB weightings
Description
This function returns the four most common dB weightings.
Usage
dBweight(f, dBref = NULL)
Arguments
f frequency (in Hz).
dBref dB reference level (by default NULL).
Details
By default, the function returns four weightings. When dBref is not NULL then the function returnsthe conversion from a dB reference level to four dB weighting levels.
Value
dBweight returns a list of five items corresponding to five dB weightings.
A dB (A)
B dB (B)
C dB (C)
D dB (D)
ITU dB ITU-R 468
Note
The transfer equations used here come from Wipipedia but they were originally coming from the ap-pendix of an international standard on the design performance of sound level meters IEC 651:1979(Neil Glenister, pers. com.).
Author(s)
Jerome Sueur <[email protected]>, Zev Ross, and Andrey Anikin
References
https://en.wikipedia.org/wiki/A-weighting, https://en.wikipedia.org/wiki/ITU-R_468_noise_weighting

48 deletew
See Also
convSPL, moredB
Examples
# weight for a 50 Hz frequencydBweight(f=50)# A weight for the 1/3 Octave centre frequencies.dBweight(f=c(20,25,31.5,40,50,63,80,100,125,160,200,250,315,400,500,630,800,1000,1500,1600,2000,2500,3150,4000,5000,6300,8000,10000,12500,16000,20000))$A# correction for a 50 Hz sound emitted at 100 dBdBweight(f=50, dB=100)# weighting curves plotf <- seq(10,20000,by=10)par(las=1)plot(f, dBweight(f)$A, type="n", log="x",xlim=c(10,10^5),ylim=c(-80,20),xlab="",ylab="",xaxt="n",yaxt="n")abline(v=c(seq(10,100,by=10),seq(100,1000,by=100),seq(1000,10000,by=1000),seq(10000,100000,by=10000),c(100,1000,10000,100000)),col="lightgrey",lty=2)abline(v=c(100,1000,10000,100000),col="grey")abline(h=seq(-80, 20, 20),col="grey")par(new=TRUE)plot(f, dBweight(f)$A, type="l", log="x",xlab="Frequency (Hz)", ylab="dB",lwd=2, col="blue", xlim=c(10,10^5),ylim=c(-80,20))title(main="Acoustic weighting curves (10 Hz - 20 kHz)")lines(x=f, y=dBweight(f)$B, col="green",lwd=2)lines(x=f, y=dBweight(f)$C, col="red",lwd=2)lines(x=f, y=dBweight(f)$D, col="black",lwd=2)legend("bottomright",legend=c("dB(A)","dB(B)","dB(C)","dB(D)"),lwd=2,col=c("blue","green","red","black"),bty="o",bg="white")
deletew Delete a section of a time wave
Description
This function selects and delete a section of data describing a time wave. Original section andsection after deletion can be plotted as oscillograms for comparison.
Usage
deletew(wave, f, channel = 1, from = NULL, to = NULL, choose = FALSE, plot = FALSE,marks = TRUE, output = "matrix", ...)

deletew 49
Arguments
wave an R object.
f sampling frequency of wave (in Hz). Does not need to be specified if embeddedin wave.
channel channel of the R object, by default left channel (1).
from start position (in s).
to end position (in s).
choose logical, if TRUE start (=from) and end (=to) points can be graphically chosenwith a cursor on the oscillogram.
plot logical, if TRUE returns an oscillographic plot of original and cut sections (bydefault FALSE).
marks logical, if TRUE shows the start and end mark on the plot (by default TRUE).
output character string, the class of the object to return, either "matrix", "Wave", "Sam-ple", "audioSample" or "ts".
... other oscillo graphical parameters.
Details
If plot is TRUE returns a two-frame plot with both original and resulting sections.
Value
If plot is FALSE, a new wave is returned. The class of the returned object is set with the argumentoutput.
Author(s)
Jerome Sueur <[email protected]>
See Also
oscillo, addsilw,cutw, fadew, mutew, pastew, revw, zapsilw
Examples
# deletion a 0.4 s section in a bird songdata(tico)a<-deletew(tico,f=22050,from=0.5,to=0.9)oscillo(a,22050)# a direct way to see what has been cutdeletew(tico,f=22050,from=0.5,to=0.9,plot=TRUE)

50 dfreq
dfreq Dominant frequency of a time wave
Description
This function gives the dominant frequency (i. e. the frequency of highest amplitude) of a timewave.
Usage
dfreq(wave, f, channel = 1, wl = 512, wn = "hanning", ovlp = 0, fftw= FALSE, at =NULL, tlim = NULL, threshold = NULL, bandpass = NULL, clip = NULL,plot = TRUE, xlab = "Times (s)", ylab = "Frequency (kHz)",ylim = c(0, f/2000), ...)
Arguments
wave an R object.f sampling frequency of wave (in Hz). Does not need to be specified if embedded
in wave.channel channel of the R object, by default left channel (1).wl length of the window for the analysis (even number of points, by default = 512).wn window name, see ftwindow (by default "hanning").ovlp overlap between two successive analysis windows (in % ).fftw if TRUE calls the function FFT of the library fftw. See Notes of the spectro.at time position where the dominant frequency has to be computed (in s.).tlim modifications of the time X-axis limits.threshold amplitude threshold for signal detection (in % ).bandpass a numeric vector of length two, giving the lower and upper limits of a frequency
bandpass filter (in Hz).clip a numeric value to select dominant frequency values according to their ampli-
tude in reference to a maximal value of 1 for the whole signal (has to be >0 & <1).
plot logical, if TRUE plots the dominant frequency against time (by default TRUE).xlab title of the x axis.ylab title of the y axis.ylim the range of y values.... other plot graphical parameters.
Value
When plot is FALSE, dfreq returns a two-column matrix, the first column corresponding to time inseconds (x-axis) and the second column corresponding to to dominant frequency in kHz (y-axis).NA corresponds to pause sections in wave (see threshold).

diffcumspec 51
Note
This function is based on fft.
Author(s)
Jerome Sueur <[email protected]>
See Also
spec, meanspec,spectro.
Examples
data(tico)f <- 22050# defaultdfreq(tico,f)# using the amplitude threshold and changing the graphical outputdfreq(tico, f, ovlp=50,threshold=5, type="l", col=2)# using 'at' argument for specific positions along the time axisdfreq(tico, f, at=c(0.25, 0.75, 1.2, 1.6))dfreq(tico, f, at=seq(0.5, 1.4, by=0.005), threshold=5)# a specific number of measures on a single notedfreq(tico, f, at=seq(0.5, 0.9, len=100), threshold=5, xlim=c(0.5,0.9))# overlap on spectrogram# and use of 'clip' argument to better track the dominant frequency# in noisy conditionsop <- par()ticon <- tico@left/max(tico@left) + noisew(d=length(tico@left)/f, f)spectro(ticon, f)res <- dfreq(ticon, f, clip=0.3, plot=FALSE)points(res, col=2, pch =13)par(op)
diffcumspec Difference between two cumulative frequency spectra
Description
This function compares two distributions (e.g. two frequency spectra) by computing the differencebetween two cumulative frequency spectra
Usage
diffcumspec(spec1, spec2, f = NULL, mel = FALSE,plot = FALSE, type = "l", lty = c(1, 2), col = c(2, 4, 8),flab = NULL, alab = "Cumulated amplitude",flim = NULL, alim = NULL,title = TRUE, legend = TRUE, ...)

52 diffcumspec
Arguments
spec1 any distribution, especially a spectrum obtained with spec or meanspec (not indB). This can be either a two-column matrix (col1 = frequency, col2 = ampli-tude) or a vector (amplitude).
spec2 any distribution, especially a spectrum obtained with spec or meanspec (not indB). This can be either a two-column matrix (col1 = frequency, col2 = ampli-tude) or a vector (amplitude).
f sampling frequency of waves used to obtain spec1 and spec2 (in Hz). Notnecessary if spec1 and/or spec2 is a two columns matrix obtained with spec ormeanspec.
mel a logical, if TRUE the (htk-)mel scale is used.
plot logical, if TRUE plots both cumulative spectra and their distance.
type if plot is TRUE, type of plot that should be drawn. See plot for details (bydefault "l" for lines).
col a vector of length 3 for the colour of spec1, spec2, and the difference betweeneach of them.
lty a vector of length 2 for the line type of spec1 and spec2 if type="l".
flab title of the frequency axis.
alab title of the amplitude axis.
flim the range of frequency values.
alim range of amplitude axis.
title logical, if TRUE, adds a title with D and F values.
legend logical, if TRUE adds a legend to the plot.
... other plot graphical parameters.
Details
Both spectra are transformed into cumulative distribution functions (CDF).Spectral difference is then computed according to:
Dcf (x, y) =
∑ni=1 |Xi − Yi|
n,withwithXandY thespectrumCDFs, andD ∈ [0, 1].
Value
A numeric vector of length 1 returning the difference between the two spectra. No unit.
Note
This metric is sensitive not only to the spectral overlap between but also to the mean frequentialdistance between the different frequency peaks.
Author(s)
Laurent Lellouch, Jerome Sueur

diffenv 53
References
Lellouch L, Pavoine S, Jiguet F, Glotin H, Sueur J (2014) Monitoring temporal change of birdcommunities with dissimilarity acoustic indices. Methods in Ecology and Evolution, in press.
See Also
kl.dist, ks.dist, simspec, diffspec, logspec.dist, itakura.dist
Examples
## Hz scaledata(tico)data(orni)orni.hz <- meanspec(orni, plot=FALSE)tico.hz <- meanspec(tico, plot=FALSE)diffcumspec(orni.hz, tico.hz, plot=TRUE)## mel scalerequire(tuneR)orni.mel <- melfcc(orni, nbands = 256, dcttype = "t3", fbtype = "htkmel", spec_out=TRUE)orni.mel.mean <- apply(orni.mel$aspectrum, MARGIN=2, FUN=mean)tico.mel <- melfcc(tico, nbands = 256, dcttype = "t3", fbtype = "htkmel", spec_out=TRUE)tico.mel.mean <- apply(tico.mel$aspectrum, MARGIN=2, FUN=mean)diffcumspec(orni.mel.mean, tico.mel.mean, f=22050, mel=TRUE, plot=TRUE)
diffenv Difference between two amplitude envelopes
Description
This function estimates the surface difference between two amplitude envelopes.
Usage
diffenv(wave1, wave2, f, channel = c(1,1), envt = "hil", msmooth = NULL, ksmooth = NULL,plot = FALSE, lty1 = 1, lty2 = 2, col1 = 2, col2 = 4, cold = 8,xlab = "Time (s)", ylab = "Amplitude", ylim = NULL, legend = TRUE, ...)
Arguments
wave1 a first R object.
wave2 a second R object.
f sampling frequency of wave (in Hz). Does not need to be specified if embeddedin wave.
channel channel of the R objects, by default left channel (1) for each object.
envt the type of envelope to be used: either "abs" for absolute amplitude envelope or"hil" for Hilbert amplitude envelope. See env.

54 diffenv
msmooth a vector of length 2 to smooth the amplitude envelope with a mean sliding win-dow. The first component is the window length (in number of points). Thesecond component is the overlap between successive windows (in %). See env.
ksmooth kernel smooth via kernel. See env.
plot logical, if TRUE plots both envelopes and their surface difference (by defaultFALSE).
lty1 line type of the first envelope (envelope of wave1).
lty2 line type of the second envelope (envelope of wave2).
col1 colour of the first envelope (envelope of wave1).
col2 colour of the second envelope (envelope of wave2).
cold colour of the surface difference.
xlab title of the time axis.
ylab title of the amplitude axis.
ylim range of amplitude axis.
legend logical, if TRUE adds a legend to the plot.
... other plot graphical parameters.
Details
D is a Manhattan distance (l1 norm).Envelopes of both waves are first transformed as probability mass functions (PMF).Envelope difference is then computed according to:
D =
∑|env1− env2|
2, withD ∈ [0, 1].
Value
The difference is returned. This value is without unit. When plot is TRUE, both envelopes and theirdifference surface are plotted on the same graph.
Note
This method can be used as a relative distance estimation between different envelopes.
Author(s)
Jerome Sueur <[email protected]>.
References
Sueur, J., Pavoine, S., Hamerlynck, O. & Duvail, S. (2008) - Rapid acoustic survey for biodiversityappraisal. PLoS ONE, 3(12): e4065.
See Also
env, corenv, diffspec, diffwave

diffspec 55
Examples
data(tico) ; tico <- tico@leftdata(orni) ; orni <- orni@left# selection in tico of two waves with similar durationtico2<-tico[1:length(orni)]diffenv(tico2,orni,f=22050,plot=TRUE)# smoothing the envelope gives a better graph but slightly changes the resultdiffenv(tico2,orni,f=22050,msmooth=c(20,0),plot=TRUE)
diffspec Difference between two frequency spectra
Description
This function estimates the surface difference between two frequency spectra.
Usage
diffspec(spec1, spec2, f = NULL, mel = FALSE,plot = FALSE, type="l",lty=c(1, 2), col =c(2, 4, 8),flab = NULL, alab = "Amplitude",flim = NULL, alim = NULL, title = TRUE, legend = TRUE, ...)
Arguments
spec1 a first data set resulting of a spectral analysis obtained with spec or meanspec(not in dB). This can be either a two-column matrix (col1 = frequency, col2 =amplitude) or a vector (amplitude).
spec2 a first data set resulting of a spectral analysis obtained with spec or meanspec(not in dB). This can be either a two-column matrix (col1 = frequency, col2 =amplitude) or a vector (amplitude).
f sampling frequency of waves used to obtain spec1 and spec2 (in Hz). Notnecessary if spec1 and/or spec2 is a two-column matrix obtained with spec ormeanspec.
mel a logical, if TRUE the (htk-)mel scale is used.
plot logical, if TRUE plots both spectra and their surface difference (by default FALSE).
type if plot is TRUE, type of plot that should be drawn. See plot for details (bydefault "l" for lines).
lty a vector of length 2 for the line type of spec1 and spec2 if type="l".
col a vector of length 3 for the colour of spec1, spec2, and the surface differencebetween each of them.
flab title of the frequency axis.
alab title of the amplitude axis.

56 diffspec
flim the range of frequency values.
alim range of amplitude axis.
title logical, if TRUE, adds a title with D value.
legend logical, if TRUE adds a legend to the plot.
... other plot graphical parameters.
Details
D is a Manhattan distance (l1 norm).Both spectra are first transformed as probability mass functions (PMF).Spectral difference is then computed according to:
D =
∑|spec1− spec2|
2, withD ∈ [0, 1].
, with 0 < D < 1.
Value
The difference is returned. This value is without unit. When plot is TRUE, both spectra and theirdifference surface are plotted on the same graph.
Note
This method can be used as a relative distance estimation between different spectra.The dB value obtained can be very different from the one visually estimated when looking at thegraph (plot=TRUE).
Author(s)
Jerome Sueur, Sandrine Pavoine and Laurent Lellouch
References
Sueur, J., Pavoine, S., Hamerlynck, O. and Duvail, S. (2008). Rapid acoustic survey for biodiversityappraisal. PLoS One, 3(12): e4065.
See Also
spec, meanspec, corspec, simspec, diffcumspec, diffenv, kl.dist, ks.dist, logspec.dist,itakura.dist
Examples
a <- noisew(f=8000,d=1)b <- synth(f=8000,d=1,cf=2000)c <- synth(f=8000,d=1,cf=1000)d <- noisew(f=8000,d=1)speca <- spec(a,f=8000,wl=512,at=0.5,plot=FALSE)specb <- spec(b,f=8000,wl=512,at=0.5,plot=FALSE)

diffwave 57
specc <- spec(c,f=8000,wl=512,at=0.5,plot=FALSE)specd <- spec(d,f=8000,wl=512,at=0.5,plot=FALSE)diffspec(speca,speca,f=8000)#[1] 0 => similar spectra of course !diffspec(speca,specb)diffspec(speca,specc,plot=TRUE)diffspec(specb,specc,plot=TRUE)diffspec(speca,specd,plot=TRUE)## mel scalerequire(tuneR)data(orni)data(tico)orni.mel <- melfcc(orni, nbands = 256, dcttype = "t3", fbtype = "htkmel", spec_out=TRUE)orni.mel.mean <- apply(orni.mel$aspectrum, MARGIN=2, FUN=mean)tico.mel <- melfcc(tico, nbands = 256, dcttype = "t3", fbtype = "htkmel", spec_out=TRUE)tico.mel.mean <- apply(tico.mel$aspectrum, MARGIN=2, FUN=mean)diffspec(orni.mel.mean, tico.mel.mean, f=22050, mel=TRUE, plot=TRUE)
diffwave Difference between two time waves
Description
This function estimates the difference between two waves by computing the product between enve-lope surface difference and frequency surface difference.
Usage
diffwave(wave1, wave2, f, channel = c(1,1), wl = 512, envt = "hil",msmooth = NULL, ksmooth = NULL)
Arguments
wave1 a first R object.
wave2 a second R object.
f sampling frequency of wave (in Hz). Does not need to be specified if embeddedin wave.
channel channel of the R objects, by default left channel (1) for each object.
wl window length for spectral analysis (even number of points).
envt the type of envelope to be used: either "abs" for absolute amplitude envelope or"hil" for Hilbert amplitude envelope. See env.
msmooth a vector of length 2 to smooth the amplitude envelope with a mean sliding win-dow. The first component is the window length (in number of points). Thesecond component is the overlap between successive windows (in %). See env.
ksmooth kernel smooth via kernel. See env.

58 diffwave
Details
D is a Manhattan distance (l1 norm).This function computes the product between the values obtained with diffspec and diffenv func-tions.This then gives a global (time and frequency) estimation of dissimilarity.The frequency mean spectrum and the amplitude envelope needed for computing respectively diffspecand diffenv are automatically generated. They can be controlled through wl, msmooth and ksmootharguments respectively.See examples below and examples in diffspec and diffenv for implications on the results.
Value
A single value varying between 0 and 1 is returned. The value has no unit.
Note
This method can be used as a relative distance estimation between different waves.
Author(s)
Jerome Sueur <[email protected]>
References
Sueur, J., Pavoine, S., Hamerlynck, O. & Duvail, S. (2008) - Rapid acoustic survey for biodiversityappraisal. PLoS ONE, 3(12): e4065.
See Also
diffspec, diffenv
Examples
data(tico) ; tico <- tico@leftdata(orni) ; orni <- orni@left# selection in tico to have two waves of similar duration (length)tico <- tico[1:length(orni)]diffwave(tico,orni,f=22050)# changing the frequency parameter (wl)diffwave(tico,orni,f=22050,wl=1024)# changing the temporal parameter (msmooth)diffwave(tico,orni,f=22050,msmooth=c(20,0))

discrets 59
discrets Time series discretisation
Description
This function transforms a numeric (time) series into a sequence of symbols
Usage
discrets(x, symb = 5, collapse = TRUE, plateau=1)
Arguments
x a vector, a matrix (first column), an object of class ts, Sample (left channel),or Wave (left channel).
symb the number of symbols used for the discretisation, can be set to 3 or 5 only.
collapse logical, if TRUE, the symbols are pasted in a character string of length 1.
plateau a numeric vector of length 1 taking the values 1 or 2 only. See details.
Details
The function partitions the numeric (time) series into a sequence of finite number of symbols. Thesesymbols result of the comparaison of each series value with its temporal neighbours.They are two discretisations available:when symb is set to 3, each value will be replaced by either:- I if the series is Increasing,- D if the series is Decreasing,- F if the series remains Flat,when symb is set to 5, each value will be replaced by either:- I if the series is Increasing,- D if the series is Decreasing,- F if the series remains Flat,- P if the series shows a Peak,- T if the series shows a Trough.
The argument plateau can be used to control the way a plateau is encoded. A plateau is an el-evated flat region that can be either considered a ’flat peak’ encoded as PF...FP (plateau = 1) oras an increase, a flat region and a decrease encoded as IF...FD (plateau = 1. The default value(plateau = 1) refers to Cazelles et al. (2004).
Value
A character string of length 1 if collapse is TRUE. Otherwise, a character string of length n-2 ifsymbol=5 (the first and last values cannot be replaced with a symbol) or n-1 if symbol=3 (the firstvalue cannot be replaced with a symbol.)
60 drawenv
Author(s)
Jerome Sueur, improved by Laurent Lellouch
References
Cazelles, B. 2004 Symbolic dynamics for identifying similarity between rhythms of ecological timeseries. Ecology Letters, 7: 755-763.
See Also
symba
Examples
# a random variablediscrets(rnorm(30))discrets(rnorm(30),symb=3)# a frequency spectrumdata(tico)spec1<-spec(tico,f=22050,at=0.2,plot=FALSE)discrets(spec1[,2])
drawenv Draw the amplitude envelope of a time wave
Description
This function lets the user modifying the amplitude envelope of a time wave by drawing it with thegraphics device
Usage
drawenv(wave, f, channel = 1, n = 20, plot = FALSE, listen = FALSE, output = "matrix")
Arguments
wave an R object.
f sampling frequency of wave (in Hz). Does not need to be specified if embeddedin wave.
channel channel of the R object, by default left channel (1).
n the maximum number of points to draw the new envelope. Valid values start at1.
plot if TRUE returns the oscillogram of the new time wave (by default FALSE).
listen if TRUE the new sound is played back.
output character string, the class of the object to return, either "matrix", "Wave","Sample", "audioSample" or "ts".
drawfilter 61
Details
The function first plots an oscillogram view of wave.The user has then to choose points on the positive side of the y-axis (amplitude). The junction ofthese points will draw a new amplitude envelope.The order of points along the x-axis (time) is not important but points cannot be cancelled. Whenthis process is finished the new time wave is returned in the console or as an oscillogram in a secondgraphics device if plot is TRUE.The function uses locator.
Value
If plot is FALSE, a new wave is returned. The class of the returned object is set with the argumentoutput.
Author(s)
Jerome Sueur <[email protected]>
See Also
setenv, env, synth
Examples
## Not run:a<-synth(d=1,f=22050,cf=1000)# drawenv(a,f=22050,plot=TRUE)# choose points on the oscillogram view to draw a new enveloppe# stop (ESC on Windows; right mouse button on Linux)# check the result on the second graphics device opened thanks to plot=TRUE
## End(Not run)
drawfilter Draw the amplitude profile of a frequency filter
Description
This function lets the user drawing the amplitude profile of a frequency filter.
Usage
drawfilter(f, n = 256, continuous = TRUE, discrete = TRUE)

62 drawfilter
Arguments
f a numeric vector of length 1 for the sampling frequency of the object to befiltered (in Hz).
n a numeric vector of length 1 for the length (i.e. number of points) of the filter.By default = 256 to fit with a FIR with wl = 512.
continuous a logical (TRUE by default) to draw a continuous filter.
discrete a logical (TRUE by default) to draw a discrete filter.
Details
If the same frequency of a discrete filter is selected twice then the sum of the amplitudes of thetwo selections is used. If both arguments continuous and discrete are set to TRUE and if fre-quencies selected overlap between the two filters then only the frequencies of the discrete filter areconsidered.
Value
The function returns a two-column matrix, the first column is the frequency in kHz and the secondcolumn is the amplitude of the filter.
Note
This function can be used to prepare bandpass or bandstop custom filters to be used with fir andffilter. See examples.
Author(s)
Laurent Lellouch
See Also
fir, squarefilter, combfilter, ffilter, drawenv
Examples
## Not run:f <- 8000a <- noisew(f=f, d=1)## bandpass continuous and discretecont.disc <- drawfilter(f=f/2)a.cont.disc <- fir(a, f=f, custom=cont.disc)spectro(a.cont.disc, f=f)## bandpass continuous onlycont <- drawfilter(f=f/2, discrete=FALSE)a.cont <- fir(a, f=f, custom=cont)spectro(a.cont, f=f)## bandstop continuous onlycont.stop <- drawfilter(f=f/2, discrete=FALSE)a.cont.stop <- fir(a, f=f, custom=cont.stop, bandpass=FALSE)spectro(a.cont.stop, f=f)

duration 63
## bandpass discrete onlydisc <- drawfilter(f=f/2, continuous=FALSE)a.disc <- fir(a, f=f, custom=disc, bandpass=FALSE)spectro(a.disc, f=f)
## End(Not run)
duration Duration of a time wave
Description
Returns the duration (in second) of a time wave
Usage
duration(wave, f, channel=1)
Arguments
wave an R object.
f sampling frequency of wave (in Hz). Does not need to be specified if embeddedin wave.
channel channel of the R object, by default left channel (1).
Value
A numeric vector of length 1 returning the duration in second.
Author(s)
Jerome Sueur
Examples
data(tico)duration(tico)

64 dynoscillo
dynoscillo Dynamic oscillogram
Description
This graphical function displays a time wave as an windowed oscillogram.
Usage
dynoscillo(wave, f, channel = 1, wd = NULL, wl = NULL, wnb = NULL, title = TRUE, ...)
Arguments
wave an R object.
f sampling frequency of wave (in Hz). Does not need to be specified if embeddedin wave.
channel channel of the R object, by default left channel (1).
wd a numerical vector, duration of the window (in seconds)
wl a numerical vector, length of the window (in number of points).
wnb a numerical vector, number of windows (no unit).
title a logical, if TRUE displays a title with information regarding window size andnumber.
... other plot graphical parameters.
Details
The arguments wd, wl and wn have to be used isolated, not in conjunction. They basically do thesame, ie they set the duration of the zooming window that is slided along the signal. For instance,for a 5 seconds sound with a sampling rate (f) at 44.1 kHz, wl = 4096 is equivalent to wd = 4096 /44100 = 0.093 s and equivalent to wnb = 5*4096 / 44100 = 53.
Note
This function requires the package rpanel.
Author(s)
Jerome Sueur
See Also
oscillo, oscilloST, dynspec.

dynspec 65
Examples
## Not run:require(rpanel)data(tico)dynoscillo(tico, wn=4)## End(Not run)
dynspec Dynamic sliding spectrum
Description
This function plots dynamically a sliding spectrum along a time wave. This basically correspondsto a short-term Fourier transform.
Usage
dynspec(wave, f, channel = 1, wl = 512, wn = "hanning", zp = 0,ovlp = 0, fftw = FALSE, norm = FALSE, dB = NULL, dBref = NULL, plot = TRUE,title = TRUE, osc = FALSE,tlab = "Time (s)", flab = "Frequency (kHz)",alab = "Amplitude", alim = NULL, flim = c(0, f/2000),type = "l", from = NULL, to = NULL, envt = NULL,msmooth = NULL, ksmooth = NULL, colspec = "black",coltitle = "black", colbg = "white", colline = "black",colaxis = "black", collab = "black", cexlab = 1,fontlab = 1, colwave = "black",coly0 = "lightgrey", colcursor = "red", bty = "l")
Arguments
wave an R object.
f sampling frequency of wave (in Hz). Does not need to be specified if embeddedin wave.
channel channel of the R object, by default left channel (1).
wl if at is not null, length of the window for the analysis (even number of points,by defaults = 512).
wn window name, see ftwindow (by default "hanning").
zp zero-padding (even number of points), see Details.
ovlp overlap between two successive windows (in % ).
fftw if TRUE calls the function FFT of the library fftw. See Notes of the spectro.
norm logical, if TRUE compute a normalised sliding spectrum.
dB a character string specifying the type dB to return: "max0" for a maximum dBvalue at 0, "A", "B", "C", "D", and "ITU" for common dB weights.

66 dynspec
dBref a dB reference value when dB is not NULL. NULL by default but should be set to2*10e-5 for a 20 microPa reference (SPL).
plot logical, if TRUE plots in an ew graphics device the successive spectra slidingalong the time wave (by default TRUE).
title logical, if TRUE adds a title with the time position of the current spectrum alongthe time wave.
osc logical, if TRUE plots an oscillogram beneath the sliding spectrum with a cursorshowing the position of the current spectrum (by default FALSE).
tlab title of the time axis.flab title of the frequency axis.alab title of the amplitude axis.flim range of frequency axis.alim range of amplitude axis.type type of plot that should be drawn for the sliding spectrum. See plot for details
(by default "l" for lines).from start mark where to compute the sliding spectrum (in s).to end mark where to compute the sliding spectrum (in s).envt the type of envelope to be plooted: either "abs" for absolute amplitude envelope
or "hil" for Hilbert amplitude envelope. See env.msmooth when env is not NULL, a vector of length 2 to smooth the amplitude envelope with
a mean sliding window. The first component is the window length (in numberof points). The second component is the overlap between successive windows(in %). See env.
ksmooth when env is not NULL, kernel smooth via kernel. See env.colspec colour of the sliding spectrum.coltitle if title is TRUE, colour of the title.colbg background colour.colline colour of axes line.colaxis colour of the axes.collab colour of axes title.cexlab character size for axes title.fontlab font for axes title.colwave colour of the oscillogram or of the envelope (only when osc is TRUE).coly0 colour of the y=0 line (only when osc is TRUE).colcursor colour of oscillogram cursor (only when osc is TRUE).bty the type of box to be drawn around the oscillogram (only when osc is TRUE).
Details
Use the slider panel to move along the time wave.Use the argument norm if you wish to have each spectrum normalised, i.e. with values between 0and 1 or maximised to 0 dB when dB is TRUE.The function requires the package rpanel that is based on the package tcltk.

dynspectro 67
Value
This function returns a list of three items:
time a numeric vector corresponding to the time axis.
freq a numeric vector corresponding to the frequency axis.
amp a numeric matrix corresponding to the amplitude values. Each column is aFourier transform of length wl/2.
Note
This function is very similar to a spectrogram. See the Details of spectro for some informationregarding the short term Fourier transform.
Author(s)
Jerome Sueur and Caroline Simonis
See Also
spectro, spectro3D, wf, spec, dynspectro, fft, oscillo, env.
Examples
## Not run:data(sheep)require(rpanel)dynspec(sheep,f=8000,wl=1024,ovlp=50,osc=TRUE)
## End(Not run)
dynspectro Dynamic sliding spectrogramn
Description
This function plots dynamically a sliding spectrogram along a time wave.
Usage
dynspectro(wave, f, channel = 1, slidframe = 10,wl = 512, wn = "hanning", zp = 0, ovlp = 75,fftw = FALSE, dB = TRUE, plot = TRUE,title = TRUE, osc = FALSE,tlab = "Time (s)", flab = "Frequency (kHz)", alab = "Amplitude",from = NULL, to = NULL,collevels = NULL, palette = spectro.colors,envt = NULL, msmooth = NULL, ksmooth = NULL,

68 dynspectro
coltitle = "black", colbg = "white", colline = "black",colaxis = "black", collab = "black", cexlab = 1,fontlab = 1, colwave = "black",coly0 = "lightgrey", colcursor = "red", bty = "l")
Arguments
wave an R object.
f sampling frequency of wave (in Hz). Does not need to be specified if embeddedin wave.
channel channel of the R object, by default left channel (1).
slidframe size of the sliding frame (in percent of the wave duration).
wl if at is not null, length of the window for the analysis (even number of points,by defaults = 512).
wn window name, see ftwindow (by default "hanning").
zp zero-padding (even number of points), see Details.
ovlp overlap between two successive windows (in % ).
fftw if TRUE calls the function FFT of the library fftw. See Notes of the spectro.
dB a logical, if TRUE then uses dB values
plot logical, if TRUE plots in an ew graphics device the successive spectrograms slid-ing along the time wave (by default TRUE).
title logical, if TRUE adds a title with the time position of the current spectrogramalong the time wave.
osc logical, if TRUE plots an oscillogram beneath the sliding spectrogram with acursor showing the position of the current spectrum (by default FALSE).
tlab title of the time axis.
flab title of the frequency axis.
alab title of the amplitude axis.
from start mark where to compute the sliding spectrogram (in s).
to end mark where to compute the sliding spectrogram (in s).
collevels a set of levels which are used to partition the amplitude range of the spectrogram.
palette a color palette function to be used to assign colors in the plot.
envt the type of envelope to be plooted: either "abs" for absolute amplitude envelopeor "hil" for Hilbert amplitude envelope. See env.
msmooth when env is not NULL, a vector of length 2 to smooth the amplitude envelope witha mean sliding window. The first component is the window length (in numberof points). The second component is the overlap between successive windows(in %). See env.
ksmooth when env is not NULL, kernel smooth via kernel. See env.
coltitle if title is TRUE, colour of the title.
colbg background colour.

dynspectro 69
colline colour of axes line.colaxis colour of the axes.collab colour of axes title.cexlab character size for axes title.fontlab font for axes title.colwave colour of the oscillogram or of the envelope (only when osc is TRUE).coly0 colour of the y=0 line (only when osc is TRUE).colcursor colour of oscillogram cursor (only when osc is TRUE).bty the type of box to be drawn around the oscillogram (only when osc is TRUE).
Details
Use the slider panel to move along the time wave.The function requires the package rpanel that is based on the package tcltk.The function is mainly written for inspecting long sounds.The function is based on image for fast display when spectro is based on filled.contour. Dis-playing the amplitude envelope with the argument envt can slow down significantly the display.
Value
This function returns a list of three items:
time a numeric vector corresponding to the time axis.freq a numeric vector corresponding to the frequency axis.amp a numeric matrix corresponding to the amplitude values. Each column is a
Fourier transform of length wl/2.
Note
This function is very similar to a spectrogram. See the Details of spectro for some informationregarding the short term Fourier transform.
Author(s)
David Pinaud and Jerome Sueur
See Also
spectro, spectro3D, wf, spec, dynspec, fft, oscillo, env.
Examples
## Not run:data(sheep)require(rpanel)dynspectro(sheep, ovlp=95, osc=TRUE)
## End(Not run)

70 echo
echo Echo generator
Description
This function generate echoes of a time wave.
Usage
echo(wave, f, channel = 1, amp, delay, plot = FALSE,listen = FALSE, output = "matrix", ...)
Arguments
wave an R object.
f sampling frequency of wave (in Hz). Does not need to be specified if embeddedin wave.
channel channel of the R object, by default left channel (1).
amp a vector describing the relative amplitude of the successive echoes. Each valueof the vector should be in [0,1]
delay a vector describing the time delays of the successive echoes from the beginningof wave (in s.)
plot logical, if TRUE returns an oscillographic plot of the wave modified (by defaultFALSE).
listen if TRUE the new sound is played back.
output character string, the class of the object to return, either "matrix", "Wave","Sample", "audioSample" or "ts".
... other oscillo graphical parameters.
Details
amp and delay should strictly have the same length corresponding to the number of desired echoes.
Value
If plot is FALSE, a new wave is returned. The class of the returned object is set with the argumentoutput.
Note
This function is based on a convolution (convolve) between the input wave and a pulse echo filter.
Author(s)
Jerome Sueur <[email protected]>

env 71
References
Stoddard, P. K. (1998). Application of filters in bioacoustics. In: Hopp, S. L., Owren, M. J. andEvans, C. S. (Eds), Animal acoustic communication. Springer, Berlin, Heidelberg,pp. 105-127.
See Also
synth
Examples
# generation of the input wavea <- synth(f=11025,d=1,cf=2000,shape="tria",am=c(50,10),fm=c(1000,10,1000,0,0))# generation of three echoes# with respectively a relative amplitude of 0.8, 0.4, and 0.2# and with a delay of 1s, 2s, and 3s from the beginning of the input waveaecho <- echo(a,f=11025,amp=c(0.8,0.4,0.2),delay=c(1,2,3))# another echo with time delays overlapping with the input waveaecho <- echo(a,f=11025,amp=c(0.4,0.2,0.4),delay=c(0.6,0.8,1.5))
env Amplitude envelope of a time wave
Description
This function returns the absolute or Hilbert amplitude envelope of a time wave.
Usage
env(wave, f, channel = 1, envt = "hil",msmooth = NULL, ksmooth = NULL, ssmooth = NULL,asmooth = NULL,fftw = FALSE, norm = FALSE,plot = TRUE, k = 1, j = 1, ...)
Arguments
wave an R object.
f sampling frequency of wave (in Hz). Does not need to be specified if embeddedin wave.
channel channel of the R object, by default left channel (1).
envt the type of envelope to be returned: either "abs" for absolute amplitude envelopeor "hil" for Hilbert amplitude envelope. See Details section.
msmooth a vector of length 2 to smooth the amplitude envelope with a mean sliding win-dow. The first component is the window length (in number of points). Thesecond component is the overlap between successive windows (in %). See ex-amples.

72 env
ksmooth kernel smooth via kernel. See examples.
ssmooth length of the sliding window used for a sum smooth.
asmooth length of the sliding window used for an autocorrelation smooth.
fftw if TRUE calls the function FFT of the library fftw for faster computation for theHilbert amplitude envelope (envt="hil") and/or for kernell smoothing (ksmooth).
norm a logical, if TRUE the amplitude of the envelope is normalised between 0 and 1.
plot logical, if TRUE returns a plot of wave envelope (by default TRUE).
k number of horizontal sections when plot is TRUE (by default =1).
j number of vertical sections when plot is TRUE (by default =1).
... other oscillo graphical parameters.
Details
When envt is set as "abs", the amplitude envelope returned is the absolute value of wave.When envt is set as "hil", the amplitude envelope returned is the modulus (Mod) of the analyticalsignal of wave obtained through the Hilbert transform (hilbert).
Value
Data are returned as one-column matrix when plot is FALSE.
Note
Be aware that smoothing with either msmooth or ksmooth changes the original number of pointsdescribing wave.
Author(s)
Jerome Sueur. Implementation of ’fftw’ argument by Jean Marchal and Francois Fabianek. Imple-mentation of ’asmooth’ by Thibaut Marin-Cudraz.
See Also
oscillo,hilbert
Examples
data(tico)# Hilbert amplitude envelopeenv(tico)# absolute amplitude envelopeenv(tico, envt="abs")# smoothing with a 10 points and 50% overlaping mean sliding windowenv(tico, msmooth=c(10,50))# smoothing kernelenv(tico, ksmooth=kernel("daniell",10))# sum smoothenv(tico, ssmooth=50)

export 73
# autocorrelation smoothenv(tico, asmooth=50)# overplot of oscillographic and envelope representationsoscillo(tico)par(new=TRUE)env(tico, colwave=2)
export Export sound data
Description
Export sound data as a text file that can be read by a sound player like ’Goldwave’
Usage
export(wave, f = NULL, channel = 1, filename = NULL, header=TRUE, ...)
Arguments
wave an R object.
f sampling frequency of wave (in Hz). Does not need to be specified if embeddedin wave.
channel channel of the R object, by default left channel (1).
filename name of the new file. (by default the name of wave).
header either a logical or a character vector, if TRUE add a header to be read by Gold-wave, if FALSE does not add any header, if a character vector add the charactervector as a header.
... other write.table parameters.
Details
Creates a new text file with a header describing the main features of the sound (wave). For instance,for a 2 s sound with a sampling frequency of 8000 Hz, the header will be: [ASCII 8000Hz, Chan-nels: 1, Samples: 160000, Flags: 0]. This type of file can be read by sound players like Goldwave(http://www.goldwave.com/).
Author(s)
Jerome Sueur <[email protected]>
Examples
a<-synth(f=8000,d=2,cf=2000,plot=FALSE)export(a,f=8000)unlink("a.txt")

74 fadew
fadew Fade in and fade out of a time wave
Description
This function applies a “fade in” and/or a “fade out” to a time wave following a linear, exponentialor cosinus-like shape.
Usage
fadew(wave, f, channel = 1, din = 0, dout = 0, shape = "linear", plot = FALSE,listen = FALSE, output = "matrix", ...)
Arguments
wave an R object.
f sampling frequency of wave (in Hz). Does not need to be specified if embeddedin wave.
channel channel of the R object, by default left channel (1).
din fade in duration.
dout fade out duration.
shape fade shape, "linear", "exp" for exponential, "cos" for cosinus-like, (by de-fault "linear").
plot logical, if TRUE returns an oscillographic plot of the wave modified (by defaultFALSE).
listen if TRUE the new sound is played back.
output character string, the class of the object to return, either "matrix", "Wave","Sample", "audioSample" or "ts".
... other oscillo graphical parameters.
Value
If plot is FALSE, a new wave is returned. The class of the returned object is set with the argumentoutput.
Author(s)
Jerome Sueur <[email protected]>
See Also
oscillo, addsilw, cutw, deletew,mutew, pastew, revw, zapsilw

fbands 75
Examples
a<-noisew(d=5,f=4000)op<-par(mfrow=c(3,1))fadew(a,f=4000,din=1,dout=2,plot=TRUE,title="Linear",cexlab=0.8)fadew(a,f=4000,din=1,dout=2,shape="exp",plot=TRUE,title="Exponential shape",
colwave="blue",coltitle="blue",cexlab=0.8)fadew(a,f=4000,din=1,dout=2,shape="cos",plot=TRUE,title="Cosinus-like shape",
colwave="red",coltitle="red",cexlab=0.8)par(op)
fbands Frequency bands plot
Description
This graphical function returns a frequency spectrum as a bar plot.
Usage
fbands(spec, f = NULL, bands = 10, width = FALSE, mel = FALSE, plot = TRUE,xlab = NULL, ylab = "Relative amplitude", ...)
Arguments
spec a data set resulting of a spectral analysis obtained with spec or meanspec. Canbe in dB.
f sampling frequency of spec (in Hz). Not requested if the first column of speccontains the frequency axis.
bands a numeric vector. If vector of length 1, then sets the number of bands dividingin equal parts the spectrum. If of length > 1, then takes the values as kHz limitsof the bands dividing the spectrum. These bands can be of different size. Seedetails and examples.
width logical, if TRUE and that bands is an irregular series of values, then the width ofthe bands will be proportional to the frequency limits defined in bands.
mel a logical, if TRUE the (htk-)mel scale is used.
plot logical, if TRUE, a plot showing the peaks is returned.
xlab label of the x-axis.
ylab label of the y-axis.
... other plot graphical parameters.

76 fbands
Details
The function proceeds as follows
• divides the spectrum in bands. The limits of the bands are set with the argument bands. Thereare two options:
– you set a number of bands with equal size by giving a single value to bands. For instance,setting bands to a value of 10 will slice the spectrum in 10 equal parts and return 10 localpeaks.
– you set the limits of the bands. This is achieve by giving a numeric vector to bands.The limits can follow a regular or irregular series. For instance attributing the vectorc(0,2,4,8) will generate the following bands [0,2[, [2,4[, [4,8] kHz. Be aware that the lastvalue should not exceed half the sampling frequency used to obtain the spectrum spec.
• uses the function barplot.
Value
A two-column matrix, the first column corresponding to the frequency values (x-axis, mean of thebars limits) and the second column corresponding to height values (y-axis) of the bars.
Note
The value below bars is the mean between the corresponding frequency limits.
Author(s)
Jerome Sueur, improved by Laurent Lellouch
See Also
meanspec, spec, barplot.
Examples
data(sheep)spec <- meanspec(sheep, f=8000, plot=FALSE)# default plotfbands(spec)# setting a specific number of bandsfbands(spec, bands=6)#setting specific regular bands limitsfbands(spec, bands=seq(0,4,by=0.25))# some plot tuningop <- par(las=1)fbands(spec, bands=seq(0,4,by=0.1),
horiz=TRUE, col=heat.colors(41),xlab="", ylab="",cex.axis=0.75, cex.names = 0.75,axes=FALSE)
par(op)# showing or not the width of the bands

fdoppler 77
oct <- octaves(440,3)/1000op <- par(mfrow=c(2,1))fbands(spec, bands=oct, col="blue")fbands(spec, bands=oct, width = TRUE, col="red")par(op)# kind of horizontal zoomop <- par(mfrow=c(2,1))fbands(spec, bands=seq(0,4,by=0.2), col=c(rep(1,10),
rep("orange",5),rep(1,5)), main="all frequency range")fbands(spec, bands=seq(2,3,by=0.2),
col="orange", main="a subset or zoom in")par(op)# kind of dynamic frequency bandsspecs <- dynspec(sheep, f=8000, plot= FALSE)$ampout <- apply(specs, f=8000, MARGIN=2,
FUN = fbands, bands = seq(0,4,by=0.2),col = 1, ylim=c(0,max(specs)))
# mel scalerequire(tuneR)mel <- melfcc(sheep, nbands = 256, dcttype = "t3", fbtype = "htkmel", spec_out=TRUE)melspec.mean <- apply(mel$aspectrum, MARGIN=2, FUN=mean)melspec.mean <- melspec.mean/max(melspec.mean) # [0,1] scalingfbands(melspec.mean, f=8000, bands=8)
fdoppler Doppler effect
Description
This function computes the altered frequency of a moving source due to the Doppler effect.
Usage
fdoppler(f, c = 340, vs, vo = 0, movs = "toward", movo = "toward")
Arguments
f original frequency produced by the source (in Hz or kHz)
c speed of sound in meters/second.
vs speed of the source in meters/second.
vo speed of the observer in meters/second. The observer is static by default i.e. vo= 0
movs movement direction of the source in relation with observer position, either "toward"(by default) or "away".
movo movement direction of the observer in relation with the source position, either"toward" (by default, but be aware that the observer is static by default) or"away".

78 fdoppler
Details
The altered frequency f ’ is computed according to:
f ′ = f × c± voc± vs
with f = original frequency produced by the source (in Hz or kHz),vs = speed of the source,vo = speed of the observer.
Value
The altered frequency is returned in a vector.
Note
You can use wasp to have exact values of c. See examples.
Author(s)
Jerome Sueur <[email protected]>
See Also
wasp
Examples
# a 400 Hz source moving toward or away from the observer at 85 m/sfdoppler(f=400,vs=85)# [1] 533.3333fdoppler(f=400,vs=85,movs="away")# [1] 320# use wasp() if you wish to have exact sound speed at a specific temperaturefdoppler(f=wasp(f=400,t=25)$c, vs=85)# [1] 461.8667# Doppler effect at different source speedsf<-seq(1,10,by=1); lf<-length(f)v<-seq(10,300,by=20); lv<-length(v)res<-matrix(numeric(lf*lv),ncol=lv)for(i in 1:lv) res[,i]<-fdoppler(f=f,vs=v[i])op<-par(bg="lightgrey")matplot(x=f,y=res,type="l",lty=1,las=1,col= spectro.colors(lv),xlab="Source frequency (kHz)", ylab="Altered frequency (kHz)")legend("topleft",legend=paste(as.character(v),"m/s"),lty=1,col= spectro.colors(lv))title(main="Doppler effect at different source speeds")par(op)

ffilter 79
ffilter Frequency filter
Description
This function filters out a selected frequency section of a time wave (low-pass, high-pass, low-stop,high-stop, bandpass or bandstop frequency filter).
Usage
ffilter(wave, f, channel = 1, from = NULL, to = NULL, bandpass = TRUE,custom = NULL, wl = 1024, ovlp = 75, wn = "hanning", fftw = FALSE,rescale=FALSE, listen=FALSE, output="matrix")
Arguments
wave an R object.
f sampling frequency of wave (in Hz). Does not need to be specified if embeddedin wave.
channel channel of the R object, by default left channel (1).
from start frequency (in Hz) where to apply the filter.
to end frequency (in Hz) where to apply the filter.
bandpass if TRUE a band-pass filter is applied between from and to, if FALSE a band-stopfilter is applied between from and to (by default TRUE).
custom a vector describing the frequency response of a custom filter. This can be man-ually generated or obtained with spec and meanspec. The length of the vectorshould be half the length of wl. See examples.
wl window length for the analysis (even number of points).
ovlp overlap between successive FFT windows (in %).
wn window name, see ftwindow (by default "hanning").
fftw if TRUE calls the function FFT of the library fftw. See Notes of the spectro.
rescale a logical, if TRUE then the sample values of new wave (output) are rescaledaccording to the sample values of wave (input).
listen a logical, if TRUE the new sound is played back.
output character string, the class of the object to return, either "matrix", "Wave","audioSample" or "ts".
Details
A short-term Fourier transform is first applied to the signal (see spectro), then the frequency filteris applied and the new signal is eventually generated using the reverse of the Fourier Transform(istft).There is therefore neither temporal modifications nor amplitude modifications.

80 field
Value
If plot is FALSE, a new wave is returned. The class of the returned object is set with the argumentoutput.
Author(s)
Jerome Sueur
See Also
afilter,lfs,fir, preemphasis, combfilter, bwfilter
Examples
a<-noisew(f=8000,d=1)# low-passb<-ffilter(a,f=8000,to=1500)spectro(b,f=8000,wl=512)# high-passc<-ffilter(a,f=8000,from=2500)spectro(c,f=8000,wl=512)# band-passd<-ffilter(a,f=8000,from=1000,to=2000)spectro(d,f=8000,wl=512)# band-stope<-ffilter(a,f=8000,from=1500,to=2500,bandpass=FALSE)spectro(e,f=8000,wl=512)# custommyfilter1<-rep(c(rep(0,64),rep(1,64)),4)g<-ffilter(a,f=8000,custom=myfilter1)spectro(g,f=8000)
field Near field and far field limits
Description
This function helps in knowing whether you are working in the near or far field.
Usage
field(f, d)
Arguments
f frequency (Hz)
d distance from the sound source (m)

field 81
Details
Areas very close to the sound source are in the near-field where the contribution of particle velocityto sound energy is greater thant that of sound pressure and where these components are not in phase.Sound propagation properties are also different near or far from the source. It is therefore importantto know where the microphone was from the source.To know this, the product k*d is computed according to:
k × d =f
c× d
with d = distance from the source (m), f = frequency (Hz) and c = sound celerity (m/s).If k*d is greatly inferior 1 then the microphone is in the near field.The decision help returned by the function follows the rule:far field:
k × d > 1
between near and far field limits:0.1 ≤ k × d ≤ 1
near field:k × d < 0.1
.
Value
A list of two values is returned:
kd the numeric value k*d used to take a decision
d a character string giving the help decision.
Note
This function works for air-borne sound only.
Author(s)
Jerome Sueur <[email protected]>
Examples
# 1 kHz near field at 1 cm from the sourcefield(f=1000,d=0.01)# playing with distance from source and sound frequencyop<-par(bg="lightgrey")D<-seq(0.01,0.5,by=0.01); nD<-length(D)F<-seq(100,1000,by=25); nF<-length(F)a<-matrix(numeric(nD*nF),nrow=nD)for(i in 1:nF) a[,i]<-field(f=F[i],d=D)$kdmatplot(x=D,y=a,type="l",lty=1,col= spectro.colors(nF),
xlab="Distance from the source (m)", ylab="k*d")title("Variation of the product k*d with distance and frequency")

82 fir
text(x=c(0.4,0.15),y=c(0.02,1), c("Near Field","Far Field"),font=2)legend(x=0.05,y=1.4,c("100 Hz","1000 Hz"),lty=1,
col=c(spectro.colors(nF)[1],spectro.colors(nF)[nF]),bg="grey")abline(h=0.1)par(op)
fir Finite Impulse Response filter
Description
This function is a FIR filter that filters out a selected frequency section of a time wave (low-pass,high-pass, low-stop, high-stop, bandpass or bandstop frequency filter).
Usage
fir(wave, f, channel = 1, from = NULL, to = NULL, bandpass = TRUE, custom = NULL,wl = 512, wn = "hanning", rescale=FALSE, listen = FALSE, output = "matrix")
Arguments
wave an R object.
f sampling frequency of wave (in Hz). Does not need to be specified if embeddedin wave.
channel channel of the R object, by default left channel (1).
from start frequency (in Hz) where to apply the filter.
to end frequency (in Hz) where to apply the filter.
bandpass if TRUE a band-pass filter is applied between from and to, if not NULL a band-stopfilter is applied between from and to (by default NULL).
custom a vector describing the frequency response of a custom filter. This can be man-ually generated or obtained with spec and meanspec. wl is no more required.See examples.
wl window length of the impulse filter (even number of points).
wn window name, see ftwindow (by default "hanning").
rescale a logical, if TRUE then the sample values of new wave (output) are rescaledaccording to the sample values of wave (input).
listen a logical, if TRUE the new sound is played back.
output character string, the class of the object to return, either "matrix", "Wave","Sample", "audioSample" or "ts".
Details
This function is based on the reverse of the Fourier Transform (fft) and on a convolution (convolve)between the wave to be filtered and the impulse filter.

fma 83
Value
A new wave is returned. The class of the returned object is set with the argument output.
Author(s)
Jerome Sueur
References
Stoddard, P. K. (1998). Application of filters in bioacoustics. In: Hopp, S. L., Owren, M. J. andEvans, C. S. (Eds), Animal acoustic communication. Springer, Berlin, Heidelberg,pp. 105-127.
See Also
ffilter, bwfilter, preemphasis, lfs, afilter
Examples
a<-noisew(f=8000,d=1)# low-passb<-fir(a,f=8000,to=1500)spectro(b,f=8000)# high-passc<-fir(a,f=8000,from=2500)spectro(c,f=8000)# band-passd<-fir(a,f=8000,from=1000,to=2000)spectro(d,f=8000)# band-stope<-fir(a,f=8000,from=1500,to=2500,bandpass=FALSE)spectro(e,f=8000)# custom filter manually generatedmyfilter1<-rep(c(rep(0,32),rep(1,32)),4)g<-fir(a,f=8000,custom=myfilter1)spectro(g,f=8000)# custom filter generated using spec()data(tico)myfilter2<-spec(tico,f=22050,at=0.7,wl=512,plot=FALSE)b<-noisew(d=1,f=22050)h<-fir(b,f=22050,custom=myfilter2)spectro(h,f=22050)
fma Frequency modulation analysis
Description
This function computes the Fourier analysis of the instantaneous frequency of a time wave. Thisallows to detect periodicity in frequency modulation.

84 fma
Usage
fma(wave, f, channel = 1, threshold = NULL, plot = TRUE, ...)
Arguments
wave an R object.
f sampling frequency of wave (in Hz). Does not need to be specified if embeddedin wave.
channel channel of the R object, by default left channel (1).
threshold amplitude threshold for signal detection (in % ).
plot logical, if TRUE the spectrum of the instantaneous frequency (by default TRUE).
... other spec parameters.
Details
This function is based on ifreq and spec.The instantaneous frequency of wave is first computed and the spectrum of this frequency modula-tion is then processed. All env and spec arguments can be set up.
Value
If plot is FALSE, fma returns a numeric vector corresponding to the computed spectrum. If peaksis not NULL, fma returns a list with two elements:
spec the spectrum computed
peaks the peaks values (in kHz).
Author(s)
Jerome Sueur <[email protected]>
See Also
ifreq, hilbert, spec, ama
Examples
# a sound with a 1 kHz sinusoid FMa<-synth(d=1, f=8000, cf=1500, fm=c(1000,1000,0,0,0), output="Wave")fma(a)
fpeaks 85
fpeaks Frequency peak detection
Description
This function searches for peaks of a frequency spectrum.
Usage
fpeaks(spec, f = NULL,nmax = NULL, amp = NULL, freq = NULL, threshold = NULL,mel =FALSE,plot = TRUE, title = TRUE,xlab = NULL, ylab = "Amplitude",labels = TRUE, digits = 2,legend = TRUE, collab = "red", ...)
Arguments
spec a data set resulting of a spectral analysis obtained with spec or meanspec. Canbe in dB.
f sampling frequency of spec (in Hz). Not requested if the first column of speccontains the frequency axis.
nmax maximal number of peaks detected. Overrides amp and freq. See details.amp amplitude slope parameter, a numeric vector of length 2. Refers to the amplitude
slopes of the peak. The first value is the left slope and the second value is theright slope. Only peaks with higher slopes than threshold values will be kept.See details.
freq frequency threshold parameter (in Hz). If the frequency difference of two suc-cessive peaks is less than this threshold, then the peak of highest amplitude willbe kept only. See details.
threshold amplitude threshold parameter. Only peaks above this threshold will be consid-ered. See details.
mel a logical, if TRUE the (htk-)mel scale is used.plot logical, if TRUE, a plot showing the peaks is returned.title logical, if TRUE add the number of peaks detected as a plot title.xlab label of the x-axis.ylab label of the y-axis.labels logical, if TRUE peak labels are plotted.digits if labels is TRUE, the number of decimal places (round) for the peak labels.legend logical, if TRUE a legend returning the different selection parameters (nmax, amp,
freq, threshold, threshold) is added to the plot.collab labels color.... other plot graphical parameters.

86 fpeaks
Details
Here are some details regarding the different selection parameters:
• nmax: this parameter is to be used if you wish to get a specific number of peaks. The peaksselected are those with the highest slopes. It then does not work in conjunction with the otherparameters.
• freq: this parameter allows to remove from the selection successive peaks with a small fre-quency difference. Imagine you have two successive peaks at 1200 Hz and 1210 Hz and at 0.5and 0.25 in amplitude. If you set freq to 50 Hz, then only the first peak will be kept.
• amp: this parameter allows to remove from the selection peaks with low slopes. You can makethe selection on both slopes or on a single one. Imagine you have an asymetric peak with a0.01 left slope and a 0.02 right slope. The peak will be discarded for the following settings:both values higher than 0.02 (e.g. amp = c(0.03,0.04)), the first value higher than 0.01 (e.g.amp = c(0.02,0.001)), the second value higher than 0.02 (e.g. amp = c(0.001,0.03)). Ifyou do not want apply the selection on one of the slope use 0. For instance, a selection on theleft slope only will be achieved with: amp = c(0.02,0).
• threshold: this parameter can be used to do a rough selection on the spectrum. Peaks with anamplitude value (not a slope) lower than this threshold will be automatically discarded. Thiscan be useful when you want to remove peaks of a low-amplitude background noise.
Value
A two-column matrix, the first column corresponding to the frequency values (x-axis) and the sec-ond column corresponding to the amplitude values (y-axis) of the peaks.
Note
You can also use fpeaks with other kind of spectrum, for instance a cepstral spectrum. See exam-ples.
Author(s)
Jerome Sueur and Amandine Gasc
See Also
localpeaks, meanspec, spec
Examples
data(tico)spec <- meanspec(tico, f=22050, plot=FALSE)specdB <- meanspec(tico, f=22050, dB="max0", plot=FALSE)# all peaksfpeaks(spec)# 10 highest peaksfpeaks(spec, nmax=10)# highest peak (ie dominant frequency)
ftwindow 87
fpeaks(spec, nmax=1)# peaks that are separated by more than 500 Hzfpeaks(spec, freq=500)# peaks with a left slope higher than 0.1fpeaks(spec, amp=c(0.1,0))# peaks with a right slope higher than 0.1fpeaks(spec, amp=c(0,0.1))# peaks with left and right slopes higher than 0.1fpeaks(spec, amp=c(0.1,0.1))# peaks above a 0.5 thresholdfpeaks(spec, threshold=0.5)# peaks of a dB spectrum with peaks showing slopes higher than 3 dBfpeaks(specdB, amp=c(3,3))# comparing different parameter settingsmeanspec(tico, f=22050)col <- c("#ff000090","#0000ff75","#00ff00")cex <- c(2,1.25,1.5)pch <- c(19,17,4)title(main="Peak detection \n (spectrum with values between 0 and 1)")res1 <- fpeaks(spec, plot = FALSE)res2 <- fpeaks(spec, amp=c(0.02,0.02), plot =FALSE)res3 <- fpeaks(spec, amp=c(0.02,0.02), freq=200, plot = FALSE)points(res1, pch=pch[1], col=col[1], cex=cex[1])points(res2, pch=pch[2], col=col[2], cex=cex[2])points(res3, pch=pch[3], col=col[3], cex=cex[3])legend("topright", legend=c("all peaks","amp", "amp & freq"), pch=pch,pt.cex=cex, col=col, bty="n")# example with a cepstral spectrumdata(sheep)res <- ceps(sheep,f=8000,at=0.4,wl=1024,plot=FALSE)fpeaks(res, nmax=4, xlab="Quefrency (s)")# melscalerequire(tuneR)mel <- melfcc(sheep, nbands = 256, dcttype = "t3", fbtype = "htkmel", spec_out=TRUE)melspec.mean <- apply(mel$aspectrum, MARGIN=2, FUN=mean)melspec.mean <- melspec.mean/max(melspec.mean) # [0,1] scalingfpeaks(melspec.mean, nmax=4, f=8000, mel=TRUE)fpeaks(melspec.mean, freq=4, f=8000, mel=TRUE) # freq in Hz!fpeaks(melspec.mean, threshold=0.3, f=8000, mel=TRUE)fpeaks(melspec.mean, amp=c(0.1,0.1), f=8000, mel=TRUE)
ftwindow Fourier transform windows
Description
Generates different Fourier Transform windows.

88 ftwindow
Usage
ftwindow(wl, wn = "hamming",correction = c("none", "amplitude", "energy"))
Arguments
wl window length
wn window name: bartlett, blackman, flattop, hamming, hanning, or rectangle(by default hamming).
correction a character vector of length 1 to apply an amplitude ("amplitude") or an energy("energy") correction to the FT window. By default no correction is applied("none").
Value
A vector of length wl.
Note
Try the example to see windows shape.
Author(s)
Jerome Sueur <[email protected]>
References
Harris, F.J., 1978. On the use of windows for harmonic analysis with the discrete Fourier Transform.Proceedings of the IEEE, 66(1): 51-83.
See Also
covspectro, dfreq, meanspec, spec, spectro, spectro3D
Examples
a<-ftwindow(512)b<-ftwindow(512,wn="bartlett")c<-ftwindow(512,wn="blackman")d<-ftwindow(512,wn="flattop")e<-ftwindow(512,wn="hanning")f<-ftwindow(512,wn="rectangle")all<-cbind(a,b,c,d,e,f)matplot(all,type="l",col=1:6,lty=1:6)legend(legend=c("hamming","bartlett","blackman","flattop","hanning","rectangle"),x=380,y=0.95,col=1:6,lty=1:6,cex=0.75)

fund 89
fund Fundamental frequency track
Description
This function estimates the fundamental frequency through a short-term cepstral transform.
Usage
fund(wave, f, channel = 1, wl = 512, ovlp = 0, fmax = f/2, threshold = NULL,at = NULL, from = NULL, to = NULL,plot = TRUE, xlab = "Time (s)", ylab = "Frequency (kHz)",ylim = c(0, f/2000), pb = FALSE, ...)
Arguments
wave an R object.
f sampling frequency of wave (in Hz). Does not need to be specified if embeddedin wave.
channel channel of the R object, by default left channel (1).
wl if at is not null, length of the window for the analysis (even number of points,by defaults = 512).
ovlp overlap between two successive windows (in %).
fmax the maximum frequency to detect (in Hz).
threshold amplitude threshold for signal detection (in %).
at position where the estimate the fundamental frequency (in s).
from start position where to compute the fundamental frequency (in s).
to end position to compute the fundamental frequency (in s).
plot logical, if TRUE plots the fundamental frequency modulations against time (bydefault TRUE).
xlab title of the time axis (s).
ylab title of the frequency axis (Hz).
ylim the range of frequency values.
pb if TRUE returns a text progress bar in the console.
... other plot graphical parameters.
Value
When plot is FALSE, fund returns a two-column matrix, the first column corresponding to time inseconds (x-axis) and the second column corresponding to to fundamental frequency in kHz (y-axis).NA corresponds to pause sections in wave (see threshold).No plot is produced when using at.

90 gammatone
Note
This function is based on ceps.
Author(s)
Jerome Sueur <[email protected]>.
References
Oppenheim, A.V. and Schafer, R.W. 2004. From frequency to quefrency: a history of the cepstrum.Signal Processing Magazine IEEE, 21: 95-106.
See Also
cepstro, ceps, autoc
Examples
data(sheep)# estimate the fundamental frequency at a single positionfund(sheep, f=8000, fmax=300, at=1, plot=FALSE)# track the fundamental frequency along timefund(sheep,f=8000,fmax=300,type="l")# with 50% overlap between successive sliding windows, time zoom and# amplitude filter (threshold)fund(sheep,f=8000,fmax=300,type="b",ovlp=50,threshold=5,ylim=c(0,1),cex=0.5)# overlaid on a spectrogramspectro(sheep,f=8000,ovlp=75,zp=16,scale=FALSE,palette=reverse.gray.colors.2)par(new=TRUE)fund(sheep,f=8000,fmax=300,type="p",pch=24,ann=FALSE,
xaxs="i",yaxs="i",col="black",bg="red",threshold=6)
gammatone Gammatone filter
Description
Generate gammatone filter in the time domain (impulse response).
Usage
gammatone(f, d, cfreq, n = 4, a = 1, p = 0, output = "matrix")

gammatone 91
Arguments
f sampling frequency (in Hz).
d duration (in s).
cfreq center frequency (in Hz).
n filter order (no unit).
a amplitude (linear scale, no unit).
p initial phase (in radians).
output character string, the class of the object to return, either "matrix", "Wave","Sample", "audioSample" or "ts".
Details
The gammatone function in the time domain (impulse response) is obtained with:
g(t) = a× tn−1 × e−2πβt × cos(2πcft+ φ)
with a the amplitude, t time, n the filter order, cf the center frequency, φ the initial phase.The parameter β is the equivalent rectangular bandwidth (ERB) bandwidth which varies accordingto the center frequency cf following:
β = 24.7× (4.37× cf
1000+ 1)
Value
A wave is returned. The class of the returned object is set with the argument output.
Note
Use the FFT based function, as spec or meanspec, to get the filter in the frequency domain. Seeexamples.
Author(s)
Jerome Sueur
References
Holdsworth J, Nimmo-Smith I, Patterson R, Rice P (1988) Implementing a gammatone filter bank.Annex C of the SVOS Final Report: Part A: The Auditory Filterbank, 1, 1-5.
See Also
melfilterbank

92 ggspectro
Examples
## gammatone filter in the time domain (impulse response)f <- 44100d <- 0.05res <- gammatone(f=f, d=d, cfreq=440, n=4)## time displayoscillo(res, f=f)## frequency displayspec(res, f=f)## generate and plot a bank of 32 filters from 500 to 10000 Hzn <- 32cfreq <- round(seq(500, 10000, length.out=n))res <- matrix(NA, nrow=f*d/2, ncol=n)for(i in 1:n){
res[,i] <- spec(gammatone(f=f, d=d, cfreq=cfreq[i]), f=f, dB="max0", plot=FALSE)[,2]}x <- seq(0,f/2,length.out=nrow(res))/1000plot(x=x, y=res[,1],
xlim=c(0,14), ylim=c(-60,0),type="l", col=2, las=1,xlab="Frequency (kHz)", ylab="Relative amplitude (dB)")
for(i in 2:n) lines(x, res[,i], col=2)## use the frequency domain to filter a white noise input## here around the center frequency 2000 Hzres <- gammatone(f=f, d=d, cfreq=2000, n=4)gspec <- spec(res, f=f, plot=FALSE)[,2]nw <- noisew(f=44100, d=1)nwfilt <- fir(nw, f=44100, wl=length(gspec)*2, custom=gspec)spectro(nwfilt, f=f)
ggspectro 2D-spectrogram of a time wave using ggplot2
Description
This function returns a ggplot object to draw a spectrogram with the package ggplot2. This is analternative to spectro.
Usage
ggspectro(wave, f, tlab = "Time (s)",flab = "Frequency (kHz)", alab = "Amplitude\n(dB)\n", ...)
Arguments
wave an R object.
f sampling frequency of wave (in Hz). Does not need to be specified if embeddedin wave.

ggspectro 93
tlab label of the time axis.
flab label of the frequency axis.
alab label of the amplitude axis.
... other non-graphical arguments to be passed to spectro (wl, ovlp etc).
Details
This function return the fist layer (data and aesthetic mapping) of a ggplot2 plot.See the example section to understand how to build a spectrogram and consult ggplot2 help to getwhat you exactly need.There is no way to plot the oscillogram as spectro does.
Value
A ggpot layer.
Note
This function requires ggplot2 package.
Author(s)
Jerome Sueur
References
Wickham H (2009) – ggplot2: elegant graphics for data analysis. UseR! Springer.
See Also
spectro, spectro3D, dynspec
Examples
## Not run:require(ggplot2)## first layerv <- ggspectro(tico, ovlp=50)summary(v)## using geom_tile ##v + geom_tile(aes(fill = amplitude)) + stat_contour()## coordinates flip (interest?)v + geom_tile(aes(fill = amplitude)) + stat_contour() + coord_flip()## using stat_contour ### default (not nice at all)v + stat_contour(geom="polygon", aes(fill=..level..))# set up to 30 color levels with the argument bins(vv <- v + stat_contour(geom="polygon", aes(fill=..level..), bins=30))# change the limits of amplitude and NA values as transparentvv + scale_fill_continuous(name="Amplitude\n(dB)\n", limits=c(-30,0), na.value="transparent")

94 H
# Black-and-white theme(vv + scale_fill_continuous(name="Amplitude\n(dB)\n", limits=c(-30,0),
na.value="transparent", low="white", high="black") + theme_bw())# Other colour scale (close to spectro() default output)v + stat_contour(geom="polygon", aes(fill=..level..), bins=30)
+ scale_fill_gradientn(name="Amplitude\n(dB)\n", limits=c(-30,0),na.value="transparent", colours = spectro.colors(30))
## End(Not run)
H Total entropy
Description
This function estimates the total entropy of a time wave.
Usage
H(wave, f, channel = 1, wl = 512, envt="hil", msmooth = NULL, ksmooth = NULL)
Arguments
wave an R object.
f sampling frequency of wave (in Hz). Does not need to be specified if embeddedin wave.
channel channel of the R object, by default left channel (1).
wl window length for spectral entropy analysis (even number of points). See sh.
envt the type of envelope to be used: either "abs" for absolute amplitude envelope or"hil" for Hilbert amplitude envelope. See env.
msmooth a vector of length 2 to smooth the amplitude envelope with a mean sliding win-dow. The first component is the window length (in number of points). Thesecond component is the overlap between successive windows (in %). See env.
ksmooth kernel smooth via kernel. See env.
Details
This function computes the product between the values obtained with sh and th functions.This then gives a global (time and frequency) estimation of signal entropy.The frequency mean spectrum and the amplitude envelope needed for computing respectively shand th are automatically generated. They can be controlled through wl and smooth argumentsrespectively. See examples below and examples in sh and th for implications on the results.
Value
A single value varying between 0 and 1 is returned. The value has no unit.

hilbert 95
Note
The entropy of a noisy signal will tend towards 1 whereas the entropy of a pure tone signal will tendtowards 0.
Author(s)
Jerome Sueur <[email protected]>
References
Sueur, J., Pavoine, S., Hamerlynck, O. & Duvail, S. (2008) - Rapid acoustic survey for biodiversityappraisal. PLoS ONE, 3(12): e4065.
See Also
sh, th, csh
Examples
data(orni)H(orni,f=22050)# changing the spectral parameter (wl)H(orni,f=22050,wl=1024)# changing the temporal parameter (msmooth)H(orni,f=22050,msmooth=c(20,0))
hilbert Hilbert transform and analytic signal
Description
This function returns the analytic signal of a time wave through Hilbert transform.
Usage
hilbert(wave, f, channel = 1, fftw = FALSE)
Arguments
wave an R object.
f sampling frequency of wave (in Hz). Does not need to be specified if embeddedin wave.
channel channel of the R object, by default left channel (1).
fftw if TRUE calls the function FFT of the library fftw for faster computation. SeeNotes of the function spectro.

96 ifreq
Details
The analytic signal is useful to get the amplitude envelope (see argument henv of oscillo and theinstantaneous phase or frequency (see ifreq) of a time wave.
Value
hilbert returns the analytic signal as a complex matrix. The imaginary part of this matrix is theHilbert transform.
Note
To get the Hilbert component only, use Im(Hilbert(wave)).
Author(s)
Jonathan Lees <[email protected]>. Implementation of ’fftw’ argument by Jean Marchaland Francois Fabianek.
References
Mbu Nyamsi, R. G., Aubin, T. & Bremond, J. C. 1994 On the extraction of some time dependentparameters of an acoustic signal by means of the analytic signal concept. Its application to animalsound study. Bioacoustics, 5: 187-203.
See Also
ifreq
Examples
a<-synth(f=8000, d=1, cf=1000)aa<-hilbert(a, f=8000)
ifreq Instantaneous frequency
Description
This function returns the instantaneous frequency (and/or phase) of a time wave through the com-putation of the analytic signal (Hilbert transform).
Usage
ifreq(wave, f, channel = 1, phase = FALSE, threshold = NULL,plot = TRUE, xlab = "Time (s)", ylab = NULL,ylim = NULL, type = "l", ...)

ifreq 97
Arguments
wave an R object.
f sampling frequency of wave (in Hz). Does not need to be specified if embeddedin wave.
channel channel of the R object, by default left channel (1).
phase if TRUE and plot is also TRUE plots the instantaneous phase instead of the in-stantaneous frequency.
threshold amplitude threshold for signal detection (in % ).
plot logical, if TRUE plots the instantaneous frequency or phase against time (by de-fault TRUE).
xlab title of the x axis.
ylab title of the y axis.
ylim the range of y values.
type if plot is TRUE, type of plot that should be drawn. See plot for details (bydefault "l" for lines).
... other plot graphical parameters.
Details
The instantaneous phase is the argument of the analytic signal obtained throught the Hilbert trans-form.The instantaneous phase is then unwrapped and derived against time to get the instantaneous fre-quency.There may be some edge effects at both start and end of the time wave.
Value
If plot is FALSE, ifreq returns a list of two components:
f a two-column matrix, the first column corresponding to time in seconds (x-axis)and the second column corresponding to instantaneous frequency in kHz (y-axis).
p a two-column matrix, the first column corresponding to time in seconds (x-axis)and the second column corresponding to wrapped instantaneous phase in radians(y-axis).
Note
This function is based on the analytic signal obtained with the Hilbert transform (see hilbert).The function requires the package signal.The matrix describing the instantaneous phase has one more row than the one describing the instan-taneous frequency.
Author(s)
Jerome Sueur <[email protected]>
98 istft
References
Mbu Nyamsi, R. G., Aubin, T. & Bremond, J. C. 1994 On the extraction of some time dependentparameters of an acoustic signal by means of the analytic signal concept. Its application to animalsound study. Bioacoustics, 5: 187-203.
See Also
hilbert, zc
Examples
# generate a sound with sine and linear frequency modulationsa<-synth(d=1, f=8000, cf=1500, fm=c(200,10,1000,0,0))# plot on a single graphical device the instantaneous frequency and phaseop<-par(mfrow=c(2,1))ifreq(a,f=8000,main="Instantaneous frequency")ifreq(a,f=8000,phase=TRUE,main="Instantaneous phase")par(op)
istft Inverse of the short-term Fourier transform
Description
This function returns a wave object from a complex STFT matrix by computing the inverse of theshort-term Fourier transform (STFT)
Usage
istft(stft, f, wl, ovlp=75, wn="hanning", output = "matrix")
Arguments
stft a complex matrix resulting of a short-term Fourier transform.
f sampling frequency of the original wave object (in Hz)
wl FFT window length for the analysis (even number of points).
ovlp overlap between successive FFT windows (in %, by default 75%, see the Detailssection).
wn character string specifying the FFT window name, see ftwindow (by default"hanning").
output character string, the class of the object to return, either "matrix", "Wave","audioSample" or "ts".

istft 99
Details
The function is based on the inverse of the FFT (see fft) and on the overlap add (OLA) method.The overlap percentage must satisfy the Perfect Reconstruction OLA-constraint. For the most win-dows, this constraint is:
ovlp = 100× (1− 1
4× n),
with n being a positive integer.A default value is set to 75%. We suggest not to change it.
Value
A new wave is returned. The class of the returned object is set with the argument output.
Note
The stft input data must be complex.This function is used by ffilter, lfs to respectively filter in frequency and shift in frequency asound.The function can be used to reconstruct or modify a sound. See examples.
Author(s)
Original Matlab code by Hristo Zhivomirov (Technical University of Varna, Bulgaria), translatedand adapted to R by Jerome Sueur
See Also
spectro, ffilter, lfs
Examples
## Not run:# STFT and iSTFT parameterswl <- 1024ovlp <- 75# reconstruction of the tico sound from the stft complex data matrixdata(tico)data <- spectro(tico, wl=wl, ovlp=ovlp, plot=FALSE, norm=FALSE, dB=NULL, complex=TRUE)$ampres <- istft(data, ovlp=ovlp, wn="hanning", wl=wl, f=22050, out="Wave")spectro(res)# a strange frequency filtern <- noisew(d=1, f=44100)data <- spectro(n, f=44100, wl=wl, ovlp=ovlp, plot=FALSE, norm=FALSE, dB=NULL, complex=TRUE)$ampdata[64:192, 6:24] <- 0nfilt <- istft(data, f=8000, wl=wl, ovlp=ovlp, output="Wave")spectro(nfilt, wl=wl, ovlp=ovlp)
## End(Not run)

100 itakura.dist
itakura.dist Itakuro-Saito distance
Description
Compare two distributions (e.g. two frequency spectra) by computing the Itakuro-Saito distance
Usage
itakura.dist(spec1, spec2, scale=FALSE)
Arguments
spec1 any distribution, especially a spectrum obtained with spec or meanspec (not indB). This can be either a two-column matrix (col1 = frequency, col2 = ampli-tude) or a vector (amplitude).
spec2 any distribution, especially a spectrum obtained with spec or meanspec (not indB). This can be either a two-column matrix (col1 = frequency, col2 = ampli-tude) or a vector (amplitude).
scale a logical, if TRUE the distance is scaled by dividing the distance by the length ofspec1 (or spec2).
Details
The Itakura-Saito (I-S) distance is a non-symmetric measure of the difference between two probabil-ity distributions. It is here adapted for frequency spectra. The distance is asymmetric, ie computingthe I-S distance between spec1 and spec2 is not the same as computing it between spec2 and spec1.A symmetry can be obtained by calculating the mean between the two directions.The distance is obtained following:
DI−S(spec1‖spec2) =∑ spec1
spec2− log(
spec1
spec2)− 1
Value
The function returns a list of three items:
D1 The I-S distance of ’spec2’ with respect to ’spec1’ (i.e. D(spec1 || spec2))
D2 The I-S distance of ’spec1’ with respect to ’spec2’ (i.e. D(spec2 || spec1))
D The symmetric distance (i.e. D = 0.5*(D1+D2))
If scale = TRUE the distance is divided by the length of spec1 (or spec2).
Note
The function works for both Hz and (htk-)mel scales.

kl.dist 101
Author(s)
Jerome Sueur, improved by Laurent Lellouch
See Also
kl.dist, ks.dist, logspec.dist, simspec, diffspec
Examples
# Comparison of two spectradata(tico)tico1 <- spec(tico, at=0.65, plot=FALSE)tico2 <- spec(tico, at=1.1, plot=FALSE)itakura.dist(tico1, tico2)itakura.dist(tico1, tico2, scale=TRUE)
kl.dist Kullback-Leibler distance
Description
Compare two distributions (e.g. two frequency spectra) by computing the Kullback-Leibler distance
Usage
kl.dist(spec1, spec2, base = 2)
Arguments
spec1 any distribution, especially a spectrum obtained with spec or meanspec (not indB). This can be either a two-column matrix (col1 = frequency, col2 = ampli-tude) or a vector (amplitude).
spec2 any distribution, especially a spectrum obtained with spec or meanspec (not indB). This can be either a two-column matrix (col1 = frequency, col2 = ampli-tude) or a vector (amplitude).
base the logarithm base used to compute the distance. See log.
Details
The Kullback-Leibler distance or relative entropy is a non-symmetric measure of the differencebetween two probability distributions. It is here adapted for frequency spectra. The distance isasymmetric, ie computing the K-L distance between spec1 and spec2 is not the same as computingit between spec2 and spec1. A symmetry can be obtained by calculating the mean between the twodirections.The distance is obtained following:
DK−L(spec1‖spec2) =∑
spec1× log(spec1
spec2)

102 ks.dist
Value
The function returns a list of three items:
D1 The K-L distance of ’spec2’ with respect to ’spec1’ (i.e. D(spec1 || spec2))
D2 The K-L distance of ’spec1’ with respect to ’spec2’ (i.e. D(spec2 || spec1))
D The symmetric K-L distance (i.e. D = 0.5*(D1+D2))
Note
The base of the logarithm can be changed using the argument base. When sets to base 2, theinformation is measured in units of bits. When sets to base e, the information is measured in nats.The function works for both Hz and (htk-)mel scales.
Author(s)
Jerome Sueur, improved by Laurent Lellouch
References
Kullback, S., Leibler, R.A. (1951). On information and sufficiency. Annals of Mathematical Statis-tics, 22: 79-86
See Also
ks.dist, logspec.dist, simspec, diffspec
Examples
# Comparison of two spectradata(tico)tico1 <- spec(tico, at=0.65, plot=FALSE)tico2 <- spec(tico, at=1.1, plot=FALSE)kl.dist(tico1, tico2) # log2 (binary logarithm)kl.dist(tico1, tico2, base=exp(1)) # ln (natural logarithm)
ks.dist Kolmogorov-Smirnov distance
Description
This function compares two distributions (e.g. two frequency spectra) by computing the Kolmogorov-Smirnov distance

ks.dist 103
Usage
ks.dist(spec1, spec2, f = NULL, mel = FALSE,plot = FALSE, type = "l",lty = c(1, 2), col = c(2, 4),flab = NULL, alab = "Cumulated amplitude",flim = NULL, alim = NULL,title = TRUE, legend = TRUE, ...)
Arguments
spec1 any distribution, especially a spectrum obtained with spec or meanspec (not indB). This can be either a two-column matrix (col1 = frequency, col2 = ampli-tude) or a vector (amplitude).
spec2 any distribution, especially a spectrum obtained with spec or meanspec (not indB). This can be either a two-column matrix (col1 = frequency, col2 = ampli-tude) or a vector (amplitude).
f sampling frequency of waves used to obtain spec1 and spec2 (in Hz). Notnecessary if spec1 and/or spec2 is a two columns matrix obtained with spec ormeanspec.
mel a logical, if TRUE the (htk-)mel scale is used.plot logical, if TRUE plots both cumulated spectra and their maximal distance (i.e. the
K-S distance.)type if plot is TRUE, type of plot that should be drawn. See plot for details (by
default "l" for lines).lty a vector of length 2 for the line type of spec1 and spec2 if type="l".col a vector of length 2 for the colour of spec1 and spec2.flab title of the frequency axis.alab title of the amplitude axis.flim the range of frequency values.alim range of amplitude axis.title logical, if TRUE, adds a title with D and F values.legend logical, if TRUE adds a legend to the plot.... other plot graphical parameters.
Details
The Kolmogorov distance is the maximal distance between the cumulated spectra. The functionreturns this distance and the corresponding frequency. This is an adaptation of the statistic computedby the non-parametric Kolmogorov-Smirnov test (see ks.test).
Value
The function returns a list of two items
D the Kolomogorov-Smirnov distanceF the frequency (in KHz) where the Kolmogorov-Smirnov distance was found

104 lfs
Note
There is no p-value associated to the K-S distance.If no frequency is provided, only the distance D.
Author(s)
Jerome Sueur, improved by Laurent Lellouch
See Also
kl.dist, simspec, diffspec, logspec.dist, diffcumspec, itakura.dist
Examples
## Comparison of two spectra and plot of the cumulated spectra with the K-S distancedata(tico)tico1 <- spec(tico, at=0.65, plot=FALSE)tico2 <- spec(tico, at=1.1, plot=FALSE)ks.dist(tico1, tico2, plot=TRUE)## mel scalerequire(tuneR)data(orni)orni.mel <- melfcc(orni, nbands = 256, dcttype = "t3", fbtype = "htkmel", spec_out=TRUE)orni.mel.mean <- apply(orni.mel$aspectrum, MARGIN=2, FUN=mean)tico.mel <- melfcc(tico, nbands = 256, dcttype = "t3", fbtype = "htkmel", spec_out=TRUE)tico.mel.mean <- apply(tico.mel$aspectrum, MARGIN=2, FUN=mean)ks.dist(orni.mel.mean, tico.mel.mean, f=22050, mel=TRUE, plot=TRUE)
lfs Linear Frequency Shift
Description
This function linearly shifts all the frequency content of a time wave.
Usage
lfs(wave, f, channel = 1, shift, wl = 1024, ovlp = 75,wn = "hanning", fftw = FALSE, output = "matrix")
Arguments
wave an R object.
f sampling frequency of wave (in Hz). Does not need to be specified if embeddedin wave.
channel channel of the R object, by default left channel (1).
shift positive or negative frequency shift to apply (in Hz).

lfs 105
wl window length for the analysis (even number of points, by default = 1024).
ovlp overlap between successive FFT windows (in %, by default 75%).
wn window name, see ftwindow (by default "hanning").
fftw if TRUE calls the function FFT of the library fftw. See Notes of the spectro.
output character string, the class of the object to return, either "matrix", "Wave","Sample", "audioSample" or "ts".
Details
A short-term Fourier transform is first applied to the signal (see spectro), then the frequency shiftis applied and the new signal is eventually generated using the reverse of the Fourier Transform(istft).There is therefore neither temporal modifications nor amplitude modifications.
Value
If plot is FALSE, a new wave is returned. The class of the returned object is set with the argumentoutput.
Author(s)
Jerome Sueur <[email protected]> and Thierry Aubin <[email protected]>
References
Hopp, S. L., Owren, M. J. and Evans, C. S. (Eds) 1998. Animal acoustic communication. Springer,Berlin, Heidelberg.
See Also
ffilter, spectro
Examples
data(orni)a<-lfs(orni,f=22050,shift=1000)spectro(a,f=22050)# to be compared with the original signalspectro(orni,f=22050)

106 listen
listen Play a sound wave
Description
Play a sound wave
Usage
listen(wave, f, channel=1, from = NULL, to = NULL, choose = FALSE)
Arguments
wave an R object.
f sampling frequency of wave (in Hz). Does not need to be specified if embeddedin wave.
channel channel of the R object, by default left channel (1).
from start of play (in s).
to end of play (in s).
choose logical, if TRUE start (=from) and end (=to) points can be graphically chosenwith a cursor on the oscillogram.
Note
This function is based on play but allows to read one-colum matrix, data.frame, time-series andSample objects.
Author(s)
Jerome Sueur <[email protected]> but the original play function is by Uwe Ligges (package tuneR).
See Also
play
Examples
## NOT RUN# data(tico)# listen(tico,f=22050)# listen(tico,f=22050,from=0.5,to=1.5)# listen(noise(d=1,f=8000,Wave=TRUE))## change f to play the sound a different speed# data(sheep)## normal# listen(sheep,f=8000)## two times faster

localpeaks 107
# listen(sheep,f=8000*2)## two times slower# listen(sheep,f=8000/2)
localpeaks Local maximum frequency peak detection
Description
This functions searches for local peaks of a frequency spectrum
Usage
localpeaks(spec, f = NULL, bands = 10, mel = FALSE, plot = TRUE,xlab = NULL, ylab = "Amplitude", labels = TRUE, ...)
Arguments
spec a data set resulting of a spectral analysis obtained with spec or meanspec. Canbe in dB.
f sampling frequency of spec (in Hz). Not requested if the first column of speccontains the frequency axis.
bands a numeric vector. If vector of length 1, then sets the number of bands dividingin equal parts the spectrum. If of length > 1, then takes the values as kHz limitsof the bands dividing the spectrum. These bands can be of different size. Seedetails and examples.
mel a logical, if TRUE the (htk-)mel scale is used.plot logical, if TRUE, a plot showing the peaks is returned.xlab label of the x-axis.ylab label of the y-axis.labels logical, if TRUE peak labels are plotted.... other plot graphical parameters.
Details
The function proceed as follows
• divides the spectrum in bands. The limits of the bands are set with the argument bands. Thereare two options:
– you set a number of bands with equal size by giving a single value to bands. For instance,setting bands to a value of 10 will slice the spectrum in 10 equal parts and return 10 localpeaks.
– you set the limits of the bands. This is achieve by giving a numeric vector to bands.The limits can follow a regular or irregular series. For instance attributing the vectorc(0,2,4,8) will generate the following bands [0,2[, [2,4[, [4,8] kHz. Be aware that the lastvalue should not exceed half the sampling frequency used to obtain the spectrum spec.
• uses the function fpeaks with the argument nmax set to 1.

108 logspec.dist
Value
A two-column matrix, the first column corresponding to the frequency values (x-axis) and the sec-ond column corresponding to the amplitude values (y-axis) of the peaks.
Author(s)
Jerome Sueur
See Also
fpeaks, meanspec, spec
Examples
data(sheep)spec <- meanspec(sheep, f=8000)# a specific number of bands with all the same sizelocalpeaks(spec, bands=5)# bands directly specified with a regular sequencelocalpeaks(spec, bands=seq(0,8/2,by=0.5))# bands directly specified with an irregular sequencelocalpeaks(spec, bands=c(0,0.5,1,1.5,3,4))# Amaj octave bands, note that there is no peak detection# in the higher part of the spectrum as sequence stops at 3520 Hzlocalpeaks(spec, bands=octaves(440, below=3, above=3)/1000)# melscalerequire(tuneR)mel <- melfcc(sheep, nbands = 256, dcttype = "t3", fbtype = "htkmel", spec_out=TRUE)melspec.mean <- apply(mel$aspectrum, MARGIN=2, FUN=mean)melspec.mean <- melspec.mean/max(melspec.mean) # [0,1] scalinglocalpeaks(melspec.mean, f=8000, bands=8)
logspec.dist Log-spectral distance
Description
Compare two distributions (e.g. two frequency spectra) by computing the log-spectral distance
Usage
logspec.dist(spec1, spec2, scale=FALSE)

logspec.dist 109
Arguments
spec1 any distribution, especially a spectrum obtained with spec or meanspec (not indB). This can be either a two-column matrix (col1 = frequency, col2 = ampli-tude) or a vector (amplitude).
spec2 any distribution, especially a spectrum obtained with spec or meanspec (not indB). This can be either a two-column matrix (col1 = frequency, col2 = ampli-tude) or a vector (amplitude).
scale a logical, if TRUE the distance is scaled by dividing by the square-root of thelength of spec1 (or spec2).
Details
The distance is computed according to:
DLS(spec1‖spec2) = DLS(spec2‖spec1) =
√∑10× log10(
spec1
spec2)2
If scale = TRUE the distance is divided by the length of spec1 (or spec2).
Value
A numeric vector of length 1 returning the D distance.
Note
The function works for both Hz and (htk-)mel scales.
Note
The distance is symmetric.
Author(s)
Jerome Sueur, improved by Laurent Lellouch
See Also
ks.dist, kl.dist, itakura.dist, simspec, diffspec
Examples
# Comparison of two spectradata(tico)tico1 <- spec(tico, at=0.65, plot=FALSE)tico2 <- spec(tico, at=1.1, plot=FALSE)logspec.dist(tico1, tico2)logspec.dist(tico1, tico2, scale=TRUE)

110 lts
lts Long-term spectrogram
Description
A spectrogram computed over several survey files obtained with a Wildlife Acoustics SongMeterrecorder
Usage
lts(dir, f, wl = 512,wn = "hanning", ovlp = 0, rmoffset = TRUE, FUN = mean, col = spectro.colors(30),fftw = FALSE, norm = FALSE, verbose = TRUE,tlab = "Time", ntann = NULL, flab = "Frequency (kHz)",recorder = c("songmeter", "audiomoth"), plot = TRUE, ...)
Arguments
dir a character vector, the path to the directory where the .wav files are stored ordirectly the names of the .wav files to be processed.
f sampling frequency of wave (in Hz). Does not need to be specified if embeddedin the .wav files contained in dir.
wl window length for the analysis (even number of points) (by default = 512).
wn window name, see ftwindow (by default "hanning").
ovlp overlap between two successive windows (in %).
rmoffset a logical to sepcify whether DC offset should be removed. By default TRUE.
FUN the function to apply to compute the successive frequency spectra, by defaultmean for a mean spectrum but could be other as median or var for a medianspectrum or variance spectrum.
col a list of colors or the color palette with a number of colors
fftw if TRUE calls the function FFT of the library fftw. See Notes.
norm a logical, to specify if each mean spectrum should be normalised between 0 and1 (default FALSE) before to concatenate the image.
verbose a logical, if TRUE (default) the file number and name processed are displayed inthe console.
tlab label of the time axis.
ntann a numeric of length 1, the number of axis annotations (all annotations by de-fault).
flab label of the frequency axis.
recorder the type of automatic recorder used, either a Wildlife SongMeter or a OpenAudio deveices Audiomoth.
plot logical, if TRUE plots the spectrogram (by default TRUE).
... other image graphical parameters.

lts 111
Details
The function reads each .wav file and computes its mean spectrum with meanspec. The successivemean spectra are then concatenated into a single image with the function image. The parameterswl, ovlp, and wn are those of the function meanspec.
Value
This function returns a list of three items:
time a numeric vector corresponding to the time axis.
freq a numeric vector corresponding to the frequency axis.
amp a numeric or a complex matrix corresponding to the amplitude values. Eachcolumn is a Fourier transform of length wl/2.
Author(s)
Jerome Sueur
See Also
spectro, meanspec, image, spectro3D, ggspectro, songmeter, audiomoth
Examples
## Not run:## if 'dir' contains a set of files recorded with a Wildlife Acoustics# songmeter recorder then a direct way to obtain# the spectrogram of all .wav files isdir <- "pathway-to-directory-containing-wav-files"lts(dir)# to normalise each mean spectrumlts(dir, norm=TRUE)# to change the STFT parameters used to obtain each mean spectrumlts(dir, wl=1024, wn="hamming", ovlp=50)# to change the colors and the number of time labels and to make it quietlts(dir, col=cm.colors(20), ntann=10, verbose=FALSE)## direct use of files names stored in the working directoryfiles <- c("S4A09154_20190213_150000.wav", "S4A09154_20190213_153000.wav","S4A09154_20190213_160000.wav", "S4A09154_20190213_163000.wav","S4A09154_20190213_170000.wav", "S4A09154_20190213_173000.wav","S4A09154_20190213_180000.wav", "S4A09154_20190213_183000.wav","S4A09154_20190213_190000.wav", "S4A09154_20190213_193000.wav")lts(files)
## End(Not run)

112 M
M Median of the amplitude envelope
Description
This function computes an acoustic index based on the median of the amplitude envelope.
Usage
M(wave, f, channel = 1, envt = "hil", plot = FALSE, ...)
Arguments
wave an R object.
f sampling frequency of wave (in Hz). Does not need to be specified if embeddedin wave.
channel channel of the R object, by default left channel (1).
envt the type of envelope to be used: either "abs" for absolute amplitude envelopeor "hil" for Hilbert amplitude envelope. See env.
plot logical, if TRUE returns a plot of the amplitude envelope of wave (by defaultFALSE).
... other env parameters, in particular smoothing parameters. See env.
Details
This amplitude index M is computed according to:
M = A(t)× 21−depth
with0 ≤M ≤ 1
where A(t) is the amplitude envelope and depth is the signal digitization depth in number of bits.
Value
A numeric vector of length 1 between 0 and 1, without unit.
Author(s)
Jerome Sueur and Marion Depraetere
References
Depraetere M, Pavoine S, Jiguet F, Gasc A, Duvail S, Sueur J (2012) Monitoring animal diversityusing acoustic indices: implementation in a temperate woodland. Ecological Indicators, 13, 46-54.

meandB 113
See Also
env, AR
Examples
data(tico)M(tico)# smoothing the amplitude may change slightly the resultM(tico, msmooth=c(500,50), plot=TRUE)
meandB Mean of dB values
Description
This function calculates the mean of dB values
Usage
meandB(x, level="IL")
Arguments
x a numeric vector or a numeric matrix.level intensity level ("IL") or sound pressure level ("SPL")
Details
The mean of dB values is not linear. See examples.
Value
A numeric vector of length 1 is returned.
Author(s)
Jerome Sueur and Zev Ross
References
Hartmann, W. M. 1998 Signals, sound and sensation. New York: Springer.
See Also
sddB, moredB, convSPL, dBweight
Examples
meandB(c(89,90,95))

114 meanspec
meanspec Mean frequency spectrum of a time wave
Description
This function returns the mean frequency spectrum (i.e. the mean relative amplitude of the fre-quency distribution) of a time wave. Results can be expressed either in absolute or dB data.
Usage
meanspec(wave, f, channel = 1, wl = 512, wn = "hanning", ovlp = 0, fftw = FALSE,norm = TRUE, PSD = FALSE, PMF = FALSE, FUN = mean, correction = "none", dB = NULL,dBref = NULL, from = NULL, to = NULL, identify = FALSE,col = "black", cex = 1, plot = 1, flab = "Frequency (kHz)",alab = "Amplitude", flim = NULL, alim = NULL, type ="l", ...)
Arguments
wave an R object.
f sampling frequency of wave (in Hz). Does not need to be specified if embeddedin wave.
channel channel of the R object, by default left channel (1).
wl length of the window for the analysis (even number of points, by default = 512).
wn window name, see ftwindow (by default "hanning").
ovlp overlap between two successive analysis windows (in %).
fftw if TRUE calls the function FFT of the library fftw. See Notes of spectro.
norm if TRUE the mean spectrum is normalised (i. e. scaled) by its maximum.
PSD if TRUE return Power Spectra Density, i. e. the square of the spectra.
PMF if TRUE return Probability Mass Function, i. e. the probability distribution offrequencie.
FUN the function to apply on the rows of the STFT matrix, by default mean for amean spectrum but could be other as median or var for a median spectrum orvariance spectrum.
correction a character vector of length 1 to apply an amplitude ("amplitude") or an energy("energy") correction to the FT window. This argument is useful only when onewish to obtain absolute values that is when norm=FALSE and PMF=FALSE. Bydefault no correction is applied ("none").
dB a character string specifying the type dB to return: "max0" for a maximum dBvalue at 0, "A", "B", "C", "D", and "ITU" for common dB weights.
dBref a dB reference value when dB is not NULL. NULL by default but should be set to2*10e-5 for a 20 microPa reference (SPL).
from start mark where to compute the spectrum (in s).

meanspec 115
to end mark where to compute the spectrum (in s).identify to identify frequency and amplitude values on the plot with the help of a cursor.col colour of the spectrum.cex pitch size.plot if 1 returns frequency on x-axis, if 2 returns frequency on y-axis, (by default 1).flab title of the frequency axis.alab title of the amplitude axis.flim range of frequency axis (in kHz).alim range of amplitude axis.type if plot is TRUE, type of plot that should be drawn. See plot for details (by
default "l" for lines).... other plot graphical parameters.
Details
See examples of spec. This function is based on fft.
Value
If plot is FALSE, meanspec returns a two columns matrix, the first column corresponding to thefrequency axis, the second column corresponding to the amplitude axis.If identify is TRUE, spec returns a list with two elements:
freq the frequency of the points chosen on the spectrum
amp the relative amplitude of the points chosen on the spectrum
Warning
The argument peaks is no more available (version > 1.5.6). See the function fpeaks for peak(s)detection.
Note
The argument fftw can be used to try to speed up process time. When set to TRUE, the Fouriertransform is computed through the function FFT of the package fftw. This pacakge is a wrapperaround the fastest Fourier transform of the free C subroutine library FFTW (http://www.fftw.org/). FFT should be then installed on your OS.
Author(s)
Jerome Sueur <[email protected]>
See Also
spec,fpeaks, localpeaks, dynspec, corspec, diffspec, simspec, fft.

116 mel
Examples
data(orni)# compute the mean spectrum of the whole time wavemeanspec(orni,f=22050)# compute the mean spectrum of a time wave section (from 0.32 s to 0.39 s)meanspec(orni,f=22050,from=0.32,to=0.39)# different window lengthsop<-par(mfrow=c(3,1))meanspec(orni,f=22050,wl=256)title("wl=256")meanspec(orni,f=22050,wl=1024)title("wl=1024")meanspec(orni,f=22050,wl=4096)title("wl=4096")par(op)# different overlap values (almost no effects here...)op<-par(mfrow=c(3,1))meanspec(orni,f=22050)title("ovlp=0")meanspec(orni,f=22050,ovlp=50)title("ovlp=50")meanspec(orni,f=22050,ovlp=95)title("ovlp=95")par(op)# use of flim to zoom inop<-par(mfrow=c(2,1))meanspec(orni,f=22050)title("zoom in")meanspec(orni,f=22050,wl=512,flim=c(4,6))par(op)# comparaison of spectrum and mean spectrumop<-par(mfrow=c(2,1))spec(orni,f=22050)title("spec()")meanspec(orni,f=22050)title("meanspec()")par(op)# log scale on frequency axismeanspec(orni, f=22050, log="x")# median spectrummeanspec(orni,f=22050, FUN=median)# variance spectrummeanspec(orni,f=22050, FUN=var)
mel Hertz / Mel conversion
Description
This function converts Hertz data in Mel data.

mel 117
Usage
mel(x, inverse = FALSE)
Arguments
x a value in Hertz (or in Mel if inverse is TRUE)inverse logical, if TRUE converts the Mel data in Hertz data.
Details
Hertz to mel conversion is computed according to:
m = 1127.01048× log (1 + (f
700))
with m in Mel and f in Hertz.Mel to Hertz conversion (when inverse is TRUE) is therefore computed according to:
f = 700× (em
1127.01048 − 1)
with f in Hertz and m in Mel.
Value
A corresponding R object is returned.
Note
The Mel scale is a perceptual scale of pitches judged by listeners to be equal in distance from oneanother. The name Mel comes from the word melody to indicate that the scale is based on pitchcomparisons. The reference point between this scale and normal frequency measurement is definedby equating a 1000 Hz tone, 40 dB above the listener’s threshold, with a pitch of 1000 mels.
Author(s)
Jerome Sueur <[email protected]>
References
Stevens, S. S., Volkman, J. and Newman, E. B. 1937. A scale for the measurement of psychologicalmagnitude pitch. Journal of the Acoustical Society of America, 8: 185-190.
See Also
melfilterbank
Examples
x<-seq(0,10000,by=50)y<-mel(x)plot(x,y,type="l",xlab = "f (hertz)", ylab = "f (mel)",
main = "Mel scale", col="red")

118 melfilterbank
melfilterbank Mel-filter bank for MFCC computation
Description
This functions returns graphically and numerically the Mel-filters used to compute MFCC.
Usage
melfilterbank(f = 44100, wl = 1024,minfreq = 0, maxfreq = f/2, m = 20,palette, alpha = 0.5, plot = FALSE)
Arguments
f sammpling frequency (in Hz).
wl the Fourier window length (in number of samples).
minfreq the minimum (or lower) frequency of the filter bank (in Hz).
maxfreq the maximum (or upper) frequency of the filter bank (in Hz).
m the total number of filters.
palette an optional colour palette if plot is TRUE.
alpha alpha-transparency when a colour palette is used.
plot if TRUE all filters are displayed in a single plot.
Value
A list of 3 items:
central.freq the kHz central frequencies of the filters,
freq the kHz frequency scale,
amp the amplitude of the filters, scaled between 0 and 1.
Note
These triangular filters are used for computing MFCCs.
Author(s)
Jerome Sueur
References
Sharan RV & Moir TJ (2016) Applications and advancements in automatic sound recognition. Neu-rocomputing.

micsens 119
See Also
mel, gammatone
Examples
## default valuesmelfilterbank(plot=TRUE)## with color surfacesmelfilterbank(palette=cm.colors, plot=TRUE)## values changedres <- melfilterbank(f=16000, wl=512, minfreq=300, plot=TRUE)## plot the 1st filter onlyplot(res$freq, res$amp[,1], type="l", xlab="Frequency (kHz)", ylab="Amplitude")## plot the last filter onlyplot(res$freq, res$amp[,ncol(res$amp)], type="l", xlab="Frequency (kHz)", ylab="Amplitude")## get the kHz central frequencies of the succesive filtersres$central.freq
micsens Microphone sensitivity and conversion
Description
This function converts microphone sensitivity from mV/Pa to dB.
Usage
micsens(x, sref = 1, inverse = FALSE)
Arguments
x a measured sensitivity in mV/Pa (or in dB if inverse is TRUE)
sref the sensitivity reference (by default equals to 1 V/Pa)
inverse logical, if TRUE, the inverse conversion from dB to mV/Pa is computed.
Details
The sensitivity S in dB is calculated according to:
SdB = 20× log10(s
sref)
with s the measured sensitivity in mv/Pa and sref the reference sensitivity (by default 1 mV/Pa).
Value
A numeric value in dB re 1V/Pa with default settings, in mV/Pa if inverse is set to FALSE.

120 moredB
Author(s)
Jerome Sueur <[email protected]>
See Also
convSPL
Examples
# conversion of a sensitivity of 2 mV/Pamicsens(2)# conversion of a sensitivity of -54 dB re 1V/Pamicsens(-54,inverse=TRUE)
moredB Addition of dB values
Description
This functions calculates the sum of dB values
Usage
moredB(x, level="IL")
Arguments
x a numeric vector or numeric matrix.
level intensity level ("IL") or sound pressure level ("SPL")
Details
The addition of dB values is not linear. See examples.
Value
A numeric vector of length 1.
Author(s)
Jerome Sueur
References
Hartmann, W. M. 1998 Signals, sound and sensation. New York: Springer.
See Also
meandB, sddB, convSPL, dBweight

mutew 121
Examples
# two sources of 60 dB give an intensity level of 63 dBmoredB(c(60,60))# addition of three sourcesmoredB(c(89,90,95))
mutew Replace time wave data by 0 values
Description
This functions replaces a time wave or a section of a time wave by 0 values. For a time wavedescribing a sound, this corresponds in muting the sound or a section of it.
Usage
mutew(wave, f, channel = 1, from = NULL, to = NULL, choose = FALSE, plot = TRUE,output = "matrix", ...)
Arguments
wave an R object.
f sampling frequency of wave (in Hz). Does not need to be specified if embeddedin wave.
channel channel of the R object, by default left channel (1).
from start of the silence section (in s).
to end of the silence section (in s).
choose logical, if TRUE start (=from) and end (=to) points can be graphically chosenwith a cursor on the oscillogram.
plot logical, if TRUE returns an oscillographic plot of wave with the new silence sec-tion (by default TRUE).
output character string, the class of the object to return, either "matrix", "Wave","Sample", "audioSample" or "ts".
... other oscillo graphical parameters.
Details
By default, from and from are NULL, this results in completely muting wave.
Value
If plot is FALSE, a new wave is returned. The class of the returned object is set with the argumentoutput.

122 NDSI
Author(s)
Jerome Sueur <[email protected]>
See Also
oscillo, addsilw, cutw, deletew,fadew, pastew, revw, zapsilw
Examples
data(tico)mutew(tico,f=22050,from=0.5,to=0.9)
NDSI Normalized Difference Soundscape Index
Description
This function computes the Normalized Difference Soundscape Index as described by Kasten et al.(2012).
Usage
NDSI(x, anthropophony = 1, biophony = 2:8, max = FALSE)
Arguments
x a two-column numeric matrix computed with soundscapespec.
anthropophony a numeric vector defining the frequency band(s) of the anthropophony (in kHz).
biophony a numeric vector defining the frequency band(s) of the biophony (in kHz).
max a logical, if TRUE then defines the biophony as the maximum - not the sum - ofthe 2 and 8 kHz frequency bands
Details
NDSI aims at estimating the level of anthropogenic disturbance on the soundscape by computingthe ratio of human-generated (anthropophony) to biological (biophony) acoustic components foundin field collected sound samples. In terms of frequency, the anthropophony is defined as the [1-2[kHz frequency bin and the biophony as the [2-8[ kHz frequency bins of a soundscape frequencyspectrum (see soundscapespec).
NDSI is computed according to:
NDSI =(biophony − anthropophony)
(biophony + anthropophony)
NDSI varies between -1 and +1, where +1 indicates a signal containing no anthropophony.

noisew 123
Value
A numeric vector of length 1 giving the NDSI value.
Author(s)
Jerome Sueur
References
Kasten, E.P., Gage, S.H., Fox, J. & Joo, W. (2012). The remote environmental assessment labo-ratory’s acoustic library: an archive for studying soundscape ecology. Ecological Informatics, 12,50-67.
See Also
soundscapespec, SAX, NDSI
Examples
## Note that 'tico' is not a soundscape recording...data(tico)spec <- soundscapespec(tico, plot=FALSE)NDSI(spec)NDSI(spec, max=TRUE)
noisew Generate noise
Description
This function generates noise.
Usage
noisew(f, d, type="unif", listen = FALSE, output = "matrix")
Arguments
f sampling frequency of the signal to be generated (in Hz)
d duration of the signal to be generated.
type a character string to specify the type of noise, either "unif" or "gaussian".
listen if TRUE the new sound is played back.
output character string, the class of the object to return, either "matrix", "Wave","Sample", "audioSample" or "ts".

124 notefreq
Details
Uniform noise is generated using runif and gaussian noise is based on rnorm
Value
A new wave is returned. The class of the returned object is set with the argument output.
Author(s)
Jerome Sueur <[email protected]>
See Also
synth, pulse
Examples
# add noise to a synthetic signala<-noisew(d=1,f=8000)b<-synth(f=8000,d=1,cf=2000,plot=FALSE)c<-a+bspectro(c,f=8000)
notefreq Frequency of a muscical note
Description
This function computes the frequency of a musical note (Equal temperament)
Usage
notefreq(note, ref = 440, octave = 3)
Arguments
note a numerical or a character vector. See Note.ref a numerical vector of length 1 for the reference frequency.octave a numerical vector of length for the octave number.
Details
The frequency is computed according to:
f = ref × 2octave−3+note−10
12
with:ref = reference frequency,octave = octave number, andnote = rank of the note along the scale.

octaves 125
Value
The frequency in Hz is returned.
Note
The note can be given in two ways. The first solution is to give the rank of the note along the scale(e.g. rank 10 for A) or to give its names in characters with the following notation: C, D, E, F, G, A,B.
Author(s)
Jerome Sueur
See Also
octaves
Examples
# Some notes frequency (use apply-like functions when dealing with character strings)sapply(c("C", "A", "Gb"), notefreq)
# C major scale plotn <- 1:12freq <- notefreq(n)names <- c("C", "C#", "D", "D#", "E", "F", "F#", "G", "G#", "A", "A#", "B")plot(n, freq, pch=19, cex=1.5,
xlab = "Note name",ylab = "Frequency (Hz)",xaxt="n", las=1, main="Third octave")
axis(side=1, at=n, labels=names)abline(h=freq, col="lightgrey")
# C major scale soundf <- 2000 # sampling rates <- NULLfor (i in 1:length(freq))
{tmp <- synth(d=0.5, f=f, cf=freq[i])s <- pastew(s, tmp, at="start", f)
}spectro(s, f, ovlp=75)
octaves Octave values
Description
This functions returns the frequency values of the octaves below and above a specific frequency

126 orni
Usage
octaves(x, below = 3, above = 3)
Arguments
x a numeric vector, frequency of the note in Hz or kHz.
below the number of octaves below x.
above the number of octaves above x.
Value
A numeric vector with the octave series in frequency (Hz or kHz depending on x unit).
Author(s)
Jerome Sueur
See Also
notefreq
Examples
names <- c("C","D","E","F","G","A","B")values <- c(261.63, 293.66, 329.64, 349.23, 392, 440, 493.88)res <- sapply(values, FUN=octaves)/1000op <- par(las=1,mfrow=c(2,1))par(mar=c(0,4,1,1))matplot(x=1:7, y=res, t="o", pch=names, xlab="",
ylab="Frequency (kHz) [linear scale]", col=rainbow(7), xaxt="n")par(mar=c(4.5,4,0,1))matplot(x=1:7, y=res, t="o", pch=names, xlab="Octave",
ylab="Frequency (kHz) [log scale]", col=rainbow(7), ylog=TRUE, log="y")par(op)
orni Song of the cicada Cicada orni
Description
Recording of a calling song section of the Mediterranean cicada Cicada orni.
Usage
data(orni)
Format
A Wave object.

oscillo 127
Details
Duration = 0.719 s. Sampling frequency = 22050 Hz.
Source
Recording by Jerome Sueur.
Examples
data(orni)oscillo(orni,f=22050)
oscillo Show a time wave as an oscillogram
Description
This graphical function displays a time wave as an oscillogram in a single or multi-frame plot. Theenvelope of the wave can also be shown.
Usage
oscillo(wave, f, channel = 1, from = NULL, to = NULL, fastdisp = FALSE,scroll = NULL, zoom = FALSE, k=1, j=1, cex,labels = TRUE, tlab = "Time (s)", alab = "Amplitude",byrow = TRUE, identify = FALSE, nidentify = NULL,plot = TRUE, colwave = "black",coltitle = "black", cextitle = 1.2, fonttitle = 2,collab = "black", cexlab = 1, fontlab = 1,colline = "black",colaxis = "black", cexaxis = 1, fontaxis = 1,coly0 = "lightgrey",tcl = 0.5, title = FALSE, xaxt="s", yaxt="n", type="l", bty = "l")
Arguments
wave an R object.
f sampling frequency of wave (in Hz). Does not need to be specified if embeddedin wave.
channel channel of the R object, by default left channel (1).
from start of the oscillogram (in s).
to end of the oscillogram (in s).
fastdisp faster graphic display for long wave. The oscillogram is displayed/saved fasterin the graphic device/ graphic file when set to TRUE, with a cost on graphicresolution.

128 oscillo
scroll a numeric of length 1 allowing to move along the time wave using a slider panel.This numeric corresponds to the number of successive windows dividing thetime wave.
zoom time zoom in with start and end points chosen on the oscillogram with a cursor.
k number of horizontal sections (by default =1).
j number of vertical sections (by default =1).
cex Pitch size if type = "p".
labels if TRUE plots time and amplitude labels (by default TRUE).
tlab Label of time axis.
alab Label of amplitude axis.
byrow logical, if TRUE, the sections are filled by rows, otherwise the sections are filledby colmuns (by default TRUE).
identify returns the time and amplitude coordinates of points chosen with a cursor on theoscillogram.
nidentify a numeric vector of length 1, specifies the number of points to identified on waveif identify is TRUE.
plot logical, if TRUE returns an oscillographic or envelope plot of wave(by defaultTRUE).
colwave colour of the oscillogram or of the envelope.
coltitle if title is TRUE, colour of the title.
cextitle character size for the title.
fonttitle font for the title.
cexlab character size for axes labels.
fontlab font for axes labels.
collab colour of axes labels.
colline colour of axes line.
colaxis colour of the axis annotation.
fontaxis font of axis annotation.
cexaxis magnification for axis annotation.
coly0 colour of the y=0 line.
tcl length of tick marks.
title TRUE to add a title with information on wave duration and f, FALSE to live itblank, or a character string to add any desired title.
xaxt equivalent to xaxt of par (by default ="s").
yaxt equivalent to yaxt of par (by default ="n").
type type of plot, by default "l". Use "n" for no plot.
bty the type of box to be drawn around the oscillogram.

oscillo 129
Value
Data are returned as one-column matrix if plot is FALSE. identify returns a two-column matrixwith the time and amplitude coordinates of points successively chosen on the oscillogram.
Note
zoom is similar to but more visual than from and/or to. zoom and identify do work with a single-frame window only (i. e. with k = 1 and j = 1).Press ‘Stop’ button of the tools bar after choosing the appropriate points on the oscillogram.
Author(s)
Jerome Sueur <[email protected]> and Caroline Simonis <[email protected]>.
See Also
dynoscillo, oscilloST, cutw, pastew, timer
Examples
data(tico)# a simple oscillogram of a bird songoscillo(tico)# zoom inop<-par(mfrow=c(4,1),mar=c(4.5,4,2,2))oscillo(tico,22050,cexlab=0.75)oscillo(tico,22050,from=0.5,to=0.9,cexlab=0.75)oscillo(tico,22050,from=0.65,to=0.75,cexlab=0.75)oscillo(tico,22050,from=0.68,to=0.70,cexlab=0.75)par(op)# the same divided in four linesoscillo(tico,f=22050,k=4,j=1)# the same divided in different numbers of lines and columnsoscillo(tico,f=22050,k=4,j=4)oscillo(tico,f=22050,k=2,j=2,byrow=TRUE)oscillo(tico,f=22050,k=2,j=2,byrow=FALSE)# overplot of oscillographic and envelope representationsoscillo(tico,f=22050)par(new=TRUE)env(tico,f=22050,colwave=2)# full colour modifications in a two-frame oscillogramop<-par(bg="grey")oscillo(tico,f=22050,k=4,j=1,title=TRUE,colwave="black",
coltitle="yellow",collab="red",colline="white",colaxis="blue",coly0="grey50")
par(op)# change the titledata(orni)oscillo(orni,f=22050,title="The song of a famous cicada")# move along the signal using scroll

130 oscilloST
## Not run:require(rpanel)oscillo(tico,f=22050,scroll=8)## End(Not run)
oscilloST Show a stereo time wave as oscillograms
Description
This graphical function displays a stereo (2 channels) time wave as an oscillogram in a two-frameplot. The envelope of the wave can also be shown.
Usage
oscilloST(wave1, wave2 = NULL, f, from = NULL, to = NULL,fastdisp = FALSE,identify = FALSE, plot = TRUE, colwave1 = "black",colwave2 = "blue", coltitle = "black",collab = "black", cexlab = 1, fontlab = 1, colaxis = "black",cexaxis = 1, coly01 = "grey47", coly02 = "black", title = FALSE,bty = "l")
Arguments
wave1 a first R object.
wave2 a second R object.
f sampling frequency of wave (in Hz). Does not need to be specified if embeddedin wave.
from start of the oscillogram (in s).
to end of the oscillogram (in s).
fastdisp faster graphic display for long wave. The stereo oscillogram is displayed/savedfaster in the graphic device/ graphic file when set to TRUE, with a cost on thegraphic resolution.
identify returns the time coordinate of points chosen with a cursor on the bottom oscil-logram.
plot logical, if TRUE returns an oscillographic or envelope plot of wave(by defaultTRUE).
colwave1 colour of the oscillogram or of the envelope of wave1.
colwave2 colour of the oscillogram or of the envelope of wave2.
coltitle if title is TRUE, colour of the title.
collab colour of axes title.
cexlab character size for axes title.

pastew 131
fontlab font for axes title.
colaxis colour of the axes
cexaxis mangification for axes annotation.
coly01 colour of the y=0 line of wave1.
coly02 colour of the y=0 line of wave1.
title logical, if TRUE plots the title with information on time and f (by default FALSE).
bty the type of box to be drawn around the oscillogram.
Value
Data are returned as two-column matrix if plot is FALSE. identify returns a numeric object withthe time coordinate of points successively chosen on the bottom oscillogram.
Author(s)
Jerome Sueur and Caroline Simonis.
See Also
oscillo, dynoscillo
Examples
a<-synth(f=8000,d=1,cf=2000,am=c(50,10),plot=FALSE)b<-synth(f=8000,d=1,cf=1000,fm=c(0,0,2000,0,0),plot=FALSE)oscilloST(a,b,f=8000)
pastew Paste a time wave to another one
Description
This function pastes a first time wave to a second one. The time wave to be pasted, the time waveto be completed and the resulting time wave can be displayed in a three-frame oscillographic plot.
Usage
pastew(wave1, wave2, f, channel = c(1,1), at = "end",join = FALSE, tjunction = 0,choose = FALSE, plot = FALSE,marks = TRUE, output = "matrix", ...)

132 pastew
Arguments
wave1 a first R object.
wave2 a second R object.
f sampling frequency of wave (in Hz). Does not need to be specified if embeddedin wave.
channel channel of the R objects, by default left channel (1) for each object.
at wave2 position in seconds where wave1 will be pasted into. Can be also specifiedas "start", "middle" or "end".
join if TRUE the two waves will be pasted and jointed by removing the last point ofwave2. See examples.
tjunction a numeric vector to remove clicks at the junction of ‘wave1’ and ‘wave2’. Thevalue specifies the duration in seconds where the real vales will be replaced bya linear interpolation. This duration should be a few milliseconds.
choose logical, if TRUE the point where wave1 will be pasted into wave2 (=at) can begraphically chosen with a cursor.
plot logical, if TRUE returns an oscillographic plot of wave1, wave2 and wave1 +wave2 (by default FALSE).
marks logical, if TRUE shows where wave1 has been pasted (by default TRUE).
output character string, the class of the object to return, either "matrix", "Wave","Sample", "audioSample" or "ts".
... other oscillo graphical parameters.
Details
If plot is TRUE returns a two-frame plot with three waves:(1) the wave to be pasted (wave1),(2) the wave to be completed (wave2),(3) the resulting wave.
Value
If plot is FALSE, a new wave is returned. The class of the returned object is set with the argumentoutput.
Author(s)
Jerome Sueur, improved by Laurent Lellouch
See Also
oscillo, addsilw, cutw, deletew, fadew, mutew , revw, repw, timelapse , zapsilw

peewit 133
Examples
data(tico)# double a data set describing a bird songa<-pastew(tico,tico,f=22050)oscillo(a,f=22050)# a direct way to see what has been pastedpastew(tico,tico,f=22050,plot=TRUE)# cut a section and then paste it at the beginninga<-cutw(tico, f=22050, from=0.5, to=0.9)pastew(a,tico,f=22050,at="start",plot=TRUE)# or paste it at a specific locationpastew(a,tico,f=22050,at=1.4,plot=TRUE)# setting the argument 'join' to TRUE might be useful# to smooth pasting when some phase problem occur# generate two sine wavesa <- synth(cf=50, f=400, d=0.1)b <- synth(cf=100, f=400, d=0.1)# paste it with 'join' turned to FALSE# there is a click at the junction between the two wavespastew(a, b, f=400, plot=TRUE)# that can be removed by setting 'join' to TRUEpastew(a, b, f=400, join=TRUE, plot=TRUE)# or by using the argument 'tjunction'pastew(a, b, f=400, tjunction=0.01, plot=TRUE)
peewit Song of the bird Vanellus vanellus
Description
Recording of a song emitted by a peewit (lapwing) male Vanellus vanellus
Usage
data(peewit)
Format
A Wave object.
Details
Duration = 0.706 s. Sampling frequency = 22050 hz.
Source
Recording by Thierry Aubin.
134 phaseplot
Examples
data(peewit)oscillo(peewit,f=22050)
pellucens Calling song of the tree cricket Oecanthus pellucens
Description
Recording of a calling song section emitted by the European tree cricket Oecanthus pellucens.
Usage
data(pellucens)
Format
A Wave object.
Details
Duration = 3.309 s. Sampling frequency = 11025 hz.
Source
Recording by Jerome Sueur.
Examples
data(pellucens)oscillo(pellucens,f=11025)
phaseplot Phase-phase 2D or 3D plot of a time wave
Description
This function returns a 2D or 3D representation of a time wave according to its first, second andpossibly third derivatives.
Usage
phaseplot(wave, f, channel = 1, dim = 3, plot = TRUE, type = "l",xlab = "1st derivative",ylab = "2nd derivative",zlab = "3rd derivative", ...)

phaseplot 135
Arguments
wave an R object.f sampling frequency of wave (in Hz). Does not need to be specified if embedded
in wave.channel channel of the R object, by default left channel (1).dim a vector of lenght 1, the number of dimensions of the plot. Can be either 2 or 3.plot logical, if TRUE plots phase-phase plot (by default TRUE).type type of plot that should be drawn. See plot for details (by default "l" for lines).xlab title of the x axis.ylab title of the y axis.zlab title of the z axis.... other plot or plot3d graphical parameters of the package rgl.
Value
If plot is FALSE then a 2 or 3 column matrix is returned. The position of the column is related tothe order of the derivative (i. e. first colum = first derivative.
Note
Phase-phase plot can be used to test non-linearity.
Author(s)
Jerome Sueur
References
For use of such plots see: Rice AN, Land BR, Bass AH (2011) - Nonlinear acoustic complexity ina fish ’two-voice’ system. Proceedings of the Royal Society B, in press.
See Also
phaseplot2
Examples
## Not run:require(rgl)data(tico)phaseplot(tico)
## End(Not run)s <- synth(d=0.05, f=44100, cf=440, out="Wave")n <- noisew(d=0.05, f=44100, out="Wave")par(mfrow=c(2,1))phaseplot(s, dim=2)phaseplot(n, dim=2)

136 phaseplot2
phaseplot2 Phase-phase 2D plot of a time wave
Description
This functions returns a 2D representation of a time wave against a delayed version of itself.
Usage
phaseplot2(wave, f, channel = 1, tau = 1, type = "l",xlab = "x(t)",ylab = paste("x(t+", tau, ")", sep = ""), ...)
Arguments
wave an R object.
f sampling frequency of wave (in Hz). Does not need to be specified if embeddedin wave.
channel channel of the R object, by default left channel (1).
tau the time delay to apply in number of samples.
type type of plot that should be drawn. See plot for details (by default "l" for lines).
xlab title of the x axis.
ylab title of the y axis.
... other plot parameters.
Details
The principle consists in displaying in a single x-y graph the original time wave with a delayedversion of itself. The delay is controlled with the argument tau that needs to be specified in numberof samples. The conversion of tau in second is obtained by calculating tau/f, with f the samplingfrequency.
Value
Nothing is returned except an x-y plot.
Note
Phase-phase plot can be used to test non-linearity.
Author(s)
Jerome Sueur
References
Kantz H, Schreiber T (2003) Non linear time series analysis. Cambridge University Press.

playlist 137
See Also
phaseplot
Examples
s <- synth(d=0.05, f=44100, cf=440, out="Wave")n <- noisew(d=0.05, f=44100, out="Wave")par(mfrow=c(2,1))phaseplot2(s)phaseplot2(n)
playlist Play a list of sound files
Description
This function works as a playlist, ie it plays back a list of sound files.
Usage
playlist(directory, sample = FALSE, loop = 1)
Arguments
directory a character vector indicating the path to the directory where sound files to playedare saved.
sample a logical, if TRUE the order of sounds files to be played back is shuffled.
loop a numeric vector of length 1, number of loops.
Details
The success of using this function depends on the wave player in use. This works particularly wellwith SoX under Linux. The type of files (.mp3, .wav, .ogg etc) depends on the wave player as well)
Value
None. Listen and enjoy!
Note
The function is mainly based on play
Author(s)
Jérôme Sueur

138 preemphasis
See Also
play, listen
Examples
## Not run:playlist("MyMusic", sample = TRUE, loop=2)
## End(Not run)
preemphasis Pre-emphasis speech filter
Description
A pre-emphasis frequency filter for speech
Usage
preemphasis(wave, f, channel = 1, alpha = 0.9,plot = FALSE, output = "matrix", ...)
Arguments
wave an R object.
f sampling frequency of wave (in Hz). Does not need to be specified if embeddedin wave.
channel channel of the R object, by default left channel (1).
alpha time constant, see Details.
plot a logical, if TRUE plots the spectrogram of the filtered wave and the frequencyresponse of the comb filter.
output character string, the class of the object to return, either 'matrix', 'Wave','Sample', 'audioSample' or 'ts'.
... other arguments to be passed to spectro except scale and osc that are set bydefault to FALSE.
Details
The function applies a pre-emphasis filter usually applied in speech analysis. The filter is a kindof high-pass frequency filter that amplifies the high-frequency content of the sample. The filter isdefined with:
y(n) = x(n)− α× x(n− 1)
where alpha is a time constant usually set between 0.9 and 1.
The frequency response of the filter is obtained with:
H(f) = 1 + a2 − 2× α× cos(2× π × f/fs)

pulsew 139
Value
A new wave is returned. The class of the returned object is set with the argument output.
Author(s)
Jerome Sueur
See Also
bwfilter, combfilter, ffilter, fir,lfs, afilter
Examples
data(sheep)fc <- 150f <- [email protected] <- exp(-2*pi*fc/f)res <- preemphasis(sheep, alpha=alpha, output="Wave")
pulsew Generate rectangle pulse
Description
This function generates a rectangle pulse.
Usage
pulsew(dbefore, dpulse, dafter, f, plot = FALSE, output = "matrix", ...)
Arguments
dbefore duration of the silent period before the pulse
dpulse duration of the pulse to generate
dafter duration of silent period after the pulse
f sampling frequency of the signal to be generated (in Hz)
plot logical, if TRUE returns an oscillographic plot of the pulse generated (by defaultFALSE).
output character string, the class of the object to return, either "matrix", "Wave","Sample", "audioSample" or "ts".
... other plot parameters.
Value
If plot is FALSE, a new wave is returned. The class of the returned object is set with the argumentoutput.

140 Q
Author(s)
Jerome Sueur <[email protected]>
See Also
synth, noisew
Examples
pulsew(dbefore=0.5,dpulse=0.1,dafter=0.3,f=8000,plot=TRUE)
Q Resonance quality factor of a frequency spectrum
Description
This function estimates the frequency pureness of a time wave by returning the resonant qualityfactor Q at a specific dB level.
Usage
Q(spec, f = NULL, level = -3, mel = FALSE, plot = TRUE, colval = "red",cexval = 1, fontval = 1, flab = NULL,alab = "Relative amplitude (dB)", type = "l", ...)
Arguments
spec a data set resulting of a spectral analysis obtained with spec, or meanspec (indB). This can be either a two-column matrix (col1 = frequency, col2 = ampli-tude) or a vector (amplitude).
f sampling frequency of the wave used to obtain spec (in Hz). Not necessary ifspec is a two columns matrix obtained with spec or meanspec.
level frequency bandwidth set by an amplitude value relative to spectrum (in dB).
mel a logical, if TRUE the (htk-)mel scale is used.
plot logical, if TRUE returns the spectrum with Q plotted (by default TRUE).
colval colour of plotting Q.
cexval character size of plotting Q.
fontval font of plotting Q.
flab title of the frequency axis.
alab title of the amplitude axis.
type if plot is TRUE, type of plot that should be drawn. See plot for details (bydefault "l" for lines).
... other plot graphical parameters.

Q 141
Details
A high Q value indicates a highly resonant system.
Value
A list is returned with the following four items:
Q a numeric vector of length 1 returning the Q factor (no units)dfreq a numeric vector of length 1 the dominant frequency (kHz)fmin a numeric vector of length 1 returning the minimum frequency of the -dB level
bandwidth (kHz)fmax a numeric vector of length 1 returning the minimum frequency of the -dB level
bandwidth (kHz)bwd a numeric vector of length 1 returning the bandwidth, i. e. fmax-fmin (kHz)
Note
This function is based on an linear interpolation of the spectrum so that the result should be consid-ered as an estimation, not an exact measure.
Author(s)
Jerome Sueur, improved by Laurent Lellouch
See Also
spec, meanspec, corspec, fft.
Examples
# bird songdata(tico)t<-spec(tico,f=22050,at=1.1,plot=FALSE,dB="max0")op<-par(mfrow=c(2,1),las=1)Q(t,type="l")Q(t,type="l",xlim=c(3.8,4.2),ylim=c(-60,0))title("zoom in")par(op)# cricket, changing the dB leveldata(pellucens)p<-spec(pellucens,f=11025,at=0.5,plot=FALSE,dB="max0")op<-par(mfrow=c(3,1))Q(p,type="l",xlim=c(1.8,2.6),ylim=c(-70,0))title("level = - 3 (default value)",col.main="red")Q(p,type="l",level=-6,
xlim=c(1.8,2.6),ylim=c(-70,0),colval="blue")title("level = - 6",col.main="blue")Q(p,type="l",level=-9,
xlim=c(1.8,2.6),ylim=c(-70,0),colval="green")title("level = - 9",col.main="green")par(op)
142 read.audacity
read.audacity Audacity audio markers import
Description
Read audio markers as exported by Audacity.
Usage
read.audacity(file, format)
Arguments
file A .txt file produced by Audacity when exporting time or time x frequency mark-ers.
format The format of the file name that will appear in the value, that is in the firstcolumn of the data frame returned. if "dir" then the full path to the file isreturned, if "base" only the base name of the file is returned.
Details
Audacity opens the possibility to annotate sound files with a marker channel. These markers can beexported as .txt files. The function read.audacity import such .txt files whether they contain timemarkers or time x frequency markers.
Value
A data.frame. The size of the data.frame differs whether the .txt file contains time markers ortime x frequency markers.For time markers, the data.frame contains 4 columns:
1. file returning the name of the input file either with the full path or with the base name only(see argument format),
2. label the text label,
3. t1 the start time in seconds,
4. t2the end time in seconds.
For time x frequency markers, the data.frame contains 6 columns:
1. file returning the name of the input file either with the full path or with the base name only(see argument format),
2. label the text label,
3. t1 the start time in seconds,
4. t2 the end time in seconds,
5. f1 the lower frequency in Hz,
6. f2 the upper frequency in Hz.

repw 143
Author(s)
Jerome Sueur
References
Audacity is a free software distributed under the terms of the GNU General Public License.Web site: https://www.audacityteam.org/
See Also
write.audacity
Examples
## Not run:## If 'markers.txt' is an export of Audacity markersx <- read.audacity("markers.txt")
## End(Not run)
repw Repeat a time wave
Description
This function repeats a time wave
Usage
repw(wave, f, channel = 1, times = 2, join = FALSE, plot = FALSE, output= "matrix", ...)
Arguments
wave an R object.
f sampling frequency of wave (in Hz). Does not need to be specified if embeddedin wave.
channel channel of the R object, by default left channel (1).
times a numeric of length 1 describing the number of times the wave has to be re-peated.
join if TRUE the last point of wave will be removed for smoothing junction betweenrepetitions. See examples.
plot logical, if TRUE plots the repeated time wave.
output character string, the class of the object to return, either "matrix", "Wave","Sample", "audioSample" or "ts".
... other oscillo graphical parameters.

144 resamp
Value
If plot is FALSE, a new wave is returned. The class of the returned object is set with the argumentoutput.
Author(s)
Jerome Sueur <[email protected]>
See Also
oscillo, addsilw, cutw, deletew, fadew, mutew, pastew, revw, zapsilw
Examples
data(tico)repw(tico,f=22050,plot=TRUE)# use 'join' for smooth pastingpar(mfrow=c(2,1))a <- synth(cf=50, f=400, d=0.1)repw(a, f=400, plot=TRUE)title(main="join is FALSE")points(x=0.1, y=0, cex=2, col=2)repw(a, f=400, join=TRUE, plot=TRUE)title(main="join is TRUE")points(x=0.1, y=0, cex=2, col=2)
resamp Resample a time wave
Description
This function resamples (down- or over-samples) a time wave. This corresponds to a samplingfrequency change.
Usage
resamp(wave, f, g, channel = 1, output="matrix")
Arguments
wave an R object.
f sampling frequency of wave (in Hz). Does not need to be specified if embeddedin wave.
g new sampling frequency of wave (in Hz).
channel channel of the R object, by default left channel (1).
output character string, the class of the object to return, either "matrix", "Wave","Sample", "audioSample" or "ts".

revw 145
Value
If plot is FALSE, a new wave is returned. The class of the returned object is set with the argumentoutput.
Note
Resampling might change frequency properties of the time wave.
Author(s)
Jerome Sueur <[email protected]>
Examples
data(peewit)# downsamplinga<-resamp(peewit,f=22050,g=11025)# oversamplingb<-resamp(peewit,f=22050,g=44100)
revw Time reverse of a time wave
Description
Reverse the wave along the time axis.
Usage
revw(wave, f, channel = 1, env = TRUE, ifreq = TRUE,plot = FALSE, output = "matrix", ...)
Arguments
wave an R object.
f sampling frequency of wave (in Hz). Does not need to be specified if embeddedin wave.
channel channel of the R object, by default left channel (1).
env logical, if TRUE the amplitude envelope is reversed.
ifreq logical, if TRUE the instantaneous frequency is reversed.
plot logical, if TRUE returns an oscillographic plot of the reversed wave (by defaultFALSE).
output character string, the class of the object to return, either "matrix", "Wave","Sample", "audioSample" or "ts".
... other oscillo graphical parameters.

146 rmam
Details
If plot is TRUE returns an oscillogram of the reversed wave. The amplitude and the instantaneousfrequency can be independently reversed thanks to the arguments env and ifreq. See the examples.
Value
If plot is FALSE, a new wave is returned. The class of the returned object is set with the argumentoutput.
Author(s)
Jerome Sueur <[email protected]>
References
Beeman, K. 1998. Digital signal analysis, editing and synthesis in Hopp, S. L., Owren, M. J. andEvans, C. S. (Eds) 1998. Animal acoustic communication, pp. 59-103. Springer, Berlin, Heidelberg.
See Also
oscillo, addsilw, deletew, fadew, pastew, mutew
Examples
data(tico)# simple reverserevw(tico,f=22050,plot=TRUE)# envelope reverse onlyrevw(tico,f=22050,ifreq=FALSE, plot=TRUE)# instantaneous frequency reverse onlyrevw(tico,f=22050,env=FALSE, plot=TRUE)
rmam Remove the amplitude modulations of a time wave
Description
This functions removes the amplitude modulation of a time wave through the Hilbert amplitudeenvelope.
Usage
rmam(wave, f, channel = 1, plot = FALSE, listen = FALSE, output = "matrix", ...)

rmam 147
Arguments
wave an R object.
f sampling frequency of wave (in Hz). Does not need to be specified if embeddedin wave.
channel channel of the R object, by default left channel (1).
plot logical, if TRUE returns an oscillographic plot of the nwe time wave (by defaultFALSE).
listen if TRUE the new sound is played back.
output character string, the class of the object to return, either "matrix", "Wave","Sample", "audioSample" or "ts".
... other oscillo graphical parameters.
Details
The new time wave is obtained by dividing the original time wave by its Hilbert amplitude envelope.
Value
If plot is FALSE, a new wave is returned. The class of the returned object is set with the argumentoutput.
Author(s)
Jerome Sueur <[email protected]>
References
Mbu Nyamsi, R. G., Aubin, T. & Bremond, J. C. 1994 On the extraction of some time dependentparameters of an acoustic signal by means of the analytic signal concept. Its application to animalsound study. Bioacoustics, 5: 187-203.
See Also
hilbert.
Examples
# generate a new sound with amplitude modulationa<-synth(f=8000, d=1, cf=1500, am=c(50,10))# remove the amplitude modulation and plot the resultrmam(a,f=8000,plot=TRUE)

148 rmnoise
rmnoise Remove noise
Description
This function removes background noise by smoothing
Usage
rmnoise(wave, f, channel = 1, output = "matrix", ...)
Arguments
wave an R object.
f sampling frequency of wave (in Hz). Does not need to be specified if embeddedin wave.
channel channel of the R object, by default left channel (1).
output character string, the class of the object to return, either "matrix", "Wave","Sample", "audioSample" or "ts".
... other smooth.spline arguments.
Details
This function is based on smooth.spline. You can use the arguments of the later to modify thesmoothing.
Value
A new wave is returned. The class of the returned object is set with the argument output.
Note
Low frequency noise might not be removed out properly.
Author(s)
Jerome Sueur <[email protected]>
See Also
afilter, noisew

rmoffset 149
Examples
# synthesis of a 440 Hz sound with background noisen <- noisew(d=1,f=8000)s <- synth(d=1,f=8000,cf=440)ns <- n+s# remove noise (but low frequency content still there)a <- rmnoise(ns,f=8000)
rmoffset Remove the offset of a time wave
Description
This function removes the offset of a time wave.
Usage
rmoffset(wave, f, channel = 1, FUN = mean, plot = FALSE, output = "matrix", ...)
Arguments
wave an R object.
f sampling frequency of wave (in Hz). Does not need to be specified if embeddedin wave.
channel channel of the R object, by default left channel (1).
FUN a function used to apply the offset correction. See Details.
plot logical, if TRUE returns an oscillographic plot of the wave after removing theoffset (by default FALSE).
output character string, the class of the object to return, either "matrix", "Wave","Sample", "audioSample" or "ts".
... other oscillo graphical parameters.
Value
The offset is removed by substracting the wave by its mean (argument FUN). But other functioncan be used. For instance, it can be more approriate to use the median to remove the offtset andtransients. See Examples.If plot is FALSE, a new wave is returned. The class of the returned object is set with the argumentoutput.
Author(s)
Jerome Sueur <[email protected]>
See Also
oscillo

150 rms
Examples
data(tico)# artifically generates an offsettico2<-tico+0.1# see the wave with an offsetoscillo(tico2, f=22050)# remove the offset with the mean (by default)rmoffset(tico2, f=22050, plot=TRUE)# remove the offset with the medianrmoffset(tico2, f=22050, FUN=median, plot=TRUE)
rms Root Mean Square
Description
This function computes the root mean square or quadratic mean.
Usage
rms(x, ...)
Arguments
x an R object
... further arguments passed to mean
Details
The Root Mean Square or quadratic mean is computed according to:
RMS =
√√√√ 1
n×
N∑i=1
xi2
Value
A numeric vector of length 1
Author(s)
Jerome Sueur <[email protected]>
See Also
mean

roughness 151
Examples
# simple rmsrms(1:10)# rms of a normalized envelopedata(sheep)env <- env(sheep, f=8000)rms(env)
roughness Roughness or total curvature
Description
This function computes the roughness or total curvature of a curve, i.e. of a time wave or of aspectrum
Usage
roughness(x, std = FALSE)
Arguments
x a vector
std a logical, if set to TRUE then x is standardized by its maximum.
Details
Roughness or total curvature is the integrated squared second derivative :
roughness =
∫[D2x(t)]2 dt
.
Value
A vector of length 1.
Note
The value has not unit.
Author(s)
Jerome Sueur
References
Ramsay JO, Silverman BW (2005) Functional data analysis. Springer, Berlin.

152 rugo
See Also
rugo, rms, sh, th, H.
Examples
data(tico)spec <- meanspec(tico, plot=FALSE)[,2]roughness(spec)
rugo Rugosity of a time wave
Description
This function computes the rugosity of a time wave or time series
Usage
rugo(x, ...)
Arguments
x a vector
... other mean parameters.
Details
The formula has been slightly modified from Mezquida & Martinez (2009: 826) to fit with theclassical definition of the root-mean-square (see rms).The rugosity is then computed as following:
rugo =
√√√√n−1∑i=1
(xi+1 − xi)2n
for a vector x of length n.
Value
A vector of length 1.
Note
The rugosity of a noisy signal will tend to be higher than that of a pure tone signal, all other thingsbeing equal.

savewav 153
Author(s)
Jerome Sueur
References
Mezquida DA, Martinez JL (2009) - Platform for bee-hives monitoring based on sound analysis.A perpetual warehouse for swarm’s daily activity. Spanish Journal of Agricultural Research 7,824-828.
See Also
roughness, rms, sh, th, H.
Examples
data(tico) ; tico <-tico@left# rugosity of the original recording normalisedrugo(tico/max(tico))# synthesis of white noise with the same duration as ticonoise <- noisew(d=length(tico)/22050, f=22050)# tico is normalised to get similar amplitude with the noisetico.norm <- tico/max(tico)# addition of noise to ticotico.noisy <- tico.norm + 0.5*noise# new rugosity (higher) on normalised signalrugo(tico.noisy/max(tico.noisy))
savewav Save a .wav file
Description
Save sound data as .wav file
Usage
savewav(wave, f, channel = 1, filename = NULL, rescale = NULL, ...)
Arguments
wave an R object.f sampling frequency of wave (in Hz). Does not need to be specified if embedded
in wave.channel channel of the R object, by default left channel (1).filename name of the new file. (by default the name of wave).rescale a numeric vector of length 2 giving the lower (negative value) and upper (posi-
tive value) amplitude limits of the .wav file to be exported.... other arguments to be passed to writeWave.

154 SAX
Details
This function uses three functions from the package tuneR: Wave, normalize and writeWave.
Note
The file automatically owerwrites an existing file with the same name.The amplitude (volume) of the .wav file is normalized by defaults but can be changed with theargument rescale. See examples
Author(s)
Jerome Sueur <[email protected]>, Ethan C. Brown for the argument ’rescale’
See Also
export.
Examples
require(tuneR)a<-synth(f=8000,d=2,cf=2000,plot=FALSE)# the name of the file is automatically the name of the object# here: "a.wav"savewav(a,f=22050)unlink("a.wav")# if you wish to change the name, use the 'file' argumentsavewav(a,f=22050,file="b.wav")unlink("b.wav")# if you wish to change the amplitude of the file, use the argument 'rescale'# this will turn down the volume of a 16 bit sound# which amplitude was originally ranging between -2^15 and +2^15savewav(a, f=22050, file="c.wav", rescale=c(-1500,1500))unlink("c.wav")
SAX Symbolic Aggregate approXimation
Description
This function converts a numeric times seris into a series of letters with a specific length and alpha-bet.
Usage
SAX(x, alphabet_size, PAA_number,breakpoints = "gaussian", collapse = NULL)

SAX 155
Arguments
x a numeric vector.
alphabet_size a numeric vector of length 1 setting the size of the alphabet.
PAA_number a numeric vector of length 1 setting the number of elements (subsequences) ofthe Piecewise Aggregate Approximation (PAA).
breakpoints either a character vector ("gaussian", "quantiles") or a numeric vector specifyingthe sorted values of the breakpoints along the distribution of x. See details andexamples.
collapse a character vector of length 1, specifying the way to collapse the output letters,see paste. By default letters are returned separated.
Details
The SAX method has been developed to reduce the dimensionality of a numerical series into ashort chain of characters. SAX follows a two-step process: (1) Piecewise Aggregate Approxima-tion (PAA) and (2) conversion a PAA sequence into a series of letters.
PAA consists in a Z-normalisation, a segmentation of the series of length n into w segments, andthe computation of each segment average.
The conversion of the PAA into a series of letters is achieved by attributing with equiprobabilityeach value of the PAA to a letter in reference to a Gaussian distribution. This process thereforeassumes that the distribution of the numeric series x follows a Gaussian distribution. To relaxthe constraints of normality we here added the possibility to directly work on the quantiles of theoriginal data distribution or to specify particular breakpoints along the distribution of x. See theexamples.
Value
A character vector of length (when collapse is NULL) or number of character (when collapse isnot NULL) corresponding to PAA_number argument.
Note
SAX has been used recently to search similar times series in a soundcape data base (Kasten et al.,2012).
Author(s)
Laurent Lellouch. An improvement added by Pavel Senin.
References
Kasten, E.P., Gage, S.H., Fox, J. & Joo, W. (2012). The remote environmental assessment labora-tory’s acoustic library: an archive for studying soundscape ecology. Ecological Informatics, 12, 50- 67.

156 sddB
Lin, J., Keogh, E., Lonardi, S., Chiu, B., June (2003). A symbolic representation of time serieswith implications for streaming algorithms. Proceedings of the 8th ACM SIGMOD Workshop onResearch Issues in Data Mining and Knowledge Discovery. San Diego, California, USA.
See Also
discrets, symba, soundscapespec
Examples
data(tico)spec <- soundscapespec(tico, plot=FALSE)[,2]SAX(spec, alphabet = 5, PAA = 10)
# change breakpointsSAX(spec, alphabet = 5, PAA = 10, breakpoints="quantiles")SAX(spec, alphabet = 5, PAA = 10, breakpoints=c(0, 0.5, 0.75, 1))SAX(spec, alphabet = 5, PAA = 10, breakpoints=c(0, 0.33, 0.66, 1))
# different output formatsSAX(spec, alphabet = 5, PAA = 10, collapse="")SAX(spec, alphabet = 5, PAA = 10, collapse="-")
sddB Standard deviation of dB values
Description
This function estimates the standard deviation of dB values
Usage
sddB(x, level = "IL")
Arguments
x a numeric vector.
level intensity level ("IL") or sound pressure level ("SPL")
Details
The standard deviation of dB values is not linear. The function is an estimation not an exact com-putation which is not possible.
Value
A numeric vector of length 1.

seedata 157
Author(s)
Jérôme Sueur
References
Wikipedia, https://en.wikipedia.org/wiki/Propagation_of_uncertainty
See Also
meandB, moredB, convSPL, dBweight
Examples
sddB(c(89,90,95))sddB(c(89,90,95), level="SPL")
seedata A quick look at quantitative data
Description
See quantitative data at a glance
Usage
seedata(data, na.rm = FALSE, col = "grey")
Arguments
data a numeric vector describing quantitative data.
na.rm logical, if TRUE removes NA.
col main color.
Details
The red curves depict the corresponding Normal law (same mean and sd as data).
Value
A multi-plot graphic is returned.
Author(s)
Caroline Simonis <[email protected]> and Jerome Sueur <[email protected]>.
Examples
seedata(rnorm(1000))

158 seewave
seewave Sound analysis and synthesis
Description
seewave provides functions for analysing, manipulating, displaying, editing and synthesizing timewaves (particularly sound). This package processes in particular time analysis (oscillograms andenvelopes), spectral content, resonance quality factor, entropy, cross correlation and autocorrelation,zero-crossing, frequency coherence, dominant frequency, analytic signal, 2D and 3D spectrograms.
Details
Package: seewaveType: PackageVersion: 2.1.8Date: 2021-07-14License: GPL version 2 or newerContributors : Pierre Aumond, Ethan C. Brown,
Guillaume Corbeau, Camille Desjonqueres,Marion Depraetere, Francois Fabianek,Amandine Gasc, Eric Kasten,Laurent Lellouch, Stefanie LaZerte,Jonathan Lees, Jean Marchal,Thibaut Marin-Cudraz,Andre Mikulec, Sandrine Pavoine,David Pinaud, Luis J. Villanueva-RiveraZev Ross, Carl G. Witthoft,Hristo Zhivomirov
Acknowledgments: Marianna Anichini, Andrey Anikin, Michel Baylac,Charlotte Cure, Denis Dupeyron,Kurt Fristrup, Arnold Fertin,Sylvain Haupert, Kurt Hornik,Yannick Jadoul, Emiliano A. Laca,Uwe Ligges, Morgane Papin,Emmanuel Paradis, Daniel Ridley-Ellis,Brian Ripley, Jesse Ross,Zev Ross, Pavel Senin, David Savage,Arvind Sowmyan, Simon UrbanekMaria A. Wis, George Zhang
Webpage: http://rug.mnhn.fr/seewave/Discussion group : https://groups.google.com/g/seewaveSource reference: Sueur J, Aubin T, Simonis C (2008) - seewave: a free modular tool for sound analysis and synthesis.
Bioacoustics, 18: 213-226.Book: Sueur J (2018) - Sound analysis and synthesis with R. Springer.
setenv 159
Author(s)
Jerome Sueur <[email protected]>Thierry AubinCaroline SimonisMaintainer: Jerome Sueur <[email protected]>
setenv Set the amplitude envelope of a time wave to another one
Description
This function sets the amplitude envelope of a time wave to another one
Usage
setenv(wave1, wave2, f, channel = c(1,1), envt="hil", msmooth = NULL, ksmooth = NULL,plot = FALSE, listen = FALSE, output = "matrix", ...)
Arguments
wave1 a first R object.
wave2 a second R object.
f sampling frequency of wave (in Hz). Does not need to be specified if embeddedin wave.
channel channel of the R objects, by default left channel (1) for each object.
envt the type of envelope to be used for wave2: either "abs" for absolute amplitudeenvelope or "hil" for Hilbert amplitude envelope. See env.
msmooth a vector of length 2 to smooth the amplitude envelope of wave2 with a meansliding window. The first component is the window length (in number of points).The second component is the overlap between successive windows (in %). Seeenv.
ksmooth kernel smooth via kernel to apply to the amplitude envelope ofwave2. See env.
plot if TRUE returns the oscillogram of the new time wave (by default FALSE).
listen if TRUE the new sound is played back.
output character string, the class of the object to return, either "matrix", "Wave","Sample", "audioSample" or "ts".
... other oscillo graphical parameters.
Details
wave1 and wave2 can have different duration (length)Smoothing the envelope with smooth or ksmooth can significantly change the value returned.

160 sfm
Value
If plot is FALSE, a new wave is returned. The class of the returned object is set with the argumentoutput.
Author(s)
Jerome Sueur <[email protected]>
See Also
drawenv, env, synth
Examples
data(tico)a<-synth(d=1,f=22050,cf=1000)# apply 'tico' ammplitude envelope to 'a' that has a square amplitude envelopesetenv(a,tico,f=22050,plot=TRUE)# the same but with smoothing the envelopesetenv(a,tico,f=22050,ksmooth=kernel("daniell",50),plot=TRUE)
sfm Spectral Flatness Measure
Description
This function estimates the flatness of a frequency spectrum.
Usage
sfm(spec)
Arguments
spec a data set resulting of a spectral analysis obtained with spec or meanspec (notin dB).
Details
SFM is calculated as the ratio between the geometric mean and the arithmetic mean :
F = N ×N
√∏Ni=1 yi∑N
i=1 yi
with:y = relative amplitude of the i frequency,and N = number of frequencies.

sh 161
Value
A single value varying between 0 and 1 is returned. The value has no unit.
Note
The SFM of a noisy signal will tend towards 1 whereas the SFM of a pure tone signal will tendtowards 0.See sh for another measure of signal noisiness/pureness.
Author(s)
Jerome Sueur <[email protected]>
See Also
sh, csh
Examples
a<-synth(f=8000,d=1,cf=2000,plot=FALSE)speca<-spec(a,f=8000,at=0.5,plot=FALSE)sfm(speca)# [1] 0b<-noisew(d=1,f=8000)specb<-spec(b,f=8000,at=0.5,plot=FALSE)sfm(specb)# [1] 0.8233202
sh Shannon and Renyi spectral entropy
Description
This function computes the Shannon or Renyi entropy of a frequency spectrum
Usage
sh(spec, alpha = "shannon")
Arguments
spec a data set resulting of a spectral analysis obtained with spec or meanspec (notin dB).
alpha a character string, by default "shannon" to compute Shannon entropy, "simpson"to compute Simpson entropy otherwise a numeric vector of length 1 with a valuesuperior to 0 but different to 1 to compute Renyi entropy. See the examples.

162 sh
Details
. Shannon spectral entropy is calculated according to:
S = −∑Ni=1 yilog2(yi)
log2(N)
. Simpson or Gini-Simpson spectral entropy (or index) is computed according to:
GS = 1−N∑i=1
y2i
. Renyi spectral entropy of order alpha is calucalted according to:
R =1
1− α× log2(
N∑i=1
yαi )
withα ≥ 0
α 6= 1
y = relative amplitude of the i frequency,
N∑i=1
yi = 1
and N = number of frequencies.
Value
A numeric vector of length 1 is returned. The value has no unit.
Note
The Shannon entropy scaled between 0 and 1 is also known as Pielou’s evenness index
Note
The Shannon spectral entropy of a noisy signal will tend towards 1 whereas the Shannon spectralentropy of a pure tone signal will tend towards 0. See Han et al. for details regarding the Renyientropy.
Author(s)
Jerome Sueur and Laurent Lellouch

sheep 163
References
Han, NC, Muniandy SV, Dayou J (2011) Acoustic classification of Australian anurans based onhybrid spectral-entropy approach. Applied Acoustics.
Nunes RR, Almeida de MP, Sleigh JW (2004) - Spectral entropy: a new method for anesthetic ade-quacy. Revista Brasileira de Anestesiologia, 54, 413-422.
Renyi A (1961) - On measures of information and entropy. Proceedings of the 4th Berkeley Sym-posium on Mathematics, Statistics and Probability 1960. pp. 547-561.
Simpson EH (1949) - Measurement of diversity. Nature, 163, 688.
See Also
csh,th, H, sfm
Examples
a<-synth(f=8000,d=1,cf=2000,plot=FALSE)speca<-spec(a,f=8000,at=0.5,plot=FALSE)## Shannon spectral entropysh(speca)# [1] 0.2336412b<-noisew(d=1,f=8000)specb<-spec(b,f=8000,at=0.5,plot=FALSE)sh(specb)# close to 1## Renyi spectral entropysh(speca, alpha=2)sh(speca, alpha=3)
sheep Sheep bleat
Description
Recording of a sheep bleat.
Usage
data(sheep)
Format
A Wave object.

164 simspec
Details
Duration = 2.47 s. Sampling frequency = 8000 hz.
Source
Recording by Frederic Sebe.
Examples
data(sheep)oscillo(sheep,f=8000)
simspec Similarity between two frequency spectra
Description
This function estimates the similarity between two frequency spectra.
Usage
simspec(spec1, spec2, f = NULL, mel = FALSE,norm = FALSE, PMF = FALSE,plot = FALSE, type = "l",lty =c(1, 2, 3), col = c(2, 4, 1),flab = NULL, alab = "Amplitude (percentage)",flim = NULL, alim = NULL,title = TRUE, legend = TRUE, ...)
Arguments
spec1 a first data set resulting of a spectral analysis obtained with spec or meanspec(not in dB). This can be either a two-column matrix (col1 = frequency, col2 =amplitude) or a vector (amplitude).
spec2 a first data set resulting of a spectral analysis obtained with spec or meanspec(not in dB). This can be either a two-column matrix (col1 = frequency, col2 =amplitude) or a vector (amplitude).
f sampling frequency of waves used to obtain spec1 and spec2 (in Hz). Notnecessary if spec1 and/or spec2 is a two columns matrix obtained with spec ormeanspec.
mel a logical, if TRUE the (htk-)mel scale is used.
norm a logical, if TRUE spec1 and spec2 are normalised (scaled) between 0 and 1.
PMF a logical, if TRUE spec1 and spec2 are transformed into probability mass func-tions.
plot logical, if TRUE plots both spectra and similarity function (by default FALSE).

simspec 165
type if plot is TRUE, type of plot that should be drawn. See plot for details (bydefault "l" for lines).
lty a vector of length 3 for the line type of spec1, spec2 and of the similarityfunction if type="l".
col a vector of length 3 for the colour of spec1, spec2, and the similarity function.
flab title of the frequency axis.
alab title of the amplitude axis.
flim the range of frequency values.
alim range of amplitude axis.
title logical, if TRUE, adds a title with S value.
legend logical, if TRUE adds a legend to the plot.
... other plot graphical parameters.
Details
Spectra similarity is assessed according to:
S =100/N
×
N∑i=1
min spec1(i), spec2(i)
max spec1(i), spec2(i)
with S in %.
Value
The similarity index is returned. This value is in %.When plot is TRUE, both spectra and the similarity function are plotted on the same graph. Thesimilarity index is the mean of this function.
Author(s)
Jerome Sueur, improved by Laurent Lellouch
References
Deecke, V. B. and Janik, V. M. 2006. Automated categorization of bioacoustic signals: avoidingperceptual pitfalls. Journal of the Acoustical Society of America, 119: 645-653.
See Also
spec, meanspec, corspec, diffspec, diffenv, kl.dist, ks.dist, logspec.dist, itakura.dist

166 smoothw
Examples
a<-noisew(f=8000,d=1)b<-synth(f=8000,d=1,cf=2000)c<-synth(f=8000,d=1,cf=1000)d<-noisew(f=8000,d=1)speca<-spec(a,f=8000,at=0.5,plot=FALSE)specb<-spec(b,f=8000,at=0.5,plot=FALSE)specc<-spec(c,f=8000,at=0.5,plot=FALSE)specd<-spec(d,f=8000,at=0.5,plot=FALSE)simspec(speca,speca)simspec(speca,specb)simspec(speca,specc,plot=TRUE)simspec(specb,specc,plot=TRUE)#[1] 12.05652simspec(speca,specd,plot=TRUE)## mel scalerequire(tuneR)data(orni)data(tico)orni.mel <- melfcc(orni, nbands = 256, dcttype = "t3", fbtype = "htkmel", spec_out=TRUE)orni.mel.mean <- apply(orni.mel$aspectrum, MARGIN=2, FUN=mean)tico.mel <- melfcc(tico, nbands = 256, dcttype = "t3", fbtype = "htkmel", spec_out=TRUE)tico.mel.mean <- apply(tico.mel$aspectrum, MARGIN=2, FUN=mean)simspec(orni.mel.mean, tico.mel.mean, f=22050, mel=TRUE, plot=TRUE)
smoothw A function to tentativily smooth a time wave
Description
This function tries to smooth with a sum sliding window a time wave, and then to remove residualnoise.
Usage
smoothw(wave, f, channel = 1, wl, padding=TRUE, output = "matrix")
Arguments
wave an R object.
f sampling frequency of wave (in Hz). Does not need to be specified if embeddedin wave.
channel channel of the R object, by default left channel (1).
wl window length in number of points (samples).
padding a logical, if TRUE add 0 values at the start and end of the file to match wavelength (duration).
output character string, the class of the object to return, either "matrix", "Wave","Sample", "audioSample" or "ts".

songmeter 167
Details
A window slides along the signal and sums up the sample amplitude values. Zero values are addedat the end of the wave to keep wave length (duration).
Value
A new wave is returned. The class of the returned object is set with the argument output. Ifpadding is TRUE, the new wave starts and ends up with 0 values to match the size of wave.
Warning
This function should be used with care as this kind of filter may change the frequency content ofthe sound. See the examples section for an illustration.
Author(s)
Jerome Sueur
See Also
fir, filter
Examples
# An example to show that smoothw() may change# the frequency content of your sounddata(orni)orni2 <- smoothw(orni, wl=2, out="Wave")orni10 <- smoothw(orni, wl=10, out="Wave")orni50 <- smoothw(orni, wl=50, out="Wave")orni100 <- smoothw(orni, wl=100, out="Wave")meanspec(orni)lines(meanspec(orni2, plot=FALSE), col=2)lines(meanspec(orni10, plot=FALSE), col=3)lines(meanspec(orni50, plot=FALSE), col=4)lines(meanspec(orni100, plot=FALSE), col=5)legend("topright", col=1:5, lty=1, legend=c("original","wl=2","wl=10","wl=50","wl=100"))
songmeter Reading and interpreting SongMeter file name
Description
This function reads and decomposes the files names generated by a SongMeter device, audio digalrecorders produced by the society Wildlife Acoustics.
Usage
songmeter(x)

168 songmeter
Arguments
x a character vector with file names, either .wac or .wav
Details
The digital recorder SongMeter (either SM2, SM3, or SM4 device model) produced by the soci-ety ’Wildlife Acoustics’ (https://www.wildlifeacoustics.com/) generates ’.wav’ files whichnames include useful information. Here are the character format of the files:
• SM2 or SM4: PREFIX_YYYYMMDD_HHMMSS.wav• SM3:
– without geolocalisation PREFIX_XXX_YYYYMMDD_HHMMSS.wav
– with geolocalisation PREFIX_XXX_YYYYMMDD$HHMMSS.wav
with:
• PREFIX: prefix set when programming the SongMeter• XXX: microphone information• YYYY: year• MM: month• DD: day• HH: hour• MM: month• SS: minute
This information is read and decomposed by the function songmeter().Please note that the function does not read the content of audio file but the name of the file.
Value
The function returns a data.frame with the following columns:
model device model, either "SM2/SM4" or "SM3"prefix prefix of the file, specifying for instance to recording sitemic microphone information specifying if the recording is mono left channel ("monoL"),
mono right ("monoR") or stereo ("stereo"). This works for SM3 only, NA forSM2
year year of recording, numericmonth month of recording, numericday day of recording, numerichour hour of recording, numericmin minute of recording, numericsec second of recording, numerictime time in POSIX formatgeo logical, TRUE if the device was GPS synchronized
songmeterdiag 169
Note
The file names of Songmeters may change with time. There is no guarantee that the function willbe updated on time.
Author(s)
Jerome Sueur
References
See Wildlife Acoustics website for details regarding the SongMeters 2, 3 and 4: https://www.wildlifeacoustics.com/
See Also
songmeterdiag, audiomoth, strptime for the POSIX time format.
Examples
file1 <- "MNHN_20141225_234500.wav" # SM2 filefile2 <- "CNRS_0+1_20130824_153000.wav" # SM3 file without geolocalisationfile3 <- "PARIS_-0-_20150410$195550.wav" # SM3 file with geolocalisationfile4 <- "MNHN_20141225_234500.txt" # not a .wav or a .wac filefile5 <- "myfile.wav" # not a Wildlife Acoustics filenamefiles <- c(file1, file2, file3, file4, file5)songmeter(files)
songmeterdiag Songmeter file diagnostics and diagram
Description
This function looks for files generated by a SongMeter device (audio digal recorders producedby the society Wildlife Acoustics) and checks for possible missing or small files according to apredefined recording schedule.
Usage
songmeterdiag(dir, start, end, frequency,pch.exi = 1, pch.mis = 19,col.exi = 1, col.mis = 2,cex.exi = NULL, cex.mis = 0.5,limits = FALSE, output="file", plot = FALSE)

170 songmeterdiag
Arguments
dir a character vector, path to directory(ies) where the .wav files are stored. Typi-cally a "Data" folder as generated by SongMeter devices.
start a character vector, start date/time of the recording schedule as programmed onthe SongMeter device, must be in the format "year-month-day hour:minute:second".
end a character vector, end date/time of the recording schedule as programmed onthe SongMeter device, must be in the format "year-month-day hour:minute:second".
frequency a numeric vector, frequency of the recording schedule expressed in minute.
pch.exi symbol for plotting the existing file(s).
pch.mis symbol for plotting the missing file(s)
col.exi colour of the symbol for plotting the existing file(s).
col.mis colour of the symbol for plotting the missing file(s).
cex.exi size of the symbol for plotting the existing file(s), by default NULL so that thesize of the symbol corresponds to the size of the .wav file in Mb divided by theaverage size of all .wav files found in the directory. If not NA then symbol sizeas in plot.
cex.mis size of the symbol for plotting the missing file(s).
limits a logical, if TRUE adds to the plot the limits (start and end date/time) of therecording schedule as programmed on the SongMeter device.
output a character vector of length 1, either "file" or "time" to get the file name or thetime slot in POSIXct format respectively.
plot a logical, if TRUE plots a time plot indicating the existing and missing files (bydefault TRUE).
Details
The function works for a single or several directories so that the operation of several SongMeterscan be compared visually. This function should be helpful to check quickly how the devices worked.
Value
A character vector with the names of the missing files.
Note
The file names of Songmeters may change with time. There is no guarantee that the function willbe perfectly updated.
Author(s)
Jerome Sueur and Sylvain Haupert
References
See Wildlife Acoustics website for details regarding the SongMeters 2, 3 and 4: https://www.wildlifeacoustics.com/

songmeterdiag 171
See Also
songmeter
Examples
## Not run:################### simulated data################### a recording schedule programmed on four SongMeters SM4# named "S4A03895", "S4A03998", "S4A03536", and "S4A04430"# starting the 1st of January 2019 at 00:00:00# and stopping the 31st January 2019 at 23:30:00# with a recording frequency of 30 minutes# all directories stored in a single directory named "project"# recorder namesrecorders <- c("S4A03895", "S4A03998", "S4A03536", "S4A04430")n <- length(recorders)# schedule as programmed on the devicesformat <- "start <- strptime("20190101_000000", format)end <- strptime("20190131_233000", format)schedule <- seq(from=start, to=end, by=30*60)schedule <- paste(format(schedule, "# directories and filesdir.create("project")for(i in 1:n) {dir.create(paste("project", recorders[i], sep="/"))}for(i in 1:n) {file.create(paste("project", recorders[i],paste(recorders[i], each=schedule, sep="_"), sep="/"))}# removing some files to simulate missing filesdirs <- paste("project", recorders, sep="/")file.remove(paste(dirs[1], dir(dirs[1])[200:500], sep="/"))
####################### use of the function####################### directories where the .wav files are stored (as above)dirs <- paste("project", recorders, sep="/")# function call with a plot, cex.exi is here specify because we deal# with ghost files (the .wav file are not truly created)res <- songmeterdiag(dirs,
start="2019-01-01 00:00:00", end="2019-01-31 23:30:00", frequency=30,cex.exi=1, plot=TRUE)
# clear outunlink("project", recursive=TRUE)
## End(Not run)

172 soundscapespec
soundscapespec Soundscape frequency spectrum of a time wave
Description
This function returns a kHz binned spectrum as described by Kasten et al. (2012) for the descriptionof a soundscape.
Usage
soundscapespec(wave, f, channel = 1, wl = 1024, wn = "hamming", ovlp = 50,plot = TRUE, xlab = "Frequency (kHz)", ylim = c(0, 1), ...)
Arguments
wave an R object.
f sampling frequency of wave (in Hz). Does not need to be specified if embeddedin wave.
channel channel of the R object, by default left channel (1).
wl length of the window for the analysis (even number of points, by default = 1024).
wn window name, see ftwindow (by default "hamming").
ovlp overlap between two successive analysis windows (in %), by default = 50%.
plot if TRUE returns a barplot.
xlab title of the barplot x axis.
ylim range of the barplot y axis.
... other barplot graphical parameters.
Details
The soundscape frequency spectrum is based on the computation of a spectrogram power spectraldensity using Welch’smethod (Welch & June, 1967). Parameters used in Kasten et al. (2012) werea Hamming window of 1024 samples with 50% of overlap and are used here as default values.
Value
A two-column numeric matrix, the first column returning the frequency (kHz) bands and the secondcolumn returning the power value within each frequency band.A barplot is returned when plot is TRUE.
Author(s)
Jerome Sueur and Eric Kasten

sox 173
References
Kasten, E.P., Gage, S.H., Fox, J. & Joo, W. (2012). The remote environmental assessment labo-ratory’s acoustic library: an archive for studying soundscape ecology. Ecological Informatics, 12,50-67.Welch, P.D., June (1967). The use of the fast Fourier transform for the estimation of power spectra:a method based on time-averaging over short, modified periodograms. IEEE Transactions on Audioand Electroacoustics, 15: 70-73.
See Also
spec, meanspec, SAX, NDSI
Examples
## Note that 'tico' is not a soundscape recording...data(tico)soundscapespec(tico, plot=TRUE, col="darkgreen")
sox Calls SoX
Description
This function calls SoX, the Swiss Army knife of sound processing programs.
Usage
sox(command, exename = NULL, path2exe = NULL, option = NULL,shQuote_type = NULL)
Arguments
command the SoX command to invoke.exename a character string specifying the name of the SoX binary file. If NULL, the default
name "sox" will be used for Linux OS.path2exe a character string giving the path to the SoX binary file goption option to be passed to the SoX commandshQuote_type type of shell quotes ("cmd" or "cmd2", for Windows OS; "sh" or "csh" Unix OS)
Details
See the documentation of SoX for proper use.
Note
Sox must be installed to use this function but not to install the package seewave. As mentioned onthe SoX webpage, the primary development platform is Linux. Using SoX with Windows from Rmight not be straightforward. In particular, it is advisable to pay attention to file path and exe name.

174 spec
Author(s)
Jerome Sueur, Stefanie LaZerte, Andre Mikulec
References
https://en.wikipedia.org/wiki/SoX
Examples
## Not run:############ data ############## Generate a simple sound file at 440 Hzs <- synth(cf=440, f=8000, d=1, fm=c(0,0,1000,0,0), output="Wave")savewav(s, file="mysound.wav")################ Linux OS ################## Play the filesox("mysound.wav", exename="play")## Slow down the audio tempo (but not its pitch)sox("mysound.wav myslowsound.wav tempo 0.5")## Cut the filesox("myslowsound.wav myslowcutsound.wav trim 0.25 0.75")################## Windows OS #################### path with simple slashpath <- "C:/Program Files (x86)/sox-14-4-2"## or path with double backslash## path <- "C:\Program Files (x86)\sox-14-4-2"sox("mysound.wav", path2exe=path, option="-t waveaudio")## with the option directly passed to the commandsox("mysound.wav -t waveaudio", path2exe=path)## Slow down the audio tempo (but not its pitch)sox("mysound.wav myslowsound.wav tempo 0.5", path2exe=path)## Cut the filesox("myslowsound.wav myslowcutsound.wav trim 0.25 0.75", path2exe=path)############# clean #############file.remove("mysound.wav", "myslowsound.wav", "myslowcutsound.wav")
## End(Not run)
spec Frequency spectrum of a time wave

spec 175
Description
This function returns the frequency spectrum (i.e. the relative amplitude of the frequency content)of a time wave. Results can be obtained either as absolute or dB data.
Usage
spec(wave, f, channel = 1, wl = 512, wn = "hanning", fftw = FALSE, norm = TRUE,scaled = FALSE, PSD = FALSE, PMF = FALSE, correction="none", dB = NULL, dBref = NULL,at = NULL, from = NULL, to = NULL,identify = FALSE, col = "black", cex = 1,plot = 1, flab = "Frequency (kHz)",alab = "Amplitude", flim = NULL,alim = NULL, type="l",...)
Arguments
wave an R object.
f sampling frequency of wave (in Hz). Does not need to be specified if embeddedin wave.
channel channel of the R object, by default left channel (1).
wl if at is not null, length of the window for the analysis (by default = 512).
wn window name, see ftwindow (by default "hanning").
fftw if TRUE calls the function FFT of the library fftw for faster computation. SeeNotes of the function spectro.
norm if TRUE the spectrum is normalised by its maximum.
scaled if TRUE the spectrum is scaled by the length of the FFT.
PSD if TRUE return Power Spectrum Density, i. e. the square of the spectrum.
PMF if TRUE return Probability Mass Function, i. e. the probability distribution offrequencies.
correction a character vector of length 1 to apply an amplitude ("amplitude") or an energy("energy") correction to the FT window. This argument is useful only when onewish to obtain absolute values that is when norm=FALSE, scaled=FALSE, andPMF=FALSE. By default no correction is applied ("none").
dB a character string specifying the type dB to return: "max0" for a maximum dBvalue at 0, "A", "B", "C", "D", and "ITU" for common dB weights.
dBref a dB reference value when dB is not NULL. NULL by default but should be set to2*10e-5 for a 20 microPa reference (SPL).
at position where to compute the spectrum (in s).
from start mark where to compute the spectrum (in s).
to end mark where to compute the spectrum (in s).
identify to identify frequency and amplitude values on the plot with the help of a cursor.
col colour of the spectrum.
cex pitch size of the spectrum.
176 spec
plot if 1 returns frequency on x-axis, if 2 returns frequency on y-axis, (by default 1).
flab title of the frequency axis.
alab title of the amplitude axis.
flim range of frequency axis.
alim range of amplitude axis.
type if plot is TRUE, type of plot that should be drawn. See plot for details (bydefault "l" for lines).
... other plot graphical parameters.
Details
If at, from or to are FALSE then spec computes the spectrum of the whole signal.
Value
This function returns a two-column matrix, the first column corresponding to the frequency axis,the second column corresponding to the amplitude axis.If identify is TRUE, spec returns a list with two elements:
freq the frequency of the points chosen on the spectrum
amp the relative amplitude of the points chosen on the spectrum
Warning
The argument peaks is no more available (version > 1.5.6). See the function fpeaks for peak(s)detection.
Note
This function is based on fft.
Author(s)
Jerome Sueur
See Also
meanspec, fpeaks, localpeaks, dynspec, corspec, fft.

specflux 177
Examples
data(tico)# spectrum of the whole signal, in absolute or dB amplitude,# horizontaly or verticallyop<-par(mfrow=c(2,2))spec(tico,f=22050)spec(tico,f=22050,col="red",plot=2)spec(tico,f=22050,dB="max0",col="blue")spec(tico,f=22050,dB="max0",col="green",plot=2)par(op)# an indirect way to compare spectraa<-spec(tico,f=22050,wl=512,at=0.2,plot=FALSE)b<-spec(tico,f=22050,wl=512,at=0.7,plot=FALSE)c<-spec(tico,f=22050,wl=512,at=1.1,plot=FALSE)d<-spec(tico,f=22050,wl=512,at=1.6,plot=FALSE)all<-cbind(a[,2],b[,2],c[,2],d[,2])matplot(x=a[,1],y=all,yaxt="n",
xlab="Frequency (kHz)",ylab="Amplitude",xaxs="i",type="l")legend(8,0.8,c("Note A","Note B", "Note C", "Note D"),bty="o",
lty=c(1:4),col=c(1:4))# spectrum from a particular position to another oneop<-par(mfrow=c(2,1))oscillo(tico,f=22050)abline(v=c(0.5,0.9),col="red",lty=2)spec(tico,f=22050,wl=512,from=0.5,to=0.9,col="red")title("Spectrum of the note B")par(op)# spectrum and spectrogramdata(orni)orni1<-cutw(orni,f=22050,from=0.32,to=0.39)layout(matrix(c(1,2),nc=2),widths=c(3,1))par(mar=c(5,4,3,0.5))spectro(orni1,f=22050,wl=128,zp=8,ovlp=85,scale=FALSE)par(mar=c(5,1,3,0.5))spec(orni1,f=22050,col="red",plot=2,flab="",yaxt="n")
specflux Spectral flux
Description
Compute spectral flux
Usage
specflux(wave, f, channel = 1,wl = 512, ovlp = 0, wn = "rectangle", flim = NULL,norm = FALSE, p = 2,plot = TRUE, xlab = "Times (s)", ylab = "Flux", type = "l", ...)

178 specflux
Arguments
wave an R object.
f sampling frequency of wave (in Hz). Does not need to be specified if embeddedin wave.
channel channel of the R object, by default left channel (1).
wl window length for the analysis (even number of points) (by default = 512).
ovlp overlap between two successive windows (in %).
wn window name, see ftwindow (by default "rectangle").
flim a numeric vector of length 2 to select a frequency band (in kHz).
norm if is TRUE then the normalised spectra are used. The spectra are normalised bytheir sum.
p the norm type, by default = 2.
plot logical, if TRUE the spectral flux is displayed against time (s) (by default TRUE).
xlab title of the x axis.
ylab title of the y axis.
type if plot is TRUE, type of plot that should be drawn. See plot for details (bydefault "l" for lines).
... other plot parameters.
Details
The spectral flux (F ) is the sum of the time (t) derivative of the columns – that is the successivespectra – (s) of the normalized short-term Fourier transform (z).F is then computed according to:
F = (∑|s(t+ 1)− s(t)|p)
1p
Value
When plot is FALSE, specflux returns a two-column matrix, the first column being time in seconds(x-axis) and the second column being the spectral flux (y-axis) computed along time.
Note
The sum of the successive spectral flux values could be used as an ecoacoustic index, quite close tothe acoustic complexity index (ACI). See examples.
Author(s)
Jérôme Sueur
References
Scheirer E, Slaney M (1997). Construction and evaluation of a robust multifeature speech/musicdiscriminator. IEEE International Conference on Acoustics, Speech, and Signal Processing, 2,1221-1224.

specprop 179
See Also
spectro, ACI
Examples
## default usedata(tico)specflux(tico)## norm 1specflux(tico, p = 1)## frequency limit between 2 and 4 kHzspecflux(tico, flim = c(2,4))## index computationsum(specflux(tico, plot=FALSE)[,2])
specprop Spectral properties
Description
This function returns a list of statistical properties of a frequency spectrum.
Usage
specprop(spec, f=NULL,str = FALSE, flim=NULL, mel=FALSE,plot = FALSE, type = "l", xlab=NULL, ylab = NULL,col.mode = 2, col.quartiles = 4, ...)
Arguments
spec a data set resulting of a spectral analysis obtained with spec or meanspec (notin dB).
f sampling frequency of spec (in Hz).str logical, if TRUE returns the results in a structured table.flim a vector of length 2 to specifgy the frequency limits of the analysis (in kHz)mel a logical, if TRUE the (htk-)mel scale is used.plot if 1 returns the spectrum , if 2 returns the cumulative spectrum, both of them
with the first quartile, the third quartile, the median and the mode plotted (bydefault FALSE).
type if plot is TRUE, type of plot that should be drawn. See plot for details (bydefault "l" for lines).
xlab label of the x axis.ylab label of the y axis.col.mode colour of the mode segments (by default blue).col.quartiles colour of the quartiles segments (by default red).... other arguments to be passed to plot

180 specprop
Details
The spectrum is converted in a probability mass function (PMF).If a selected value has to be selected with $, the argument str has to be set to FALSE.
Value
A list of 15 values is returned
mean mean frequency (see mean)
sd standard deviation of the mean (see sd)
sem standard error of the mean
median median frequency (see median)
mode mode frequency, i.e. the dominant frequency
Q25 first quartile (see quantile)
Q75 third quartile (see quantile)
IQR interquartile range (see IQR)
cent centroid, see note
skewness skewness, a measure of asymmetry, see note
kurtosis kurtosis, a measure of peakedness, see note
sfm spectral flatness measure (see sfm)
sh spectral entropy (see sh)
prec frequency precision of the spectrum
Note
Centroid is computed according to:
C =
N∑i=1
xi × yi
with:x = frequencies, y = relative amplitude of the i frequency,N = number of frequencies.
Skewness is computed according to:
S =
∑Ni=1(xi − x)3
N − 1× 1
σ3
.S < 0 when the spectrum is skewed to left,S = 0 when the spectrum is symetric,S > 0 when the spectrum is skewed to right.Spectrum asymmetry increases with |S|.

spectro 181
Kurtosis is computed according to:
K =
∑Ni=1(xi − x)4
N − 1× 1
σ4
.K < 3 when the spectrum is platikurtic, i.e. it has fewer items at the center and at the tails than thenormal curve but has more items in the shoulders,K = 3 when the spectrum shows a normal shape,K > 3 when the spectrum is leptokurtic, i.e. it has more items near the center and at the tails, withfewer items in the shoulders relative to normal distribution with the same mean and variance.
Author(s)
Jerome Sueur and Caroline Simonis, and a patch by Jesse Ross (Dec. 2012)
Examples
data(orni)a<-meanspec(orni,f=22050,plot=FALSE)specprop(a,f=22050)# to get a single measure of the listspecprop(a,f=22050)$mode# to get the results structuredspecprop(a,f=22050,str=TRUE)# to limit the analysis between 4 and 6 kHzspecprop(a,f=22050,flim=c(4,6),str=TRUE)# plotsspecprop(a,f=22050,plot=1)specprop(a,f=22050,plot=2)# (htk-)mel scalerequire(tuneR)mel <- melfcc(orni, nbands = 256, dcttype = "t3", fbtype = "htkmel", spec_out=TRUE)melspec.mean <- apply(mel$aspectrum, MARGIN=2, FUN=mean)specprop(melspec.mean, f=22050, mel=TRUE)# be aware that flim is always given in kHz even if mel=TRUEspecprop(melspec.mean, f=22050, flim=c(4,6), mel=TRUE, plot=TRUE)
spectro 2D-spectrogram of a time wave
Description
This function returns a two-dimension spectrographic representation of a time wave. The functioncorresponds to short-term Fourier transform. An amplitude contour plot can be overlaid.

182 spectro
Usage
spectro(wave, f, channel = 1, wl = 512, wn = "hanning", zp = 0,ovlp = 0, noisereduction = NULL, fastdisp = FALSE,complex = FALSE, norm = TRUE, correction="none",fftw = FALSE, dB = "max0", dBref = NULL, plot = TRUE,flog = FALSE, grid = TRUE, osc = FALSE, scale = TRUE, cont = FALSE,collevels = NULL, palette = spectro.colors,contlevels = NULL, colcont = "black",colbg = "white", colgrid = "black",colaxis = "black", collab="black",cexlab = 1, cexaxis = 1,tlab = "Time (s)",flab = "Frequency (kHz)",alab = "Amplitude",scalelab = "Amplitude\n(dB)",main = NULL,scalefontlab = 1, scalecexlab =0.75,axisX = TRUE, axisY = TRUE, tlim = NULL, trel = TRUE,flim = NULL, flimd = NULL,widths = c(6,1), heights = c(3,1),oma = rep(0,4),listen=FALSE,...)
Arguments
wave an R object.
f sampling frequency of wave (in Hz). Does not need to be specified if embeddedin wave.
channel channel of the R object, by default left channel (1).
wl window length for the analysis (even number of points) (by default = 512).
wn window name, see ftwindow (by default "hanning").
zp zero-padding (even number of points), see Details.
ovlp overlap between two successive windows (in %).
noisereduction a numeric vector of length 1, if 1 a noise reduction is applied along the rows ofthe spectrogram, if 2 a noise reduction applied along the columns. See Details.
fastdisp faster graphic display for long wave. The spectrogram/oscillogram is displayed/savedfaster in the graphic device/ graphic file when set to TRUE, with a cost on graph-ical resolution.
complex if TRUE the STFT will be returned as complex numbers.
norm if TRUE the STFT is normalised (i. e. scaled) by its maximum.
correction a character vector of length 1 to apply an amplitude ("amplitude") or an energy("energy") correction to each FT window. This argument is useful only whenone wish to obtain absolute values that is when norm=FALSE. By default nocorrection is applied ("none").

spectro 183
fftw if TRUE calls the function FFT of the library fftw. See Notes.
dB a character string specifying the type dB to return: "max0" (default) for a maxi-mum dB value at 0, "A", "B", "C", "D", and "ITU" for common dB weights. Ifset to NULL, then a linear scale is used.
dBref a dB reference value. NULL by default but should be set to 2*10e-5 for a 20microPa reference.
plot logical, if TRUE plots the spectrogram (by default TRUE).
flog a logical to plot the frequency on a logarithmic scale.
grid logical, if TRUE plots a y-axis grid (by default TRUE).
osc logical, if TRUE plots an oscillogram beneath the spectrogram (by default FALSE).
scale logical, if TRUE plots a dB colour scale on the right side of the spectrogram (bydefault TRUE).
cont logical, if TRUE overplots contour lines on the spectrogram (by default FALSE).
collevels a set of levels which are used to partition the amplitude range of the spectrogram(in dB).
palette a color palette function to be used to assign colors in the plot, see Details.
contlevels a set of levels which are used to partition the amplitude range for contour over-plot (in dB).
colcont colour for cont plotting.
colbg background colour.
colgrid colour for grid plotting.
colaxis color of the axes.
collab color of the labels.
cexlab size of the labels.
cexaxis size of the axes.
tlab label of the time axis.
flab label of the frequency axis.
alab label of the amplitude axis.
scalelab amplitude scale label.
main label of the main title.
scalefontlab font of the amplitude scale label.
scalecexlab cex of the amplitude scale label.
axisX logical, if TRUE plots time X-axis (by default TRUE).
axisY logical, if TRUE plots frequency Y-axis (by default TRUE).
tlim modifications of the time X-axis limits.
trel time X-axis with a relative scale when tlim is not null, i.e. relative to wave.
flim modifications of the frequency Y-axis limits (in kHz).
flimd dynamic modifications of the frequency Y-axis limits. New wl and ovlp argu-ments are applied to increase time/frequency resolution.

184 spectro
widths a vector of length 2 to control the relative widths of columns on the device whenscale is TRUE.
heights a vector of length 2 to control the relative heights of rows on the device whenosc is TRUE.
oma a vector of length 4 to control the size of outer margins when either scale orosc is TRUE.
listen if TRUE the sound is played back (by default FALSE).
... other contour and oscillo graphical parameters.
Details
Following Heisenberg uncertainty principle, the short-term Fourier transform cannot be precised inboth time and frequency. The temporal and frequency precisions of the function are actually depen-dent of the wl value. Choosing a high wl value will increase the frequency resolution but reducethe temporal one, and vice versa. The frequency precision is obtained by calculating the ratio f/wl,and the temporal precision is obtained by calculating the reverse ratio wl/f. This problem can bereduced in some way with zp that adds 0 values on both sides of the analysis window. This increasesfrequency resolution without altering time resolution.Any colour palette can be used. In particular, it is possible to use other palettes coming with see-wave: temp.colors, reverse.gray.colors.1, reverse.gray.colors.2, reverse.heat.colors,reverse.terrain.colors, reverse.topo.colors, reverse.cm.colors corresponding to the re-verse of heat.colors, terrain.colors, topo.colors, cm.colors.Use locator to identify points. The noise reduction using the argument noisereduction is an im-age filter, not a signal filter. The principle consists in subtracting each spectrogram row or columnby its median. Noise reduction alters energy conservation, it should then be used for visual displayonly.
Value
This function returns a list of three items:
time a numeric vector corresponding to the time axis.
freq a numeric vector corresponding to the frequency axis.
amp a numeric or a complex matrix corresponding to the amplitude values. Eachcolumn is a Fourier transform of length wl/2.
Note
The argument fftw can be used to try to speed up process time. When set to TRUE, the Fouriertransform is computed through the function FFT of the package fftw. This pacakge is a wrapperaround the fastest Fourier transform of the free C subroutine library FFTW (http://www.fftw.org/). FFT should be then installed on your OS.
Note
This function is based on fft, contour and filled.contour

spectro 185
Author(s)
Jerome Sueur and Caroline Simonis.
References
Hopp, S. L., Owren, M. J. and Evans, C. S. (Eds) 1998. Animal acoustic communication. Springer,Berlin, Heidelberg.
See Also
ggspectro, spectro3D, lts, dynspec, wf, oscillo, dBscale, fft.
Examples
## Not run:data(tico)data(pellucens)# simple plotsspectro(tico,f=22050)spectro(tico,f=22050,osc=TRUE)spectro(tico,f=22050,scale=FALSE)spectro(tico,f=22050,osc=TRUE,scale=FALSE)# change the dB scale by setting a different dB reference value (20microPa)spectro(tico,f=22050, dBref=2*10e-5)# unnormalised spectrogram with a linear amplitude scalespectro(tico, dB=NULL, norm=FALSE, scale=FALSE)# manipulating wlop<-par(mfrow=c(2,2))spectro(tico,f=22050,wl=256,scale=FALSE)title("wl = 256")spectro(tico,f=22050,wl=512,scale=FALSE)title("wl = 512")spectro(tico,f=22050,wl=1024,scale=FALSE)title("wl = 1024")spectro(tico,f=22050,wl=4096,scale=FALSE)title("wl = 4096")par(op)# vertical zoom using flimspectro(tico,f=22050, flim=c(2,6))spectro(tico,f=22050, flimd=c(2,6))# a full plotpellu2<-cutw(pellucens,f=22050,from=1,plot=FALSE)spectro(pellu2,f=22050,ovlp=85,zp=16,osc=TRUE,
cont=TRUE,contlevels=seq(-30,0,20),colcont="red",lwd=1.5,lty=2,palette=reverse.terrain.colors)
# black and white spectrogramspectro(pellu2,f=22050,ovlp=85,zp=16,
palette=reverse.gray.colors.1)# colour modificationsdata(sheep)spectro(sheep,f=8000,palette=temp.colors,collevels=seq(-115,0,1))spectro(pellu2,f=22050,ovlp=85,zp=16,

186 spectro3D
palette=reverse.cm.colors,osc=TRUE,colwave="orchid1")spectro(pellu2,f=22050,ovlp=85,zp=16,osc=TRUE,palette=reverse.heat.colors,colbg="black",colgrid="white", colwave="white",colaxis="white",collab="white")
## End(Not run)
spectro3D 3D-spectrogram of a time wave
Description
This function returns a three-dimension spectrographic representation of a time wave. The functioncorresponds to short-term Fourier transform.
Usage
spectro3D(wave, f, channel = 1, wl = 512, wn = "hanning", zp = 0,ovlp = 0, noisereduction = FALSE, norm = TRUE, correction = "none", fftw = FALSE,dB = "max0", dBref = NULL, plot = TRUE,magt = 10, magf = 10, maga = 2,palette = reverse.terrain.colors)
Arguments
wave an R object.
f sampling frequency of wave (in Hz). Does not need to be specified if embeddedin wave.
channel channel of the R object, by default left channel (1).
wl length of the window for the analysis (even number of points).
wn window name, see ftwindow (by default "hanning").
zp zero-padding (even number of points), see Details.
ovlp overlap between two successive windows (in % ).
noisereduction a logical, if TRUE a noise reduction is applied.
norm if TRUE the STFT is normalised (i. e. scaled) by its maximum.
correction a character vector of length 1 to apply an amplitude ("amplitude") or an energy("energy") correction to the FT window. This argument is useful only when onewish to obtain absolute values that is when norm=FALSE, scaled=FALSE, andPMF=FALSE. By default no correction is applied ("none").
fftw if TRUE calls the function FFT of the library fftw. See Notes of the spectro.
dB a character string specifying the type dB to return: "max0" for a maximum dBvalue at 0, "A", "B", "C", "D", and "ITU" for common dB weights.
dBref a dB reference value when dB is TRUE. NULL by default but should be set to2*10e-5 for a 20 microPa reference.
spectro3D 187
plot logical, if TRUE plots the spectrogram (by default TRUE).
magt magnification of the time axis.
magf magnification of the frequency axis.
maga magnification of the amplitude axis.
palette a color palette function to be used to assign colors in the plot, see Details.
Details
Following Heisenberg uncertainty principle, the short-term Fourier transform cannot be precised inboth time and frequency. The temporal and frequency precisions of the function are actually depen-dent of the wl value. Choosing a high wl value will increase the frequency resolution but reducethe temporal one, and vice versa. The frequency precision is obtained by calculating the ratio f/wl,and the temporal precision is obtained by calculating the reverse ratio wl/f. This problem can bereduced in some way with zp that adds 0 values on both sides of the analysis window. This increasesfrequency resolution without altering time resolution.Any colour palette can be used. In particular, it is possible to use other palettes coming withseewave: reverse.gray.colors.1, reverse.gray.colors.2, spectro.colors, temp.colors,reverse.heat.colors, reverse.cm.colors, reverse.topo.colors, corresponding to the re-verse of heat.colors,topo.colors, cm.colors.Use magt, magf and maga to resize the plot.
Value
This function returns a list of three items:
time a numeric vector corresponding to the time axis.
freq a numeric vector corresponding to the frequency axis.
amp a numeric matrix corresponding to the amplitude values. Each column is aFourier transform of length wl/2.
Note
This function requires rgl and is based on fft. See examples of spectro for analysis arguments(wl,zp, ovlp).
Author(s)
Jerome Sueur <[email protected]> and Caroline Simonis <[email protected]>.
See Also
spectro, ggspectro, lts, dynspec, wf, fft.

188 squarefilter
Examples
## Not run:require(rgl)data(tico)spectro3D(tico,f=22050,wl=512,ovlp=75,zp=16,maga=4,palette=reverse.terrain.colors)# linear amplitude scale without a normisation of the STFT matrix# time and frequency scales need to be dramatically amplifiedspectro3D(tico, norm=FALSE, dB=NULL, magt=100000, magf=100000)
## End(Not run)
squarefilter Frequency square filter
Description
This function prepares the amplitude profile of a square frequency filter.
Usage
squarefilter(f, from = NULL, to = NULL, bandpass = TRUE, wl = 1024)
Arguments
f a numeric vector of length 1 for the sampling frequency of the object to befiltered (in Hz).
from a numeric vector for the start frequencies (in Hz) where to apply the filter.
to a numeric vector of the end frequencies (in Hz) where to apply the filter.
bandpass if TRUE a band-pass filter is prepared between start and end frequencies (argu-ments from and to), if FALSE a bandstop filter is prepared.
wl window length of the impulse filter (even number of points).
Value
The function returns a two-column matrix, the first column is the frequency in kHz and the secondcolumn is the amplitude of the filter (frequency response of the filter).
Note
This function can be used to prepare bandpass or bandstop filters to be used with fir and ffilter.See examples.
Author(s)
Laurent Lellouch

symba 189
See Also
fir, drawfilter, ffilter, combfilter, bwfilter
Examples
f <- 44100a <- noisew(f = f, d = 1)p <- squarefilter(f, from = c(100, 1000, 4000), to = c(500, 3000, 8000))plot(p, type="l")h <- fir(a, f = f, custom = p, wl = 1024, output = 'Wave')spectro(h)
symba Symbol analysis of a numeric (time) series
Description
This function analyses one or two sequences of symbols from numeric (time) series.
Usage
symba(x, y = NULL, symb = 5, collapse = TRUE, entropy = "abs",plot = FALSE, type = "l", lty1 = 1, lty2 = 2, col1 = 2, col2 = 4,cex1 = 0.75, cex2= 0.75, xlab = "index", ylab = "Amplitude", legend=TRUE, ...)
Arguments
x a first R object.y a second R objectsymb the number of symbols used for the discretisation, can be set to 3 or 5 only.collapse logical, if TRUE, the symbols are pasted in a character string of length 1.entropy either "abs" for an absolute value or "rel" for a relative value, i. e. between 0
and 1.plot logical, if TRUE plots the series x (and y) and the respective symbols.type if plot is TRUE, type of plot that should be drawn. See plot for details (by
default "l" for lines).lty1 line type of the object x if type="l".lty2 line type of the object y if type="l".col1 colour of the object x.col2 colour of the object y.cex1 character size of x symbols.cex2 character size of y symbols.xlab title of the x axis.ylab title of the y axis.legend logical, if TRUE and if y is not NULL adds a legend to the plot.... other plot graphical parameters.

190 symba
Details
The analysis consists in transforming the series into a sequence of symbols (see the functiondiscrets) and in computing the absolute frequency of each symbol within the sequence.The entropy (H) is then calculated using the symbol frequencies. Using the argument entropy, theentropy can be expressed along an absolute scale or as a relative value varying between 0 and 1.If two numeric (time) series are provided (x and y) the absolute symbol frequencies and entropy ofeach series is returned. Besides the mutual information (I) is estimated according to:
I = Hx +Hy −Hxy
with Hx the entropy of x symbol series, Hy the entropy of y symbol series, and Hxy$ the jointentropy of x and y symbol series.
Value
If y is NULL a list of three items is returned (s1, freq1, h1).If y is not NULL, a list of 6 items is returned (s1, freq1, h1, s2, freq2, h2, I):
s1 the sequence of symbols of x,
freq1 the relative frequency of each x symbol,
h1 the entropy of x symbol sequence,
s2 the sequence of symbols of y,
freq2 the relative frequency of each y symbol,
h2 the entropy of y symbol sequence,
I the mutual information between x and y.
Note
It might be useful to round the values of the input series (see examples).The mutual information (I) should increase with the similarity between the series to compare (x andy).
Author(s)
Jerome Sueur <[email protected]>
References
Cazelles, B. 2004 Symbolic dynamics for identifying similarity between rhythms of ecological timeseries. Ecology Letters, 7: 755-763.
See Also
discrets, SAX

synth 191
Examples
# analysis of a frequency spectrumdata(tico)spec1<-spec(tico,f=22050,at=0.2,plot=FALSE)symba(spec1[,2],plot=TRUE)# it might be better to round the valuessymba(round(spec1[,2],2),plot=TRUE)# in that case the symbol entropy is close to the spectral entropysymba(round(spec1[,2],2),entrop="rel")$h1sh(spec1)# to compare two frequency spectraspec2<-spec(tico,f=22050,wl=512,at=1.1,plot=FALSE)symba(round(spec1[,2],2),round(spec2[,2],2),plot=TRUE)
synth Synthesis of time wave (additive model)
Description
This functions synthesizes pure or harmonic tone sound with amplitude modulation (am) and/orfrequency modulation (fm).
Usage
synth(f, d, cf, a = 1, signal = "sine", shape = NULL, p = 0,am = c(0, 0, 0), fm = c(0, 0, 0, 0, 0), harmonics = 1,plot = FALSE, listen = FALSE, output = "matrix",...)
Arguments
f sampling frequency (in Hz).
d duration (in s).
cf carrier frequency (in Hz).
a amplitude (linear scale, relative when adding different waves).
signal a character vector specifying the shape of the signal, see details.
shape modification of the whole amplitude shape of the wave, see details.
p initial phase (in radians).
am a numeric vector of length 3 describing amplitude modulation parameters, seedetails.
fm a numeric vector of length 5 describing frequency modulation parameters, seedetails.
harmonics a numeric specifying the number and the relative amplitude of harmonics, seedetails.
plot if TRUE returns the spectrogram of the synthezised sound (by default FALSE).

192 synth
listen if TRUE the new sound is played back.output character string, the class of the object to return, either "matrix", "Wave",
"Sample", "audioSample" or "ts".... other spectro graphical parameters.
Details
• signal is a character vector of length 1 that specifies the function used to synthesize thesignal. There are three options:
1. "sine": for a sinus function,2. "tria": for a triangle function,3. "square": for a square function,4. "saw": for a square function.
• shape is a character vector of length 1 that allows to modify the whole amplitude shape of thewave. There are four options:
1. "incr": linear increase2. "decr": linear decrease3. "sine": sinusoid-like shape4. "tria": triangular shape
• am is a numeric vector of length 3 including:1. the amplitude modulation depth (in %)2. the frequency of the amplitude modulation (in Hz),3. the phase of the amplitude modulation (in radian).
• fm is a numeric vector of length 5 including:1. the maximum excursion of a sinusoidal frequency modulation (in Hz),2. the frequency of a sinusoidal frequency modulation (in Hz),3. the maximum excursion of a linear frequency modulation (in Hz).4. the phase of the frequency modulation (in radian).5. the maximum excursion of an exponential frequency modulation (in Hz).
• harmonics is a numeric vector that controls the number and the relative amplitude of harmon-ics synthesized.By default harmonics = 1 meaning that a pure tone made of a single harmonic (fundamental)will be produced.To produce harmonics, the length of harmonics has to be greater than 1. The length ofharmonics will set the number of harmonics, including the first one (fundamental). The valueof each element of harmonics specify the relative ampltiude of each harmonic. The first valuemust equal to 1.Here are some examples:
– harmonics = c(1,0.5,0.25) will produce a sound with three harmonics (fundamental +2 harmonics), the second harmonic having an amplitude half the fundamental ampltiudeand the second harmonic an amplitude a quarter of the fundamental amplitude.
– harmonics = c(1,0,0.25) will produce a sound with two harmonics (fundamental + 1harmonic) the second harmonic having a null relative amplitude.
– harmonics = rep(1,4) will produce a sound with four harmonics (fundamental + 3 har-monics) of equal amplitude.

synth 193
Value
If plot is FALSE, a new wave is returned. The class of the returned object is set with the argumentoutput.
Author(s)
Jerome Sueur and Laurent Lellouch.
References
Hartmann, W. M. 1998 Signals, sound and sensation. New York: Springer.
See Also
synth2, noisew, pulse, echo
Examples
## You can use plot=TRUE and spectro() options## to directly 'see' the new-built soundsf <- 8000 # sampling frequencyd <- 1 # duration (1 s)cf <- 440 # carrier frequecy (440 Hz, i.e. flat A tone)# pure sinusoidal tones <- synth(f=f,d=d,cf=cf)# pure triangular tones <- synth(f=f,d=d,cf=cf, signal="tria")# pure tone with triangle overall shapes <- synth(f=f,d=d,cf=cf,shape="tria")# pure tones with ams <- synth(f=f,d=d,cf=cf,am=c(50,10))# pure tones with am# and phase shift of pi radian (180 degrees)s <- synth(f=f,d=d,cf=cf,am=c(50,10,pi))# pure tone with +1000 Hz linear fms <- synth(f=f,d=d,cf=cf,fm=c(0,0,1000,0,0))# pure tone with sinusoidal fm# (maximum excursion of 250 Hz, frequency of 10 Hz)s <- synth(f=f,d=d,cf=cf,fm=c(250,10,0,0,0))# pure tone with sinusoidal fm# (maximum excursion of 250 Hz, frequency of 10 Hz,# phase shift of pi radian (180 degrees))s <- synth(f=f,d=d,cf=cf,fm=c(250,10,0, pi,0))# pure tone with sinusoidal am# (maximum excursion of 250 Hz, frequency of 10 Hz)# and linear fm (maximum excursion of 500 Hz)s <- synth(f=f,d=d,cf=cf,fm=c(250,10,500,0,0))# the same with ams <- synth(f=f,d=d,cf=cf,am=c(50,10), fm=c(250,10,250,0,0))# the same with am and a triangular overall shapes <- synth(f=f,d=d,cf=cf,shape="tria",am=c(50,10), fm=c(250,10,250,0,0))# an harmonic sound
194 synth2
s <- synth(f=f,d=d,cf=cf, harmonics=c(1, 0.5, 0.25))# a clarinet-like soundclarinet <- c(1, 0, 0.5, 0, 0.14, 0, 0.5, 0, 0.12, 0, 0.17)s <- synth(f=f, d=d, cf = 235.5, harmonics=clarinet)# inharmonic FM sound built 'manually'fm <- c(250,5,0,0,0)F1<-synth(f=f,d=d,cf=cf,fm=fm)F2<-synth(f=f,d=d,a=0.8,cf=cf*2,fm=fm)F3<-synth(f=f,d=d,a=0.6,cf=cf*3.5,fm=fm)F4<-synth(f=f,d=d,a=0.4,cf=cf*6,fm=fm)final1<-F1+F2+F3+F4spectro(final1,f=f,wl=512,ovlp=75,scale=FALSE)
synth2 Synthesis of time wave (tonal model)
Description
This functions synthesizes pure tone sound based on an amplitude envelope and an instantaneousfrequency contour. The function can also be used to modify a reference sound.
Usage
synth2(env = NULL, ifreq, f, plot = FALSE, listen = FALSE, output = "matrix", ...)
Arguments
env a numeric vector describing the amplitude envelope (i.e. the amplitude modula-tion). By default NULL, generating a squared enveloppe.
ifreq a numeric vector describing the instantaneous frequency (in Hz).f a numeric vector for the sampling frequency (in Hz)plot if TRUE returns the spectrogram of the synthezised sound (by default FALSE).listen if TRUE the new sound is played back.output character string, the class of the object to return, either "matrix", "Wave",
"Sample", "audioSample" or "ts".... other spectro graphical parameters.
Details
env and ifreq must have exactly the same length.The amplitude envelope can be obtained with the Hilbert envelope (function env) and the instanta-neous frequency can be obtained with the Hilbert transform (function ifreq). This opens a greatvariety of signal modidications as shown in the example section.
Value
If plot is FALSE, a new wave is returned. The class of the returned object is set with the argumentoutput.
synth2 195
Author(s)
Jérôme Sueur and Laurent Lellouch
References
Beeman, K. 1998 Digital signal analysis, editing and synthesis, in Animal acoustic communicationedited by Hopp SL, Owren MJ, Evans CS, Springer, 59-103.
See Also
synth2, noisew, pulse, echo
Examples
## You can use plot=TRUE and spectro() options## to directly 'see' the new-built sounds## MODIFICATION OF A REFERENCE SIGNALdata(tico)env.tico <- env(tico, f=22050, plot=FALSE)ifreq.tico <- ifreq(tico, f=22050, plot=FALSE)$f[,2]# recover the original signals <- synth2(env=env.tico, ifreq=ifreq.tico*1000, f=22050)# original signal with instantaneous frequency reverseds <- synth2(env=env.tico, ifreq=rev(ifreq.tico)*1000, f=22050)# original signal with a +1000 Hz linear frequency shifts <- synth2(env=env.tico, ifreq=ifreq.tico*1000+1000, f=22050)# original signal with instantaneous frequency multiplied by 2s <- synth2(env=env.tico, ifreq=ifreq.tico*1000*2, f=22050)# original signal with a linear instantaneous frequency at 2000 Hzs <- synth2(env=env.tico, ifreq=rep(2000, times=length(tico@left)), f=22050)
## DE NOVO SYNTHESIS# instantaneous frequency increasing by step of 500 Hzs <- synth2(ifreq=rep(c(500,1000,1500,2000,2500,3000,3500,4000), each=2000), f=16000)# square function of the instantaenous frequencys <- synth2(ifreq=500+seq(-50,50, length.out=8000)^2, f=8000)# linear increase of the amplitude envelopes <- synth2(env=seq(0,1,length=8000), ifreq=rep(2000,8000), f=8000)# square-root increase of the amplitude envelopes <- synth2(env=sqrt(seq(0,1,length=8000)), ifreq=rep(2000,8000), f=8000)# square-root increase and decrease of the amplitude envelopes <- synth2(env=c(sqrt(seq(0,1,length=4000)), sqrt(seq(1,0,length=4000))),
ifreq=rep(2000,8000), f=8000)# amplitude envelope and instantaneous frequency following a normal density shapenorm <- rep(dnorm(-4000:3999, sd=1000), 2)s <- synth2(env=norm, ifreq=500+(norm/max(norm))*1000, f=8000)

196 TFSD
TFSD normalized Time and Frequency Second Derivative
Description
This function computes the normalized Time and Frequency Second Derivative as described byAumond et al. (2017).
Usage
TFSD(wave, f, channel = 1, ovlp = 0, wn = "hamming", flim = c(2,6), nbwindows = 1)
Arguments
wave an R object.
f sampling frequency of wave (in Hz). Does not need to be specified if embeddedin wave.
channel channel of the R object, by default left channel (1).
ovlp overlap between two successive windows (in %).
wn window name, see ftwindow (by default "hanning").
flim a numeric vector of length 2 to select a frequency band (in kHz). Cannot beNULL.
nbwindows a numeric vector of length 1 specifying the number of windows (by default 1, iea single window including the complete wave object.
Details
The TFSD aims at estimating the time of presence of avian or human vocalizations within a soundenvironment. It calculates the variation in time and frequency of a signal around frequencies ofinterest, normalized by the spectral time variation of a signal as a whole.
Warning, this index was initially developed to work from a third octave spectrogram with a timesampling of 125 ms.
TFSD is computed according to formulation in reference.
The higher the TFSD varies between 0 and 1, the greater the temporal presence of avian or humanvocalizations. With the default configuration, a TFSD > 0.3 indicates a very important presencetime of the vocalizations in the signal. The TFSD is always greater than 0.
Value
A numeric vector of length nbwindows giving the TFSD values.

th 197
Author(s)
Pierre Aumond, Guillaume Corbeau
References
Aumond, P., Can, A., De Coensel, B., Botteldooren, D., Ribeiro, C., & Lavandier, C. (2017). Mod-eling soundscape pleasantness using perceptual assessments and acoustic measurements along pathsin urban context. Acta Acustica united with Acustica, 12, 50-67.
Gontier, F., Lavandier, C., Aumond, P., Lagrange, M., & Petiot, J. F. (2019). Estimation of theperceived time of presence of sources in urban acoustic environments using deep learning tech-niques. Acta Acustica united with Acustica, 105(6), 1053-1066.
See Also
ACI, NDSI
Examples
## Note that 'tico' is not a soundscape recording...data(tico)TFSD(tico)## dividing the sound sample into 4 windows of equal durationTFSD(tico, nbwindows=4)## selection of a frequency bandTFSD(tico, flim=c(2,6))
th Temporal entropy
Description
Compute the entropy of a temporal envelope.
Usage
th(env, breaks)
Arguments
env a data set resulting of an envelope obtained using env
breaks ’breaks’ argument of hist to compute the entropy on the distribution obtainedwith an histogram.

198 th
Details
Temporal entropy is calculated according to:
S = −∑Ni=1 yilog2(yi)
log2(N)
with:y = relative amplitude of the i envelope point,and
N∑i=1
yi = 1
and N = number of envelope points.
Value
A single value varying between 0 and 1 is returned. The value has no unit.
Note
The temporal entropy of a noisy signal with many amplitude modulations will tend towards 1whereas the temporal entropy of quiet signal will tend towards 0.Note, however, that a sustained sound with an almost flat envelope will also show a very high tem-poral entropy except if you compute the entropy on the distribution obtained with the histogram.See examples.
Author(s)
Jerome Sueur, George Zhan for the idea and implementation of the argument breaks.
See Also
sh, csh, H
Examples
# Temporal entropy of a cicada songdata(orni)envorni<-env(orni,f=22050,plot=FALSE)th(envorni)# Smoothing the envelope might slightly change the result.envorniS<-env(orni,f=22050,smooth=c(50,0),plot=FALSE)th(envorniS)# If we mute a part of the cicada song, the temporal entropy decreasesorni2<-mutew(orni,f=22050,from=0.3,to=0.55,plot=FALSE)envorni2<-env(orni2,f=22050,plot=FALSE)th(envorni2)# The temporal entropy of noise tends towards 1a<-noisew(d=1,f=8000)enva<-env(a,f=8000,plot=FALSE)th(enva)
tico 199
# But be aware that the temporal entropy# of a sustained sound also tends towards 1b<-synth(f=8000,d=1,cf=2000,plot=FALSE)envb<-env(b,f=8000,plot=FALSE)th(envb)# except if you use the distribution of the histogramth(envb, breaks="Sturges")
tico Song of the bird Zonotrichia capensis
Description
Recording of a song emitted by a male of the neotropical sparrow Zonotrichia capensis.
Usage
data(tico)
Format
A Wave object.
Details
Duration = 1.795 s. Sampling frequency = 22050 hz.
Source
Recording by Thierry Aubin.
Examples
data(tico)oscillo(tico,f=22050)

200 timelapse
timelapse Time lapse
Description
Append successive input sounds into a single output sound
Usage
timelapse(dir, from = 1, to = Inf,units = c("samples", "seconds", "minutes", "hours"), verbose = TRUE)
Arguments
dir a character vector, the path to the directory where the .wav files are stored ordirectly the names of the .wav files to be appended.
from where to start reading the input files, in units. See readWave of the packagetuneR.
to where to stop reading, in units. See readWave of the package tuneR.
units time units in which from and to is given, the default is "samples", but can beset to time intervals such as "seconds". See readWave of the package tuneR.
verbose a logical, if TRUE (default) the file number and name processed are displayed inthe console.
Details
The function takes the .wav files which names are provided in the argument dir and append (paste)them successively so that a single object is obtained. This can be used to produce sound time lapsebased on a series of ordered files as those produced by an automatic recorder (e.g. SongMeter ofthe society ’Wildlife Acoustics’).Only a section of each file can be extracted by using the arguments from and to. The function isbased on readWave and bind of the package tuneR.
Value
A Wave object, a class defined in the package tuneR.
Note
The characteristics (sampling rate, number of bits, stereo/mono) of the output object are those ofthe .wav file.The files should be alphabatically ordered according to time to ensure a proper time lapse.You should use either savewav or writeWave to save the results as a .wav file.
Author(s)
Jérôme Sueur

timer 201
See Also
pastew
Examples
## Not run:## if 'dir' contains a set of files recorded with a Wildlife Acoustics# songmeter recorder then a direct way to obtain# the spectrogram of all .wav files isdir <- "pathway-to-directory-containing-wav-files"res <- timelapse(dir)# to extract a selection of each file (here a section starting# at 10 s and ending at 12 s)res <- timelapse(dir, from=10, to=12, unit="seconds")
## End(Not run)
timer Time measurements of a time wave
Description
This function computes and shows the duration of signal periods, pause periods and their ratio.
Usage
timer(wave, f, channel = 1, threshold = 5, dmin = NULL, envt="abs",power = 1, msmooth = NULL, ksmooth = NULL,ssmooth = NULL, asmooth=NULL, tlim = NULL, plot = TRUE, plotthreshold = TRUE,col = "black", colval = "red",xlab = "Time (s)", ylab = "Amplitude", ...)
Arguments
wave an R object.
f sampling frequency of wave (in Hz). Does not need to be specified if embeddedin wave.
channel channel of the R object, by default left channel (1).
threshold amplitude threshold for signal detection (in %), or alternatively a function to beapplied on the waveform scaled between 0 and 1. See examples.
dmin time threshold (minimum duration) for signal detection (in s).
envt the type of envelope to be used: either "abs" for absolute amplitude envelope or"hil" for Hilbert amplitude envelope. See env.
power a power factor applied to the amplitude envelope. Increasing power will reducelow amplitude modulations and increase high amplide modulations. This can beused to reduce background noise (by default equals to 1, i.e. no change.
202 timer
msmooth a vector of length 2 to smooth the amplitude envelope with a mean sliding win-dow. The first component is the window length (in number of points). Thesecond component is the overlap between successive windows (in %). See env.
ksmooth kernel smooth for the amplitude enveloppe via kernel. See env.
ssmooth sum smooth for the amplitude enveloppe. See env.
asmooth autocorrelation smooth for the amplitude enveloppe. See env.
tlim modifications of the time X-axis limits.
plot logical, if TRUE plots the envelope and the measurements (by default TRUE).
plotthreshold logical, if TRUE plots the threshold as an horizontal line on the graph (by defaultTRUE).
col colour of the envelope.
colval colour of plotted measurements.
xlab title of the x-axis.
ylab title of the y-axis.
... other plot graphical parameters.
Value
A list containing seven items:
s duration of signal period(s) in seconds
p duration of pause period(s) in seconds
r ratio between the signal and silence periods(s)
positions a list containing four elements:
s.start start position(s) of signal period(s)
s.end end position(s) of signal period(s)
first whether the first event detected is a pause or a signal
Warning
Setting to high values to msmooth or ssmooth might return inaccurate results. Double check yourresults if so.
Author(s)
Jerome Sueur
See Also
env, cutw, pastew.

TKEO 203
TKEO Teager-Kaiser energy tracking operator
Description
This function computes the Teager-Kaiser energy operator.
Usage
TKEO(wave, f, channel = 1, m = 1, M = 1, plot = TRUE,xlab = "Time (s)", ylab = "Energy",type = "l", bty = "l", ...)
Arguments
wave an R object.
f sampling frequency of wave (in Hz). Does not need to be specified if embeddedin wave.
channel channel of the R object, by default left channel (1).
m a numeric vector of length 1 for the exponent parameter. See details.
M a numeric vector of length 1 for the lag parameter. See details.
plot logical, if TRUE returns a plot of the TK energy along time (by default TRUE).
xlab Label of time x-axis.
ylab Label of energy y-axis.
type if plot is TRUE, type of plot that should be drawn. See plot for details (bydefault "l" for lines).
bty the type of box to be drawn around the energy plot.
... other plot graphical parameters.
Details
The discrete version of the Teager-Kaiser operator is computed according to:
yn = x2/mn − (xn−M × xn+M )1/m
,with m the exponent parameter and M the lag parameter which both are usually equal to 1 for aconventional operator.The Teaser-Kaiser operator can be used to track amplitude modulations (AM) and/or frequencymodulations (FM).See examples.

204 TKEO
Value
This function returns a two-column matrix, the first column is time and the second column includesthe successive energy values.m/2 NA values are added at the start and end of the vector.
Author(s)
Jerome Sueur
References
Kvedalen, E. (2003). Signal processing using the Teager Energy Operator and other nonlinearoperators. University of Oslo, Department of Informatics, PhD Thesis, x + 100 p.
See Also
env, ifreq.
Examples
op <- par(mfrow=c(2,1))
## sinusoid AMs1 <- synth(f=8000, d=0.1, cf=200, am=c(100,10), output="Wave")oscillo(s1)TKEO(s1)## linear AM decreases2 <- synth(f=8000, d=0.1, cf=200, shape="decr", output="Wave")oscillo(s2)TKEO(s2)## sinusoid FMs3 <- synth(f=8000, d=0.1, cf=200, fm=c(150,50,0,0,0), output="Wave")oscillo(s3)TKEO(s3)## linear FM increases4 <- synth(f=8000, d=0.1, cf=200, fm=c(0,0,600,0,0), output="Wave")oscillo(s4)TKEO(s4)## AM and FMs5 <- synth(f=8000, d=0.1, cf=200, am=c(100,10), fm=c(150,50,0,0,0), output="Wave")oscillo(s5)TKEO(s5)par(op)

wasp 205
wasp WAve length and SPeed of sound
Description
This function returns the wavelength and the speed of sound of a given frequency in air, fresh-wateror sea-water.
Usage
wasp(f, t = 20, c = NULL, s = NULL, d = NULL, medium = "air")
Arguments
f frequency (Hz).
t temperature (degree Celsius).
c celerity (m/s) if a wavelength is to be found at a particular speed of sound.
s salinity (parts per thousand) when medium is "sea".
d depth (m) when medium is "sea".
medium medium for sound propagation, either "air", "fresh" for fresh, or pure, water,"sea" for sea water.
Details
Speed of sound in air is computed according to:
c = 331.4 + 0.6× t
Speed of sound in fresh-water is computed according to Marczak equation:
c = 1.402385.103 + 5.038813× t− 5.799136.10−2 × t2
+3.287156.10−4 × t3 − 1.398845.10−6 × t4
+2.787860.10−9 × t5
with t = temperature in degrees Celsius; range of validity: 0-95 degrees Celcius at atmosphericpressure.
Speed of sound in sea-water is computed according to Mackenzie equation:
c = 1448.96 + 4.591× t− 5.304.10−2 × t2
+2.374.10−4 × t3 + 1.34× (s− 35) + 1.63.10−2 × d
+1.675.10−7 × d2 − 1.025.10−2 × t× (s− 35)

206 wasp
−7.139.10−13 × t× d3
with t = temperature in degrees Celsius; s = salinity in parts per thousand; d = depth in meters;range of validity: temperature 2 to 30 degrees Celcius, salinity 25 to 40 parts per thousand, depth 0to 8000 m.
Wavelength is obtained following:
λ =c
f
with c = speed of sound in meters/second; f = frequency in Hertz.
Value
A list of two values is returned:
l wavelength in meters
c speed of sound in meters/second.
Author(s)
Jerome Sueur <[email protected]>
References
http://resource.npl.co.uk
Examples
# wavelength (m) of a 2000 Hz air-borne sound at 20 degrees Celsiuswasp(f=2000)$l# [1] 0.1717
# sound speed in sea at 0 and -500 m# for a respective temperature of 22 degrees Celcius and 11 degrees Celciuswasp(f=1000,s=30,d=c(0,500),t=c(22,11),medium="sea")$c# [1] 1521.246 1495.414
# wavelength (m) of a 1000 Hz sound in a medium unspecified where c = 1497 m/swasp(f=1000,c=1497)$l# [1] 1.497
# variation of wavelength according to frequency and air temperatureop<-par(bg="lightgrey")a<-seq(1000,20000,by=100) ; na<-length(a)b<-seq(-20,40,by=10) ; nb<-length(b)res<-matrix(numeric(na*nb),nrow=na)for(i in 1:nb) res[,i]<-wasp(a,t=b[i])$lmatplot(x=a,y=res,type="l",lty=1,col= spectro.colors(nb),
xlab="Frequency (Hz)",ylab="Wavelength (m)")title("Wavelength of air-borne sound at different temperatures (deg. C)")

wav2flac 207
legend(x=15000,y=0.3,c("-20","-10","0","10","20","30","40"),lty=1,col= spectro.colors(nb),bg="grey")
par(op)
wav2flac wav-flac file conversion
Description
This function converts .wav files into .flac files and reversely
Usage
wav2flac(file, reverse = FALSE, overwrite = FALSE,exename = NULL, path2exe = NULL)
Arguments
file the .wav or .flac file to convert.
reverse logical, if TRUE converts a .flac file into a .wav file.
overwrite logical, if TRUE overwrites the file to convert.
exename a character string specifying the name of the FLAC binary file. If NULL, thededault name "flac" will be used for Linux OS and "flac.exe" for Windows OS.
path2exe a character string giving the path to the FLAC binary file. If NULL, the dedaultpath "c:/Program Files/FLAC/" will be used for Windows OS.
Details
The function runs FLAC. FLAC has then to be installed first, if not the function will not work.
Value
A new file is created.
Note
FLAC must be installed to use this function but not to install the package seewave. Free LosslessAudio Codec (FLAC) is a file format by Josh Coalson for lossless audio data compression. FLACreduces bandwidth and storage requirements without sacrificing the integrity of the audio source.Audio sources encoded to FLAC are typically reduced in size 40 to 50 percent.
Author(s)
Luis J. Villanueva-Rivera
References
FLAC website: https://xiph.org/flac/

208 wf
See Also
savewav
Examples
## Not run:# synthesis of a 1kHz sounda<-synth(d=10,f=8000,cf=1000)# save it as a .wav file in the default working directorysavewav(a,f=8000)# compress it to FLAC format and overwrite on the file a.wavwav2flac("a.wav", overwrite=TRUE)# back to .wav formatwav2flac("a.flac", reverse=TRUE)# remove the filesunlink(c("a.wav","a.flac"))
## End(Not run)
wf Waterfall display
Description
This function returns a waterfall display of a short-term Fourier transform or of any matrix.
Usage
wf(wave, f, channel = 1, wl = 512, zp = 0, ovlp = 0, fftw= FALSE, dB = "max0",dBref = NULL, wn = "hanning", x = NULL,hoff = 1, voff = 1, col = heat.colors,xlab = "Frequency (kHz)", ylab = "Amplitude (dB)",xaxis = TRUE, yaxis = TRUE,density = NULL, border = NULL, lines = FALSE, lwd=NULL, ...)
Arguments
wave an R object.
f sampling frequency of wave (in Hz). Does not need to be specified if embeddedin wave.
channel channel of the R object, by default left channel (1).
wl window length for the analysis (even number of points). (by default = 512)
zp zero-padding (even number of points), see Details.
ovlp overlap between two successive windows (in %).
fftw if TRUE calls the function FFT of the library fftw. See Notes of the spectro.

wf 209
dB a character string specifying the type dB to return: "max0" for a maximum dBvalue at 0, "A", "B", "C", "D", and "ITU" for common dB weights.
dBref a dB reference value when dB is TRUE. NULL by default but should be set to2*10e-5 for a 20 microPa reference.
wn window name, see ftwindow (by default "hanning").
x a matrix if wave is not provided.
hoff horizontal ’offset’ which shifts actual x-values slightly per row for visibility.Fractional parts will be removed.
voff vertical ’offset’ which separates traces.
col a color or a color palette function to be used to assign colors in the plot
xlab title of the frequency x-axis.
ylab title of the amplitude y-axis.
xaxis a logical, if TRUE adds the frequency x-axis according to f.
yaxis a logical, if TRUE adds the amplitude y-axis according.
density argument of polygon: the density of shading lines, in lines per inch. The defaultvalue of ’NULL’ means that no shading lines are drawn. A zero value of ’den-sity’ means no shading nor filling whereas negative values (and ’NA’) suppressshading (and so allow color filling).
border argument of polygon: the color to draw the border. The default, ’NULL’, meansto use ’par("fg")’. Use ’border = NA’ to omit borders.
lines a logical, if TRUE plots lines instead of surfaces (polygons).
lwd line width.
... other graphical arguments to passed to plot
Details
Data input can be either a time wave (wave) or a matrix (x). In that case, if xaxis is set to TRUE thex-axis will follow the row index. To change it, turn xaxis to FALSE and use axis afterwards. Seeexamples.
Note
The function is well adapted to display short-term Fourier transform. However, any matrix can becalled using the argument x instead of wave.
Author(s)
Carl G. Witthoft and Jerome Sueur <[email protected]>
See Also
spectro, spectro3D, dynspec

210 write.audacity
Examples
data(tico)wf(tico,f=22050)# changing the display parametersjet.colors <- colorRampPalette(c("blue", "green"))wf(tico,f=22050, hoff=0, voff=2, col=jet.colors, border = NA)# matrix input instead of a time wave and transparent lines displaym <- numeric()for(i in seq(-pi,pi,len=40)) {m <- cbind(m,10*(sin(seq(0,2*pi,len=100)+i)))}wf(x=m, lines=TRUE, col="#0000FF50",xlab="Time", ylab="Amplitude",main="waterfall display")
write.audacity Audacity audio markers export
Description
Write audio markers to be imported by Audacity.
Usage
write.audacity(x, filename)
Arguments
x a data frame with the three or five colums, see details.
filename name of the .txt file. (by default the name of x).
Details
The input x object should be a data frame with two or three columns depending on whether themarkers include frequency limits or not :
• time limits only:
1. text label of each marker,2. time marker of the beginning of each marker,3. time marker of the end of each marker.
• time and frequency limits:
1. text label of each marker,2. time marker of the beginning of each marker,3. time marker of the end of each marker,4. lower frequency limit of each marker,5. higher frequency limit of each marker.

zapsilw 211
Value
A .txt file is generated to be imported as a markers in Audacity.
Note
Naming the columns of x is not necessary.
Author(s)
Jerome Sueur
References
Audacity is a free software distributed under the terms of the GNU General Public License.Web site: https://www.audacityteam.org/
See Also
read.audacity
Examples
## 3 markers, time onlyt1 <- c(9.2, 16.2, 24.4)t2 <- c(11.7, 18.7, 26.9)label <- c("a", "b", "c")df <- data.frame(label, t1, t2)write.audacity(df, filename="test-time.txt")## 3 markers, time and frequencyt1 <- c(9.4, 15.2, 24.9)t2 <- c(10.54, 16.6, 26.1)f1 <- c(1703.4, 3406.8, 1608.8)f2 <- c(7476.2, 8517.2, 5110.3)label <- c("a", "b", "c")dff <- data.frame(label, t1, t2, f1, f2)write.audacity(dff, filename="test-time-frequency.txt")## delete filesunlink(c("test-time.txt", "test-time-frequency.txt"))
zapsilw Zap silence periods of a time wave
Description
This function simply deletes the silence periods of a time wave.
Usage
zapsilw(wave, f, channel = 1, threshold = 5, plot = TRUE, output = "matrix", ...)

212 zc
Arguments
wave an R object.
f sampling frequency of wave (in Hz). Does not need to be specified if embeddedin wave.
channel channel of the R object, by default left channel (1).
threshold amplitude threshold (in %) between silence and signal.
plot logical, if TRUE plots the orginal and the new oscillograms (by default TRUE).
output character string, the class of the object to return, either "matrix", "Wave","Sample", "audioSample" or "ts".
... other oscillo graphical parameters.
Value
If plot is FALSE, a new wave is returned. The class of the returned object is set with the argumentoutput.
Note
Use the argument threshold to set the level of silence. See the examples.
Author(s)
Jerome Sueur <[email protected]>
See Also
afilter, oscillo
Examples
data(orni)zapsilw(orni,f=22050,colwave="red")# setting the threshold valuezapsilw(orni,f=22050,threshold=1)
zc Instantaneous frequency of a time wave by zero-crossing
Description
This function measures the period of a full oscillating cycle.
Usage
zc(wave, f, channel = 1, plot = TRUE, interpol = 1, threshold = NULL,xlab = "Time (s)", ylab = "Frequency (kHz)", ylim = c(0, f/2000),warning = TRUE, ...)

zc 213
Arguments
wave an R object.
f sampling frequency of wave (in Hz). Does not need to be specified if embeddedin wave.
channel channel of the R object, by default left channel (1).
plot logical, if TRUE plots the dominant frequency along the time wave(by defaultTRUE).
interpol a numeric vector of length 1, interpolation factor.
threshold amplitude threshold for signal detection (in % ).
xlab title of the x axis.
ylab title of the y axis.
ylim the range of y values.
warning a logial to specify if warning message should be displayed or not when interpolis > 100.
... other plot graphical parameters.
Details
If plot is FALSE, zc returns a vector of numeric data with the instantaneous frequency.
Value
If plot is FALSE, zc returns a two-column matrix, the first column corresponding to time in seconds(x-axis) and the second column corresponding to the instantaneous frequency of the time wave inkHz (y-axis).‘NA’s correspond either to pause periods (e. g. detected applying threshold) or sections of the timewave not crossing the zero line. To remove ‘NA’s with na.omit allows to get only instantaneousfrequency values but discards information about pause sections.
Note
interpol adds points to the time wave by linear interpolation (through approx). This increasesmeasurement precision but as well time process. Type argument of plot cannot be set to “l”.
Author(s)
Jerome Sueur <[email protected]>, Caroline Simonis and Thierry Aubin
References
Hopp, S. L., Owren, M. J. and Evans, C. S. (Eds) 1998. Animal acoustic communication. Springer,Berlin, Heidelberg.
See Also
zc, ifreq

214 zcr
Examples
data(pellucens)pellu1 <- cutw(pellucens,f=22050,from=0,to=1,plot=FALSE)# without interpolationzc(pellu1,f=22050,threshold=5,pch=20)# with interpolationzc(pellu1,f=22050,threshold=5,interpol=20,pch=20)# a way to plot with a line and to filter low frequenciespellu2 <- zc(pellu1,f=22050,threshold=5,interpol=20,plot=FALSE)pellu3 <- na.omit(pellu2[,2])pellu4 <- pellu3[pellu3>3]plot(x=seq(0,nrow(pellu1)/22050,length.out=length(pellu4)),
y=pellu4,type="l",xlab="Time(s)",ylab="Frequency(kHz)")
zcr Zero-crossing rate
Description
This functions computes the zero-crossing rate of a time function, i. e. the average number the signof a time wave changes.
Usage
zcr(wave, f, channel = 1, wl = 512, ovlp = 0, plot = TRUE, type = "o", xlab ="Time (s)", ylab = "Zero crossing rate", ...)
Arguments
wave an R object.
f sampling frequency of wave (in Hz). Does not need to be specified if embeddedin wave.
channel channel of the R object, by default left channel (1).
wl length of the window for the analysis (even number of points, by default = 512).If NULL the zero-crossing rate is computed of the complete signal.
ovlp overlap between two successive analysis windows (in %) if wl is not NULL.
plot a logical, if TRUE plots a the zero-crossing rate results along time.
type if plot is TRUE, type of plot that should be drawn. See plot for details (bydefault "l" for lines).
xlab if plot is TRUE, label of the x axis.
ylab if plot is TRUE, label of the y axis.
... other plot graphical parameters.

zcr 215
Details
The zero-crossing rate is computed according to:
zcr =1
2×N
N−1∑t=0
|sgn[x(t+ 1)]− sgn[x(t)]|
with:N the length of the signal xand where:
sgn[x(t)] = 1
ifx(t) ≥ 0
andsgn[x(t)] = −1
ifx(t) < 0
Value
The are two possibilities:
1. a numeric vector of length 1 if wl is NULL,
2. a numeric two-column matrix is returned with the first columnn being time (s) and the secondcolum being the zero-crossing rate (no scale) if wl is not NULL.
Note
The are two possibilities:
1. if wl is NULL then the zero-crossing rate is computed for the complete signal.
2. if wl is not NULL the the zero-crossing rate is computed for for a window sliding along the timewave.
The ZCR is supposed to help in detection of voiced/unvoiced sound sections.
Author(s)
Jerome Sueur
References
https://en.wikipedia.org/wiki/Zero-crossing_rate
See Also
zc

216 zcr
Examples
data(tico)## a single value for the complete signal, no plotzcr(tico, wl=NULL)## a series of values computed for a sliding window of 512 samples, plotzcr(tico)

Index
∗ IOexport, 73ftwindow, 87savewav, 153sox, 173wav2flac, 207
∗ datagendrawenv, 60echo, 70noisew, 123pulsew, 139setenv, 159synth, 191synth2, 194
∗ datasetsorni, 126peewit, 133pellucens, 134sheep, 163tico, 199
∗ dataattenuation, 16audiomoth, 17audiomoth.rename, 18read.audacity, 142songmeter, 167songmeterdiag, 169write.audacity, 210
∗ distributiondiffcumspec, 51itakura.dist, 100kl.dist, 101ks.dist, 102logspec.dist, 108
∗ dplotama, 13autoc, 19ccoh, 23ceps, 26
cepstro, 28coh, 30corenv, 34corspec, 36covspectro, 38cutw, 44dBscale, 45deletew, 48dfreq, 50diffenv, 53diffspec, 55dynoscillo, 64dynspec, 65dynspectro, 67env, 71fadew, 74fbands, 75fma, 83fpeaks, 85fund, 89ggspectro, 92ifreq, 96localpeaks, 107lts, 110meanspec, 114mutew, 121oscillo, 127oscilloST, 130pastew, 131phaseplot, 134phaseplot2, 136Q, 140repw, 143resamp, 144revw, 145rmoffset, 149seedata, 157seewave, 158simspec, 164
217

218 INDEX
soundscapespec, 172spec, 174specprop, 179spectro, 181spectro3D, 186wf, 208zc, 212
∗ filterafilter, 9bwfilter, 22combfilter, 31drawfilter, 61ffilter, 79fir, 82preemphasis, 138squarefilter, 188
∗ indexAR, 14M, 112
∗ inputaudiomoth, 17audiomoth.rename, 18read.audacity, 142songmeter, 167songmeterdiag, 169write.audacity, 210
∗ mathsnotefreq, 124octaves, 125
∗ mathconvSPL, 33dBweight, 47fdoppler, 77gammatone, 90meandB, 113mel, 116melfilterbank, 118micsens, 119moredB, 120sddB, 156wasp, 205
∗ tsACI, 5acoustat, 6afilter, 9akamatsu, 11ama, 13AR, 14
autoc, 19beep, 21bwfilter, 22ccoh, 23ceps, 26cepstro, 28coh, 30combfilter, 31corenv, 34corspec, 36covspectro, 38crest, 40csh, 41cutspec, 43cutw, 44dBscale, 45dBweight, 47deletew, 48dfreq, 50diffcumspec, 51diffenv, 53diffspec, 55diffwave, 57discrets, 59drawenv, 60drawfilter, 61duration, 63dynoscillo, 64dynspec, 65dynspectro, 67echo, 70env, 71fadew, 74fbands, 75ffilter, 79field, 80fir, 82fma, 83fpeaks, 85ftwindow, 87fund, 89gammatone, 90ggspectro, 92H, 94hilbert, 95ifreq, 96istft, 98itakura.dist, 100

INDEX 219
kl.dist, 101ks.dist, 102lfs, 104listen, 106localpeaks, 107logspec.dist, 108lts, 110M, 112meanspec, 114melfilterbank, 118mutew, 121NDSI, 122noisew, 123oscillo, 127oscilloST, 130pastew, 131phaseplot, 134phaseplot2, 136playlist, 137preemphasis, 138pulsew, 139Q, 140repw, 143resamp, 144revw, 145rmam, 146rmnoise, 148rmoffset, 149rms, 150roughness, 151rugo, 152SAX, 154seewave, 158setenv, 159sfm, 160sh, 161simspec, 164smoothw, 166soundscapespec, 172spec, 174specflux, 177specprop, 179spectro, 181spectro3D, 186squarefilter, 188symba, 189synth, 191synth2, 194
TFSD, 196th, 197timelapse, 200TKEO, 203wf, 208zapsilw, 211zc, 212zcr, 214
acf, 20ACI, 5, 178, 179, 197acoustat, 6addsilw, 8, 45, 49, 74, 122, 132, 144, 146afilter, 9, 23, 80, 83, 139, 148, 212akamatsu, 11ama, 13, 84approx, 213AR, 14, 113as.POSIXct, 18attenuation, 16, 33audiomoth, 17, 19, 111, 169audiomoth.rename, 18, 18autoc, 10, 19, 27, 30, 90axis, 46, 209
barplot, 76, 172beep, 21bwfilter, 22, 23, 32, 80, 83, 139, 189
ccoh, 23, 31ceps, 20, 26, 29, 30, 90cepstro, 27, 28, 90coh, 25, 30combfilter, 31, 32, 62, 80, 139, 189contour, 24, 25, 29, 184convolve, 70, 82convSPL, 17, 33, 48, 113, 120, 157cor, 34–37, 39, 40cor.test, 35, 37corenv, 34, 40, 54corspec, 35, 36, 37, 40, 56, 115, 141, 165, 176covspectro, 35, 37, 38, 88crest, 40csh, 10, 41, 95, 161, 163, 198cutspec, 43cutw, 9, 44, 49, 74, 122, 129, 132, 144, 202
dBscale, 45, 185dBweight, 33, 47, 113, 120, 157

220 INDEX
deletew, 9, 45, 48, 74, 122, 132, 144, 146dfreq, 10, 50, 88diffcumspec, 51, 56, 104diffenv, 53, 56, 58, 165diffspec, 53, 54, 55, 58, 101, 102, 104, 109,
115, 165diffwave, 54, 57dir, 14discrets, 59, 156, 190drawenv, 60, 62, 160drawfilter, 32, 61, 189duration, 63dynoscillo, 64, 129, 131dynspec, 64, 65, 69, 93, 115, 176, 185, 187,
209dynspectro, 67, 67
echo, 70, 193, 195env, 14, 15, 34, 35, 53, 54, 57, 61, 66–69, 71,
94, 112, 113, 159, 160, 194, 197,201, 202, 204
export, 73, 154
fadew, 9, 45, 49, 74, 122, 132, 144, 146fbands, 75fdoppler, 77ffilter, 23, 32, 62, 79, 83, 99, 105, 139, 188,
189fft, 27, 51, 67, 69, 82, 99, 115, 141, 176, 184,
185, 187field, 80filled.contour, 25, 46, 69, 184filter, 167fir, 32, 62, 80, 82, 139, 167, 188, 189fma, 14, 83fpeaks, 27, 85, 107, 108, 115, 176ftwindow, 5, 6, 38, 42, 50, 65, 68, 79, 82, 87,
98, 105, 110, 114, 172, 175, 178,182, 186, 196, 209
fund, 27, 30, 89
gammatone, 90, 119ggspectro, 92, 111, 185, 187
H, 94, 152, 153, 163, 198hilbert, 72, 84, 95, 97, 98, 147hist, 197
ifreq, 84, 96, 96, 194, 204, 213
image, 69, 110, 111IQR, 180istft, 79, 98, 105itakura.dist, 53, 56, 100, 104, 109, 165
kernel, 34, 54, 57, 66, 68, 72, 94, 159, 202kl.dist, 53, 56, 101, 101, 104, 109, 165ks.dist, 53, 56, 101, 102, 102, 109, 165ks.test, 103
lfs, 23, 80, 83, 99, 104, 139listen, 21, 106, 138localpeaks, 86, 107, 115, 176locator, 25, 61, 184log, 101logspec.dist, 53, 56, 101, 102, 104, 108, 165lts, 110, 185, 187
M, 15, 112mean, 150, 152, 180meandB, 113, 157meanspec, 8, 13, 14, 36, 37, 43, 51, 52, 55, 56,
75, 76, 79, 82, 85, 86, 88, 91, 100,101, 103, 107–109, 111, 114, 140,141, 160, 161, 164, 165, 173, 176,179
median, 180mel, 116, 119melfilterbank, 91, 117, 118micsens, 119Mod, 72moredB, 17, 33, 48, 113, 120, 157mutew, 9, 45, 49, 74, 121, 132, 144, 146
na.omit, 213NDSI, 122, 123, 173, 197noisew, 123, 140, 148, 193, 195normalize, 154notefreq, 124, 126
octaves, 125, 125OlsonNames, 18orni, 126oscillo, 9, 10, 24, 41, 44, 45, 49, 64, 67, 69,
70, 72, 74, 96, 121, 122, 127, 131,132, 143–147, 149, 159, 184, 185,212
oscilloST, 64, 129, 130
par, 128

INDEX 221
paste, 155pastew, 9, 45, 49, 74, 122, 129, 131, 144, 146,
201, 202peewit, 133pellucens, 134phaseplot, 134, 137phaseplot2, 135, 136play, 106, 137, 138playlist, 137plot, 7, 11, 13, 16, 20, 26, 30, 35, 36, 39, 42,
50, 52, 54–56, 64, 66, 75, 85, 89, 97,103, 107, 115, 135, 136, 139, 140,165, 170, 176, 178, 179, 189, 202,203, 209, 213, 214
polygon, 209preemphasis, 23, 80, 83, 138pulse, 124, 193, 195pulsew, 139
Q, 140quantile, 180
read.audacity, 142, 211repw, 132, 143resamp, 144revw, 9, 45, 49, 74, 122, 132, 144, 145rmam, 146rmnoise, 148rmoffset, 149rms, 40, 41, 150, 152, 153rnorm, 124roughness, 151, 153round, 85rugo, 152, 152runif, 124
savewav, 153, 208SAX, 123, 154, 173, 190sd, 180sddB, 113, 156seedata, 157seewave, 158seewave-package (seewave), 158setenv, 61, 159sfm, 43, 160, 163, 180sh, 42, 43, 94, 95, 152, 153, 161, 161, 180, 198sheep, 163simspec, 53, 56, 101, 102, 104, 109, 115, 164smooth.spline, 148
smoothw, 166songmeter, 18, 19, 111, 167, 171songmeterdiag, 169, 169soundscapespec, 122, 123, 156, 172sox, 173spec, 36, 37, 43, 51, 52, 55, 56, 67, 69, 75, 76,
79, 82, 84–86, 88, 91, 100, 101, 103,107–109, 115, 140, 141, 160, 161,164, 165, 173, 174, 179
spec.pgram, 25, 31specflux, 6, 177specprop, 8, 179spectro, 6, 25, 29, 31, 32, 40, 45, 46, 51, 67,
69, 79, 88, 92, 93, 99, 105, 111, 138,175, 179, 181, 187, 192, 194, 209
spectro3D, 67, 69, 88, 93, 111, 185, 186, 209squarefilter, 32, 62, 188strptime, 169symba, 60, 156, 189synth, 61, 71, 124, 140, 160, 191synth2, 193, 194, 195
TFSD, 196th, 15, 42, 94, 95, 152, 153, 163, 197tico, 199timelapse, 132, 200timer, 10, 129, 201TKEO, 203tkeo (TKEO), 203
wasp, 78, 205wav2flac, 207Wave, 59, 154wf, 67, 69, 185, 187, 208write.audacity, 143, 210write.table, 73writeWave, 153, 154
zapsilw, 9, 45, 49, 74, 122, 132, 144, 211zc, 10, 98, 212, 213, 215zcr, 214