SEER Cancer Statistics Review 1975-2006 Cancer Statistics Review 1975-2006 ... The APC is the Annual...
34
SEER Cancer Statistics Review 1975-2006 National Cancer Institute Joinpoint Regression Program Version 3.3.1, April 2008, National Cancer Institute. (http://srab.cancer.gov/joinpoint/). The APC is the Annual Percent Change based on rates age-adjusted to the 2000 US Std Population (19 age groups - Census P25-1130). a Trends are from the SEER 9 areas (San Francisco, Connecticut, Detroit, Hawaii, Iowa, New Mexico, Seattle, Utah, and Atlanta). b Trends are from the SEER 13 areas (SEER 9 Areas, Los Angeles, San Jose-Monterey, Rural Georgia, and the Alaska Native Registry). c Trends are from US Mortality Files, National Center for Health Statistics, Centers for Disease Control and Prevention. d The AAPC is the Average Annual Percent Change and is based on the APCs calculated by Joinpoint. e API - Asian/Pacific Islander, AI/AN - American Indian/Alaska Native, NH - Non-Hispanic f Hispanic and Non-Hispanic are not mutually exclusive from whites, blacks, Asian/Pacific Islanders, and American Indians/Alaska Natives. Incidence data for Hispanics and Non-Hispanics are based on NHIA and exclude cases from the Alaska Native Registry. The Hispanic and Non-Hispanic mortality trends exclude deaths from CT, DC, ME, MD, MN, NH, NY, ND, OK and VT. g Data for American Indian/Alaska Native are based on the CHSDA(Contract Health Service Delivery Area) counties. * The APC/AAPC is significantly different from zero (p<.05). - Joinpoint regression line analysis could not be performed on data series. Joinpoint Trend 1 Joinpoint Trend 2 Joinpoint Trend 3 Joinpoint Trend 4 Joinpoint Trend 5 AAPC d Years APC Years APC Years APC Years APC Years APC 1997-2006 2002-2006 SEER 9 Delay-Adjusted Incidence a , 1975-2006 All Races 1975-2006 -0.1 -0.1 -0.1 White 1975-2006 -0.1 -0.1 -0.1 Black 1975-2006 1.2* 1.2* 1.2* SEER 13 Delay-Adjusted Incidence b , 1992-2006 All Races 1992-2006 0.2 0.2 0.2 White 1992-2006 0.1 0.1 0.1 Black 1992-2006 1.1 1.1 1.1 SEER 9 Observed Incidence a , 1975-2006 All Races 1975-2006 -0.2 -0.2 -0.2 White 1975-2006 -0.2 -0.2 -0.2 Black 1975-2006 1.1* 1.1* 1.1* SEER 13 Observed Incidence b , 1992-2006 All Races 1992-2006 0.2 0.2 0.2 White 1992-2006 0.0 0.0 0.0 White NH ef 1992-2006 0.3* 0.3* 0.3* Black 1992-2006 0.9 0.9 0.9 Black NH ef 1992-2006 0.9 0.9 0.9 API e 1992-2006 3.3* 3.3* 3.3* AI/AN eg - - - - Hispanic f 1992-2006 0.2 0.2 0.2 U.S. Cancer Mortality c , 1975-2006 All Races 1975-1979 -6.4* 1979-1998 -3.5* 1998-2006 -2.0* -2.2* -2.0* White 1975-1979 -6.3* 1979-1998 -3.6* 1998-2006 -1.9* -2.1* -1.9* Black 1975-1978 -9.8* 1978-1997 -2.2* 1997-2000 -10.2 2000-2006 1.7 -2.4 1.7 U.S. Cancer Mortality c , 1992-2006 All Races 1992-1994 -7.9 1994-2006 -2.3* -2.3* -2.3* White 1992-1994 -8.3 1994-2006 -2.2* -2.2* -2.2* White NH ef 1992-2006 -2.3* -2.3* -2.3* Black 1992-2003 -4.2* 2003-2006 4.9 -1.3 2.5 Black NH ef 1992-2006 -2.5* -2.5* -2.5* API e 1992-2006 0.9 0.9 0.9 AI/AN eg 1992-2006 7.9 7.9 7.9 Hispanic f 1992-2006 -3.5* -3.5* -3.5* Table 9.1 Hodgkin Lymphoma Trends in SEER Incidence ab and U.S. Mortality c Using the Joinpoint Regression Program, 1975-2006 With up to Four Joinpoints, 1992-2006 With up to Two Joinpoints, Both Sexes by Race/Ethnicity
Transcript of SEER Cancer Statistics Review 1975-2006 Cancer Statistics Review 1975-2006 ... The APC is the Annual...

SEE
R C
ancer Statistics Review
1975-2006N
ational Cancer Institute
Joinpoint Regression Program Version 3.3.1, April 2008, National Cancer Institute. (http://srab.cancer.gov/joinpoint/).The APC is the Annual Percent Change based on rates age-adjusted to the 2000 US Std Population (19 age groups - Census P25-1130).
a Trends are from the SEER 9 areas (San Francisco, Connecticut, Detroit, Hawaii, Iowa, New Mexico, Seattle, Utah, and Atlanta).b Trends are from the SEER 13 areas (SEER 9 Areas, Los Angeles, San Jose-Monterey, Rural Georgia, and the Alaska Native Registry).c Trends are from US Mortality Files, National Center for Health Statistics, Centers for Disease Control and Prevention.d The AAPC is the Average Annual Percent Change and is based on the APCs calculated by Joinpoint.e API - Asian/Pacific Islander, AI/AN - American Indian/Alaska Native, NH - Non-Hispanicf Hispanic and Non-Hispanic are not mutually exclusive from whites, blacks, Asian/Pacific Islanders, and American Indians/Alaska
Natives. Incidence data for Hispanics and Non-Hispanics are based on NHIA and exclude cases from the Alaska Native Registry.The Hispanic and Non-Hispanic mortality trends exclude deaths from CT, DC, ME, MD, MN, NH, NY, ND, OK and VT.
g Data for American Indian/Alaska Native are based on the CHSDA(Contract Health Service Delivery Area) counties.* The APC/AAPC is significantly different from zero (p<.05).- Joinpoint regression line analysis could not be performed on data series.
Joinpoint Trend 1 Joinpoint Trend 2 Joinpoint Trend 3 Joinpoint Trend 4 Joinpoint Trend 5 AAPCd Years APC Years APC Years APC Years APC Years APC 1997-2006 2002-2006
SEER 9 Delay-Adjusted Incidencea, 1975-2006All Races 1975-2006 -0.1 -0.1 -0.1White 1975-2006 -0.1 -0.1 -0.1Black 1975-2006 1.2* 1.2* 1.2*
SEER 13 Delay-Adjusted Incidenceb, 1992-2006All Races 1992-2006 0.2 0.2 0.2White 1992-2006 0.1 0.1 0.1Black 1992-2006 1.1 1.1 1.1
SEER 9 Observed Incidencea, 1975-2006All Races 1975-2006 -0.2 -0.2 -0.2White 1975-2006 -0.2 -0.2 -0.2Black 1975-2006 1.1* 1.1* 1.1*
SEER 13 Observed Incidenceb, 1992-2006All Races 1992-2006 0.2 0.2 0.2White 1992-2006 0.0 0.0 0.0
White NHef 1992-2006 0.3* 0.3* 0.3*Black 1992-2006 0.9 0.9 0.9
Black NHef 1992-2006 0.9 0.9 0.9APIe 1992-2006 3.3* 3.3* 3.3*AI/ANeg - - - -Hispanicf 1992-2006 0.2 0.2 0.2
U.S. Cancer Mortalityc, 1975-2006All Races 1975-1979 -6.4* 1979-1998 -3.5* 1998-2006 -2.0* -2.2* -2.0*White 1975-1979 -6.3* 1979-1998 -3.6* 1998-2006 -1.9* -2.1* -1.9*Black 1975-1978 -9.8* 1978-1997 -2.2* 1997-2000 -10.2 2000-2006 1.7 -2.4 1.7
U.S. Cancer Mortalityc, 1992-2006All Races 1992-1994 -7.9 1994-2006 -2.3* -2.3* -2.3*White 1992-1994 -8.3 1994-2006 -2.2* -2.2* -2.2*
White NHef 1992-2006 -2.3* -2.3* -2.3*Black 1992-2003 -4.2* 2003-2006 4.9 -1.3 2.5
Black NHef 1992-2006 -2.5* -2.5* -2.5*APIe 1992-2006 0.9 0.9 0.9AI/ANeg 1992-2006 7.9 7.9 7.9Hispanicf 1992-2006 -3.5* -3.5* -3.5*
Table 9.1Hodgkin Lymphoma
Trends in SEER Incidenceab and U.S. Mortalityc Using the Joinpoint Regression Program,1975-2006 With up to Four Joinpoints, 1992-2006 With up to Two Joinpoints,
Both Sexes by Race/Ethnicity

SEE
R C
ancer Statistics Review
1975-2006N
ational Cancer Institute
Joinpoint Regression Program Version 3.3.1, April 2008, National Cancer Institute. (http://srab.cancer.gov/joinpoint/).The APC is the Annual Percent Change based on rates age-adjusted to the 2000 US Std Population (19 age groups - Census P25-1130).
a Trends are from the SEER 9 areas (San Francisco, Connecticut, Detroit, Hawaii, Iowa, New Mexico, Seattle, Utah, and Atlanta).b Trends are from the SEER 13 areas (SEER 9 Areas, Los Angeles, San Jose-Monterey, Rural Georgia, and the Alaska Native Registry).c Trends are from US Mortality Files, National Center for Health Statistics, Centers for Disease Control and Prevention.d The AAPC is the Average Annual Percent Change and is based on the APCs calculated by Joinpoint.e API - Asian/Pacific Islander, AI/AN - American Indian/Alaska Native, NH - Non-Hispanicf Hispanic and Non-Hispanic are not mutually exclusive from whites, blacks, Asian/Pacific Islanders, and American Indians/Alaska
Natives. Incidence data for Hispanics and Non-Hispanics are based on NHIA and exclude cases from the Alaska Native Registry.The Hispanic and Non-Hispanic mortality trends exclude deaths from CT, DC, ME, MD, MN, NH, NY, ND, OK and VT.
g Data for American Indian/Alaska Native are based on the CHSDA(Contract Health Service Delivery Area) counties.* The APC/AAPC is significantly different from zero (p<.05).- Joinpoint regression line analysis could not be performed on data series.
Joinpoint Trend 1 Joinpoint Trend 2 Joinpoint Trend 3 Joinpoint Trend 4 Joinpoint Trend 5 AAPCd Years APC Years APC Years APC Years APC Years APC 1997-2006 2002-2006
SEER 9 Delay-Adjusted Incidencea, 1975-2006All Races 1975-2006 -0.6* -0.6* -0.6*White 1975-2006 -0.5* -0.5* -0.5*Black 1975-2006 0.3 0.3 0.3
SEER 13 Delay-Adjusted Incidenceb, 1992-2006All Races 1992-2006 0.1 0.1 0.1White 1992-2006 0.0 0.0 0.0Black 1992-2006 1.3 1.3 1.3
SEER 9 Observed Incidencea, 1975-2006All Races 1975-2006 -0.6* -0.6* -0.6*White 1975-2006 -0.6* -0.6* -0.6*Black 1975-2006 0.2 0.2 0.2
SEER 13 Observed Incidenceb, 1992-2006All Races 1992-2006 0.1 0.1 0.1White 1992-2006 -0.1 -0.1 -0.1
White NHef 1992-2006 0.2 0.2 0.2Black 1992-2006 1.2 1.2 1.2
Black NHef 1992-2006 1.0 1.0 1.0APIe 1992-2006 2.0 2.0 2.0AI/ANeg - - - -Hispanicf 1992-2006 0.2 0.2 0.2
U.S. Cancer Mortalityc, 1975-2006All Races 1975-2000 -4.0* 2000-2006 -0.9 -1.9* -0.9White 1975-1997 -4.1* 1997-2006 -2.0* -2.0* -2.0*Black 1975-2006 -3.2* -3.2* -3.2*
U.S. Cancer Mortalityc, 1992-2006All Races 1992-1994 -11.3* 1994-2006 -2.1* -2.1* -2.1*White 1992-1994 -11.6 1994-2006 -2.0* -2.0* -2.0*
White NHef 1992-1994 -11.5 1994-2006 -1.6* -1.6* -1.6*Black 1992-2006 -3.4* -3.4* -3.4*
Black NHef 1992-2006 -2.9* -2.9* -2.9*APIe 1992-1997 -22.2* 1997-2006 6.9 6.9 6.9AI/ANeg - - - -Hispanicf 1992-2006 -3.8* -3.8* -3.8*
Table 9.2Hodgkin Lymphoma
Trends in SEER Incidenceab and U.S. Mortalityc Using the Joinpoint Regression Program,1975-2006 With up to Four Joinpoints, 1992-2006 With up to Two Joinpoints,
Males by Race/Ethnicity

SEE
R C
ancer Statistics Review
1975-2006N
ational Cancer Institute
Joinpoint Regression Program Version 3.3.1, April 2008, National Cancer Institute. (http://srab.cancer.gov/joinpoint/).The APC is the Annual Percent Change based on rates age-adjusted to the 2000 US Std Population (19 age groups - Census P25-1130).
a Trends are from the SEER 9 areas (San Francisco, Connecticut, Detroit, Hawaii, Iowa, New Mexico, Seattle, Utah, and Atlanta).b Trends are from the SEER 13 areas (SEER 9 Areas, Los Angeles, San Jose-Monterey, Rural Georgia, and the Alaska Native Registry).c Trends are from US Mortality Files, National Center for Health Statistics, Centers for Disease Control and Prevention.d The AAPC is the Average Annual Percent Change and is based on the APCs calculated by Joinpoint.e API - Asian/Pacific Islander, AI/AN - American Indian/Alaska Native, NH - Non-Hispanicf Hispanic and Non-Hispanic are not mutually exclusive from whites, blacks, Asian/Pacific Islanders, and American Indians/Alaska
Natives. Incidence data for Hispanics and Non-Hispanics are based on NHIA and exclude cases from the Alaska Native Registry.The Hispanic and Non-Hispanic mortality trends exclude deaths from CT, DC, ME, MD, MN, NH, NY, ND, OK and VT.
g Data for American Indian/Alaska Native are based on the CHSDA(Contract Health Service Delivery Area) counties.* The APC/AAPC is significantly different from zero (p<.05).- Joinpoint regression line analysis could not be performed on data series.
Joinpoint Trend 1 Joinpoint Trend 2 Joinpoint Trend 3 Joinpoint Trend 4 Joinpoint Trend 5 AAPCd Years APC Years APC Years APC Years APC Years APC 1997-2006 2002-2006
SEER 9 Delay-Adjusted Incidencea, 1975-2006All Races 1975-2006 0.4* 0.4* 0.4*White 1975-2006 0.4* 0.4* 0.4*Black 1975-2006 2.5* 2.5* 2.5*
SEER 13 Delay-Adjusted Incidenceb, 1992-2006All Races 1992-2006 0.3 0.3 0.3White 1992-2006 0.3 0.3 0.3Black 1992-2006 0.8 0.8 0.8
SEER 9 Observed Incidencea, 1975-2006All Races 1975-2006 0.4* 0.4* 0.4*White 1975-2006 0.3* 0.3* 0.3*Black 1975-2006 2.4* 2.4* 2.4*
SEER 13 Observed Incidenceb, 1992-2006All Races 1992-2006 0.2 0.2 0.2White 1992-2006 0.2 0.2 0.2
White NHef 1992-2006 0.4 0.4 0.4Black 1992-2006 0.6 0.6 0.6
Black NHef 1992-2006 0.7 0.7 0.7APIe 1992-2006 4.8* 4.8* 4.8*AI/ANeg - - - -Hispanicf 1992-2006 0.3 0.3 0.3
U.S. Cancer Mortalityc, 1975-2006All Races 1975-1985 -4.9* 1985-2006 -2.6* -2.6* -2.6*White 1975-1985 -5.0* 1985-2006 -2.5* -2.5* -2.5*Black 1975-2006 -2.5* -2.5* -2.5*
U.S. Cancer Mortalityc, 1992-2006All Races 1992-2006 -2.6* -2.6* -2.6*White 1992-2006 -2.6* -2.6* -2.6*
White NHef 1992-2006 -2.2* -2.2* -2.2*Black 1992-2006 -2.6* -2.6* -2.6*
Black NHef 1992-2006 -2.0* -2.0* -2.0*APIe - - - -AI/ANeg - - - -Hispanicf 1992-2006 -3.3* -3.3* -3.3*
Table 9.3Hodgkin Lymphoma
Trends in SEER Incidenceab and U.S. Mortalityc Using the Joinpoint Regression Program,1975-2006 With up to Four Joinpoints, 1992-2006 With up to Two Joinpoints,
Females by Race/Ethnicity

SEE
R C
ancer Statistics Review
1975-2006N
ational Cancer Institute
a SEER 9 areas (San Francisco, Connecticut, Detroit, Hawaii, Iowa, New Mexico, Seattle, Utah, and Atlanta).Rates are per 100,000 and are age-adjusted to the 2000 US Std Population (19 age groups - Census P25-1130).
- Statistic not shown. Rate based on less than 16 cases for the time interval.
All Races Whites Blacks Total Males Females Total Males Females Total Males Females
Year of Diagnosis:1975 3.08 3.86 2.39 3.23 3.91 2.63 2.58 4.41 -1976 2.76 3.37 2.24 2.87 3.43 2.41 2.57 3.91 -1977 2.98 3.60 2.46 3.26 3.92 2.71 1.68 1.91 -1978 2.79 3.40 2.32 3.06 3.69 2.58 1.47 2.01 -1979 2.93 3.91 2.08 3.08 4.05 2.26 2.86 4.68 -1980 2.77 3.31 2.27 2.99 3.54 2.49 1.79 2.01 1.541981 2.91 3.58 2.33 3.22 3.91 2.61 1.39 1.86 -1982 2.93 3.50 2.46 3.13 3.68 2.70 2.58 3.15 2.041983 3.02 3.72 2.39 3.33 3.99 2.70 2.11 3.85 -1984 3.06 3.71 2.47 3.38 4.01 2.79 2.07 3.31 -1985 2.97 3.49 2.51 3.31 3.83 2.83 1.74 2.26 -1986 2.73 3.34 2.22 2.92 3.51 2.41 2.27 2.80 1.901987 3.05 3.72 2.50 3.35 4.00 2.80 2.05 2.78 1.411988 3.09 3.59 2.66 3.43 4.00 2.94 1.90 1.93 1.861989 3.05 3.67 2.54 3.35 3.97 2.84 2.16 3.15 1.371990 3.07 3.50 2.64 3.31 3.81 2.82 2.99 3.23 2.751991 3.01 3.48 2.59 3.34 3.83 2.90 2.38 2.65 2.081992 2.86 3.10 2.68 3.04 3.22 2.91 2.64 2.66 2.611993 2.85 3.26 2.49 3.08 3.48 2.74 2.92 3.70 2.351994 2.84 3.14 2.58 3.14 3.49 2.81 2.06 2.30 1.911995 2.76 3.22 2.35 3.05 3.52 2.64 2.29 2.84 1.781996 2.85 3.31 2.42 3.13 3.61 2.68 2.46 3.11 1.901997 2.81 2.94 2.69 3.07 3.23 2.91 2.54 2.38 2.671998 2.79 3.10 2.54 3.13 3.46 2.86 2.11 2.27 1.981999 2.83 3.06 2.66 3.08 3.22 2.99 2.46 3.01 2.012000 2.79 3.28 2.34 3.04 3.51 2.61 2.42 3.03 1.872001 2.55 2.90 2.22 2.71 3.08 2.35 2.41 3.11 1.922002 2.93 3.23 2.68 3.11 3.38 2.89 2.85 3.20 2.622003 2.69 3.08 2.37 2.97 3.37 2.60 2.37 2.72 2.222004 2.90 2.98 2.86 3.07 3.12 3.07 2.93 3.12 2.802005 2.98 3.42 2.61 3.19 3.64 2.82 3.06 3.29 2.862006 2.93 3.22 2.64 3.12 3.38 2.84 2.92 3.61 2.331975-2006 2.89 3.35 2.49 3.14 3.60 2.74 2.39 2.95 1.94
Table 9.4Hodgkin Lymphoma
Age-adjusted SEER Incidencea Rates by Year, Race and Sex

SEE
R C
ancer Statistics Review
1975-2006N
ational Cancer Institute
a US Mortality Files, National Center for Health Statistics, Centers for Disease Control and Prevention.Rates are per 100,000 and are age-adjusted to the 2000 US Std Population (19 age groups - Census P25-1130).
- Statistic not shown. Rate based on less than 16 cases for the time interval.
All Races Whites Blacks Total Males Females Total Males Females Total Males Females
Year of Death:1975 1.31 1.69 1.00 1.35 1.73 1.04 1.07 1.50 0.721976 1.17 1.50 0.90 1.20 1.52 0.94 0.97 1.44 0.601977 1.14 1.45 0.87 1.18 1.49 0.90 0.92 1.20 0.691978 1.06 1.35 0.82 1.10 1.38 0.87 0.76 1.17 0.441979 0.97 1.27 0.71 1.00 1.31 0.74 0.76 1.06 0.511980 0.98 1.23 0.76 1.01 1.27 0.80 0.75 1.09 0.481981 0.93 1.15 0.74 0.96 1.19 0.76 0.74 0.88 0.621982 0.88 1.09 0.70 0.92 1.15 0.72 0.70 0.78 0.621983 0.85 1.09 0.65 0.88 1.13 0.68 0.64 0.90 0.451984 0.86 1.18 0.60 0.88 1.19 0.63 0.79 1.18 0.471985 0.77 0.98 0.58 0.78 1.00 0.60 0.71 0.96 0.511986 0.78 1.00 0.58 0.80 1.04 0.60 0.65 0.85 0.491987 0.74 0.96 0.56 0.77 0.98 0.58 0.67 0.94 0.461988 0.67 0.88 0.50 0.69 0.91 0.51 0.59 0.75 0.481989 0.71 0.92 0.54 0.73 0.94 0.56 0.66 0.92 0.471990 0.66 0.85 0.50 0.69 0.88 0.52 0.56 0.81 0.361991 0.65 0.83 0.51 0.66 0.83 0.51 0.67 0.89 0.491992 0.65 0.83 0.50 0.67 0.86 0.52 0.58 0.77 0.451993 0.61 0.79 0.47 0.63 0.80 0.50 0.57 0.83 0.391994 0.56 0.66 0.47 0.56 0.66 0.48 0.55 0.73 0.411995 0.55 0.67 0.44 0.56 0.68 0.46 0.53 0.73 0.361996 0.53 0.64 0.44 0.55 0.65 0.46 0.47 0.63 0.361997 0.53 0.62 0.46 0.54 0.63 0.47 0.54 0.67 0.431998 0.48 0.61 0.36 0.49 0.62 0.37 0.48 0.66 0.331999 0.51 0.63 0.41 0.53 0.66 0.43 0.41 0.55 0.302000 0.46 0.55 0.39 0.48 0.57 0.41 0.35 0.43 0.302001 0.46 0.56 0.38 0.48 0.59 0.39 0.42 0.52 0.352002 0.47 0.58 0.38 0.49 0.59 0.40 0.40 0.57 0.272003 0.46 0.55 0.39 0.48 0.57 0.41 0.36 0.48 0.282004 0.43 0.54 0.34 0.44 0.56 0.35 0.40 0.47 0.342005 0.42 0.50 0.36 0.43 0.50 0.37 0.42 0.56 0.322006 0.44 0.56 0.33 0.45 0.57 0.35 0.41 0.56 0.301975-2006 0.68 0.85 0.53 0.71 0.88 0.56 0.58 0.78 0.42
Table 9.5Hodgkin Lymphoma
Age-adjusted U.S. Deatha Rates by Year, Race and Sex
SEE
R C
ancer Statistics Review
1975-2006N
ational Cancer Institute
a SEER 17 areas. Rates are per 100,000 and are age-adjusted to the 2000 US Std Population (19 age groups - Census P25-1130),unless noted.
b US Mortality Files, National Center for Health Statistics, Centers for Disease Control and Prevention.Rates are per 100,000 and are age-adjusted to the 2000 US Std Population (19 age groups - Census P25-1130), unless noted.
c Rates are per 100,000 and are age-adjusted to the IARC world standard population.- Statistic not shown. Rate based on less than 16 cases for the time interval.
All Races Whites Blacks Total Males Females Total Males Females Total Males Females
SEER IncidenceAge at DiagnosisAge-Adjusted Rates, 2002-2006All ages 2.8 3.1 2.5 3.0 3.3 2.7 2.6 2.9 2.3Under 65 2.6 2.8 2.3 2.7 2.9 2.5 2.6 2.8 2.365 and over 4.3 5.4 3.5 4.6 5.8 3.8 3.0 3.7 2.5
All ages (IARC world std)c 2.5 2.7 2.3 2.7 2.9 2.5 2.4 2.6 2.2
Age-Specific Rates, 2002-2006<1 - - - - - - - - -1-4 - - - - - - - - -5-9 0.5 0.6 0.3 0.5 0.6 0.3 0.6 1.0 -10-14 1.2 1.3 1.0 1.2 1.3 1.1 1.1 1.0 1.215-19 2.9 2.9 3.0 3.2 3.1 3.2 2.3 2.1 2.520-24 4.4 4.2 4.6 4.8 4.6 5.0 2.9 2.6 3.125-29 4.3 4.1 4.6 4.7 4.5 4.9 4.2 3.9 4.530-34 3.8 3.8 3.8 4.2 4.2 4.3 3.8 3.8 3.735-39 3.1 3.4 2.8 3.3 3.6 3.0 3.3 3.8 2.940-44 3.0 3.4 2.5 3.2 3.7 2.6 3.4 3.5 3.245-49 2.5 3.0 2.0 2.6 3.0 2.1 3.2 4.6 2.150-54 2.4 3.0 1.8 2.4 3.0 1.8 3.1 4.0 2.255-59 2.4 3.1 1.8 2.6 3.2 2.0 2.4 2.6 2.360-64 3.0 3.9 2.3 3.2 4.0 2.4 3.2 4.4 2.365-69 4.0 5.1 3.1 4.3 5.4 3.4 3.6 4.6 2.870-74 4.1 5.0 3.4 4.5 5.5 3.7 3.0 - -75-79 4.7 5.7 4.1 5.1 6.1 4.4 3.2 - -80-84 4.7 5.9 4.0 5.1 6.3 4.3 - - -85+ 3.8 5.3 3.1 4.1 5.8 3.3 - - -
U.S. MortalityAge at DeathAge-Adjusted Rates, 2002-2006All ages 0.4 0.5 0.4 0.5 0.6 0.4 0.4 0.5 0.3Under 65 0.3 0.3 0.2 0.3 0.3 0.2 0.3 0.4 0.265 and over 1.7 2.1 1.3 1.7 2.2 1.4 1.0 1.4 0.8
All ages (IARC world std)c 0.3 0.4 0.3 0.3 0.4 0.3 0.3 0.4 0.2
Age-Specific Rates, 2002-2006<1 - - - - - - - - -1-4 - - - - - - - - -5-9 - - - - - - - - -10-14 0.0 0.0 - 0.0 0.0 - - - -15-19 0.1 0.1 0.1 0.1 0.1 0.1 - - -20-24 0.2 0.2 0.2 0.2 0.2 0.2 0.3 0.3 0.325-29 0.3 0.4 0.3 0.3 0.3 0.3 0.5 0.6 0.430-34 0.4 0.4 0.3 0.4 0.4 0.3 0.6 0.6 0.535-39 0.3 0.4 0.3 0.3 0.4 0.3 0.4 0.4 0.340-44 0.3 0.4 0.2 0.3 0.4 0.2 0.4 0.5 0.345-49 0.4 0.4 0.3 0.4 0.4 0.3 0.4 0.6 0.350-54 0.4 0.5 0.3 0.4 0.5 0.4 0.4 0.6 0.355-59 0.6 0.8 0.4 0.6 0.7 0.4 0.7 1.2 -60-64 0.8 1.0 0.6 0.8 1.0 0.6 0.6 0.9 -65-69 1.0 1.3 0.7 1.0 1.3 0.7 0.8 1.4 -70-74 1.4 1.8 1.1 1.5 1.9 1.1 1.0 1.5 0.775-79 2.0 2.2 1.8 2.1 2.3 1.9 1.1 1.5 -80-84 2.3 3.0 1.9 2.4 3.2 2.0 1.1 - -85+ 2.4 3.3 2.0 2.5 3.5 2.1 1.1 - -
Table 9.6Hodgkin Lymphoma
SEER Incidencea and U.S. Deathb Rates, Age-Adjusted and Age-Specific Rates, by Race and Sex
SEE
R C
ancer Statistics Review
1975-2006N
ational Cancer Institute
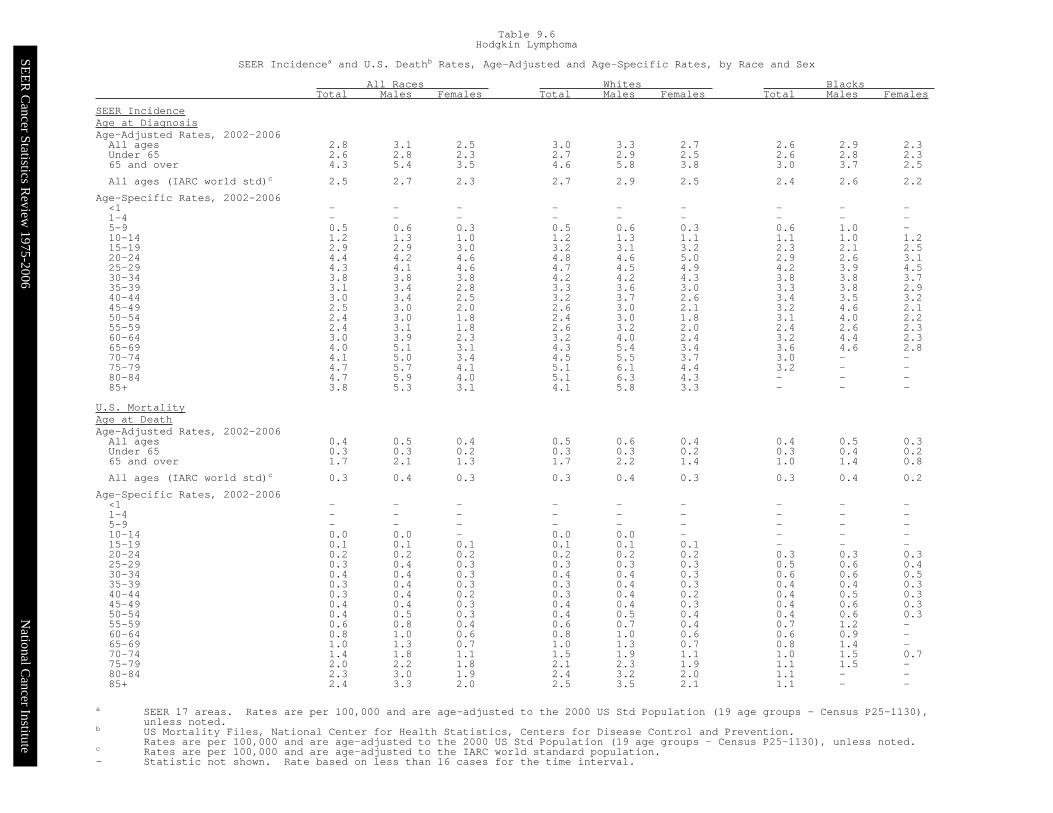
a Rates are based on End Results data from a series of hospital registries and one population-based registry.b Rates are from the SEER 9 areas (San Francisco, Connecticut, Detroit, Hawaii, Iowa, New Mexico, Seattle, Utah, Atlanta).
Rates are based on follow-up of patients into 2006.c Rates are from the SEER 17 areas (San Francisco, Connecticut, Detroit, Hawaii, Iowa, New Mexico, Seattle, Utah, Atlanta,
San Jose-Monterey, Los Angeles, Alaska Native Registry, Rural Georgia, California excluding SF/SJM/LA, Kentucky, Louisiana andNew Jersey). California excluding SF/SJM/LA, Kentucky, Louisiana, and New Jersey contribute cases for diagnosis years 2000-2005.The remaining 13 SEER Areas contribute cases for the entire period 1999-2005. Rates are based on follow-up of patients into 2006.
d Period survival provides a more up-to-date estimate of survival by piecing together the most recent conditional survival estimatesfrom several cohorts. It is computed here using three year calendar blocks (2003-2005: 0-1 year survival),(2002-2004: 1-2 year survival), (2001-2003: 2-3 year survival), (2000-2002: 3-4 year survival), (1999-2001: 4-5 years survival).
e The difference in rates between 1975-1977 and 1999-2005 is statistically significant (p<.05).f The standard error of the survival rate is between 5 and 10 percentage points.g The standard error of the survival rate is greater than 10 percentage points.- Statistic could not be calculated due to fewer than 25 cases during the time period.
All Races Whites Blacks Total Males Females Total Males Females Total Males Females
5-Year Relative Survival RatesYear of Diagnosis:1960-1963a - - - 40 34 48 - - -1970-1973a - - - 67 66 69 - - -1975-1977b 73.5 71.8 75.7 73.9 72.1 76.0 71.3 69.3f 75.3f
1978-1980b 73.4 72.2 75.1 73.6 71.8 75.9 71.7 75.8f 64.0f
1981-1983b 75.7 74.4 77.3 76.0 75.2 77.1 73.4 71.1f 77.5f
1984-1986b 79.4 77.5 81.7 79.9 78.0 82.3 74.8 75.5f 72.3f
1987-1989b 80.4 77.8 83.6 81.0 78.1 84.5 72.8 72.2f 73.5f
1990-1992b 82.9 80.5 85.7 84.0 82.4 86.0 74.2 64.6 84.51993-1995b 82.8 80.1 86.0 83.4 81.0 86.2 78.5 74.2 82.91996-1998b 85.9 85.1 86.8 86.7 85.2 88.3 81.2 83.7 78.51999-2005b 86.4e 85.0e 88.2e 87.4e 86.2e 88.7e 81.4e 77.4 85.4
5-Year Period Survival Ratescd
Year of Diagnosis:1999-2005 84.6 83.2 86.2 85.1 83.9 86.5 81.3 78.8 83.6
Stage Distribution (%) 1999-2005c
All StagesNumber of cases 12,374 6,697 5,677 10,425 5,628 4,797 1,271 672 599Percent 100% 100% 100% 100% 100% 100% 100% 100% 100%Localized 19 20 19 19 20 19 22 22 22Regional 40 35 46 41 36 46 33 28 37Distant 35 39 30 34 38 30 41 45 37Unstaged 5 5 5 5 5 5 5 5 4
5-Year Relative Survival Rates, 1999-2005c
Age at Diagnosis:Ages <45 91.8 90.5 93.2 92.6 91.7 93.7 85.0 80.5 89.7Ages 45-54 82.9 80.0 87.3 83.0 80.1 87.4 80.4 76.0 84.6f
Ages 55-64 73.6 69.2 80.1 72.8 69.4 78.1 77.8f 65.5f 87.1f
Ages 65-74 56.7 53.8 60.3 56.7 54.1 60.1 62.1g 55.2g 61.2g
Ages 75+ 39.3 35.7 41.2 41.6 38.5 43.1 28.3g - -Ages <65 89.0 86.9 91.5 89.6 87.7 91.8 83.8 78.8 89.4Ages 65+ 49.8 48.0 51.5 50.8 49.2 52.2 50.8f 46.7g 52.7g
Stage:All Stages 84.7 83.0 86.7 85.1 83.6 86.7 82.1 77.3 87.4Localized 89.9 90.1 89.7 89.7 90.2 88.8 92.6 89.0 95.5Regional 91.1 89.9 92.1 91.6 90.4 92.6 84.3 80.0 87.7Distant 74.5 72.6 77.3 74.6 73.5 76.1 74.7 68.0 83.4Unstaged 81.7 82.3 80.6 82.1 81.3 82.0 80.2f 82.5f 74.9g
Table 9.7Hodgkin Lymphoma
Survival Rates, by Race, Sex, Diagnosis Year and Age

SEE
R C
ancer Statistics Review
1975-2006N
ational Cancer Institute
a Survival rates are relative rates expressed as percents.b Rates are from the SEER 9 areas (San Francisco, Connecticut, Detroit, Hawaii, Iowa, New Mexico, Seattle, Utah, and Atlanta).
1975- 1980- 1985-1979 1984 1989 1990 1991 1992 1993 1994 1995 1996 1997 1998 1999 2000 2001 2002 2003 2004 2005
Relative Survival Rates (SEERb)
1-year 87.4 89.9 91.2 90.9 93.1 92.6 91.8 93.4 93.0 91.8 93.6 94.6 91.2 92.7 94.0 93.5 93.7 92.0 93.52-year 81.4 84.2 86.6 86.9 87.3 89.2 86.9 90.1 89.4 88.7 91.3 90.6 88.3 90.8 91.1 90.4 92.7 90.23-year 77.5 80.9 83.7 85.0 85.1 87.9 84.2 86.8 87.2 87.3 89.8 88.6 86.5 89.1 88.9 89.1 91.04-year 75.0 78.6 81.4 83.0 83.1 86.2 82.6 85.1 84.4 85.3 89.0 87.0 85.2 88.4 87.2 87.05-year 73.2 76.1 80.2 82.3 81.2 85.1 80.8 84.1 83.3 84.2 88.0 85.4 84.6 87.2 86.06-year 71.1 74.0 78.9 80.9 80.3 83.6 79.4 83.5 81.4 82.9 86.7 84.4 83.7 86.67-year 69.6 72.7 76.7 78.9 79.2 82.9 77.8 83.1 80.5 81.6 86.2 83.8 82.88-year 67.8 71.6 75.9 77.9 78.2 82.8 77.0 83.0 80.5 81.2 85.9 83.59-year 66.1 70.5 75.3 77.0 77.9 82.1 76.5 81.9 79.6 80.4 85.810-year 65.2 69.8 75.0 76.5 77.6 81.4 76.5 81.9 79.4 79.311-year 64.3 69.2 74.3 76.3 76.7 80.7 76.5 81.9 78.912-year 63.6 68.5 73.8 75.5 76.7 80.2 76.0 81.613-year 63.2 67.9 72.8 75.5 76.3 79.9 75.114-year 62.3 67.1 72.2 75.5 75.9 79.515-year 61.6 66.6 71.3 75.5 75.216-year 61.2 65.9 70.8 75.517-year 60.6 64.8 70.518-year 60.0 64.219-year 59.7 63.920-year 58.9 63.3
Table 9.8Hodgkin Lymphoma
Survival Ratesa
By Year of Diagnosis
All Races, Males and Females
Year of Diagnosis

SEE
R C
ancer Statistics Review
1975-2006N
ational Cancer Institute
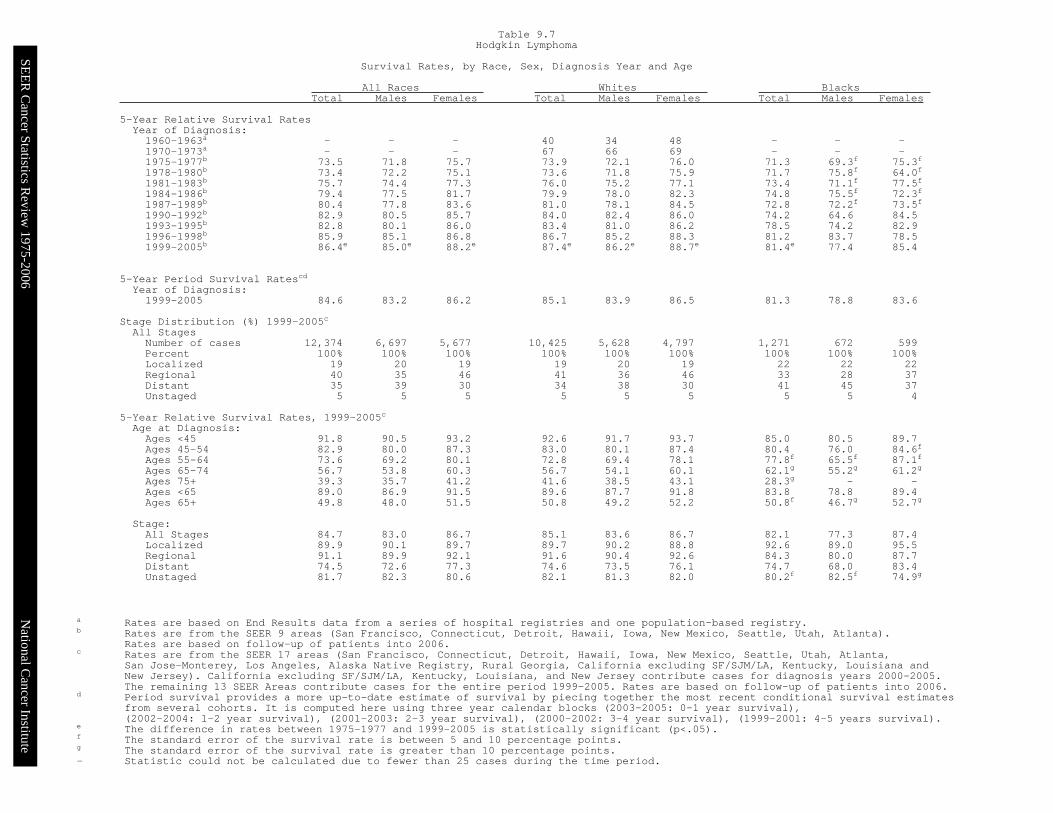
a Survival rates are relative rates expressed as percents.b Rates are from the SEER 9 areas (San Francisco, Connecticut, Detroit, Hawaii, Iowa, New Mexico, Seattle, Utah, and Atlanta).
1975- 1980- 1985-1979 1984 1989 1990 1991 1992 1993 1994 1995 1996 1997 1998 1999 2000 2001 2002 2003 2004 2005
Relative Survival Rates (SEERb)
1-year 86.3 89.8 90.1 90.8 93.0 91.1 89.5 93.8 92.3 93.0 92.1 94.3 89.4 90.9 93.0 91.1 93.4 89.9 93.62-year 80.9 84.3 85.1 85.0 86.7 86.9 84.0 89.1 88.8 89.3 89.8 91.0 86.9 88.6 89.5 88.9 92.6 88.93-year 76.4 81.2 82.0 83.1 83.4 85.4 80.9 86.0 85.8 87.5 87.9 89.0 84.5 85.7 86.9 87.6 90.74-year 73.2 78.5 79.3 81.5 80.6 83.6 78.9 83.7 81.7 85.6 87.5 86.8 83.7 84.2 85.7 85.75-year 71.2 75.4 77.7 81.3 78.0 82.3 76.5 82.6 81.0 83.6 86.6 85.0 83.6 82.6 84.46-year 68.8 73.1 76.1 80.0 77.1 80.5 74.4 81.8 79.7 82.6 84.1 84.2 82.1 81.97-year 67.0 71.8 73.4 77.5 75.1 80.5 73.4 81.6 78.7 80.7 83.7 83.1 80.58-year 65.3 70.5 72.2 76.8 73.3 79.9 72.2 81.6 78.1 79.8 83.2 82.89-year 63.2 69.7 71.2 76.0 73.2 79.7 71.5 80.2 77.2 79.0 83.210-year 62.5 68.6 70.8 75.2 72.8 78.9 71.5 80.2 77.2 77.211-year 61.4 68.2 69.6 75.1 72.5 78.1 71.5 80.2 77.012-year 60.7 67.2 68.8 74.1 72.2 77.4 71.1 80.213-year 60.4 66.8 67.3 74.0 70.9 77.1 69.614-year 59.3 65.7 66.6 74.0 70.9 77.115-year 58.5 65.3 65.7 74.0 70.416-year 58.1 64.6 65.0 74.017-year 57.1 63.5 64.818-year 56.5 62.619-year 56.1 62.520-year 55.3 61.5
Table 9.9Hodgkin Lymphoma
Survival Ratesa
By Year of Diagnosis
All Races, Males
Year of Diagnosis
SEE
R C
ancer Statistics Review
1975-2006N
ational Cancer Institute
a Survival rates are relative rates expressed as percents.b Rates are from the SEER 9 areas (San Francisco, Connecticut, Detroit, Hawaii, Iowa, New Mexico, Seattle, Utah, and Atlanta).
1975- 1980- 1985-1979 1984 1989 1990 1991 1992 1993 1994 1995 1996 1997 1998 1999 2000 2001 2002 2003 2004 2005
Relative Survival Rates (SEERb)
1-year 88.8 90.0 92.6 91.0 93.2 94.3 94.5 93.0 93.8 90.1 95.2 95.0 93.2 95.2 95.4 96.0 94.0 94.0 93.52-year 82.0 84.2 88.6 89.3 88.1 91.7 90.2 91.1 90.0 87.8 92.8 90.1 89.7 93.8 93.0 92.1 92.8 91.43-year 79.1 80.5 85.7 87.0 87.1 90.6 88.2 87.7 88.6 86.9 91.7 88.1 88.6 93.4 91.3 90.6 91.14-year 77.4 78.7 84.1 84.8 86.3 89.0 86.7 86.6 87.7 85.0 90.3 87.1 86.5 93.4 89.1 88.45-year 75.9 77.1 83.3 83.5 85.3 88.0 85.9 85.7 86.1 84.8 89.4 85.8 85.3 93.3 87.86-year 74.1 75.1 82.3 82.1 84.3 86.8 85.1 85.4 83.5 83.2 89.4 84.6 85.3 93.17-year 73.1 73.8 80.8 80.7 84.1 85.3 82.9 84.3 82.6 82.6 88.9 84.5 84.98-year 71.1 72.9 80.3 79.1 84.1 85.3 82.6 84.2 82.6 82.6 88.6 84.29-year 69.9 71.6 80.2 78.2 83.9 84.5 82.2 83.9 82.5 81.9 88.310-year 68.7 71.2 80.1 77.7 82.9 83.8 82.2 83.4 81.4 81.911-year 67.9 70.5 80.1 77.6 82.0 83.4 82.1 83.4 81.212-year 67.5 70.0 79.9 77.2 82.0 83.0 81.4 82.913-year 66.9 69.4 79.5 77.2 82.0 82.7 81.214-year 66.0 68.8 79.0 77.2 82.0 81.515-year 65.6 68.2 78.1 77.2 81.016-year 65.2 67.6 77.6 77.217-year 64.9 66.5 77.318-year 64.5 66.119-year 64.3 65.720-year 63.4 65.5
Table 9.10Hodgkin Lymphoma
Survival Ratesa
By Year of Diagnosis
All Races, Females
Year of Diagnosis

SEE
R C
ancer Statistics Review
1975-2006N
ational Cancer Institute
Devcan Version 6.4.0, April 2009, National Cancer Institute (http://srab.cancer.gov/devcan/).Source: Incidence data are from the SEER 17 areas (San Francisco, Connecticut, Detroit, Hawaii, Iowa, New Mexico, Seattle, Utah, Atlanta,
San Jose-Monterey, Los Angeles, Alaska Native Registry, Rural Georgia, California excluding SF/SJM/LA, Kentucky, Louisiana andNew Jersey). Mortality data are from the NCHS public use data file for the total US.
- Statistic could not be calculated.A percent or confidence interval value of 0.00 represents a value that is below 0.005.
Risk of Being Diagnosed with Cancer Risk of Dying from Cancer
Race/ Current +10 yrs +20 yrs +30 yrs Eventually Eventually
Ethnicity Age Percent ( 95% C.I. ) Percent ( 95% C.I. ) Percent ( 95% C.I. ) Percent ( 95% C.I. ) Percent ( 95% C.I. )
All Races 0 0.00 ( 0.00, 0.00 ) 0.02 ( 0.02, 0.03 ) 0.07 ( 0.06, 0.07 ) 0.23 ( 0.22, 0.24 ) 0.04 ( 0.04, 0.04 )
10 0.02 ( 0.02, 0.02 ) 0.06 ( 0.06, 0.07 ) 0.10 ( 0.09, 0.10 ) 0.23 ( 0.22, 0.23 ) 0.04 ( 0.04, 0.04 )
20 0.04 ( 0.04, 0.04 ) 0.08 ( 0.07, 0.08 ) 0.10 ( 0.10, 0.11 ) 0.21 ( 0.20, 0.21 ) 0.04 ( 0.04, 0.04 )
30 0.03 ( 0.03, 0.04 ) 0.06 ( 0.06, 0.06 ) 0.08 ( 0.08, 0.09 ) 0.17 ( 0.16, 0.17 ) 0.04 ( 0.04, 0.04 )
40 0.03 ( 0.03, 0.03 ) 0.05 ( 0.05, 0.05 ) 0.08 ( 0.08, 0.08 ) 0.13 ( 0.13, 0.14 ) 0.04 ( 0.04, 0.04 )
50 0.02 ( 0.02, 0.02 ) 0.05 ( 0.05, 0.06 ) 0.09 ( 0.08, 0.09 ) 0.11 ( 0.11, 0.12 ) 0.04 ( 0.03, 0.04 )
60 0.03 ( 0.03, 0.03 ) 0.07 ( 0.06, 0.07 ) 0.09 ( 0.08, 0.09 ) 0.09 ( 0.09, 0.10 ) 0.03 ( 0.03, 0.03 )
70 0.04 ( 0.04, 0.04 ) 0.07 ( 0.06, 0.07 ) - ( - , - ) 0.07 ( 0.07, 0.07 ) 0.03 ( 0.03, 0.03 )
80 0.04 ( 0.03, 0.04 ) - ( - , - ) - ( - , - ) 0.04 ( 0.04, 0.05 ) 0.02 ( 0.02, 0.02 )
White 0 0.00 ( 0.00, 0.00 ) 0.03 ( 0.02, 0.03 ) 0.07 ( 0.07, 0.07 ) 0.25 ( 0.24, 0.25 ) 0.04 ( 0.04, 0.05 )
10 0.02 ( 0.02, 0.02 ) 0.07 ( 0.06, 0.07 ) 0.10 ( 0.10, 0.11 ) 0.24 ( 0.24, 0.25 ) 0.04 ( 0.04, 0.05 )
20 0.05 ( 0.04, 0.05 ) 0.08 ( 0.08, 0.09 ) 0.11 ( 0.11, 0.11 ) 0.22 ( 0.22, 0.23 ) 0.04 ( 0.04, 0.05 )
30 0.04 ( 0.04, 0.04 ) 0.07 ( 0.06, 0.07 ) 0.09 ( 0.09, 0.09 ) 0.18 ( 0.17, 0.19 ) 0.04 ( 0.04, 0.04 )
40 0.03 ( 0.03, 0.03 ) 0.05 ( 0.05, 0.05 ) 0.08 ( 0.08, 0.09 ) 0.14 ( 0.14, 0.15 ) 0.04 ( 0.04, 0.04 )
50 0.02 ( 0.02, 0.03 ) 0.06 ( 0.05, 0.06 ) 0.09 ( 0.09, 0.10 ) 0.12 ( 0.11, 0.12 ) 0.04 ( 0.04, 0.04 )
60 0.03 ( 0.03, 0.04 ) 0.07 ( 0.07, 0.08 ) 0.10 ( 0.09, 0.10 ) 0.10 ( 0.09, 0.11 ) 0.03 ( 0.03, 0.04 )
70 0.04 ( 0.04, 0.05 ) 0.07 ( 0.07, 0.08 ) - ( - , - ) 0.08 ( 0.07, 0.08 ) 0.03 ( 0.03, 0.03 )
80 0.04 ( 0.03, 0.04 ) - ( - , - ) - ( - , - ) 0.04 ( 0.04, 0.05 ) 0.02 ( 0.02, 0.02 )
Black 0 0.00 ( 0.00, 0.01 ) 0.02 ( 0.02, 0.03 ) 0.06 ( 0.05, 0.07 ) 0.20 ( 0.18, 0.22 ) 0.03 ( 0.03, 0.04 )
10 0.02 ( 0.02, 0.02 ) 0.06 ( 0.05, 0.06 ) 0.09 ( 0.09, 0.10 ) 0.20 ( 0.18, 0.22 ) 0.03 ( 0.03, 0.04 )
20 0.04 ( 0.03, 0.04 ) 0.07 ( 0.07, 0.08 ) 0.11 ( 0.10, 0.12 ) 0.18 ( 0.17, 0.20 ) 0.03 ( 0.03, 0.04 )
30 0.04 ( 0.03, 0.04 ) 0.07 ( 0.06, 0.08 ) 0.09 ( 0.09, 0.10 ) 0.15 ( 0.13, 0.16 ) 0.03 ( 0.03, 0.03 )
40 0.03 ( 0.03, 0.04 ) 0.06 ( 0.05, 0.07 ) 0.08 ( 0.07, 0.10 ) 0.11 ( 0.10, 0.13 ) 0.03 ( 0.02, 0.03 )
50 0.03 ( 0.02, 0.03 ) 0.05 ( 0.04, 0.06 ) 0.07 ( 0.06, 0.09 ) 0.08 ( 0.07, 0.10 ) 0.02 ( 0.02, 0.03 )
60 0.03 ( 0.02, 0.04 ) 0.05 ( 0.04, 0.06 ) 0.06 ( 0.05, 0.07 ) 0.06 ( 0.05, 0.08 ) 0.02 ( 0.02, 0.02 )
70 0.03 ( 0.02, 0.04 ) 0.04 ( 0.03, 0.05 ) - ( - , - ) 0.04 ( 0.03, 0.05 ) 0.02 ( 0.01, 0.02 )
80 0.02 ( 0.01, 0.03 ) - ( - , - ) - ( - , - ) 0.02 ( 0.01, 0.04 ) 0.01 ( 0.01, 0.02 )
Table 9.11
Hodgkin Lymphoma
Risk of Being Diagnosed With Cancer in 10, 20 and 30 Years,
Lifetime Risk of Being Diagnosed with Cancer Given Alive and Cancer-Free at Current Age, and
Lifetime Risk of Dying from Cancer Given Alive at Current Age
Both Sexes, 2004-2006 By Race/Ethnicity

SEE
R C
ancer Statistics Review
1975-2006N
ational Cancer Institute
Devcan Version 6.4.0, April 2009, National Cancer Institute (http://srab.cancer.gov/devcan/).Source: Incidence data are from the SEER 17 areas (San Francisco, Connecticut, Detroit, Hawaii, Iowa, New Mexico, Seattle, Utah, Atlanta,
San Jose-Monterey, Los Angeles, Alaska Native Registry, Rural Georgia, California excluding SF/SJM/LA, Kentucky, Louisiana andNew Jersey). Mortality data are from the NCHS public use data file for the total US.
a Underlying incidence and mortality data for American Indian/Alaska Native are based on the CHSDA(Contract Health Service Delivery Area)counties.
b Hispanic is not mutually exclusive from whites, blacks, Asian/Pacific Islanders, and American Indians/Alaska Natives.Underlying incidence data for Hispanics are based on NHIA and exclude cases from the Alaska Native Registry.Underlying mortality data for Hispanics exclude deaths from the District of Columbia, Minnesota, New Hampshire and North Dakota.
- Statistic could not be calculated.A percent or confidence interval value of 0.00 represents a value that is below 0.005.
Risk of Being Diagnosed with Cancer Risk of Dying from Cancer
Race/ Current +10 yrs +20 yrs +30 yrs Eventually Eventually
Ethnicity Age Percent ( 95% C.I. ) Percent ( 95% C.I. ) Percent ( 95% C.I. ) Percent ( 95% C.I. ) Percent ( 95% C.I. )
Asian/ 0 0.00 ( 0.00, 0.00 ) 0.02 ( 0.01, 0.02 ) 0.04 ( 0.04, 0.05 ) 0.11 ( 0.10, 0.14 ) 0.03 ( 0.02, 0.06 )
Pacific 10 0.01 ( 0.01, 0.02 ) 0.04 ( 0.03, 0.05 ) 0.05 ( 0.05, 0.06 ) 0.11 ( 0.10, 0.14 ) 0.03 ( 0.02, 0.06 )
Islander 20 0.03 ( 0.02, 0.03 ) 0.04 ( 0.03, 0.05 ) 0.05 ( 0.04, 0.06 ) 0.10 ( 0.09, 0.13 ) 0.03 ( 0.02, 0.06 )
30 0.01 ( 0.01, 0.02 ) 0.02 ( 0.02, 0.03 ) 0.03 ( 0.02, 0.04 ) 0.07 ( 0.06, 0.10 ) 0.03 ( 0.02, 0.06 )
40 0.01 ( 0.01, 0.01 ) 0.02 ( 0.01, 0.02 ) 0.03 ( 0.02, 0.04 ) 0.06 ( 0.05, 0.09 ) 0.03 ( 0.02, 0.06 )
50 0.01 ( 0.01, 0.01 ) 0.02 ( 0.02, 0.03 ) 0.04 ( 0.03, 0.05 ) 0.05 ( 0.04, 0.08 ) 0.03 ( 0.02, 0.06 )
60 0.01 ( 0.01, 0.02 ) 0.03 ( 0.02, 0.04 ) 0.04 ( 0.03, 0.06 ) 0.04 ( 0.03, 0.07 ) 0.03 ( 0.02, 0.06 )
70 0.02 ( 0.01, 0.03 ) 0.03 ( 0.02, 0.05 ) - ( - , - ) 0.03 ( 0.02, 0.06 ) 0.03 ( 0.02, 0.06 )
80 0.02 ( 0.01, 0.03 ) - ( - , - ) - ( - , - ) 0.02 ( 0.01, 0.05 ) 0.03 ( 0.01, 0.06 )
American 0 0.00 ( 0.00, 0.02 ) 0.00 ( 0.00, 0.03 ) 0.02 ( 0.01, 0.05 ) 0.06 ( 0.04, 0.39 ) 0.02 ( 0.01, 0.11 )
Indian/ 10 0.00 ( 0.00, 0.01 ) 0.02 ( 0.01, 0.05 ) 0.04 ( 0.02, 0.07 ) 0.06 ( 0.04, 0.40 ) 0.02 ( 0.01, 0.11 )
Alaska 20 0.02 ( 0.01, 0.04 ) 0.03 ( 0.02, 0.06 ) 0.05 ( 0.03, 0.08 ) 0.06 ( 0.03, 0.40 ) 0.02 ( 0.01, 0.11 )
Nativea 30 0.01 ( 0.00, 0.03 ) 0.03 ( 0.01, 0.05 ) 0.03 ( 0.02, 0.06 ) 0.04 ( 0.02, 0.39 ) 0.02 ( 0.01, 0.11 )
40 0.01 ( 0.00, 0.03 ) 0.02 ( 0.01, 0.05 ) 0.03 ( 0.01, 0.07 ) 0.03 ( 0.01, 0.39 ) 0.01 ( 0.00, 0.11 )
50 0.01 ( 0.00, 0.03 ) 0.01 ( 0.00, 0.06 ) 0.01 ( 0.00, 0.07 ) 0.01 ( 0.00, 0.40 ) 0.01 ( 0.00, 0.12 )
60 0.01 ( 0.00, 0.05 ) 0.01 ( 0.00, 0.06 ) 0.01 ( 0.00, 0.10 ) 0.01 ( 0.00, 0.43 ) 0.01 ( 0.00, 0.12 )
70 0.00 ( 0.00, 0.06 ) 0.00 ( 0.00, 0.10 ) - ( - , - ) 0.00 ( 0.00, 0.49 ) 0.01 ( 0.00, 0.15 )
80 0.00 ( 0.00, 0.14 ) - ( - , - ) - ( - , - ) 0.00 ( 0.00, 0.67 ) 0.00 ( 0.00, 0.20 )
Hispanicb 0 0.00 ( 0.00, 0.00 ) 0.02 ( 0.02, 0.02 ) 0.04 ( 0.04, 0.05 ) 0.23 ( 0.21, 0.26 ) 0.05 ( 0.05, 0.06 )
10 0.02 ( 0.01, 0.02 ) 0.04 ( 0.04, 0.04 ) 0.06 ( 0.06, 0.07 ) 0.23 ( 0.21, 0.26 ) 0.05 ( 0.05, 0.06 )
20 0.02 ( 0.02, 0.03 ) 0.04 ( 0.04, 0.05 ) 0.06 ( 0.06, 0.07 ) 0.21 ( 0.19, 0.24 ) 0.05 ( 0.05, 0.06 )
30 0.02 ( 0.02, 0.02 ) 0.04 ( 0.04, 0.04 ) 0.06 ( 0.06, 0.07 ) 0.19 ( 0.17, 0.22 ) 0.05 ( 0.04, 0.06 )
40 0.02 ( 0.02, 0.02 ) 0.04 ( 0.04, 0.05 ) 0.08 ( 0.07, 0.09 ) 0.17 ( 0.15, 0.20 ) 0.05 ( 0.04, 0.06 )
50 0.03 ( 0.02, 0.03 ) 0.06 ( 0.05, 0.07 ) 0.11 ( 0.09, 0.12 ) 0.16 ( 0.13, 0.19 ) 0.05 ( 0.04, 0.06 )
60 0.04 ( 0.03, 0.05 ) 0.09 ( 0.07, 0.10 ) 0.13 ( 0.11, 0.15 ) 0.14 ( 0.11, 0.17 ) 0.05 ( 0.04, 0.06 )
70 0.05 ( 0.04, 0.07 ) 0.10 ( 0.08, 0.12 ) - ( - , - ) 0.11 ( 0.09, 0.15 ) 0.04 ( 0.03, 0.05 )
80 0.06 ( 0.04, 0.08 ) - ( - , - ) - ( - , - ) 0.08 ( 0.05, 0.12 ) 0.03 ( 0.02, 0.04 )
Table 9.11 - continued
Hodgkin Lymphoma
Risk of Being Diagnosed With Cancer in 10, 20 and 30 Years,
Lifetime Risk of Being Diagnosed with Cancer Given Alive and Cancer-Free at Current Age, and
Lifetime Risk of Dying from Cancer Given Alive at Current Age
Both Sexes, 2004-2006 By Race/Ethnicity

SEE
R C
ancer Statistics Review
1975-2006N
ational Cancer Institute
Devcan Version 6.4.0, April 2009, National Cancer Institute (http://srab.cancer.gov/devcan/).Source: Incidence data are from the SEER 17 areas (San Francisco, Connecticut, Detroit, Hawaii, Iowa, New Mexico, Seattle, Utah, Atlanta,
San Jose-Monterey, Los Angeles, Alaska Native Registry, Rural Georgia, California excluding SF/SJM/LA, Kentucky, Louisiana andNew Jersey). Mortality data are from the NCHS public use data file for the total US.
- Statistic could not be calculated.A percent or confidence interval value of 0.00 represents a value that is below 0.005.
Risk of Being Diagnosed with Cancer Risk of Dying from Cancer
Race/ Current +10 yrs +20 yrs +30 yrs Eventually Eventually
Ethnicity Age Percent ( 95% C.I. ) Percent ( 95% C.I. ) Percent ( 95% C.I. ) Percent ( 95% C.I. ) Percent ( 95% C.I. )
All Races 0 0.00 ( 0.00, 0.00 ) 0.03 ( 0.02, 0.03 ) 0.06 ( 0.06, 0.07 ) 0.25 ( 0.24, 0.25 ) 0.05 ( 0.05, 0.05 )
10 0.02 ( 0.02, 0.02 ) 0.06 ( 0.06, 0.06 ) 0.10 ( 0.09, 0.10 ) 0.24 ( 0.24, 0.25 ) 0.05 ( 0.05, 0.05 )
20 0.04 ( 0.04, 0.04 ) 0.08 ( 0.07, 0.08 ) 0.11 ( 0.10, 0.11 ) 0.22 ( 0.22, 0.23 ) 0.05 ( 0.05, 0.05 )
30 0.04 ( 0.03, 0.04 ) 0.07 ( 0.06, 0.07 ) 0.09 ( 0.09, 0.10 ) 0.19 ( 0.18, 0.20 ) 0.05 ( 0.04, 0.05 )
40 0.03 ( 0.03, 0.03 ) 0.06 ( 0.06, 0.06 ) 0.09 ( 0.09, 0.10 ) 0.15 ( 0.15, 0.16 ) 0.04 ( 0.04, 0.05 )
50 0.03 ( 0.03, 0.03 ) 0.06 ( 0.06, 0.07 ) 0.10 ( 0.09, 0.11 ) 0.13 ( 0.12, 0.13 ) 0.04 ( 0.04, 0.04 )
60 0.04 ( 0.03, 0.04 ) 0.08 ( 0.07, 0.08 ) 0.10 ( 0.09, 0.11 ) 0.10 ( 0.10, 0.11 ) 0.04 ( 0.04, 0.04 )
70 0.05 ( 0.04, 0.05 ) 0.07 ( 0.07, 0.08 ) - ( - , - ) 0.08 ( 0.07, 0.09 ) 0.03 ( 0.03, 0.04 )
80 0.04 ( 0.04, 0.05 ) - ( - , - ) - ( - , - ) 0.05 ( 0.04, 0.06 ) 0.03 ( 0.02, 0.03 )
White 0 0.00 ( 0.00, 0.00 ) 0.03 ( 0.02, 0.03 ) 0.07 ( 0.06, 0.07 ) 0.26 ( 0.25, 0.27 ) 0.05 ( 0.05, 0.05 )
10 0.02 ( 0.02, 0.02 ) 0.06 ( 0.06, 0.07 ) 0.10 ( 0.10, 0.11 ) 0.26 ( 0.25, 0.27 ) 0.05 ( 0.05, 0.05 )
20 0.04 ( 0.04, 0.05 ) 0.08 ( 0.08, 0.08 ) 0.11 ( 0.11, 0.12 ) 0.24 ( 0.23, 0.25 ) 0.05 ( 0.05, 0.05 )
30 0.04 ( 0.04, 0.04 ) 0.07 ( 0.07, 0.07 ) 0.10 ( 0.09, 0.10 ) 0.20 ( 0.19, 0.21 ) 0.05 ( 0.05, 0.05 )
40 0.03 ( 0.03, 0.04 ) 0.06 ( 0.06, 0.07 ) 0.10 ( 0.09, 0.10 ) 0.16 ( 0.16, 0.17 ) 0.05 ( 0.04, 0.05 )
50 0.03 ( 0.03, 0.03 ) 0.07 ( 0.06, 0.07 ) 0.11 ( 0.10, 0.12 ) 0.14 ( 0.13, 0.15 ) 0.04 ( 0.04, 0.05 )
60 0.04 ( 0.04, 0.04 ) 0.08 ( 0.08, 0.09 ) 0.11 ( 0.10, 0.12 ) 0.11 ( 0.10, 0.12 ) 0.04 ( 0.04, 0.04 )
70 0.05 ( 0.05, 0.06 ) 0.08 ( 0.07, 0.09 ) - ( - , - ) 0.09 ( 0.08, 0.09 ) 0.03 ( 0.03, 0.04 )
80 0.05 ( 0.04, 0.05 ) - ( - , - ) - ( - , - ) 0.05 ( 0.04, 0.06 ) 0.03 ( 0.02, 0.03 )
Black 0 0.01 ( 0.00, 0.01 ) 0.02 ( 0.02, 0.03 ) 0.06 ( 0.05, 0.07 ) 0.21 ( 0.19, 0.24 ) 0.04 ( 0.03, 0.05 )
10 0.02 ( 0.01, 0.03 ) 0.06 ( 0.05, 0.07 ) 0.10 ( 0.08, 0.11 ) 0.21 ( 0.19, 0.24 ) 0.04 ( 0.03, 0.05 )
20 0.04 ( 0.03, 0.04 ) 0.08 ( 0.07, 0.09 ) 0.12 ( 0.10, 0.13 ) 0.19 ( 0.17, 0.22 ) 0.04 ( 0.03, 0.05 )
30 0.04 ( 0.03, 0.05 ) 0.08 ( 0.07, 0.10 ) 0.11 ( 0.10, 0.13 ) 0.16 ( 0.14, 0.19 ) 0.04 ( 0.03, 0.04 )
40 0.04 ( 0.04, 0.05 ) 0.07 ( 0.06, 0.09 ) 0.10 ( 0.09, 0.12 ) 0.12 ( 0.10, 0.15 ) 0.03 ( 0.03, 0.04 )
50 0.03 ( 0.02, 0.04 ) 0.06 ( 0.05, 0.08 ) 0.08 ( 0.06, 0.10 ) 0.08 ( 0.07, 0.11 ) 0.03 ( 0.02, 0.03 )
60 0.04 ( 0.02, 0.05 ) 0.05 ( 0.04, 0.07 ) 0.06 ( 0.04, 0.08 ) 0.06 ( 0.04, 0.09 ) 0.02 ( 0.02, 0.03 )
70 0.02 ( 0.01, 0.04 ) 0.03 ( 0.02, 0.06 ) - ( - , - ) 0.03 ( 0.02, 0.07 ) 0.02 ( 0.01, 0.03 )
80 0.01 ( 0.00, 0.04 ) - ( - , - ) - ( - , - ) 0.01 ( 0.00, 0.07 ) 0.01 ( 0.01, 0.02 )
Table 9.11 - continued
Hodgkin Lymphoma
Risk of Being Diagnosed With Cancer in 10, 20 and 30 Years,
Lifetime Risk of Being Diagnosed with Cancer Given Alive and Cancer-Free at Current Age, and
Lifetime Risk of Dying from Cancer Given Alive at Current Age
Males, 2004-2006 By Race/Ethnicity

SEE
R C
ancer Statistics Review
1975-2006N
ational Cancer Institute
Devcan Version 6.4.0, April 2009, National Cancer Institute (http://srab.cancer.gov/devcan/).Source: Incidence data are from the SEER 17 areas (San Francisco, Connecticut, Detroit, Hawaii, Iowa, New Mexico, Seattle, Utah, Atlanta,
San Jose-Monterey, Los Angeles, Alaska Native Registry, Rural Georgia, California excluding SF/SJM/LA, Kentucky, Louisiana andNew Jersey). Mortality data are from the NCHS public use data file for the total US.
a Underlying incidence and mortality data for American Indian/Alaska Native are based on the CHSDA(Contract Health Service Delivery Area)counties.
b Hispanic is not mutually exclusive from whites, blacks, Asian/Pacific Islanders, and American Indians/Alaska Natives.Underlying incidence data for Hispanics are based on NHIA and exclude cases from the Alaska Native Registry.Underlying mortality data for Hispanics exclude deaths from the District of Columbia, Minnesota, New Hampshire and North Dakota.
- Statistic could not be calculated.A percent or confidence interval value of 0.00 represents a value that is below 0.005.
Risk of Being Diagnosed with Cancer Risk of Dying from Cancer
Race/ Current +10 yrs +20 yrs +30 yrs Eventually Eventually
Ethnicity Age Percent ( 95% C.I. ) Percent ( 95% C.I. ) Percent ( 95% C.I. ) Percent ( 95% C.I. ) Percent ( 95% C.I. )
Asian/ 0 0.00 ( 0.00, 0.01 ) 0.02 ( 0.01, 0.03 ) 0.04 ( 0.03, 0.06 ) 0.13 ( 0.10, 0.17 ) 0.04 ( 0.02, 0.09 )
Pacific 10 0.02 ( 0.01, 0.02 ) 0.04 ( 0.03, 0.05 ) 0.06 ( 0.05, 0.07 ) 0.13 ( 0.10, 0.17 ) 0.04 ( 0.02, 0.09 )
Islander 20 0.02 ( 0.02, 0.03 ) 0.04 ( 0.03, 0.05 ) 0.05 ( 0.04, 0.06 ) 0.11 ( 0.09, 0.16 ) 0.04 ( 0.02, 0.09 )
30 0.01 ( 0.01, 0.02 ) 0.02 ( 0.02, 0.03 ) 0.04 ( 0.03, 0.05 ) 0.08 ( 0.06, 0.13 ) 0.04 ( 0.02, 0.09 )
40 0.01 ( 0.01, 0.02 ) 0.02 ( 0.02, 0.03 ) 0.04 ( 0.03, 0.05 ) 0.07 ( 0.05, 0.12 ) 0.04 ( 0.02, 0.09 )
50 0.01 ( 0.01, 0.02 ) 0.03 ( 0.02, 0.04 ) 0.04 ( 0.03, 0.06 ) 0.06 ( 0.04, 0.11 ) 0.04 ( 0.01, 0.09 )
60 0.02 ( 0.01, 0.03 ) 0.03 ( 0.02, 0.05 ) 0.05 ( 0.03, 0.08 ) 0.05 ( 0.03, 0.10 ) 0.03 ( 0.01, 0.09 )
70 0.01 ( 0.01, 0.03 ) 0.04 ( 0.02, 0.06 ) - ( - , - ) 0.04 ( 0.02, 0.09 ) 0.03 ( 0.01, 0.09 )
80 0.03 ( 0.01, 0.06 ) - ( - , - ) - ( - , - ) 0.03 ( 0.01, 0.10 ) 0.03 ( 0.01, 0.11 )
American 0 0.00 ( 0.00, 0.04 ) 0.00 ( 0.00, 0.04 ) 0.02 ( 0.01, 0.07 ) 0.08 ( 0.04, 1.00 ) 0.02 ( 0.01, 0.26 )
Indian/ 10 0.00 ( 0.00, 0.02 ) 0.02 ( 0.01, 0.06 ) 0.04 ( 0.02, 0.09 ) 0.08 ( 0.04, 1.02 ) 0.02 ( 0.01, 0.27 )
Alaska 20 0.02 ( 0.01, 0.06 ) 0.04 ( 0.02, 0.09 ) 0.07 ( 0.03, 0.12 ) 0.08 ( 0.04, 1.03 ) 0.03 ( 0.01, 0.27 )
Nativea 30 0.02 ( 0.00, 0.05 ) 0.04 ( 0.02, 0.10 ) 0.06 ( 0.02, 0.12 ) 0.06 ( 0.02, 1.04 ) 0.02 ( 0.01, 0.28 )
40 0.03 ( 0.01, 0.07 ) 0.04 ( 0.01, 0.10 ) 0.04 ( 0.01, 0.12 ) 0.04 ( 0.01, 1.06 ) 0.02 ( 0.00, 0.29 )
50 0.01 ( 0.00, 0.06 ) 0.01 ( 0.00, 0.09 ) 0.01 ( 0.00, 0.12 ) 0.01 ( 0.00, 1.10 ) 0.02 ( 0.00, 0.31 )
60 0.00 ( 0.00, 0.08 ) 0.00 ( 0.00, 0.11 ) 0.00 ( 0.00, 0.21 ) 0.00 ( 0.00, 1.20 ) 0.02 ( 0.00, 0.34 )
70 0.00 ( 0.00, 0.14 ) 0.00 ( 0.00, 0.26 ) - ( - , - ) 0.00 ( 0.00, 1.44 ) 0.01 ( 0.00, 0.42 )
80 0.00 ( 0.00, 0.37 ) - ( - , - ) - ( - , - ) 0.00 ( 0.00, 2.07 ) 0.00 ( 0.00, 0.62 )
Hispanicb 0 0.00 ( 0.00, 0.01 ) 0.02 ( 0.02, 0.02 ) 0.04 ( 0.04, 0.05 ) 0.24 ( 0.22, 0.30 ) 0.06 ( 0.05, 0.08 )
10 0.02 ( 0.01, 0.02 ) 0.04 ( 0.03, 0.04 ) 0.06 ( 0.05, 0.07 ) 0.24 ( 0.21, 0.30 ) 0.06 ( 0.05, 0.08 )
20 0.02 ( 0.02, 0.03 ) 0.04 ( 0.04, 0.05 ) 0.07 ( 0.06, 0.07 ) 0.23 ( 0.20, 0.29 ) 0.06 ( 0.05, 0.08 )
30 0.02 ( 0.02, 0.03 ) 0.05 ( 0.04, 0.05 ) 0.08 ( 0.07, 0.09 ) 0.21 ( 0.18, 0.27 ) 0.06 ( 0.05, 0.08 )
40 0.02 ( 0.02, 0.03 ) 0.06 ( 0.05, 0.07 ) 0.10 ( 0.08, 0.11 ) 0.19 ( 0.16, 0.25 ) 0.06 ( 0.05, 0.08 )
50 0.03 ( 0.03, 0.04 ) 0.08 ( 0.06, 0.09 ) 0.13 ( 0.11, 0.15 ) 0.17 ( 0.14, 0.23 ) 0.06 ( 0.05, 0.08 )
60 0.05 ( 0.03, 0.06 ) 0.10 ( 0.08, 0.13 ) 0.15 ( 0.12, 0.18 ) 0.15 ( 0.12, 0.21 ) 0.06 ( 0.04, 0.08 )
70 0.06 ( 0.05, 0.09 ) 0.11 ( 0.09, 0.15 ) - ( - , - ) 0.12 ( 0.09, 0.19 ) 0.05 ( 0.04, 0.08 )
80 0.07 ( 0.04, 0.11 ) - ( - , - ) - ( - , - ) 0.07 ( 0.04, 0.17 ) 0.04 ( 0.02, 0.07 )
Table 9.11 - continued
Hodgkin Lymphoma
Risk of Being Diagnosed With Cancer in 10, 20 and 30 Years,
Lifetime Risk of Being Diagnosed with Cancer Given Alive and Cancer-Free at Current Age, and
Lifetime Risk of Dying from Cancer Given Alive at Current Age
Males, 2004-2006 By Race/Ethnicity

SEE
R C
ancer Statistics Review
1975-2006N
ational Cancer Institute
Devcan Version 6.4.0, April 2009, National Cancer Institute (http://srab.cancer.gov/devcan/).Source: Incidence data are from the SEER 17 areas (San Francisco, Connecticut, Detroit, Hawaii, Iowa, New Mexico, Seattle, Utah, Atlanta,
San Jose-Monterey, Los Angeles, Alaska Native Registry, Rural Georgia, California excluding SF/SJM/LA, Kentucky, Louisiana andNew Jersey). Mortality data are from the NCHS public use data file for the total US.
- Statistic could not be calculated.A percent or confidence interval value of 0.00 represents a value that is below 0.005.
Risk of Being Diagnosed with Cancer Risk of Dying from Cancer
Race/ Current +10 yrs +20 yrs +30 yrs Eventually Eventually
Ethnicity Age Percent ( 95% C.I. ) Percent ( 95% C.I. ) Percent ( 95% C.I. ) Percent ( 95% C.I. ) Percent ( 95% C.I. )
All Races 0 0.00 ( 0.00, 0.00 ) 0.02 ( 0.02, 0.03 ) 0.07 ( 0.06, 0.07 ) 0.21 ( 0.21, 0.22 ) 0.04 ( 0.04, 0.04 )
10 0.02 ( 0.02, 0.02 ) 0.07 ( 0.06, 0.07 ) 0.10 ( 0.09, 0.10 ) 0.21 ( 0.21, 0.22 ) 0.04 ( 0.04, 0.04 )
20 0.05 ( 0.04, 0.05 ) 0.08 ( 0.07, 0.08 ) 0.10 ( 0.10, 0.10 ) 0.19 ( 0.19, 0.20 ) 0.04 ( 0.04, 0.04 )
30 0.03 ( 0.03, 0.04 ) 0.06 ( 0.05, 0.06 ) 0.07 ( 0.07, 0.08 ) 0.15 ( 0.14, 0.16 ) 0.03 ( 0.03, 0.04 )
40 0.02 ( 0.02, 0.02 ) 0.04 ( 0.04, 0.04 ) 0.06 ( 0.06, 0.07 ) 0.12 ( 0.11, 0.12 ) 0.03 ( 0.03, 0.03 )
50 0.02 ( 0.02, 0.02 ) 0.04 ( 0.04, 0.05 ) 0.07 ( 0.07, 0.08 ) 0.10 ( 0.09, 0.10 ) 0.03 ( 0.03, 0.03 )
60 0.03 ( 0.02, 0.03 ) 0.06 ( 0.05, 0.06 ) 0.08 ( 0.07, 0.09 ) 0.08 ( 0.08, 0.09 ) 0.03 ( 0.03, 0.03 )
70 0.04 ( 0.03, 0.04 ) 0.06 ( 0.05, 0.07 ) - ( - , - ) 0.06 ( 0.06, 0.07 ) 0.03 ( 0.02, 0.03 )
80 0.03 ( 0.03, 0.04 ) - ( - , - ) - ( - , - ) 0.04 ( 0.03, 0.04 ) 0.02 ( 0.02, 0.02 )
White 0 0.00 ( 0.00, 0.00 ) 0.02 ( 0.02, 0.03 ) 0.07 ( 0.07, 0.08 ) 0.23 ( 0.22, 0.24 ) 0.04 ( 0.04, 0.04 )
10 0.02 ( 0.02, 0.02 ) 0.07 ( 0.07, 0.08 ) 0.11 ( 0.10, 0.11 ) 0.23 ( 0.22, 0.24 ) 0.04 ( 0.04, 0.04 )
20 0.05 ( 0.04, 0.05 ) 0.08 ( 0.08, 0.09 ) 0.11 ( 0.10, 0.11 ) 0.21 ( 0.20, 0.22 ) 0.04 ( 0.04, 0.04 )
30 0.04 ( 0.03, 0.04 ) 0.06 ( 0.06, 0.06 ) 0.08 ( 0.07, 0.08 ) 0.16 ( 0.15, 0.17 ) 0.04 ( 0.03, 0.04 )
40 0.02 ( 0.02, 0.03 ) 0.04 ( 0.04, 0.05 ) 0.07 ( 0.06, 0.07 ) 0.13 ( 0.12, 0.13 ) 0.03 ( 0.03, 0.04 )
50 0.02 ( 0.02, 0.02 ) 0.04 ( 0.04, 0.05 ) 0.08 ( 0.07, 0.08 ) 0.10 ( 0.10, 0.11 ) 0.03 ( 0.03, 0.03 )
60 0.03 ( 0.02, 0.03 ) 0.06 ( 0.06, 0.07 ) 0.08 ( 0.08, 0.09 ) 0.09 ( 0.08, 0.10 ) 0.03 ( 0.03, 0.03 )
70 0.04 ( 0.03, 0.04 ) 0.06 ( 0.06, 0.07 ) - ( - , - ) 0.07 ( 0.06, 0.08 ) 0.03 ( 0.02, 0.03 )
80 0.03 ( 0.03, 0.04 ) - ( - , - ) - ( - , - ) 0.04 ( 0.03, 0.05 ) 0.02 ( 0.02, 0.02 )
Black 0 0.00 ( 0.00, 0.00 ) 0.02 ( 0.02, 0.03 ) 0.06 ( 0.05, 0.07 ) 0.19 ( 0.17, 0.21 ) 0.03 ( 0.02, 0.03 )
10 0.02 ( 0.02, 0.03 ) 0.06 ( 0.05, 0.07 ) 0.09 ( 0.08, 0.11 ) 0.19 ( 0.17, 0.22 ) 0.03 ( 0.02, 0.03 )
20 0.04 ( 0.03, 0.05 ) 0.07 ( 0.06, 0.08 ) 0.10 ( 0.08, 0.11 ) 0.17 ( 0.15, 0.19 ) 0.03 ( 0.02, 0.03 )
30 0.03 ( 0.03, 0.04 ) 0.06 ( 0.05, 0.07 ) 0.08 ( 0.07, 0.09 ) 0.13 ( 0.11, 0.16 ) 0.03 ( 0.02, 0.03 )
40 0.03 ( 0.02, 0.03 ) 0.05 ( 0.04, 0.06 ) 0.07 ( 0.06, 0.08 ) 0.10 ( 0.08, 0.12 ) 0.02 ( 0.02, 0.03 )
50 0.02 ( 0.02, 0.03 ) 0.05 ( 0.03, 0.06 ) 0.07 ( 0.05, 0.08 ) 0.08 ( 0.06, 0.10 ) 0.02 ( 0.01, 0.02 )
60 0.03 ( 0.02, 0.04 ) 0.05 ( 0.04, 0.07 ) 0.06 ( 0.04, 0.08 ) 0.06 ( 0.05, 0.09 ) 0.02 ( 0.01, 0.02 )
70 0.03 ( 0.02, 0.04 ) 0.04 ( 0.02, 0.06 ) - ( - , - ) 0.04 ( 0.03, 0.07 ) 0.02 ( 0.01, 0.02 )
80 0.02 ( 0.01, 0.03 ) - ( - , - ) - ( - , - ) 0.02 ( 0.01, 0.05 ) 0.01 ( 0.01, 0.02 )
Table 9.11 - continued
Hodgkin Lymphoma
Risk of Being Diagnosed With Cancer in 10, 20 and 30 Years,
Lifetime Risk of Being Diagnosed with Cancer Given Alive and Cancer-Free at Current Age, and
Lifetime Risk of Dying from Cancer Given Alive at Current Age
Females, 2004-2006 By Race/Ethnicity

SEE
R C
ancer Statistics Review
1975-2006N
ational Cancer Institute
Devcan Version 6.4.0, April 2009, National Cancer Institute (http://srab.cancer.gov/devcan/).Source: Incidence data are from the SEER 17 areas (San Francisco, Connecticut, Detroit, Hawaii, Iowa, New Mexico, Seattle, Utah, Atlanta,
San Jose-Monterey, Los Angeles, Alaska Native Registry, Rural Georgia, California excluding SF/SJM/LA, Kentucky, Louisiana andNew Jersey). Mortality data are from the NCHS public use data file for the total US.
a Underlying incidence and mortality data for American Indian/Alaska Native are based on the CHSDA(Contract Health Service Delivery Area)counties.
b Hispanic is not mutually exclusive from whites, blacks, Asian/Pacific Islanders, and American Indians/Alaska Natives.Underlying incidence data for Hispanics are based on NHIA and exclude cases from the Alaska Native Registry.Underlying mortality data for Hispanics exclude deaths from the District of Columbia, Minnesota, New Hampshire and North Dakota.
- Statistic could not be calculated.A percent or confidence interval value of 0.00 represents a value that is below 0.005.
Risk of Being Diagnosed with Cancer Risk of Dying from Cancer
Race/ Current +10 yrs +20 yrs +30 yrs Eventually Eventually
Ethnicity Age Percent ( 95% C.I. ) Percent ( 95% C.I. ) Percent ( 95% C.I. ) Percent ( 95% C.I. ) Percent ( 95% C.I. )
Asian/ 0 0.00 ( 0.00, 0.01 ) 0.01 ( 0.01, 0.02 ) 0.04 ( 0.03, 0.05 ) 0.10 ( 0.08, 0.15 ) 0.03 ( 0.02, 0.07 )
Pacific 10 0.01 ( 0.01, 0.02 ) 0.04 ( 0.03, 0.05 ) 0.05 ( 0.04, 0.06 ) 0.10 ( 0.08, 0.15 ) 0.03 ( 0.02, 0.07 )
Islander 20 0.03 ( 0.02, 0.04 ) 0.04 ( 0.03, 0.05 ) 0.05 ( 0.04, 0.06 ) 0.09 ( 0.07, 0.14 ) 0.03 ( 0.02, 0.07 )
30 0.01 ( 0.01, 0.02 ) 0.02 ( 0.01, 0.03 ) 0.02 ( 0.02, 0.03 ) 0.06 ( 0.05, 0.11 ) 0.03 ( 0.02, 0.07 )
40 0.01 ( 0.00, 0.01 ) 0.01 ( 0.01, 0.02 ) 0.02 ( 0.01, 0.03 ) 0.05 ( 0.03, 0.10 ) 0.03 ( 0.01, 0.07 )
50 0.01 ( 0.00, 0.01 ) 0.02 ( 0.01, 0.03 ) 0.04 ( 0.02, 0.05 ) 0.04 ( 0.03, 0.09 ) 0.03 ( 0.01, 0.07 )
60 0.01 ( 0.00, 0.02 ) 0.03 ( 0.02, 0.05 ) 0.04 ( 0.02, 0.06 ) 0.04 ( 0.02, 0.09 ) 0.03 ( 0.01, 0.07 )
70 0.02 ( 0.01, 0.04 ) 0.03 ( 0.02, 0.05 ) - ( - , - ) 0.03 ( 0.02, 0.08 ) 0.03 ( 0.01, 0.07 )
80 0.01 ( 0.00, 0.03 ) - ( - , - ) - ( - , - ) 0.01 ( 0.00, 0.07 ) 0.03 ( 0.01, 0.08 )
American 0 0.00 ( 0.00, 0.04 ) 0.01 ( 0.00, 0.05 ) 0.02 ( 0.01, 0.07 ) 0.05 ( 0.02, 0.63 ) 0.01 ( 0.00, 0.16 )
Indian/ 10 0.01 ( 0.00, 0.03 ) 0.02 ( 0.01, 0.06 ) 0.03 ( 0.01, 0.08 ) 0.05 ( 0.02, 0.64 ) 0.01 ( 0.00, 0.17 )
Alaska 20 0.02 ( 0.00, 0.05 ) 0.03 ( 0.01, 0.07 ) 0.03 ( 0.01, 0.07 ) 0.04 ( 0.01, 0.63 ) 0.01 ( 0.00, 0.17 )
Nativea 30 0.01 ( 0.00, 0.04 ) 0.01 ( 0.00, 0.04 ) 0.01 ( 0.00, 0.05 ) 0.02 ( 0.00, 0.63 ) 0.01 ( 0.00, 0.17 )
40 0.00 ( 0.00, 0.03 ) 0.00 ( 0.00, 0.04 ) 0.02 ( 0.00, 0.09 ) 0.02 ( 0.00, 0.64 ) 0.01 ( 0.00, 0.17 )
50 0.00 ( 0.00, 0.04 ) 0.02 ( 0.00, 0.09 ) 0.02 ( 0.00, 0.12 ) 0.02 ( 0.00, 0.65 ) 0.01 ( 0.00, 0.18 )
60 0.01 ( 0.00, 0.09 ) 0.01 ( 0.00, 0.12 ) 0.01 ( 0.00, 0.17 ) 0.01 ( 0.00, 0.69 ) 0.01 ( 0.00, 0.19 )
70 0.00 ( 0.00, 0.11 ) 0.00 ( 0.00, 0.17 ) - ( - , - ) 0.00 ( 0.00, 0.77 ) 0.01 ( 0.00, 0.22 )
80 0.00 ( 0.00, 0.23 ) - ( - , - ) - ( - , - ) 0.00 ( 0.00, 1.02 ) 0.00 ( 0.00, 0.29 )
Hispanicb 0 0.00 ( 0.00, 0.00 ) 0.02 ( 0.01, 0.02 ) 0.05 ( 0.04, 0.05 ) 0.21 ( 0.18, 0.26 ) 0.04 ( 0.04, 0.06 )
10 0.02 ( 0.01, 0.02 ) 0.04 ( 0.04, 0.05 ) 0.06 ( 0.06, 0.07 ) 0.21 ( 0.18, 0.26 ) 0.04 ( 0.04, 0.06 )
20 0.03 ( 0.02, 0.03 ) 0.05 ( 0.04, 0.05 ) 0.06 ( 0.05, 0.07 ) 0.20 ( 0.17, 0.24 ) 0.04 ( 0.04, 0.06 )
30 0.02 ( 0.02, 0.02 ) 0.03 ( 0.03, 0.04 ) 0.05 ( 0.04, 0.06 ) 0.17 ( 0.14, 0.22 ) 0.04 ( 0.03, 0.06 )
40 0.01 ( 0.01, 0.02 ) 0.03 ( 0.03, 0.04 ) 0.06 ( 0.05, 0.07 ) 0.15 ( 0.12, 0.20 ) 0.04 ( 0.03, 0.06 )
50 0.02 ( 0.01, 0.02 ) 0.05 ( 0.04, 0.06 ) 0.09 ( 0.07, 0.11 ) 0.14 ( 0.11, 0.19 ) 0.04 ( 0.03, 0.06 )
60 0.03 ( 0.02, 0.04 ) 0.07 ( 0.06, 0.09 ) 0.11 ( 0.09, 0.14 ) 0.13 ( 0.10, 0.18 ) 0.04 ( 0.03, 0.06 )
70 0.05 ( 0.03, 0.06 ) 0.09 ( 0.07, 0.12 ) - ( - , - ) 0.11 ( 0.08, 0.16 ) 0.04 ( 0.03, 0.05 )
80 0.06 ( 0.03, 0.08 ) - ( - , - ) - ( - , - ) 0.07 ( 0.04, 0.14 ) 0.02 ( 0.01, 0.04 )
Table 9.11 - continued
Hodgkin Lymphoma
Risk of Being Diagnosed With Cancer in 10, 20 and 30 Years,
Lifetime Risk of Being Diagnosed with Cancer Given Alive and Cancer-Free at Current Age, and
Lifetime Risk of Dying from Cancer Given Alive at Current Age
Females, 2004-2006 By Race/Ethnicity
SEER Cancer Statistics Review 1975-2006 National Cancer Institute
The AAPC is the Average Annual Percent Change over the time interval. The AAPCs are calculated bythe Joinpoint Regression Program Version 3.3, April 2008, National Cancer Institute.
- Statistic not shown. Rate based on less than 16 cases for the time interval.Trend based on less than 10 cases for at least one year within the time interval.
a Rates are age-adjusted to the 2000 US Std Population (19 age groups - Census P25-1130). Trendsare based on rates age-adjusted to the 2000 US Std Population (19 age groups - Census P25-1130).
b The SEER 9 areas are San Francisco, Connecticut, Detroit, Hawaii, Iowa, New Mexico, Seattle, Utahand Atlanta.The SEER 13 areas comprise the SEER 9 areas plus San Jose-Monterey, Los Angeles, the AlaskaNative Registry and Rural Georgia.The SEER 17 areas comprise the SEER 13 areas plus California excluding SF/SJM/LA, Kentucky,Louisiana and New Jersey.
c The 1997-2006 AAPC estimates are based on a Joinpoint analysis with up to 2 Joinpoints overdiagnosis years 1992-2006.
d The 1997-2006 AAPC estimates are based on a Joinpoint analysis with up to 4 Joinpoints overdiagnosis years 1975-2006.
e Hispanic and Non-Hispanic are not mutually exclusive from whites, blacks, Asian/PacificIslanders, and American Indians/Alaska Natives. Incidence data for Hispanics and Non-Hispanicsare based on NHIA and exclude cases from the Alaska Native Registry. The 2002-2006 Hispanic andNon-Hispanic death rates exclude deaths from the District of Columbia, Minnesota, New Hampshireand North Dakota. The 1997-2006 Hispanic and Non-Hispanic mortality trends exclude deaths fromConnecticut, the District of Columbia, Maine, Maryland, Minnesota, New Hampshire, New York, NorthDakota, Oklahoma and Vermont.
f Incidence data for American Indian/Alaska Native are based on the CHSDA(Contract Health ServiceDelivery Area) counties.
g US Mortality Files, National Center for Health Statistics, CDC.h The 1997-2006 mortality AAPCs are based on a Joinpoint analysis using years of death 1992-2006.* The APC is significantly different from zero (p<.05).
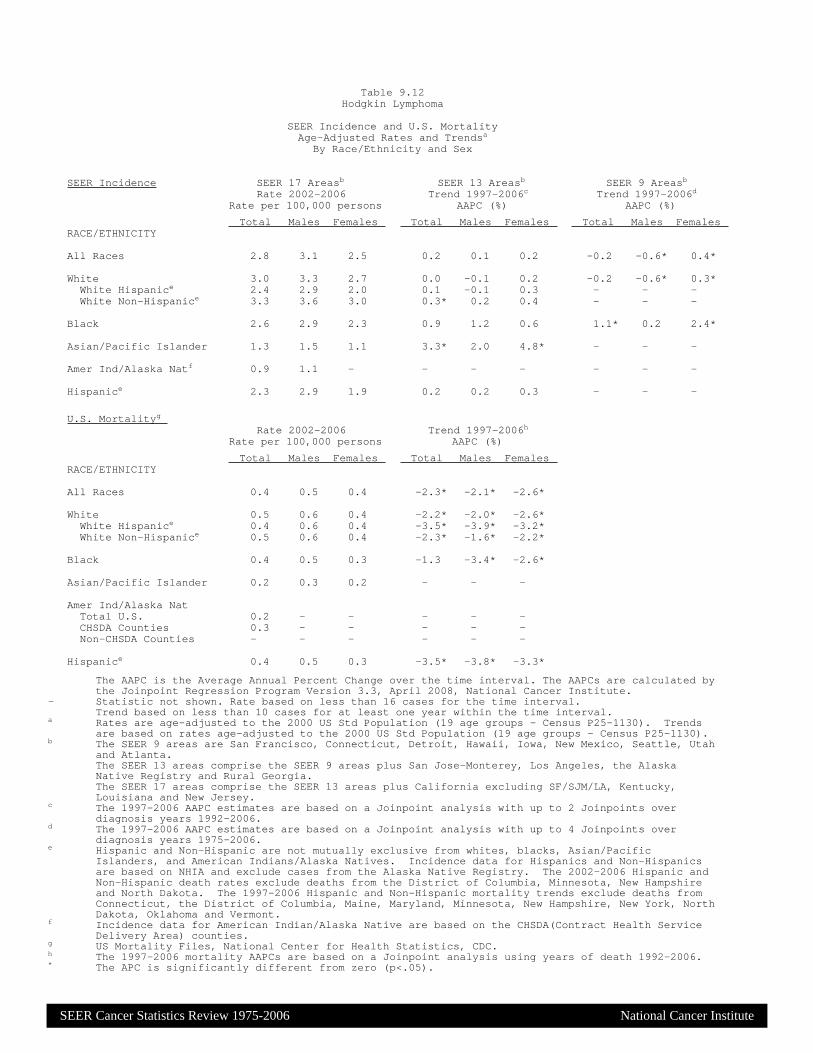
SEER Incidence SEER 17 Areasb SEER 13 Areasb SEER 9 Areasb
Rate 2002-2006 Trend 1997-2006c Trend 1997-2006d
Rate per 100,000 persons AAPC (%) AAPC (%)
Total Males Females Total Males Females Total Males Females RACE/ETHNICITY
All Races 2.8 3.1 2.5 0.2 0.1 0.2 -0.2 -0.6* 0.4*
White 3.0 3.3 2.7 0.0 -0.1 0.2 -0.2 -0.6* 0.3*White Hispanice 2.4 2.9 2.0 0.1 -0.1 0.3 - - -White Non-Hispanice 3.3 3.6 3.0 0.3* 0.2 0.4 - - -
Black 2.6 2.9 2.3 0.9 1.2 0.6 1.1* 0.2 2.4*
Asian/Pacific Islander 1.3 1.5 1.1 3.3* 2.0 4.8* - - -
Amer Ind/Alaska Natf 0.9 1.1 - - - - - - -
Hispanice 2.3 2.9 1.9 0.2 0.2 0.3 - - -
U.S. Mortalityg Rate 2002-2006 Trend 1997-2006h
Rate per 100,000 persons AAPC (%)
Total Males Females Total Males FemalesRACE/ETHNICITY
All Races 0.4 0.5 0.4 -2.3* -2.1* -2.6*
White 0.5 0.6 0.4 -2.2* -2.0* -2.6*White Hispanice 0.4 0.6 0.4 -3.5* -3.9* -3.2*White Non-Hispanice 0.5 0.6 0.4 -2.3* -1.6* -2.2*
Black 0.4 0.5 0.3 -1.3 -3.4* -2.6*
Asian/Pacific Islander 0.2 0.3 0.2 - - -
Amer Ind/Alaska NatTotal U.S. 0.2 - - - - -CHSDA Counties 0.3 - - - - -Non-CHSDA Counties - - - - - -
Hispanice 0.4 0.5 0.3 -3.5* -3.8* -3.3*
Table 9.12Hodgkin Lymphoma
SEER Incidence and U.S. MortalityAge-Adjusted Rates and Trendsa
By Race/Ethnicity and Sex

SEE
R C
ancer Statistics Review
1975-2006N
ational Cancer Institute
a Rates are per 100,000 and are age-adjusted to the 2000 US Std Population (19 age groups - Census P25-1130)b The SEER 9 areas are San Francisco, Connecticut, Detroit, Hawaii, Iowa, New Mexico, Seattle, Utah and Atlanta.
The SEER 11 areas comprise the SEER 9 areas plus San Jose-Monterey and Los Angeles.The SEER 13 areas comprise the SEER 11 areas plus the Alaska Native Registry and Rural Georgia.The SEER 17 areas comprise the SEER 13 areas plus California excluding SF/SJM/LA, Kentucky, Louisiana and New Jersey.
- Statistic not shown. Rate based on less than 16 cases for the time interval.
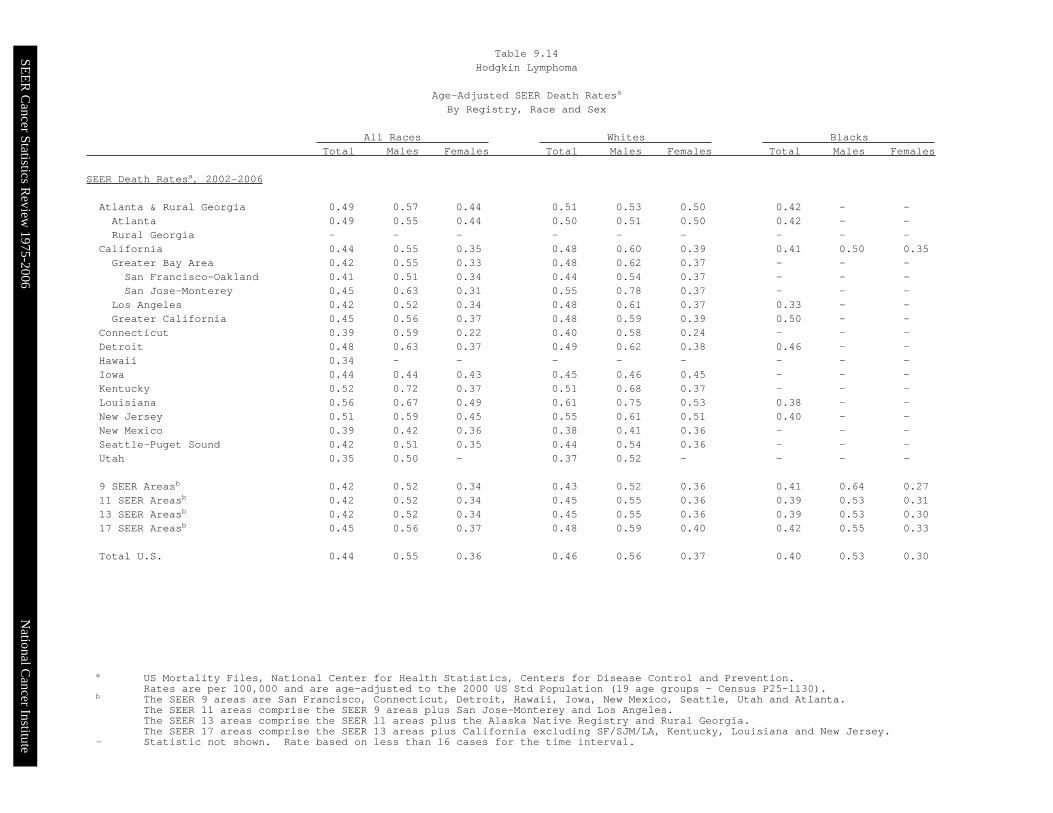
All Races Whites Blacks Total Males Females Total Males Females Total Males Females
SEER Incidence Ratesa, 2002-2006
Atlanta & Rural Georgia 2.53 2.63 2.40 2.75 2.84 2.64 2.51 2.66 2.35Atlanta 2.52 2.63 2.39 2.76 2.87 2.63 2.43 2.59 2.28Rural Georgia - - - - - - - - -
California 2.49 2.82 2.19 2.70 3.03 2.40 2.40 2.66 2.19Greater Bay Area 2.65 3.04 2.30 3.00 3.40 2.64 2.82 3.39 2.32San Francisco-Oakland 2.52 2.95 2.13 2.84 3.22 2.49 2.84 3.40 2.37San Jose-Monterey 2.87 3.20 2.59 3.24 3.67 2.87 - - -
Los Angeles 2.35 2.69 2.05 2.62 3.00 2.27 2.17 2.23 2.11Greater California 2.51 2.82 2.23 2.66 2.95 2.41 2.48 2.76 2.25
Connecticut 3.61 3.90 3.42 3.67 3.92 3.51 3.72 4.18 3.46Detroit 3.27 3.44 3.13 3.46 3.54 3.40 2.99 3.49 2.65Hawaii 1.97 2.28 1.71 2.19 2.61 - - - -Iowa 3.11 3.42 2.84 3.10 3.39 2.84 - - -Kentucky 2.85 3.38 2.37 2.84 3.36 2.38 2.98 3.54 2.42Louisiana 2.96 3.49 2.49 3.31 3.97 2.70 2.26 2.55 2.04New Jersey 3.39 3.66 3.17 3.67 3.89 3.50 2.73 3.18 2.36New Mexico 2.49 2.93 2.07 2.73 3.15 2.32 - - -Seattle-Puget Sound 3.05 3.50 2.67 3.27 3.80 2.81 2.56 - 3.31Utah 2.49 2.62 2.41 2.57 2.71 2.50 - - -
9 SEER Areasb 2.89 3.19 2.63 3.09 3.38 2.85 2.83 3.19 2.5611 SEER Areasb 2.75 3.06 2.48 2.97 3.29 2.70 2.68 2.96 2.4613 SEER Areasb 2.74 3.05 2.47 2.97 3.29 2.70 2.69 2.97 2.4617 SEER Areasb 2.77 3.10 2.49 2.97 3.29 2.69 2.61 2.93 2.35
Table 9.13Hodgkin Lymphoma
Age-Adjusted SEER Incidence Ratesa
By Registry, Race and Sex
SEE
R C
ancer Statistics Review
1975-2006N
ational Cancer Institute
a US Mortality Files, National Center for Health Statistics, Centers for Disease Control and Prevention.Rates are per 100,000 and are age-adjusted to the 2000 US Std Population (19 age groups - Census P25-1130).
b The SEER 9 areas are San Francisco, Connecticut, Detroit, Hawaii, Iowa, New Mexico, Seattle, Utah and Atlanta.The SEER 11 areas comprise the SEER 9 areas plus San Jose-Monterey and Los Angeles.The SEER 13 areas comprise the SEER 11 areas plus the Alaska Native Registry and Rural Georgia.The SEER 17 areas comprise the SEER 13 areas plus California excluding SF/SJM/LA, Kentucky, Louisiana and New Jersey.
- Statistic not shown. Rate based on less than 16 cases for the time interval.
All Races Whites Blacks Total Males Females Total Males Females Total Males Females
SEER Death Ratesa, 2002-2006
Atlanta & Rural Georgia 0.49 0.57 0.44 0.51 0.53 0.50 0.42 - -Atlanta 0.49 0.55 0.44 0.50 0.51 0.50 0.42 - -Rural Georgia - - - - - - - - -
California 0.44 0.55 0.35 0.48 0.60 0.39 0.41 0.50 0.35Greater Bay Area 0.42 0.55 0.33 0.48 0.62 0.37 - - -San Francisco-Oakland 0.41 0.51 0.34 0.44 0.54 0.37 - - -San Jose-Monterey 0.45 0.63 0.31 0.55 0.78 0.37 - - -
Los Angeles 0.42 0.52 0.34 0.48 0.61 0.37 0.33 - -Greater California 0.45 0.56 0.37 0.48 0.59 0.39 0.50 - -
Connecticut 0.39 0.59 0.22 0.40 0.58 0.24 - - -Detroit 0.48 0.63 0.37 0.49 0.62 0.38 0.46 - -Hawaii 0.34 - - - - - - - -Iowa 0.44 0.44 0.43 0.45 0.46 0.45 - - -Kentucky 0.52 0.72 0.37 0.51 0.68 0.37 - - -Louisiana 0.56 0.67 0.49 0.61 0.75 0.53 0.38 - -New Jersey 0.51 0.59 0.45 0.55 0.61 0.51 0.40 - -New Mexico 0.39 0.42 0.36 0.38 0.41 0.36 - - -Seattle-Puget Sound 0.42 0.51 0.35 0.44 0.54 0.36 - - -Utah 0.35 0.50 - 0.37 0.52 - - - -
9 SEER Areasb 0.42 0.52 0.34 0.43 0.52 0.36 0.41 0.64 0.2711 SEER Areasb 0.42 0.52 0.34 0.45 0.55 0.36 0.39 0.53 0.3113 SEER Areasb 0.42 0.52 0.34 0.45 0.55 0.36 0.39 0.53 0.3017 SEER Areasb 0.45 0.56 0.37 0.48 0.59 0.40 0.42 0.55 0.33
Total U.S. 0.44 0.55 0.36 0.46 0.56 0.37 0.40 0.53 0.30
Table 9.14Hodgkin Lymphoma
Age-Adjusted SEER Death Ratesa
By Registry, Race and Sex
SEER Cancer Statistics Review 1975-2006 National Cancer Institute
a US Mortality Files, National Center for Health Statistics, Centers for Disease Control andPrevention. Rates are per 100,000 and are age-adjusted to the 2000 US Std Population (19age groups - Census P25-1130).
b Difference between state rate and total U.S. rate is statistically significant (p<=.0002).c Absolute percent difference between state rate and total U.S. rate is 15% or more.SE Standard error of the rate.PD Percent difference between state rate and total U.S. rate.
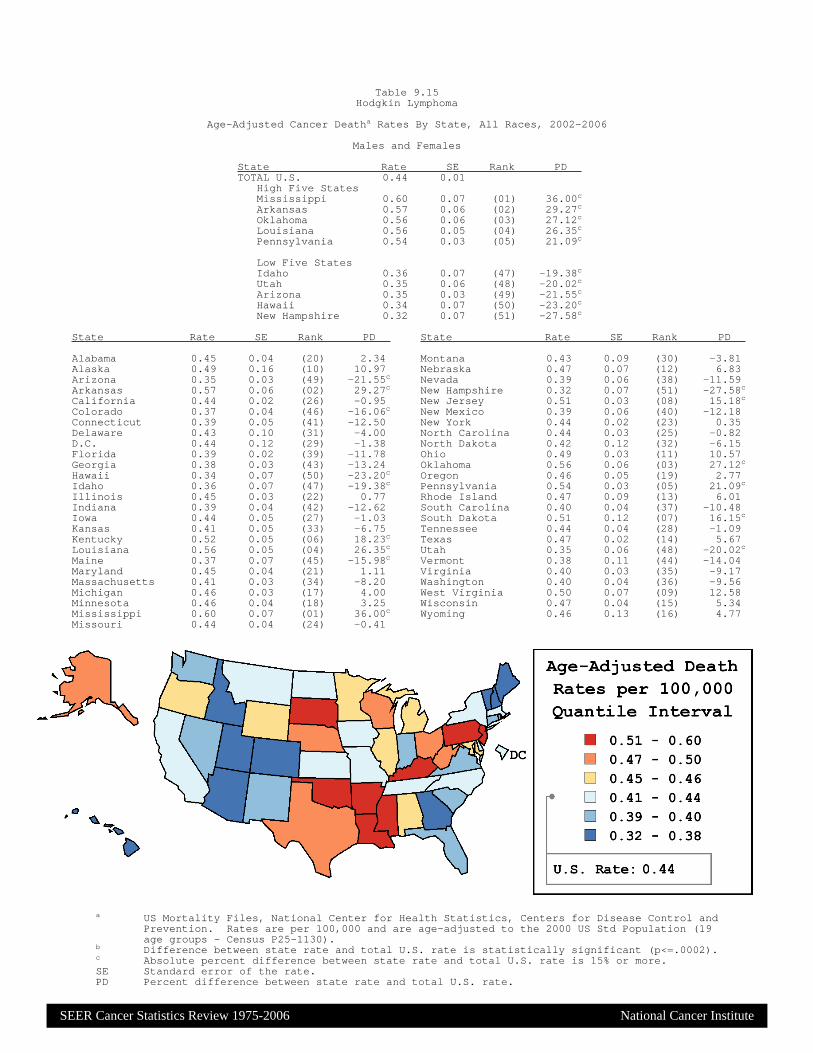
State Rate SE Rank PD TOTAL U.S. 0.44 0.01
High Five StatesMississippi 0.60 0.07 (01) 36.00c
Arkansas 0.57 0.06 (02) 29.27c
Oklahoma 0.56 0.06 (03) 27.12c
Louisiana 0.56 0.05 (04) 26.35c
Pennsylvania 0.54 0.03 (05) 21.09c
Low Five StatesIdaho 0.36 0.07 (47) -19.38c
Utah 0.35 0.06 (48) -20.02c
Arizona 0.35 0.03 (49) -21.55c
Hawaii 0.34 0.07 (50) -23.20c
New Hampshire 0.32 0.07 (51) -27.58c
State Rate SE Rank PD State Rate SE Rank PD
Alabama 0.45 0.04 (20) 2.34 Montana 0.43 0.09 (30) -3.81Alaska 0.49 0.16 (10) 10.97 Nebraska 0.47 0.07 (12) 6.83Arizona 0.35 0.03 (49) -21.55c Nevada 0.39 0.06 (38) -11.59Arkansas 0.57 0.06 (02) 29.27c New Hampshire 0.32 0.07 (51) -27.58c
California 0.44 0.02 (26) -0.95 New Jersey 0.51 0.03 (08) 15.18c
Colorado 0.37 0.04 (46) -16.06c New Mexico 0.39 0.06 (40) -12.18Connecticut 0.39 0.05 (41) -12.50 New York 0.44 0.02 (23) 0.35Delaware 0.43 0.10 (31) -4.00 North Carolina 0.44 0.03 (25) -0.82D.C. 0.44 0.12 (29) -1.38 North Dakota 0.42 0.12 (32) -6.15Florida 0.39 0.02 (39) -11.78 Ohio 0.49 0.03 (11) 10.57Georgia 0.38 0.03 (43) -13.24 Oklahoma 0.56 0.06 (03) 27.12c
Hawaii 0.34 0.07 (50) -23.20c Oregon 0.46 0.05 (19) 2.77Idaho 0.36 0.07 (47) -19.38c Pennsylvania 0.54 0.03 (05) 21.09c
Illinois 0.45 0.03 (22) 0.77 Rhode Island 0.47 0.09 (13) 6.01Indiana 0.39 0.04 (42) -12.62 South Carolina 0.40 0.04 (37) -10.48Iowa 0.44 0.05 (27) -1.03 South Dakota 0.51 0.12 (07) 16.15c
Kansas 0.41 0.05 (33) -6.75 Tennessee 0.44 0.04 (28) -1.09Kentucky 0.52 0.05 (06) 18.23c Texas 0.47 0.02 (14) 5.67Louisiana 0.56 0.05 (04) 26.35c Utah 0.35 0.06 (48) -20.02c
Maine 0.37 0.07 (45) -15.98c Vermont 0.38 0.11 (44) -14.04Maryland 0.45 0.04 (21) 1.11 Virginia 0.40 0.03 (35) -9.17Massachusetts 0.41 0.03 (34) -8.20 Washington 0.40 0.04 (36) -9.56Michigan 0.46 0.03 (17) 4.00 West Virginia 0.50 0.07 (09) 12.58Minnesota 0.46 0.04 (18) 3.25 Wisconsin 0.47 0.04 (15) 5.34Mississippi 0.60 0.07 (01) 36.00c Wyoming 0.46 0.13 (16) 4.77Missouri 0.44 0.04 (24) -0.41
Table 9.15Hodgkin Lymphoma
Age-Adjusted Cancer Deatha Rates By State, All Races, 2002-2006
Males and Females

SEER Cancer Statistics Review 1975-2006 National Cancer Institute
a US Mortality Files, National Center for Health Statistics, Centers for Disease Control andPrevention. Rates are per 100,000 and are age-adjusted to the 2000 US Std Population (19age groups - Census P25-1130).
b Difference between state rate and total U.S. rate is statistically significant (p<=.0002).c Absolute percent difference between state rate and total U.S. rate is 15% or more.SE Standard error of the rate.PD Percent difference between state rate and total U.S. rate.
State Rate SE Rank PD TOTAL U.S. 0.55 0.01
High Five StatesMississippi 0.75 0.11 (01) 36.87c
Arkansas 0.72 0.10 (02) 32.25c
Kentucky 0.72 0.09 (03) 31.98c
Pennsylvania 0.67 0.05 (04) 23.37c
Louisiana 0.67 0.09 (05) 23.00c
Low Five StatesNew Mexico 0.42 0.10 (47) -23.88c
Nevada 0.41 0.09 (48) -24.17c
Hawaii 0.36 0.11 (49) -34.31c
Alaska 0.30 0.12 (50) -44.34c
Vermont 0.28 0.14 (51) -48.73c
State Rate SE Rank PD State Rate SE Rank PD
Alabama 0.58 0.07 (17) 5.32 Montana 0.57 0.16 (18) 4.50Alaska 0.30 0.12 (50) -44.34c Nebraska 0.63 0.12 (06) 14.33Arizona 0.47 0.06 (39) -13.28 Nevada 0.41 0.09 (48) -24.17c
Arkansas 0.72 0.10 (02) 32.25c New Hampshire 0.42 0.13 (45) -22.67c
California 0.55 0.03 (19) -0.16 New Jersey 0.59 0.05 (13) 7.34Colorado 0.51 0.08 (28) -7.41 New Mexico 0.42 0.10 (47) -23.88c
Connecticut 0.59 0.09 (12) 8.26 New York 0.54 0.04 (20) -0.85Delaware 0.51 0.17 (27) -5.87 North Carolina 0.61 0.06 (09) 10.99D.C. 0.50 0.19 (32) -8.57 North Dakota 0.52 0.18 (26) -5.67Florida 0.51 0.03 (29) -7.44 Ohio 0.61 0.05 (08) 12.40Georgia 0.43 0.05 (44) -20.77c Oklahoma 0.62 0.09 (07) 13.02Hawaii 0.36 0.11 (49) -34.31c Oregon 0.52 0.08 (24) -4.64Idaho 0.42 0.12 (46) -23.31c Pennsylvania 0.67 0.05 (04) 23.37c
Illinois 0.58 0.05 (14) 6.37 Rhode Island 0.60 0.15 (11) 8.98Indiana 0.54 0.06 (22) -2.13 South Carolina 0.52 0.08 (25) -4.73Iowa 0.44 0.08 (43) -18.99c South Dakota 0.54 0.17 (21) -2.03Kansas 0.50 0.09 (34) -9.00 Tennessee 0.46 0.06 (41) -16.64c
Kentucky 0.72 0.09 (03) 31.98c Texas 0.58 0.04 (16) 5.63Louisiana 0.67 0.09 (05) 23.00c Utah 0.50 0.11 (31) -8.50Maine 0.47 0.12 (40) -13.71 Vermont 0.28 0.14 (51) -48.73c
Maryland 0.49 0.06 (37) -9.58 Virginia 0.48 0.05 (38) -13.10Massachusetts 0.53 0.06 (23) -2.91 Washington 0.49 0.06 (36) -9.54Michigan 0.58 0.05 (15) 6.05 West Virginia 0.50 0.11 (30) -8.17Minnesota 0.50 0.07 (33) -8.77 Wisconsin 0.60 0.07 (10) 9.20Mississippi 0.75 0.11 (01) 36.87c Wyoming 0.44 0.21 (42) -18.65c
Missouri 0.50 0.06 (35) -9.20
Table 9.16Hodgkin Lymphoma
Age-Adjusted Cancer Deatha Rates By State, All Races, 2002-2006
Males

SEER Cancer Statistics Review 1975-2006 National Cancer Institute
a US Mortality Files, National Center for Health Statistics, Centers for Disease Control andPrevention. Rates are per 100,000 and are age-adjusted to the 2000 US Std Population (19age groups - Census P25-1130).
b Difference between state rate and total U.S. rate is statistically significant (p<=.0002).c Absolute percent difference between state rate and total U.S. rate is 15% or more.SE Standard error of the rate.PD Percent difference between state rate and total U.S. rate.
State Rate SE Rank PD TOTAL U.S. 0.36 0.01
High Five StatesAlaska 0.62 0.26 (01) 73.31c
Oklahoma 0.53 0.07 (02) 46.82c
Vermont 0.51 0.18 (03) 41.23c
Mississippi 0.51 0.08 (04) 41.00c
South Dakota 0.50 0.16 (05) 40.34c
Low Five StatesIndiana 0.29 0.04 (47) -20.33c
Colorado 0.25 0.05 (48) -30.13c
Utah 0.24 0.07 (49) -32.66c
Arizona 0.23 0.04 (50) -35.64c
Connecticut 0.22 0.05 (51) -39.43c
State Rate SE Rank PD State Rate SE Rank PD
Alabama 0.35 0.05 (28) -1.54 Montana 0.29 0.10 (45) -19.24c
Alaska 0.62 0.26 (01) 73.31c Nebraska 0.34 0.08 (32) -4.35Arizona 0.23 0.04 (50) -35.64c Nevada 0.35 0.08 (30) -1.63Arkansas 0.43 0.07 (12) 19.24c New Hampshire 0.29 0.09 (44) -18.70c
California 0.35 0.02 (29) -1.63 New Jersey 0.45 0.04 (09) 25.85c
Colorado 0.25 0.05 (48) -30.13c New Mexico 0.36 0.08 (25) 0.84Connecticut 0.22 0.05 (51) -39.43c New York 0.37 0.03 (22) 2.99Delaware 0.37 0.13 (21) 3.13 North Carolina 0.30 0.04 (42) -16.85c
D.C. 0.34 0.14 (33) -4.51 North Dakota 0.33 0.15 (36) -7.42Florida 0.29 0.02 (46) -19.41c Ohio 0.39 0.03 (17) 9.82Georgia 0.34 0.04 (34) -5.50 Oklahoma 0.53 0.07 (02) 46.82c
Hawaii 0.32 0.09 (39) -10.97 Oregon 0.40 0.06 (15) 11.51Idaho 0.32 0.10 (38) -10.89 Pennsylvania 0.43 0.03 (13) 18.89c
Illinois 0.35 0.03 (31) -3.11 Rhode Island 0.38 0.11 (19) 6.23Indiana 0.29 0.04 (47) -20.33c South Carolina 0.30 0.05 (43) -17.80c
Iowa 0.43 0.07 (11) 20.50c South Dakota 0.50 0.16 (05) 40.34c
Kansas 0.36 0.07 (26) -0.34 Tennessee 0.42 0.05 (14) 17.81c
Kentucky 0.37 0.06 (23) 2.51 Texas 0.37 0.03 (20) 3.81Louisiana 0.49 0.06 (06) 36.41c Utah 0.24 0.07 (49) -32.66c
Maine 0.31 0.09 (41) -14.98 Vermont 0.51 0.18 (03) 41.23c
Maryland 0.40 0.05 (16) 11.49 Virginia 0.34 0.04 (35) -6.30Massachusetts 0.31 0.04 (40) -14.75 Washington 0.32 0.04 (37) -10.01Michigan 0.37 0.04 (24) 2.17 West Virginia 0.48 0.09 (08) 32.52c
Minnesota 0.44 0.06 (10) 22.71c Wisconsin 0.36 0.05 (27) -0.66Mississippi 0.51 0.08 (04) 41.00c Wyoming 0.49 0.18 (07) 35.15c
Missouri 0.38 0.05 (18) 6.57
Table 9.17Hodgkin Lymphoma
Age-Adjusted Cancer Deatha Rates By State, All Races, 2002-2006
Females

SEE
R C
ancer Statistics Review
1975-2006N
ational Cancer Institute
a US 2006 cancer prevalence counts are based on 2006 cancer prevalence proportions from the SEER registries and 1/1/2006US population estimates based on the average of 2005 and 2006 population estimates from the US Bureau of the Census.Prevalence was calculated using the First Malignant Primary Only for a person.
b c d Statistics based on (b) SEER 9 Areas (c) SEER 11 Areas and Rural Georgia (d) NHIA for Hispanic for SEER 11 Areas andRural Georgia.
e Maximum limited-duration prevalence: 31 years for 1975-2006 SEER 9 data; 16 years for 1990-2006 SEER 11 data(used to calculate prevalence for Hispanics and Asian Pacific Islanders).
f Percentages are age-adjusted to the 2000 US Standard Population (19 age groups - Census P25-1130) by 5-year age groups.g h i (g) Cases diagnosed more than 31 years ago were estimated using the completeness index method (Capocaccia et. al. 1997,
Merrill et. al. 2000). (h) Complete prevalence is obtained by summing 0 to <31 and >=31. (i) Age-specific completeness indexwas approximated using empirical data from historical Connecticut tumor registry.
- Statistic not shown. Statistic based on fewer than 5 cases estimated alive in SEER for the time interval.+ Not available.
Years Since Diagnosis 0 to <5 5 to <10 10 to <15 15 to <20 20 to <25 25 to <30 0 to <16e 0 to <31e >=31g Completeh
Race Sex All Racesb Both Sexes 35,015 30,332 25,848 22,424 17,530 12,078 96,298 145,147 14,860 160,007
Males 18,420 15,663 13,204 11,289 9,268 6,129 50,028 74,925 7,525 82,450Females 16,595 14,669 12,644 11,135 8,262 5,949 46,270 70,222 7,335 77,557
Whiteb Both Sexes 29,840 26,587 23,228 20,651 16,308 11,385 84,252 129,866 16,583 146,449Males 15,842 13,727 11,920 10,455 8,474 5,674 44,025 66,993 8,573 75,566Females 13,998 12,860 11,308 10,196 7,834 5,711 40,227 62,873 8,010 70,883
Blackb Both Sexes 3,876 2,969 2,202 1,366 1,020 568 9,465 12,016 1,094 13,110Males 1,834 1,507 1,086 624 696 375 4,589 6,143 742 6,885Females 2,042 1,462 1,116 742 324 193 4,876 5,873 352 6,225
Asian/ Both Sexes 752 431 277 + + + 1,498 + + +Pacific Males 399 241 124 + + + 778 + + +Islanderc Females 353 190 153 + + + 720 + + +
Hispanicd Both Sexes 3,143 2,344 1,584 + + + 7,435 + + +Males 1,767 1,338 904 + + + 4,187 + + +Females 1,376 1,006 680 + + + 3,248 + + +
Age Specific (Crude) Age-Adjustedf Age at Prevalence All Ages 0-9 10-19 20-29 30-39 40-49 50-59 60-69 70-79 80+ All Ages
Race Sex All Racesc Both Sexes 0.0280% 0.0006% 0.0089% 0.0382% 0.0515% 0.0419% 0.0296% 0.0248% 0.0247% 0.0166% 0.0278%
Males 0.0296% 0.0008% 0.0104% 0.0347% 0.0508% 0.0458% 0.0346% 0.0306% 0.0303% 0.0199% 0.0295%Females 0.0263% 0.0004% 0.0074% 0.0421% 0.0522% 0.0380% 0.0249% 0.0195% 0.0204% 0.0148% 0.0264%
Whitec Both Sexes 0.0315% 0.0007% 0.0097% 0.0435% 0.0593% 0.0471% 0.0329% 0.0275% 0.0278% 0.0184% 0.0314%Males 0.0333% 0.0009% 0.0111% 0.0388% 0.0579% 0.0510% 0.0383% 0.0339% 0.0340% 0.0222% 0.0330%Females 0.0297% 0.0006% 0.0082% 0.0486% 0.0607% 0.0430% 0.0276% 0.0216% 0.0228% 0.0163% 0.0301%
Blackc Both Sexes 0.0238% - 0.0076% 0.0290% 0.0448% 0.0394% 0.0291% 0.0246% 0.0189% 0.0133% 0.0244%Males 0.0244% - 0.0080% 0.0266% 0.0420% 0.0446% 0.0345% 0.0280% 0.0221% 0.0204% 0.0258%Females 0.0232% - 0.0072% 0.0314% 0.0472% 0.0348% 0.0245% 0.0218% 0.0167% 0.0099% 0.0234%
Asian/ Both Sexes 0.0101% - 0.0051% 0.0173% 0.0167% 0.0124% 0.0085% 0.0076% 0.0081% 0.0041% 0.0096%Pacific Males 0.0109% - 0.0080% 0.0171% 0.0172% 0.0128% 0.0081% 0.0112% 0.0101% - 0.0105%Islanderc Females 0.0093% - 0.0020% 0.0174% 0.0162% 0.0120% 0.0089% 0.0046% 0.0066% - 0.0087%
Hispanicd Both Sexes 0.0164% 0.0010% 0.0090% 0.0221% 0.0250% 0.0232% 0.0212% 0.0268% 0.0265% 0.0150% 0.0181%Males 0.0180% 0.0013% 0.0114% 0.0211% 0.0252% 0.0263% 0.0265% 0.0307% 0.0371% 0.0276% 0.0209%Females 0.0147% 0.0007% 0.0065% 0.0233% 0.0248% 0.0198% 0.0162% 0.0236% 0.0187% 0.0078% 0.0158%
Table 9.18Hodgkin Lymphoma
Estimated United States Cancer Prevalence Countsa on January 1, 2006By Race/Ethnicity, Sex and Years Since Diagnosis
Estimated prevalence percenta on January 1, 2006, of the SEER 11 population diagnosed in the previous 16 yearsBy Age at Prevalence, Race/Ethnicity and Sex

SEE
R C
ancer Statistics Review
1975-2006N
ational Cancer Institute
a Morton LM, Turner JJ, Cerhan JR, Linet MS, Treseler PA, Clarke CA, Jack A, Cozen W, Maynadié M, Spinelli JJ, Costantini AS,Rüdiger T, Scarpa A, Zheng T, Weisenburger DD. Proposed classification of lymphoid neoplasms for epidemiologic research fromthe Pathology Working Group of the International Lymphoma Epidemiology Consortium (InterLymph). Blood. 2007;110:695-708.
b SEER 17 areas (San Francisco, Connecticut, Detroit, Hawaii, Iowa, New Mexico, Seattle, Utah, Atlanta, San Jose-Monterey,Los Angeles, Alaska Native Registry, Rural Georgia, California excluding SF/SJM/LA, Kentucky, Louisiana and New Jersey).
c Annual Percent Change calculated over the time range of 2001-2006.d NOS = Not otherwise specified.- Statistic not shown. Rate based on less than 16 cases for the time interval.
Trend based on less than 10 cases for at least one year within the time interval.
All Ages Ages 0-19 Ages 20-64 Ages 65+
Site Rate Count APC Rate Count APC Rate Count APC Rate Count APC
Lymphoid Neoplasm 34.5 150,863 -0.6 5.7 7,440 0.5 23.3 64,281 -1.2* 152.1 79,142 -0.3
1 Hodgkin Lymphoma 2.8 12,542 0.6 1.2 1,513 0.9 3.2 8,868 -0.4 4.2 2,161 3.9
1(a) Classical Hodgkin lymphoma 2.7 12,044 0.2 1.1 1,443 0.7 3.1 8,510 -0.9 4.0 2,091 3.5
1(a)1. Lymphocyte-rich/mixed cellularity/ 0.5 2,184 -1.5 0.1 153 3.4 0.5 1,391 -3.9* 1.2 640 1.9
lymphocyte-depleted
1(a)1.1 Lymphocyte-rich 0.1 381 3.8 0.0 33 - 0.1 259 -0.9 0.2 89 -
1(a)1.2 Mixed cellularity 0.4 1,639 -3.7* 0.1 114 -1.1 0.4 1,039 -4.7 0.9 486 -2.5
1(a)1.3 Lymphocyte-depleted 0.0 164 9.5 - - - 0.0 93 -2.1 0.1 65 -
1(a)2. Nodular sclerosis 1.7 7,575 -1.2 0.9 1,130 -0.1 2.1 5,666 -1.7* 1.5 779 0.5
1(a)3. Classical Hodgkin lymphoma, NOSd 0.5 2,285 6.5* 0.1 160 3.4 0.5 1,453 5.8* 1.3 672 8.8*
1(b) Nodular lymphocyte predominant 0.1 498 10.8* 0.1 70 - 0.1 358 11.5* 0.1 70 -
Hodgkin Lymphoma
2 Non-Hodgkin lymphoma 30.6 133,085 -0.5 4.5 5,886 0.4 19.4 53,591 -1.1* 141.6 73,608 -0.2
3 Composite Hodgkin lymphoma and Non-Hodgkin 0.0 61 - 0.0 0 - 0.0 26 - 0.1 35 -
lymphoma
4 Lymphoid neoplasm, NOSd 1.2 5,175 -6.0* 0.0 41 - 0.7 1,796 -8.2* 6.3 3,338 -4.9
Table 9.19
All Lymphoid Neoplasms With Detailed Hodgkin Lymphoma Subtypesa
SEERb Incidence Rates and Annual Percent Changec by Age at Diagnosis
All Races, Both Sexes, 2001-2006

SEE
R C
ancer Statistics Review
1975-2006N
ational Cancer Institute
a Morton LM, Turner JJ, Cerhan JR, Linet MS, Treseler PA, Clarke CA, Jack A, Cozen W, Maynadié M, Spinelli JJ, Costantini AS,Rüdiger T, Scarpa A, Zheng T, Weisenburger DD. Proposed classification of lymphoid neoplasms for epidemiologic research fromthe Pathology Working Group of the International Lymphoma Epidemiology Consortium (InterLymph). Blood. 2007;110:695-708.
b SEER 17 areas (San Francisco, Connecticut, Detroit, Hawaii, Iowa, New Mexico, Seattle, Utah, Atlanta, San Jose-Monterey,Los Angeles, Alaska Native Registry, Rural Georgia, California excluding SF/SJM/LA, Kentucky, Louisiana and New Jersey).
c Annual Percent Change calculated over the time range of 2001-2006.d NOS = Not otherwise specified.- Statistic not shown. Rate based on less than 16 cases for the time interval.
Trend based on less than 10 cases for at least one year within the time interval.
All Ages Ages 0-19 Ages 20-64 Ages 65+
Site Rate Count APC Rate Count APC Rate Count APC Rate Count APC
Lymphoid Neoplasm 42.5 82,807 -0.8 6.5 4,378 1.2 27.8 37,600 -1.5* 192.2 40,829 -0.4
1 Hodgkin Lymphoma 3.1 6,833 0.5 1.2 826 2.0 3.6 4,894 -1.0 5.1 1,113 4.5
1(a) Classical Hodgkin lymphoma 2.9 6,482 -0.1 1.2 769 2.1 3.4 4,645 -1.7 4.9 1,068 3.6
1(a)1. Lymphocyte-rich/mixed cellularity/ 0.6 1,380 -2.8 0.2 109 2.1 0.7 945 -4.7* 1.5 326 -0.3
lymphocyte-depleted
1(a)1.1 Lymphocyte-rich 0.1 240 -0.4 0.0 26 - 0.1 171 -3.3 0.2 43 -
1(a)1.2 Mixed cellularity 0.5 1,034 -4.5 0.1 78 -1.1 0.5 707 -4.9 1.1 249 -4.8
1(a)1.3 Lymphocyte-depleted 0.1 106 8.3 - - - 0.0 67 -4.3 0.2 34 -
1(a)2. Nodular sclerosis 1.7 3,787 -1.0 0.8 564 1.8 2.0 2,820 -2.3 1.8 403 2.7
1(a)3. Classical Hodgkin lymphoma, NOSd 0.6 1,315 5.1* 0.1 96 2.5 0.6 880 3.8* 1.6 339 8.6
1(b) Nodular lymphocyte predominant 0.2 351 12.8* 0.1 57 - 0.2 249 11.4* 0.2 45 -
Hodgkin Lymphoma
2 Non-Hodgkin lymphoma 37.9 73,233 -0.7 5.3 3,524 1.1 23.4 31,594 -1.4* 179.3 38,115 -0.4
3 Composite Hodgkin lymphoma and Non-Hodgkin 0.0 26 - 0.0 0 - - - - - - -
lymphoma
4 Lymphoid neoplasm, NOSd 1.5 2,715 -5.9* 0.0 28 - 0.8 1,099 -7.1* 7.7 1,588 -5.2*
Table 9.20
All Lymphoid Neoplasms With Detailed Hodgkin Lymphoma Subtypesa
SEERb Incidence Rates and Annual Percent Changec by Age at Diagnosis
All Races, Males, 2001-2006

SEE
R C
ancer Statistics Review
1975-2006N
ational Cancer Institute
a Morton LM, Turner JJ, Cerhan JR, Linet MS, Treseler PA, Clarke CA, Jack A, Cozen W, Maynadié M, Spinelli JJ, Costantini AS,Rüdiger T, Scarpa A, Zheng T, Weisenburger DD. Proposed classification of lymphoid neoplasms for epidemiologic research fromthe Pathology Working Group of the International Lymphoma Epidemiology Consortium (InterLymph). Blood. 2007;110:695-708.
b SEER 17 areas (San Francisco, Connecticut, Detroit, Hawaii, Iowa, New Mexico, Seattle, Utah, Atlanta, San Jose-Monterey,Los Angeles, Alaska Native Registry, Rural Georgia, California excluding SF/SJM/LA, Kentucky, Louisiana and New Jersey).
c Annual Percent Change calculated over the time range of 2001-2006.d NOS = Not otherwise specified.- Statistic not shown. Rate based on less than 16 cases for the time interval.
Trend based on less than 10 cases for at least one year within the time interval.
All Ages Ages 0-19 Ages 20-64 Ages 65+
Site Rate Count APC Rate Count APC Rate Count APC Rate Count APC
Lymphoid Neoplasm 28.3 68,056 -0.5 4.8 3,062 -0.6 19.0 26,681 -0.8 124.7 38,313 -0.3
1 Hodgkin Lymphoma 2.5 5,709 0.8 1.1 687 -0.6 2.9 3,974 0.4 3.5 1,048 3.3
1(a) Classical Hodgkin lymphoma 2.4 5,562 0.6 1.1 674 -0.8 2.8 3,865 0.1 3.4 1,023 3.6
1(a)1. Lymphocyte-rich/mixed cellularity/ 0.3 804 0.5 0.1 44 - 0.3 446 -2.4 1.0 314 4.0
lymphocyte-depleted
1(a)1.1 Lymphocyte-rich 0.1 141 11.7 - - - 0.1 88 3.8 0.2 46 -
1(a)1.2 Mixed cellularity 0.3 605 -2.8 0.1 36 - 0.2 332 -4.4 0.8 237 -0.2
1(a)1.3 Lymphocyte-depleted 0.0 58 - - - - 0.0 26 - 0.1 31 -
1(a)2. Nodular sclerosis 1.6 3,788 -1.3 0.9 566 -2.0 2.1 2,846 -1.1 1.2 376 -1.9
1(a)3. Classical Hodgkin lymphoma, NOSd 0.4 970 8.8* 0.1 64 - 0.4 573 8.7* 1.1 333 9.9*
1(b) Nodular lymphocyte predominant 0.1 147 7.5 - - - 0.1 109 11.6 0.1 25 -
Hodgkin Lymphoma
2 Non-Hodgkin lymphoma 24.8 59,852 -0.4 3.7 2,362 -0.5 15.6 21,997 -0.7 115.7 35,493 -0.2
3 Composite Hodgkin lymphoma and Non-Hodgkin 0.0 35 - 0.0 0 - - - - 0.1 22 -
lymphoma
4 Lymphoid neoplasm, NOSd 1.0 2,460 -6.3* - - - 0.5 697 -9.9* 5.4 1,750 -4.7
Table 9.21
All Lymphoid Neoplasms With Detailed Hodgkin Lymphoma Subtypesa
SEERb Incidence Rates and Annual Percent Changec by Age at Diagnosis
All Races, Females, 2001-2006

SEE
R C
ancer Statistics Review
1975-2006N
ational Cancer Institute
a Morton LM, Turner JJ, Cerhan JR, Linet MS, Treseler PA, Clarke CA, Jack A, Cozen W, Maynadié M, Spinelli JJ, Costantini AS,Rüdiger T, Scarpa A, Zheng T, Weisenburger DD. Proposed classification of lymphoid neoplasms for epidemiologic research fromthe Pathology Working Group of the International Lymphoma Epidemiology Consortium (InterLymph). Blood. 2007;110:695-708.
b SEER 17 areas (San Francisco, Connecticut, Detroit, Hawaii, Iowa, New Mexico, Seattle, Utah, Atlanta, San Jose-Monterey,Los Angeles, Alaska Native Registry, Rural Georgia, California excluding SF/SJM/LA, Kentucky, Louisiana and New Jersey).
c Survival rates are relative rates expressed as percents.d NOS = Not otherwise specified.- Statistic not displayed due to less than 25 cases.
All Ages Ages 0-19 Ages 20-64 Ages 65+
Site Count Rate ( 95% C.I. ) Rate ( 95% C.I. ) Rate ( 95% C.I. ) Rate ( 95% C.I. )
Lymphoid Neoplasm 104,990 75.7 ( 75.4 , 76.0) 91.4 ( 90.6 ,92.1 ) 81.7 ( 81.4 ,82.1 ) 67.0 ( 66.5 ,67.5)
1 Hodgkin Lymphoma 9,619 89.3 ( 88.6 , 90.0) 97.4 ( 96.2 ,98.2 ) 93.1 ( 92.5 ,93.7 ) 59.2 ( 56.1 ,62.1)
1(a) Classical Hodgkin lymphoma 9,264 89.0 ( 88.2 , 89.7) 97.2 ( 96.1 ,98.1 ) 92.9 ( 92.2 ,93.5 ) 58.5 ( 55.4 ,61.4)
1(a)1. Lymphocyte-rich/mixed cellularity/ 1,652 83.5 ( 81.5 , 85.4) 95.6 ( 89.6 ,98.2 ) 89.5 ( 87.4 ,91.3 ) 62.6 ( 57.1 ,67.6)
lymphocyte-depleted
1(a)1.1 Lymphocyte-rich 293 93.3 ( 89.0 , 96.0) 100.0 (100.0 ,100.0 ) 94.7 ( 90.1 ,97.2 ) 84.1 ( 66.8 ,92.8)
1(a)1.2 Mixed cellularity 1,243 83.4 ( 80.9 , 85.5) 94.2 ( 86.4 ,97.6 ) 89.9 ( 87.5 ,91.9 ) 61.5 ( 55.3 ,67.1)
1(a)1.3 Lymphocyte-depleted 116 59.5 ( 49.1 , 68.4) - ( - , - ) 69.8 ( 57.5 ,79.1 ) 33.1 ( 16.6 ,50.7)
1(a)2. Nodular sclerosis 6,036 92.9 ( 92.2 , 93.6) 97.4 ( 96.1 ,98.3 ) 95.1 ( 94.4 ,95.8 ) 61.8 ( 56.8 ,66.5)
1(a)3. Classical Hodgkin lymphoma, NOSd 1,576 79.1 ( 76.8 , 81.2) 97.4 ( 91.8 ,99.2 ) 86.7 ( 84.4 ,88.7 ) 48.5 ( 42.8 ,54.0)
1(b) Nodular lymphocyte predominant 355 97.6 ( 94.6 , 98.9) 100.0 (100.0 ,100.0 ) 98.5 ( 95.4 ,99.5 ) 84.0 ( 62.3 ,93.8)
Hodgkin Lymphoma
2 Non-Hodgkin lymphoma 91,989 74.8 ( 74.5 , 75.2) 89.9 ( 89.0 ,90.7 ) 80.3 ( 79.9 ,80.7 ) 67.9 ( 67.4 ,68.4)
3 Composite Hodgkin lymphoma and Non-Hodgkin 39 79.4 ( 61.5 , 89.7) - ( - , - ) - ( - , - ) - ( - , - )
lymphoma
4 Lymphoid neoplasm, NOSd 3,343 56.9 ( 55.0 , 58.7) 81.5 ( 63.2 ,91.3 ) 65.5 ( 62.8 ,68.1 ) 50.0 ( 47.4 ,52.5)
Table 9.22
All Lymphoid Neoplasms With Detailed Hodgkin Lymphoma Subtypes
SEERb 2-Year Relativec Survival Rates by Age at Diagnosis
All Races, Both Sexes, 2001-2005

SEE
R C
ancer Statistics Review
1975-2006N
ational Cancer Institute
a Morton LM, Turner JJ, Cerhan JR, Linet MS, Treseler PA, Clarke CA, Jack A, Cozen W, Maynadié M, Spinelli JJ, Costantini AS,Rüdiger T, Scarpa A, Zheng T, Weisenburger DD. Proposed classification of lymphoid neoplasms for epidemiologic research fromthe Pathology Working Group of the International Lymphoma Epidemiology Consortium (InterLymph). Blood. 2007;110:695-708.
b SEER 17 areas (San Francisco, Connecticut, Detroit, Hawaii, Iowa, New Mexico, Seattle, Utah, Atlanta, San Jose-Monterey,Los Angeles, Alaska Native Registry, Rural Georgia, California excluding SF/SJM/LA, Kentucky, Louisiana and New Jersey).
c Survival rates are relative rates expressed as percents.d NOS = Not otherwise specified.- Statistic not displayed due to less than 25 cases.
All Ages Ages 0-19 Ages 20-64 Ages 65+
Site Count Rate ( 95% C.I. ) Rate ( 95% C.I. ) Rate ( 95% C.I. ) Rate ( 95% C.I. )
Lymphoid Neoplasm 57,402 75.3 ( 74.9 , 75.7) 90.6 ( 89.5 ,91.5 ) 79.8 ( 79.3 ,80.2 ) 67.0 ( 66.3 ,67.7)
1 Hodgkin Lymphoma 5,196 88.3 ( 87.3 , 89.2) 98.0 ( 96.5 ,98.9 ) 91.5 ( 90.6 ,92.4 ) 56.6 ( 52.2 ,60.7)
1(a) Classical Hodgkin lymphoma 4,948 87.8 ( 86.8 , 88.8) 97.9 ( 96.2 ,98.8 ) 91.2 ( 90.2 ,92.1 ) 55.7 ( 51.3 ,59.9)
1(a)1. Lymphocyte-rich/mixed cellularity/ 1,046 83.1 ( 80.4 , 85.5) 96.3 ( 88.5 ,98.8 ) 88.7 ( 86.0 ,90.9 ) 54.5 ( 46.6 ,61.8)
lymphocyte-depleted
1(a)1.1 Lymphocyte-rich 187 93.1 ( 87.6 , 96.2) - ( - , - ) 94.1 ( 88.1 ,97.1 ) - ( - , - )
1(a)1.2 Mixed cellularity 788 83.1 ( 80.0 , 85.8) 95.0 ( 84.8 ,98.4 ) 89.3 ( 86.2 ,91.8 ) 53.8 ( 45.0 ,61.8)
1(a)1.3 Lymphocyte-depleted 71 56.3 ( 43.1 , 67.5) - ( - , - ) 66.4 ( 51.2 ,77.9 ) - ( - , - )
1(a)2. Nodular sclerosis 2,993 92.5 ( 91.3 , 93.4) 98.3 ( 96.4 ,99.2 ) 94.2 ( 93.1 ,95.2 ) 63.0 ( 55.6 ,69.5)
1(a)3. Classical Hodgkin lymphoma, NOSd 909 77.5 ( 74.3 , 80.3) 97.0 ( 87.9 ,99.3 ) 83.3 ( 80.0 ,86.1 ) 46.8 ( 38.7 ,54.4)
1(b) Nodular lymphocyte predominant 248 97.6 ( 93.8 , 99.1) 100.0 (100.0 ,100.0 ) 98.3 ( 94.0 ,99.5 ) - ( - , - )
Hodgkin Lymphoma
2 Non-Hodgkin lymphoma 50,463 74.5 ( 74.1 , 74.9) 89.0 ( 87.7 ,90.1 ) 78.5 ( 77.9 ,79.0 ) 67.9 ( 67.2 ,68.6)
3 Composite Hodgkin lymphoma and Non-Hodgkin - - ( - , - ) - ( - , - ) - ( - , - ) - ( - , - )
lymphoma
4 Lymphoid neoplasm, NOSd 1,729 56.2 ( 53.6 , 58.8) - ( - , - ) 60.9 ( 57.3 ,64.3 ) 50.9 ( 47.1 ,54.7)
Table 9.23
All Lymphoid Neoplasms With Detailed Hodgkin Lymphoma Subtypes
SEERb 2-Year Relativec Survival Rates by Age at Diagnosis
All Races, Males, 2001-2005

SEE
R C
ancer Statistics Review
1975-2006N
ational Cancer Institute
a Morton LM, Turner JJ, Cerhan JR, Linet MS, Treseler PA, Clarke CA, Jack A, Cozen W, Maynadié M, Spinelli JJ, Costantini AS,Rüdiger T, Scarpa A, Zheng T, Weisenburger DD. Proposed classification of lymphoid neoplasms for epidemiologic research fromthe Pathology Working Group of the International Lymphoma Epidemiology Consortium (InterLymph). Blood. 2007;110:695-708.
b SEER 17 areas (San Francisco, Connecticut, Detroit, Hawaii, Iowa, New Mexico, Seattle, Utah, Atlanta, San Jose-Monterey,Los Angeles, Alaska Native Registry, Rural Georgia, California excluding SF/SJM/LA, Kentucky, Louisiana and New Jersey).
c Survival rates are relative rates expressed as percents.d NOS = Not otherwise specified.- Statistic not displayed due to less than 25 cases.
All Ages Ages 0-19 Ages 20-64 Ages 65+
Site Count Rate ( 95% C.I. ) Rate ( 95% C.I. ) Rate ( 95% C.I. ) Rate ( 95% C.I. )
Lymphoid Neoplasm 47,588 76.2 ( 75.7 , 76.6) 92.5 ( 91.4 ,93.5 ) 84.6 ( 84.1 ,85.2 ) 67.0 ( 66.3 ,67.7)
1 Hodgkin Lymphoma 4,423 90.5 ( 89.5 , 91.4) 96.6 ( 94.7 ,97.9 ) 95.0 ( 94.2 ,95.8 ) 61.6 ( 57.3 ,65.6)
1(a) Classical Hodgkin lymphoma 4,316 90.3 ( 89.3 , 91.2) 96.6 ( 94.6 ,97.8 ) 94.9 ( 94.0 ,95.7 ) 61.0 ( 56.6 ,65.1)
1(a)1. Lymphocyte-rich/mixed cellularity/ 606 84.3 ( 80.7 , 87.3) 94.0 ( 77.6 ,98.5 ) 91.2 ( 87.5 ,93.9 ) 69.6 ( 62.1 ,75.9)
lymphocyte-depleted
1(a)1.1 Lymphocyte-rich 106 93.6 ( 84.5 , 97.4) - ( - , - ) 95.8 ( 85.4 ,98.8 ) 86.4 ( 61.9 ,95.7)
1(a)1.2 Mixed cellularity 455 83.8 ( 79.7 , 87.2) 92.7 ( 73.4 ,98.2 ) 91.2 ( 86.8 ,94.2 ) 68.8 ( 60.1 ,76.0)
1(a)1.3 Lymphocyte-depleted 45 64.8 ( 47.4 , 77.7) - ( - , - ) - ( - , - ) - ( - , - )
1(a)2. Nodular sclerosis 3,043 93.4 ( 92.3 , 94.3) 96.6 ( 94.4 ,98.0 ) 96.1 ( 95.1 ,96.8 ) 60.7 ( 53.6 ,67.1)
1(a)3. Classical Hodgkin lymphoma, NOSd 667 81.2 ( 77.7 , 84.2) 98.1 ( 87.3 ,99.7 ) 91.7 ( 88.5 ,94.1 ) 50.3 ( 42.2 ,57.9)
1(b) Nodular lymphocyte predominant 107 96.6 ( 90.3 , 98.8) - ( - , - ) 98.9 ( 90.9 ,99.9 ) - ( - , - )
Hodgkin Lymphoma
2 Non-Hodgkin lymphoma 41,526 75.2 ( 74.8 , 75.7) 91.3 ( 89.9 ,92.5 ) 82.9 ( 82.3 ,83.5 ) 67.9 ( 67.2 ,68.7)
3 Composite Hodgkin lymphoma and Non-Hodgkin 25 81.9 ( 58.5 , 92.9) - ( - , - ) - ( - , - ) - ( - , - )
lymphoma
4 Lymphoid neoplasm, NOSd 1,614 57.6 ( 54.8 , 60.3) - ( - , - ) 72.8 ( 68.6 ,76.6 ) 49.2 ( 45.7 ,52.6)
Table 9.24
All Lymphoid Neoplasms With Detailed Hodgkin Lymphoma Subtypes
SEERb 2-Year Relativec Survival Rates by Age at Diagnosis
All Races, Females, 2001-2005

0
1
2
3
4
5
6
1975 1985 1995 20060
1
2
3
4
5
6
1975 1985 1995 20060
1
2
3
4
5
6
1975 1985 1995 20060
1
2
3
4
5
6
1975 1985 1995 2006
Delay-AdjustedIncidenceDelay-AdjustedIncidence
ObservedIncidenceObservedIncidenceMortalityMortality
SEER Observed Incidence, SEER Delay Adjusted Incidence and US Death RatesHodgkin Lymphoma, by Race and Sex
a
Figure 9.1
Source: SEER 9 areas and US Mortality Files (National Center for Health Statistics, CDC).Rates are age-adjusted to the 2000 US Std Population (19 age groups - Census P25-1103).Regression lines and APCs are calculated using the Joinpoint Regression Program Version 3.3.1, April 2008, National Cancer Institute.The APC is the Annual Percent Change for the regression line segments. The APC shown on the graph is for the most recent trend.The APC is significantly different from zero (p < 0.05).
a
*
White Male Black Male White Female Black FemaleRate per 100,000 Rate per 100,000 Rate per 100,000 Rate per 100,000
Year of Diagnosis/Death Year of Diagnosis/Death Year of Diagnosis/Death Year of Diagnosis/Death
SEER Incidence APCsDelay Adj, 1975-2006 = -0.5*Observed, 1975-2006 = -0.6*
US Mortality APC1997-2006 = -2.0*
SEER Incidence APCsDelay Adj, 1975-2006 = 0.3Observed, 1975-2006 = 0.2
US Mortality APC1975-2006 = -3.2*
SEER Incidence APCsDelay Adj, 1975-2006 = 0.4*Observed, 1975-2006 = 0.3*
US Mortality APC1985-2006 = -2.5*
SEER Incidence APCsDelay Adj, 1975-2006 = 2.5*Observed, 1975-2006 = 2.4*
US Mortality APC1975-2006 = -2.5*
SEE
R C
ancer Statistics Review
1975-2006N
ational Cancer Institute
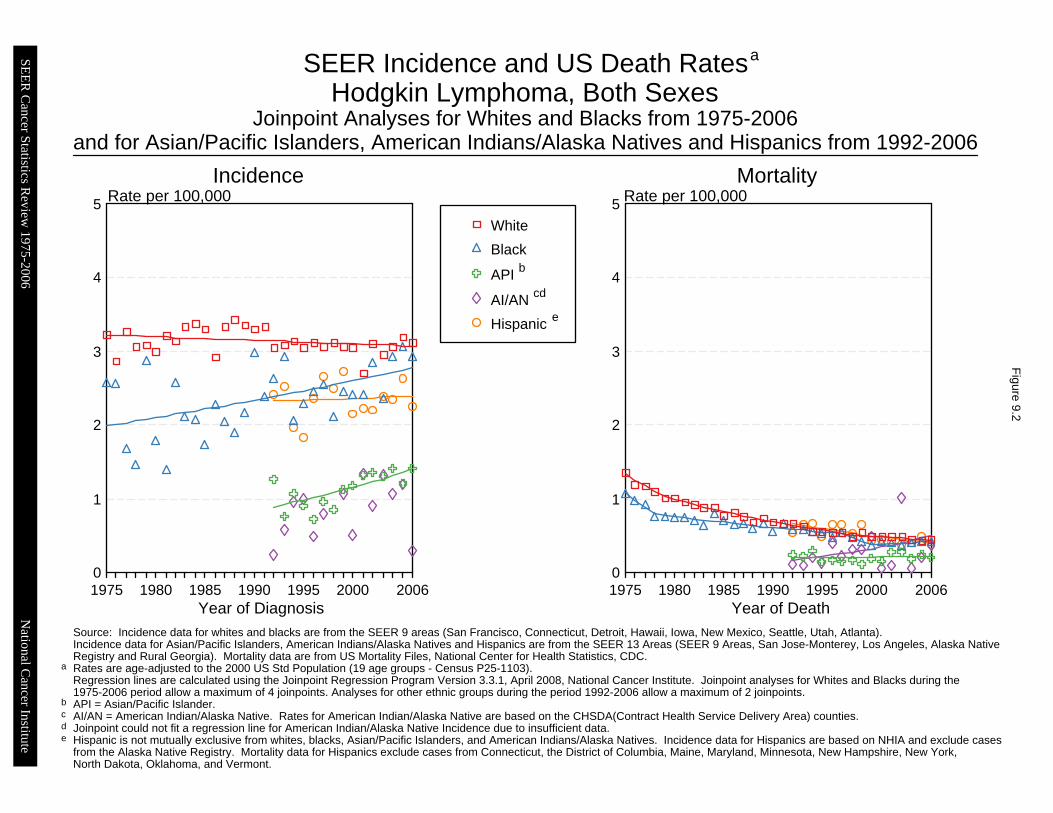
Joinpoint Analyses for Whites and Blacks from 1975-2006and for Asian/Pacific Islanders, American Indians/Alaska Natives and Hispanics from 1992-2006
0
1
2
3
4
5
1975 1980 1985 1990 1995 2000 20060
1
2
3
4
5
1975 1980 1985 1990 1995 2000 2006
White
Black
API
AI/AN
Hispanic
SEER Incidence and US Death RatesHodgkin Lymphoma, Both Sexes
Figure 9.2
Source: Incidence data for whites and blacks are from the SEER 9 areas (San Francisco, Connecticut, Detroit, Hawaii, Iowa, New Mexico, Seattle, Utah, Atlanta). Incidence data for Asian/Pacific Islanders, American Indians/Alaska Natives and Hispanics are from the SEER 13 Areas (SEER 9 Areas, San Jose-Monterey, Los Angeles, Alaska NativeRegistry and Rural Georgia). Mortality data are from US Mortality Files, National Center for Health Statistics, CDC.Rates are age-adjusted to the 2000 US Std Population (19 age groups - Census P25-1103). Regression lines are calculated using the Joinpoint Regression Program Version 3.3.1, April 2008, National Cancer Institute. Joinpoint analyses for Whites and Blacks during the1975-2006 period allow a maximum of 4 joinpoints. Analyses for other ethnic groups during the period 1992-2006 allow a maximum of 2 joinpoints.API = Asian/Pacific Islander.AI/AN = American Indian/Alaska Native. Rates for American Indian/Alaska Native are based on the CHSDA(Contract Health Service Delivery Area) counties.Joinpoint could not fit a regression line for American Indian/Alaska Native Incidence due to insufficient data.Hispanic is not mutually exclusive from whites, blacks, Asian/Pacific Islanders, and American Indians/Alaska Natives. Incidence data for Hispanics are based on NHIA and exclude casesfrom the Alaska Native Registry. Mortality data for Hispanics exclude cases from Connecticut, the District of Columbia, Maine, Maryland, Minnesota, New Hampshire, New York,North Dakota, Oklahoma, and Vermont.
Incidence MortalityRate per 100,000 Rate per 100,000
Year of Diagnosis Year of Death
a
e
a
b
cd
cb
e
d
SEE
R C
ancer Statistics Review
1975-2006N
ational Cancer Institute

0
1
2
3
4
5
6
1975 1985 1995 20060
1
2
3
4
5
6
1975 1985 1995 20060
1
2
3
4
5
6
1975 1985 1995 2006
SEER 9 Delay-Adjusted IncidenceSEER 9 Delay-Adjusted Incidence SEER 9 Observed IncidenceSEER 9 Observed Incidence SEER 13 Delay-Adjusted IncidenceSEER 13 Delay-Adjusted Incidence SEER 13 Observed IncidenceSEER 13 Observed Incidence
SEER Observed Incidence and SEER Delay Adjusted Incidence RatesSEER 9 Areas Compared to SEER 13 Areas
Hodgkin Lymphoma, Male, by Race
aF
igure 9.3
Source: SEER 9 areas and SEER 13 areas.Rates are age-adjusted to the 2000 US Std Population (19 age groups - Census P25-1103).Regression lines and APCs are calculated using the Joinpoint Regression Program Version 3.3.1, April 2008, National Cancer Institute.The APC is the Annual Percent Change for the regression line segments. The APC shown on the graph is for the most recent trend.The APC is significantly different from zero (p < 0.05).
a
*
All Races White BlackRate per 100,000 Rate per 100,000 Rate per 100,000
Year of Diagnosis Year of Diagnosis Year of Diagnosis
SEER 9 APCsDelay Adj, 1975-2006 = -0.6*Observed, 1975-2006 = -0.6*
SEER 13 APCsDelay Adj, 1992-2006 = 0.1Observed, 1992-2006 = 0.1
SEER 9 APCsDelay Adj, 1975-2006 = -0.5*Observed, 1975-2006 = -0.6*
SEER 13 APCsDelay Adj, 1992-2006 = 0.0Observed, 1992-2006 = -0.1
SEER 9 APCsDelay Adj, 1975-2006 = 0.3Observed, 1975-2006 = 0.2
SEER 13 APCsDelay Adj, 1992-2006 = 1.3Observed, 1992-2006 = 1.2
SEE
R C
ancer Statistics Review
1975-2006N
ational Cancer Institute

0
1
2
3
4
5
6
1975 1985 1995 20060
1
2
3
4
5
6
1975 1985 1995 20060
1
2
3
4
5
6
1975 1985 1995 2006
SEER 9 Delay-Adjusted IncidenceSEER 9 Delay-Adjusted Incidence SEER 9 Observed IncidenceSEER 9 Observed Incidence SEER 13 Delay-Adjusted IncidenceSEER 13 Delay-Adjusted Incidence SEER 13 Observed IncidenceSEER 13 Observed Incidence
SEER Observed Incidence and SEER Delay Adjusted Incidence RatesSEER 9 Areas Compared to SEER 13 Areas
Hodgkin Lymphoma, Female, by Race
aF
igure 9.4
Source: SEER 9 areas and SEER 13 areas.Rates are age-adjusted to the 2000 US Std Population (19 age groups - Census P25-1103).Regression lines and APCs are calculated using the Joinpoint Regression Program Version 3.3.1, April 2008, National Cancer Institute.The APC is the Annual Percent Change for the regression line segments. The APC shown on the graph is for the most recent trend.The APC is significantly different from zero (p < 0.05).
a
*
All Races White BlackRate per 100,000 Rate per 100,000 Rate per 100,000
Year of Diagnosis Year of Diagnosis Year of Diagnosis
SEER 9 APCsDelay Adj, 1975-2006 = 0.4*Observed, 1975-2006 = 0.4*
SEER 13 APCsDelay Adj, 1992-2006 = 0.3Observed, 1992-2006 = 0.2
SEER 9 APCsDelay Adj, 1975-2006 = 0.4*Observed, 1975-2006 = 0.3*
SEER 13 APCsDelay Adj, 1992-2006 = 0.3Observed, 1992-2006 = 0.2
SEER 9 APCsDelay Adj, 1975-2006 = 2.5*Observed, 1975-2006 = 2.4*
SEER 13 APCsDelay Adj, 1992-2006 = 0.8Observed, 1992-2006 = 0.6
SEE
R C
ancer Statistics Review
1975-2006N
ational Cancer Institute

Figure 9.5
Hodgkin Lymphoma5-Year SEER Conditional Relative Survival Rates and
95% Confidence Intervals
Source: SEER 17 areas (San Francisco, Connecticut, Detroit, Hawaii, Iowa, New Mexico, Seattle, Utah, Atlanta, SanJose-Monterey, Los Angeles, Alaska Native Registry, Rural Georgia, California excluding SF/SJM/LA, Kentucky, Louisiana, andNew Jersey). California excluding SF/SJM/LA, Kentucky, Louisiana, and New Jersey contribute cases for diagnosis years2000-2006. The remaining 13 SEER Areas contribute cases for the entire period 1998-2005.Percent surviving is not shown if based on less than 25 cases.Confidence intervals are not shown if length of the confidence interval is greater than 5 times the standard error.
0
20
40
60
80
100Percent Surviving Next 5 Years
Stage at Diagnosis
Probabilty of surviving the next 5 years given the cohort
has already survived 0, 1, or 3 years1998-2005 by stage at diagnosis
Survival Time Since Diagnosis
Localized Regional Distant Unstaged
0 year (at diagnosis) 1 year 3 years
SEER Cancer Statistics Review 1975-2006 National Cancer Institute