Experience With Aeroponics for Pre Basic Seed Potato Production in Sichuan China by Peter VanderZaag
Upload
dalbeer-singhCategory
view
1.434download
8
Agronomic strategies for enhancing seed potato production
Harmanjeet Singh
L-2013-A-02-M
Introduction
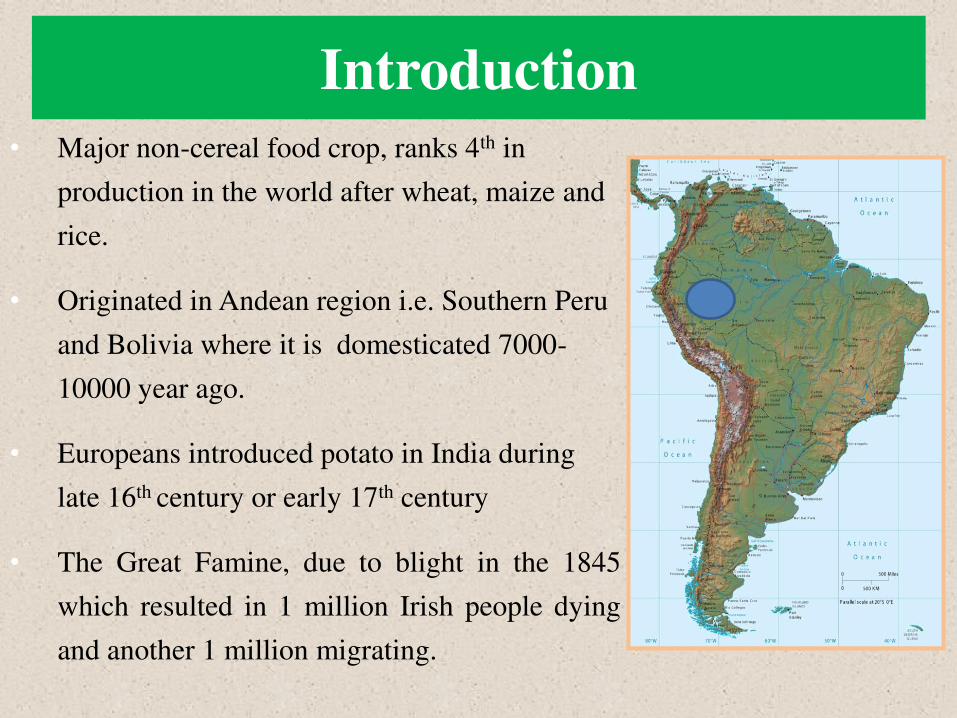
• Major non-cereal food crop, ranks 4th in
production in the world after wheat, maize and
rice.
• Originated in Andean region i.e. Southern Peru
and Bolivia where it is domesticated 7000-
10000 year ago.
• Europeans introduced potato in India during
late 16th century or early 17th century
• The Great Famine, due to blight in the 1845
which resulted in 1 million Irish people dying
and another 1 million migrating.
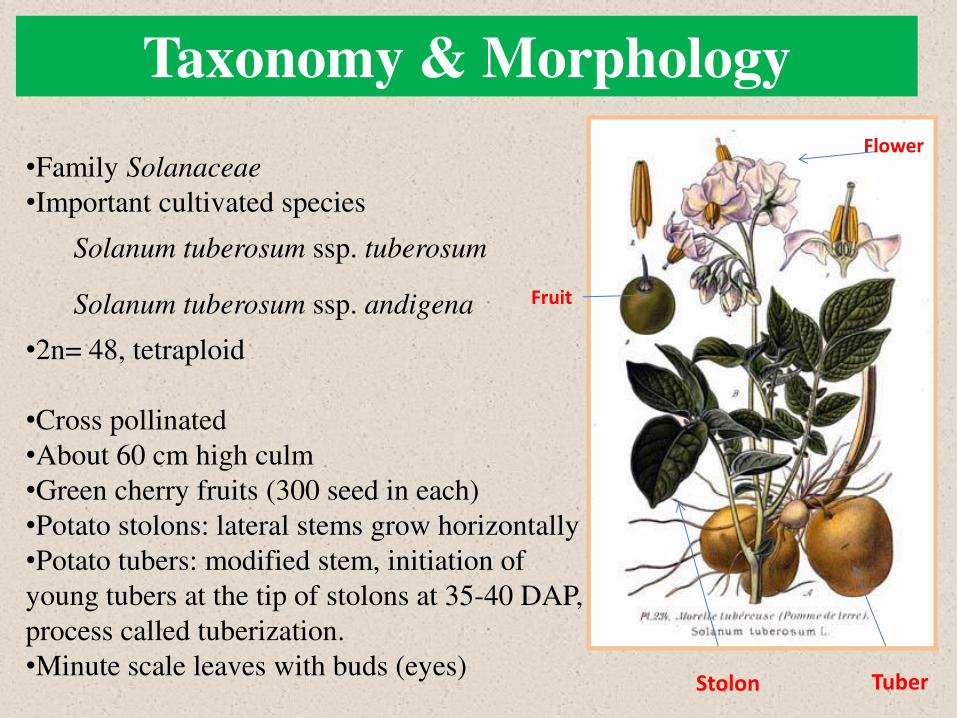
•Family Solanaceae
•Important cultivated species
Solanum tuberosum ssp. tuberosum
Solanum tuberosum ssp. andigena
•2n= 48, tetraploid
•Cross pollinated
•About 60 cm high culm
•Green cherry fruits (300 seed in each)
•Potato stolons: lateral stems grow horizontally
•Potato tubers: modified stem, initiation of
young tubers at the tip of stolons at 35-40 DAP,
process called tuberization.
•Minute scale leaves with buds (eyes) Stolon Tuber
Taxonomy & Morphology
Fruit
Flower
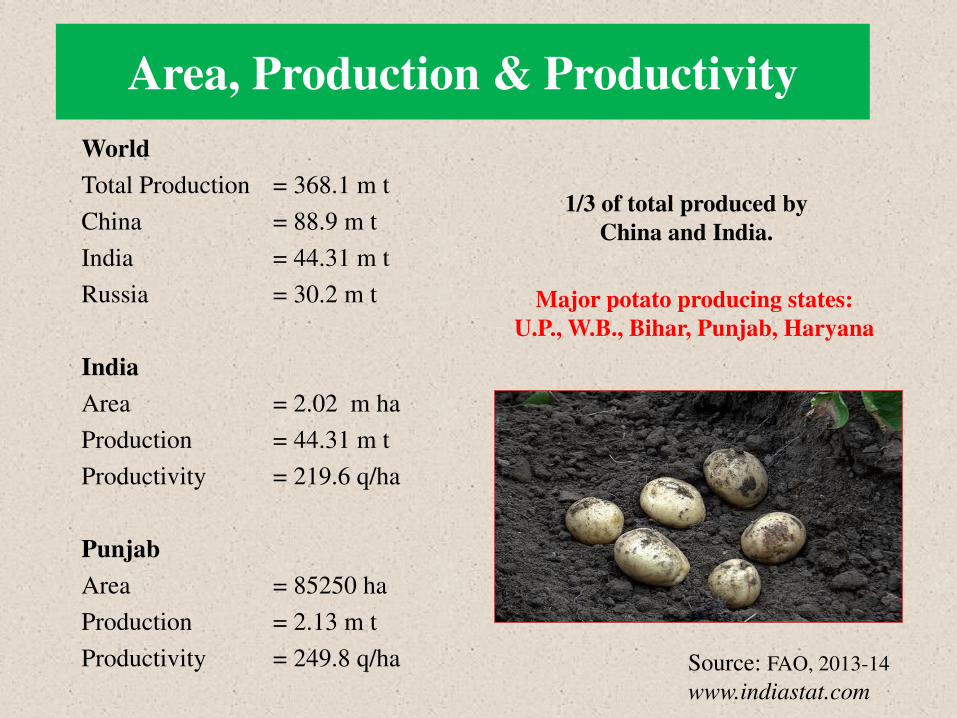
Area, Production & Productivity
World
Total Production = 368.1 m t
China = 88.9 m t
India = 44.31 m t
Russia = 30.2 m t
India
Area = 2.02 m ha
Production = 44.31 m t
Productivity = 219.6 q/ha
Punjab
Area = 85250 ha
Production = 2.13 m t
Productivity = 249.8 q/ha Source: FAO, 2013-14
www.indiastat.com
1/3 of total produced by
China and India.
Major potato producing states:
U.P., W.B., Bihar, Punjab, Haryana
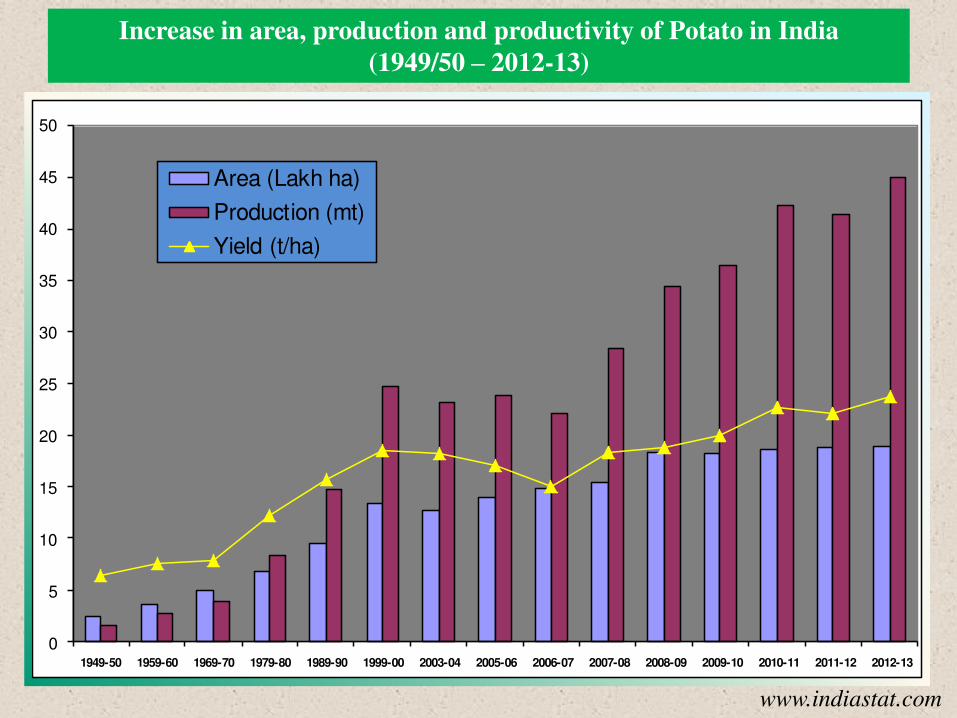
0
5
10
15
20
25
30
35
40
45
50
1949-50 1959-60 1969-70 1979-80 1989-90 1999-00 2003-04 2005-06 2006-07 2007-08 2008-09 2009-10 2010-11 2011-12 2012-13
Area (Lakh ha)
Production (mt)
Yield (t/ha)
Increase in area, production and productivity of Potato in India
(1949/50 – 2012-13)
www.indiastat.com
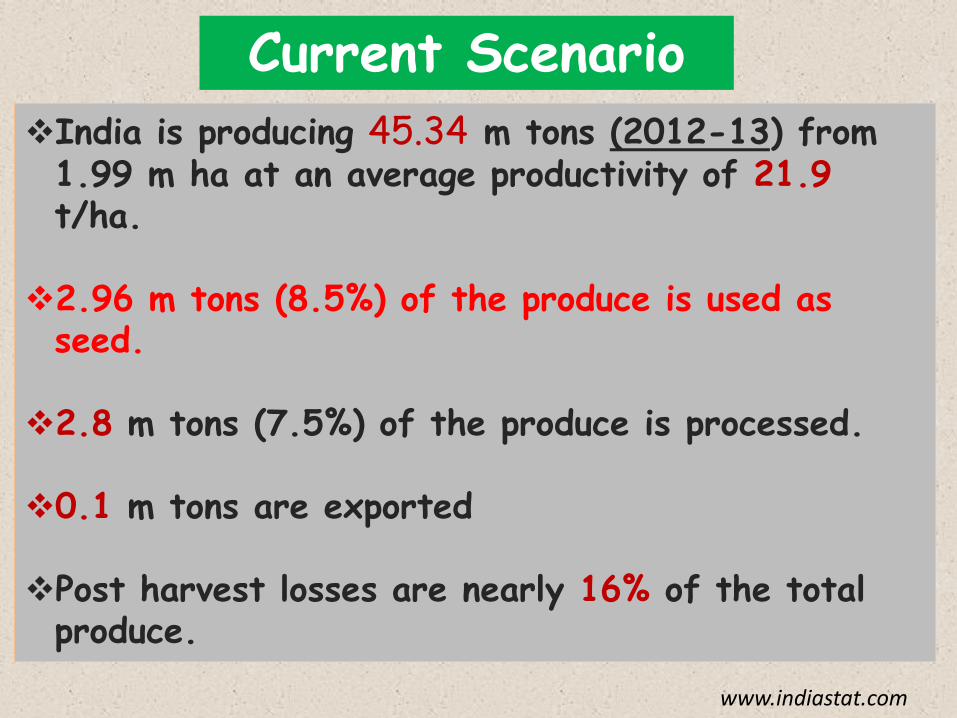
Current Scenario
India is producing 45.34 m tons (2012-13) from 1.99 m ha at an average productivity of 21.9 t/ha.
2.96 m tons (8.5%) of the produce is used as seed.
2.8 m tons (7.5%) of the produce is processed.
0.1 m tons are exported
Post harvest losses are nearly 16% of the total produce.
www.indiastat.com
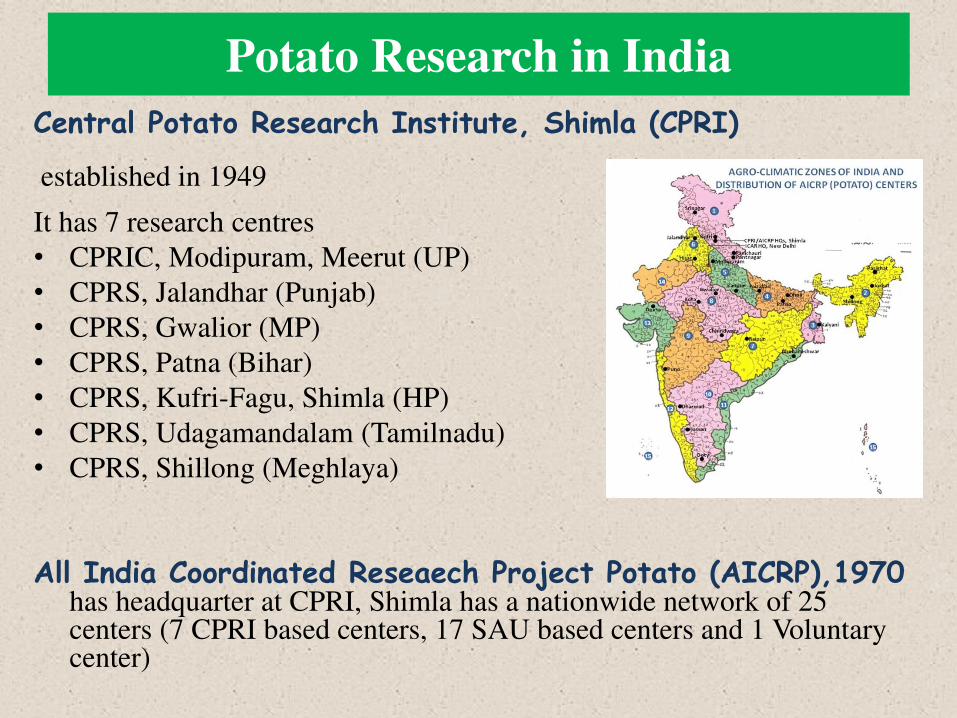
Potato Research in India
Central Potato Research Institute, Shimla (CPRI)
established in 1949
It has 7 research centres
• CPRIC, Modipuram, Meerut (UP)
• CPRS, Jalandhar (Punjab)
• CPRS, Gwalior (MP)
• CPRS, Patna (Bihar)
• CPRS, Kufri-Fagu, Shimla (HP)
• CPRS, Udagamandalam (Tamilnadu)
• CPRS, Shillong (Meghlaya)
All India Coordinated Reseaech Project Potato (AICRP),1970 has headquarter at CPRI, Shimla has a nationwide network of 25 centers (7 CPRI based centers, 17 SAU based centers and 1 Voluntary center)
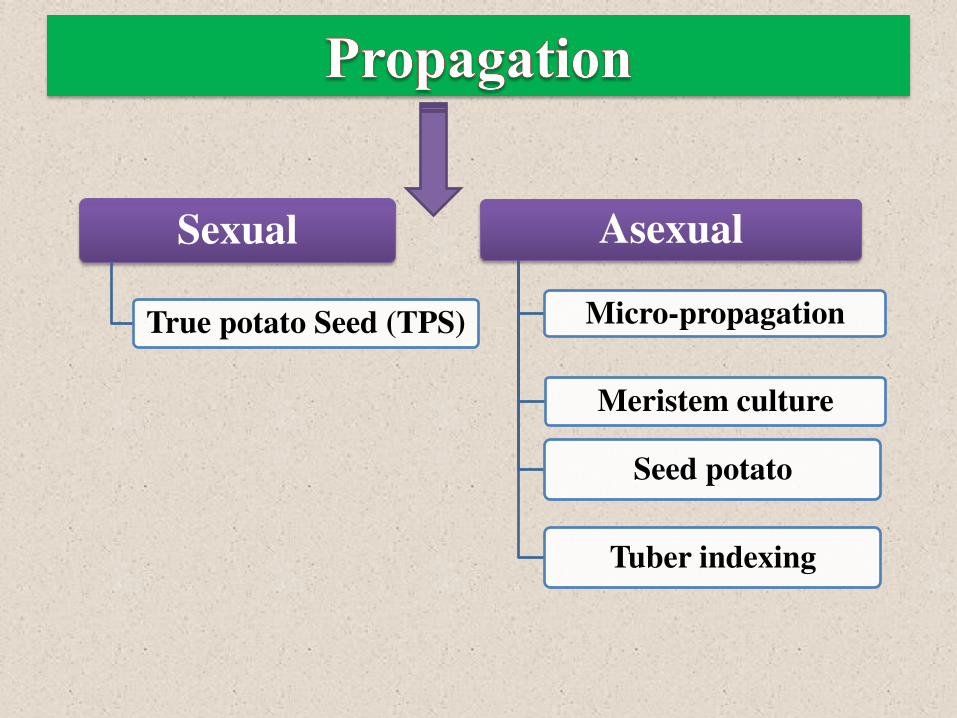
Sexual
True potato Seed (TPS)
Asexual
Micro-propagation
Meristem culture
Seed potato
Tuber indexing
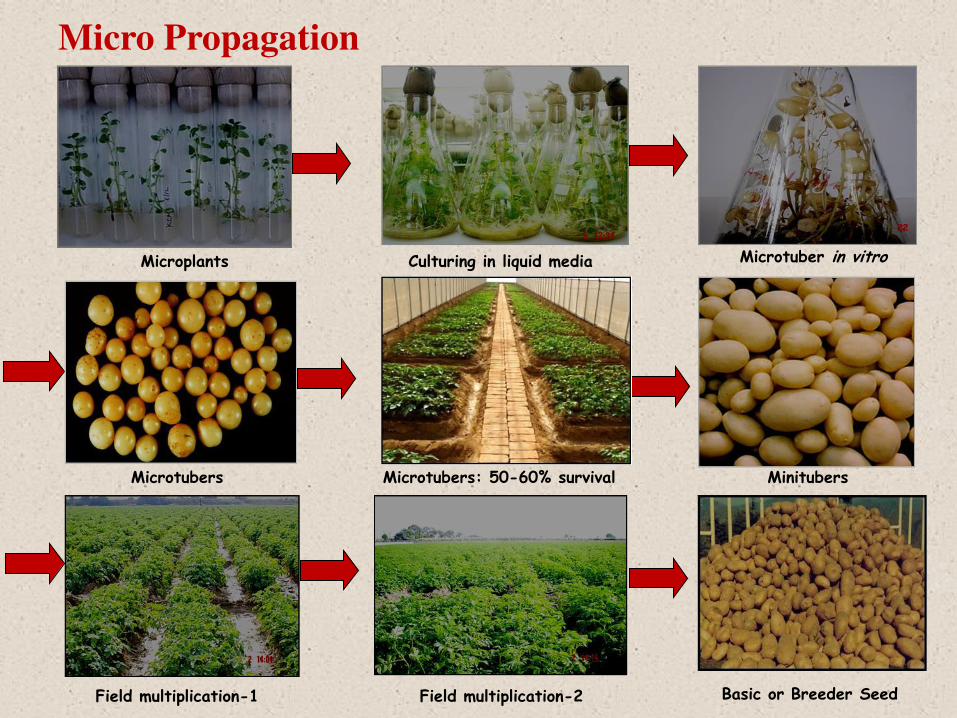
Microtubers: 50-60% survival
Field multiplication-1 Field multiplication-2 Basic or Breeder Seed
Microplants
Microtubers Minitubers
Culturing in liquid media Microtuber in vitro
Micro Propagation
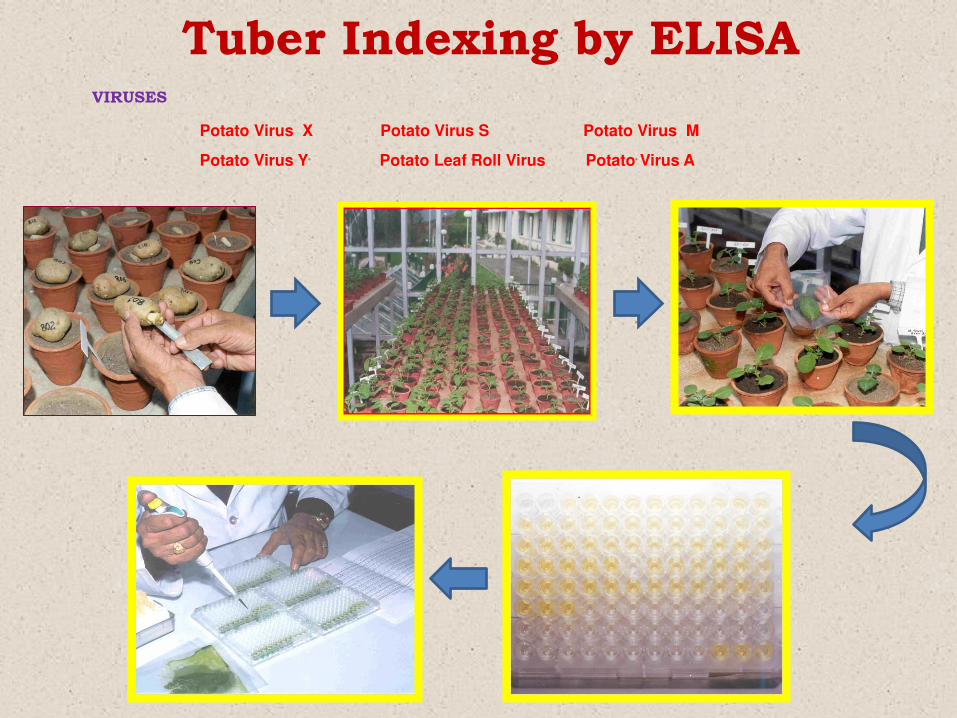
VIRUSES
Potato Virus X Potato Virus S Potato Virus M
Potato Virus Y Potato Leaf Roll Virus Potato Virus A
Tuber Indexing by ELISA
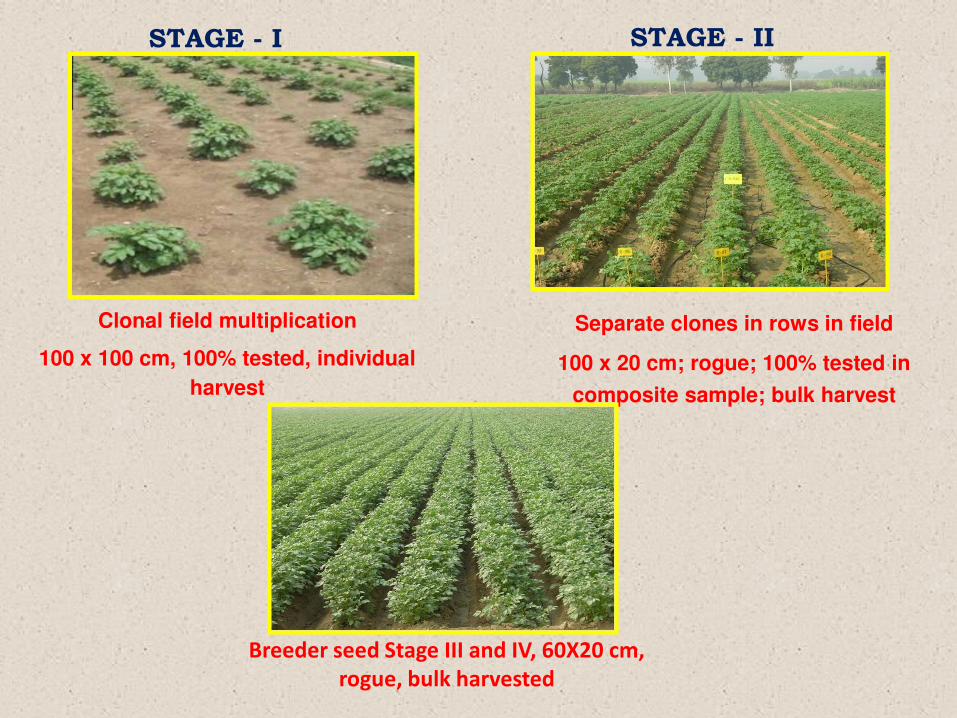
Clonal field multiplication
100 x 100 cm, 100% tested, individual
harvest
STAGE - I STAGE - II
Separate clones in rows in field
100 x 20 cm; rogue; 100% tested in
composite sample; bulk harvest
Breeder seed Stage III and IV, 60X20 cm,
rogue, bulk harvested
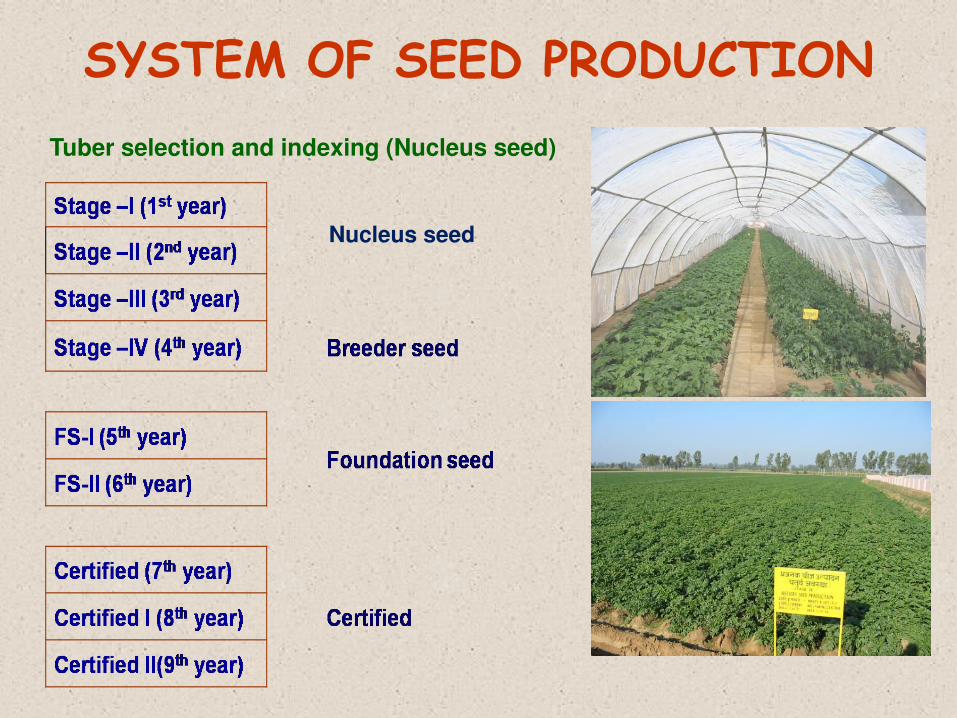
SYSTEM OF SEED PRODUCTION
Tuber selection and indexing (Nucleus seed)
Nucleus seed
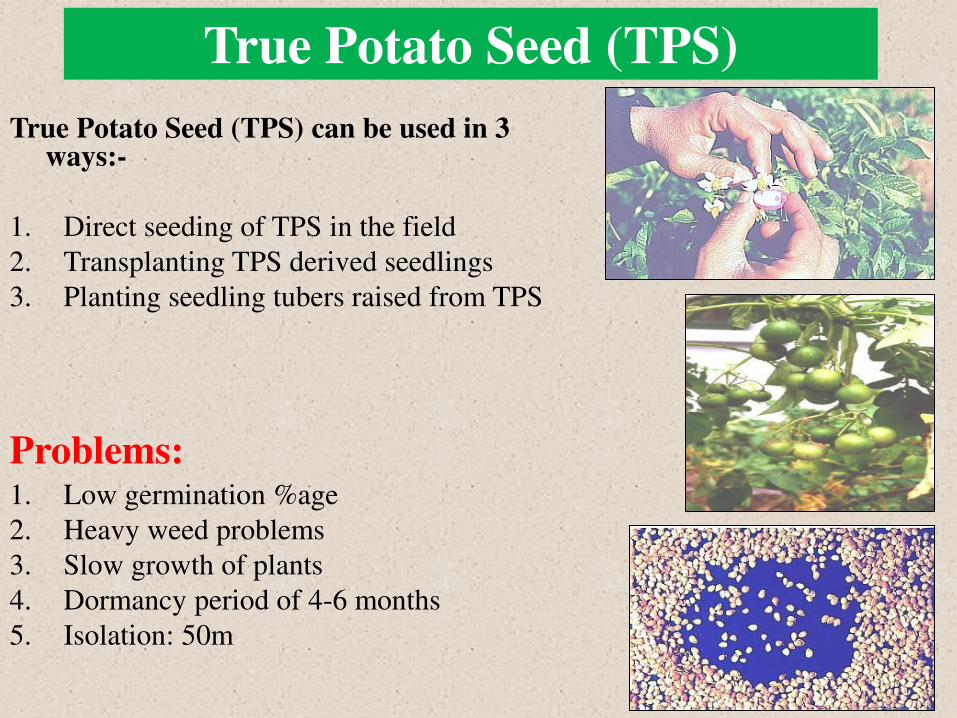
True Potato Seed (TPS)
True Potato Seed (TPS) can be used in 3 ways:-
1. Direct seeding of TPS in the field
2. Transplanting TPS derived seedlings
3. Planting seedling tubers raised from TPS
Problems: 1. Low germination %age
2. Heavy weed problems
3. Slow growth of plants
4. Dormancy period of 4-6 months
5. Isolation: 50m
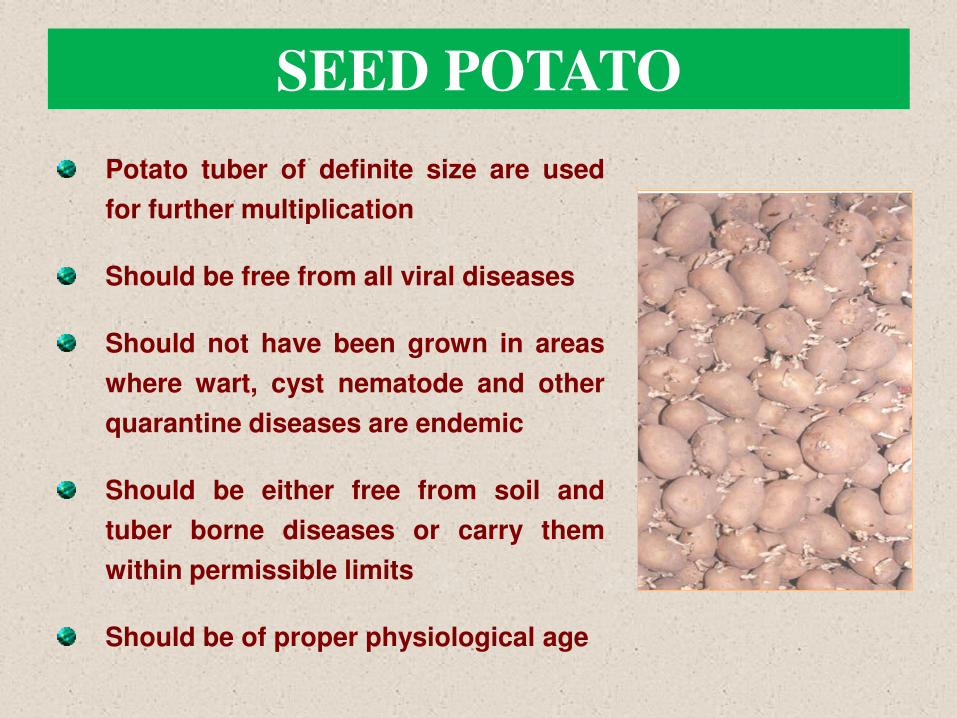
SEED POTATO
Potato tuber of definite size are used
for further multiplication
Should be free from all viral diseases
Should not have been grown in areas
where wart, cyst nematode and other
quarantine diseases are endemic
Should be either free from soil and
tuber borne diseases or carry them
within permissible limits
Should be of proper physiological age
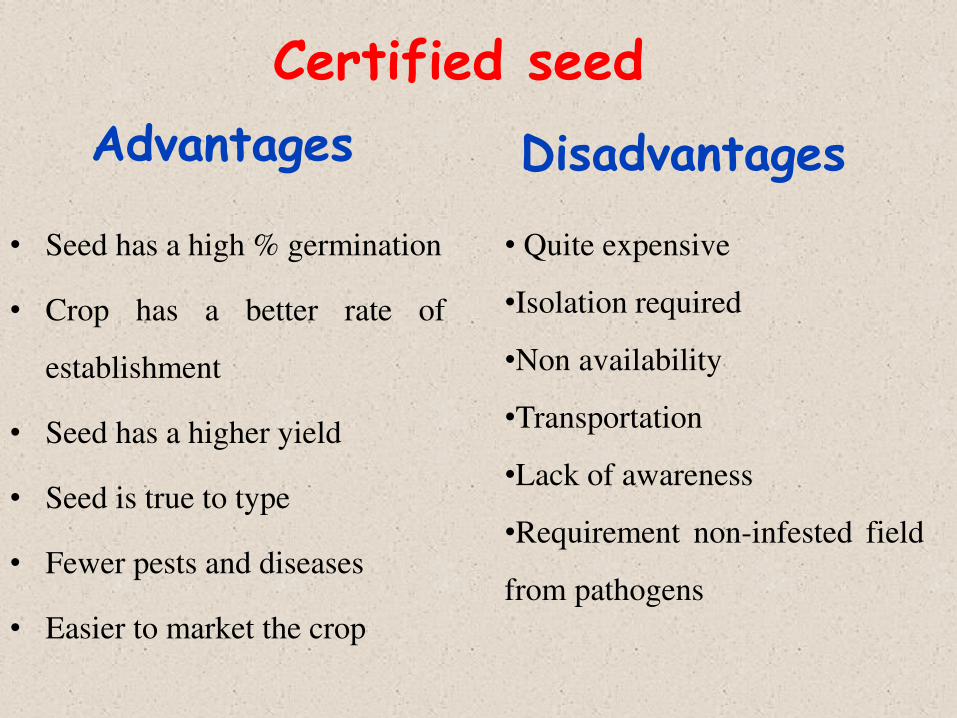
Advantages
• Seed has a high % germination
• Crop has a better rate of
establishment
• Seed has a higher yield
• Seed is true to type
• Fewer pests and diseases
• Easier to market the crop
• Quite expensive
•Isolation required
•Non availability
•Transportation
•Lack of awareness
•Requirement non-infested field
from pathogens
Disadvantages
Certified seed
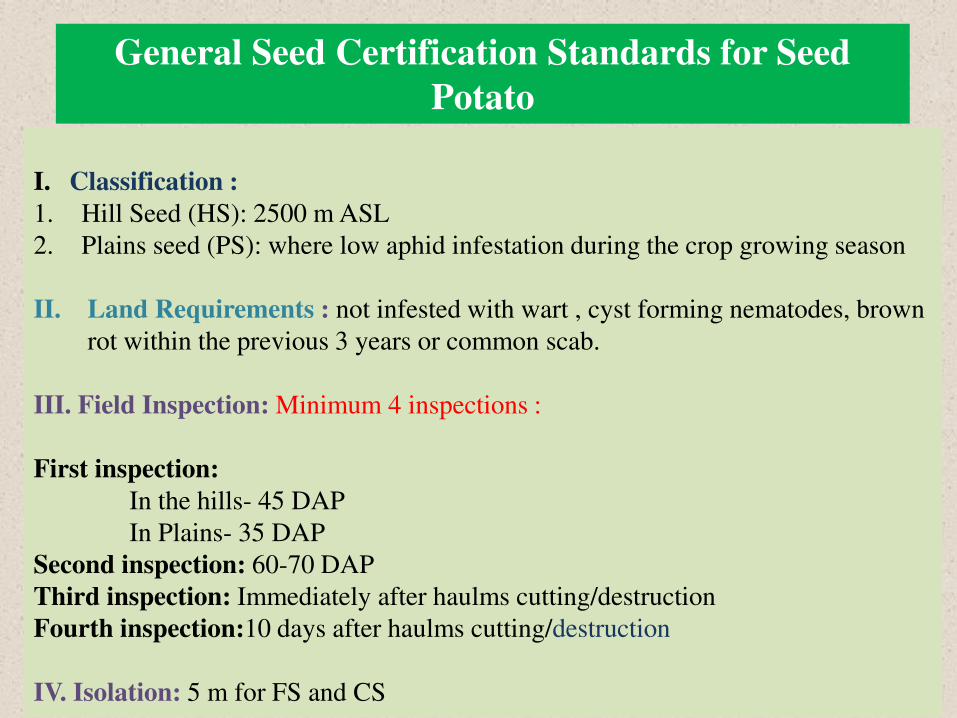
General Seed Certification Standards for Seed
Potato
I. Classification :
1. Hill Seed (HS): 2500 m ASL
2. Plains seed (PS): where low aphid infestation during the crop growing season
II. Land Requirements : not infested with wart , cyst forming nematodes, brown
rot within the previous 3 years or common scab.
III. Field Inspection: Minimum 4 inspections :
First inspection:
In the hills- 45 DAP
In Plains- 35 DAP
Second inspection: 60-70 DAP
Third inspection: Immediately after haulms cutting/destruction
Fourth inspection:10 days after haulms cutting/destruction
IV. Isolation: 5 m for FS and CS
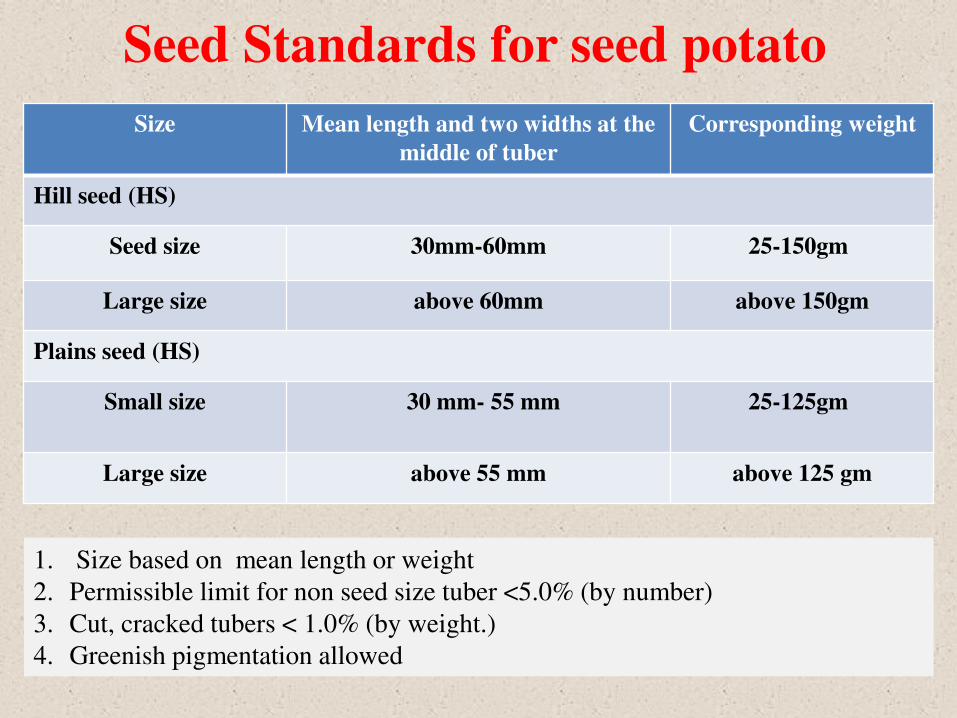
Seed Standards for seed potato
Size Mean length and two widths at the
middle of tuber
Corresponding weight
Hill seed (HS)
Seed size 30mm-60mm 25-150gm
Large size above 60mm above 150gm
Plains seed (HS)
Small size 30 mm- 55 mm
25-125gm
Large size above 55 mm above 125 gm
1. Size based on mean length or weight
2. Permissible limit for non seed size tuber <5.0% (by number)
3. Cut, cracked tubers < 1.0% (by weight.)
4. Greenish pigmentation allowed
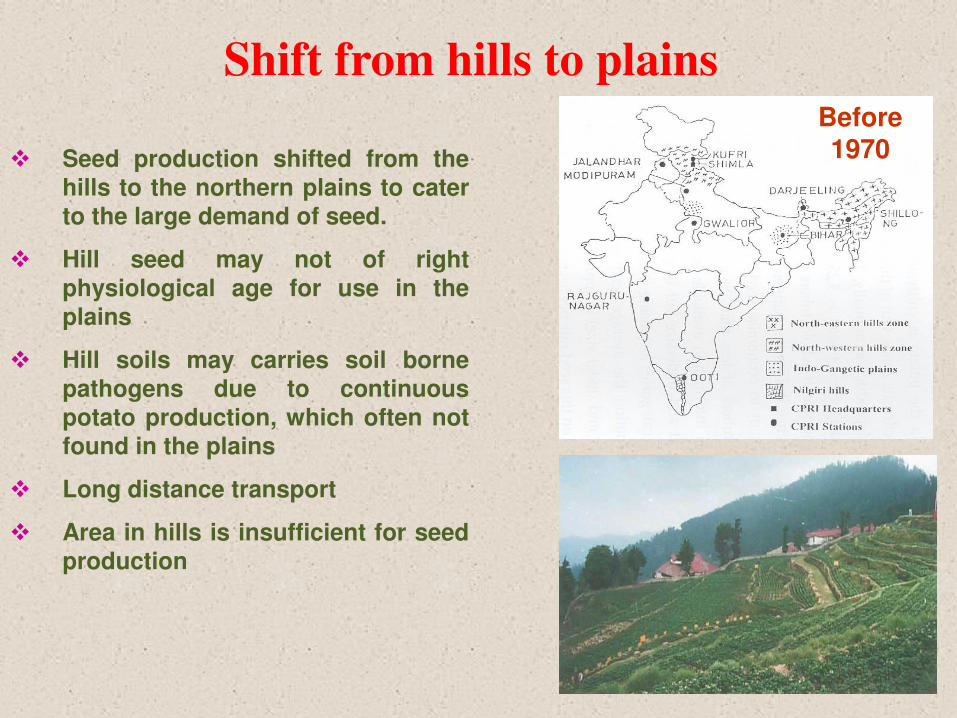
Shift from hills to plains Before 1970
Seed production shifted from the hills to the northern plains to cater to the large demand of seed.
Hill seed may not of right physiological age for use in the plains
Hill soils may carries soil borne pathogens due to continuous potato production, which often not found in the plains
Long distance transport
Area in hills is insufficient for seed production

APHID POPULATION
BUILDUP IN SUB-TROPICS
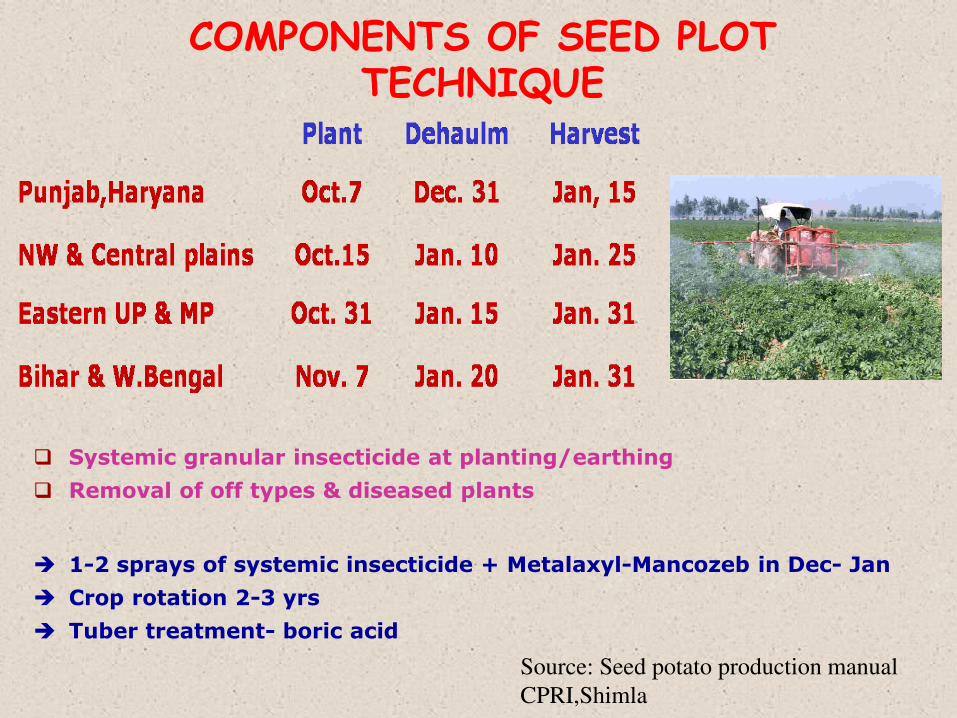
COMPONENTS OF SEED PLOT TECHNIQUE
Systemic granular insecticide at planting/earthing
Removal of off types & diseased plants
1-2 sprays of systemic insecticide + Metalaxyl-Mancozeb in Dec- Jan
Crop rotation 2-3 yrs
Tuber treatment- boric acid
Source: Seed potato production manual
CPRI,Shimla
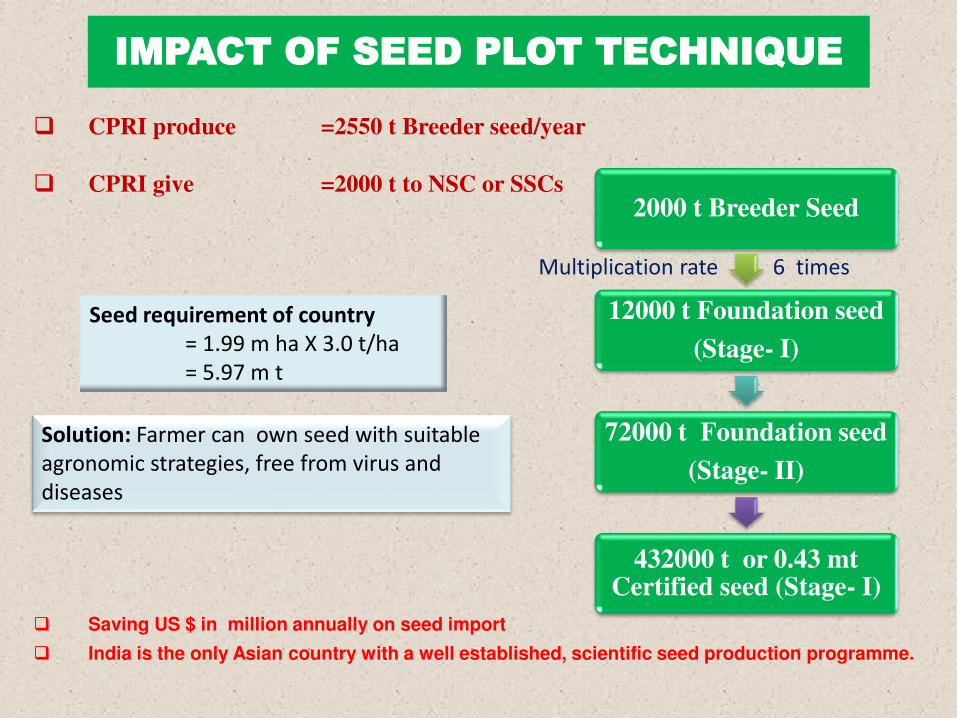
IMPACT OF SEED PLOT TECHNIQUE
CPRI produce =2550 t Breeder seed/year
CPRI give =2000 t to NSC or SSCs
Saving US $ in million annually on seed import
India is the only Asian country with a well established, scientific seed production programme.
2000 t Breeder Seed
12000 t Foundation seed
(Stage- I)
72000 t Foundation seed
(Stage- II)
432000 t or 0.43 mt Certified seed (Stage- I)
Seed requirement of country
= 1.99 m ha X 3.0 t/ha
= 5.97 m t
Solution: Farmer can own seed with suitable
agronomic strategies, free from virus and
diseases
Multiplication rate 6 times
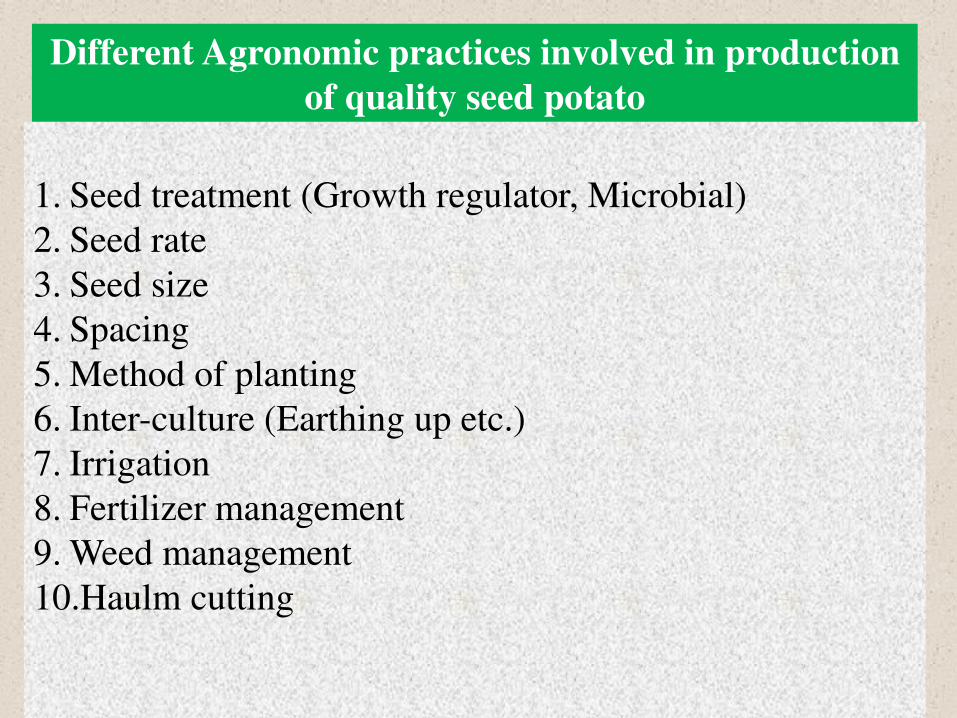
Different Agronomic practices involved in production
of quality seed potato
1. Seed treatment (Growth regulator, Microbial)
2. Seed rate
3. Seed size
4. Spacing
5. Method of planting
6. Inter-culture (Earthing up etc.)
7. Irrigation
8. Fertilizer management
9. Weed management
10.Haulm cutting
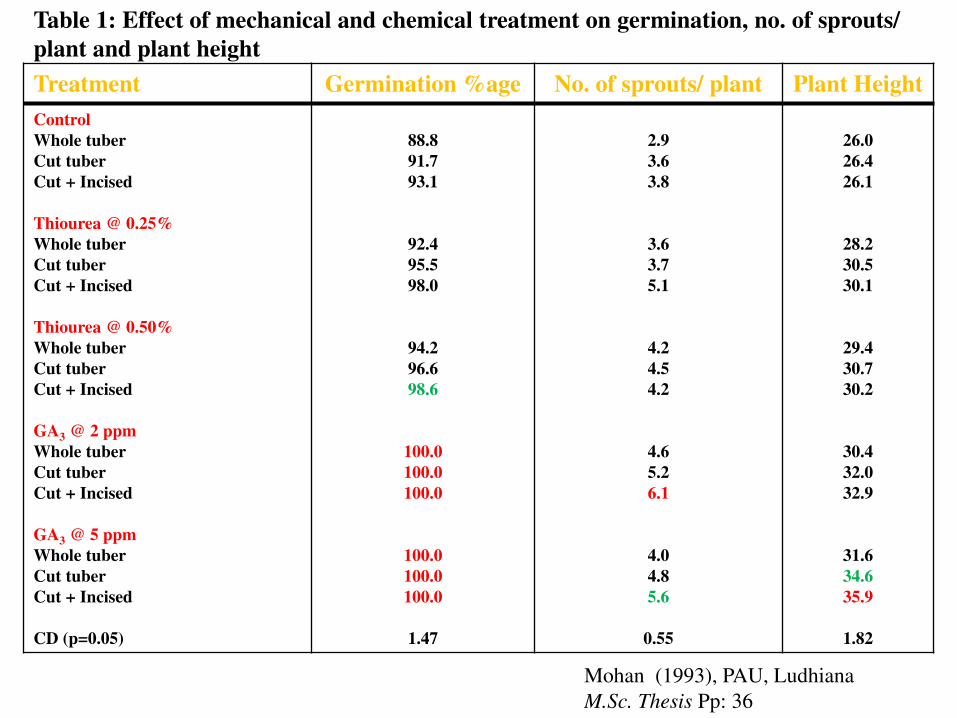
Treatment Germination %age No. of sprouts/ plant Plant Height
Control
Whole tuber
Cut tuber
Cut + Incised
Thiourea @ 0.25%
Whole tuber
Cut tuber
Cut + Incised
Thiourea @ 0.50%
Whole tuber
Cut tuber
Cut + Incised
GA3 @ 2 ppm
Whole tuber
Cut tuber
Cut + Incised
GA3 @ 5 ppm
Whole tuber
Cut tuber
Cut + Incised
CD (p=0.05)
88.8
91.7
93.1
92.4
95.5
98.0
94.2
96.6
98.6
100.0
100.0
100.0
100.0
100.0
100.0
1.47
2.9
3.6
3.8
3.6
3.7
5.1
4.2
4.5
4.2
4.6
5.2
6.1
4.0
4.8
5.6
0.55
26.0
26.4
26.1
28.2
30.5
30.1
29.4
30.7
30.2
30.4
32.0
32.9
31.6
34.6
35.9
1.82
Table 1: Effect of mechanical and chemical treatment on germination, no. of sprouts/
plant and plant height
Mohan (1993), PAU, Ludhiana
M.Sc. Thesis Pp: 36
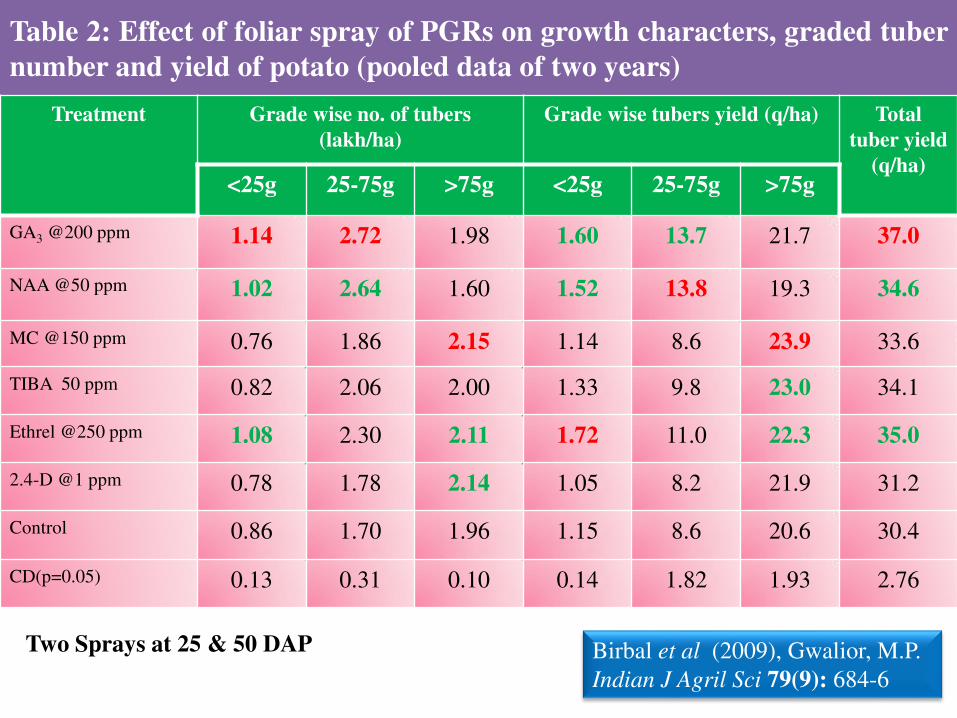
Table 2: Effect of foliar spray of PGRs on growth characters, graded tuber
number and yield of potato (pooled data of two years)
Treatment Grade wise no. of tubers
(lakh/ha)
Grade wise tubers yield (q/ha) Total
tuber yield
(q/ha) <25g 25-75g >75g <25g 25-75g >75g
GA3 @200 ppm 1.14 2.72 1.98 1.60 13.7 21.7 37.0
NAA @50 ppm 1.02 2.64 1.60 1.52 13.8 19.3 34.6
MC @150 ppm 0.76 1.86 2.15 1.14 8.6 23.9 33.6
TIBA 50 ppm 0.82 2.06 2.00 1.33 9.8 23.0 34.1
Ethrel @250 ppm 1.08 2.30 2.11 1.72 11.0 22.3 35.0
2.4-D @1 ppm 0.78 1.78 2.14 1.05 8.2 21.9 31.2
Control 0.86 1.70 1.96 1.15 8.6 20.6 30.4
CD(p=0.05) 0.13 0.31 0.10 0.14 1.82 1.93 2.76
Birbal et al (2009), Gwalior, M.P.
Indian J Agril Sci 79(9): 684-6
Two Sprays at 25 & 50 DAP
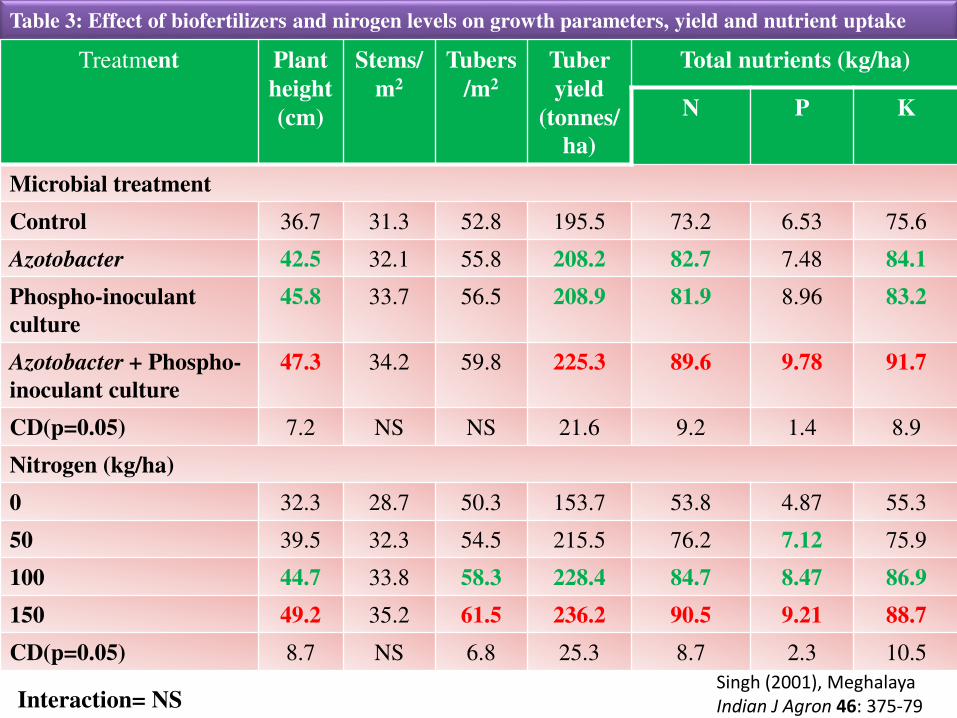
Table 3: Effect of biofertilizers and nirogen levels on growth parameters, yield and nutrient uptake
Treatment Plant
height
(cm)
Stems/
m2
Tubers
/m2
Tuber
yield
(tonnes/
ha)
Total nutrients (kg/ha)
N P K
Microbial treatment
Control 36.7 31.3 52.8 195.5 73.2 6.53 75.6
Azotobacter 42.5 32.1 55.8 208.2 82.7 7.48 84.1
Phospho-inoculant
culture
45.8 33.7 56.5 208.9 81.9 8.96 83.2
Azotobacter + Phospho-
inoculant culture
47.3 34.2 59.8 225.3 89.6 9.78 91.7
CD(p=0.05) 7.2 NS NS 21.6 9.2 1.4 8.9
Nitrogen (kg/ha)
0 32.3 28.7 50.3 153.7 53.8 4.87 55.3
50 39.5 32.3 54.5 215.5 76.2 7.12 75.9
100 44.7 33.8 58.3 228.4 84.7 8.47 86.9
150 49.2 35.2 61.5 236.2 90.5 9.21 88.7
CD(p=0.05) 8.7 NS 6.8 25.3 8.7 2.3 10.5
Singh (2001), Meghalaya
Indian J Agron 46: 375-79 Interaction= NS
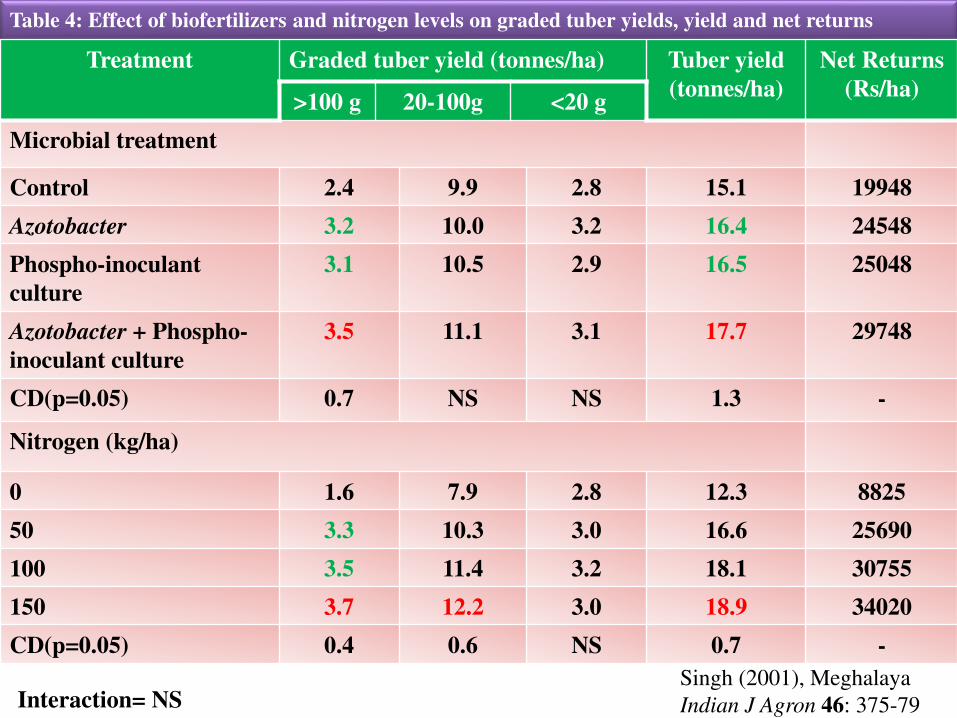
Table 4: Effect of biofertilizers and nitrogen levels on graded tuber yields, yield and net returns
Treatment Graded tuber yield (tonnes/ha) Tuber yield
(tonnes/ha)
Net Returns
(Rs/ha) >100 g 20-100g <20 g
Microbial treatment
Control 2.4 9.9 2.8 15.1 19948
Azotobacter 3.2 10.0 3.2 16.4 24548
Phospho-inoculant
culture
3.1 10.5 2.9 16.5 25048
Azotobacter + Phospho-
inoculant culture
3.5 11.1 3.1 17.7 29748
CD(p=0.05) 0.7 NS NS 1.3 -
Nitrogen (kg/ha)
0 1.6 7.9 2.8 12.3 8825
50 3.3 10.3 3.0 16.6 25690
100 3.5 11.4 3.2 18.1 30755
150 3.7 12.2 3.0 18.9 34020
CD(p=0.05) 0.4 0.6 NS 0.7 -
Singh (2001), Meghalaya
Indian J Agron 46: 375-79 Interaction= NS
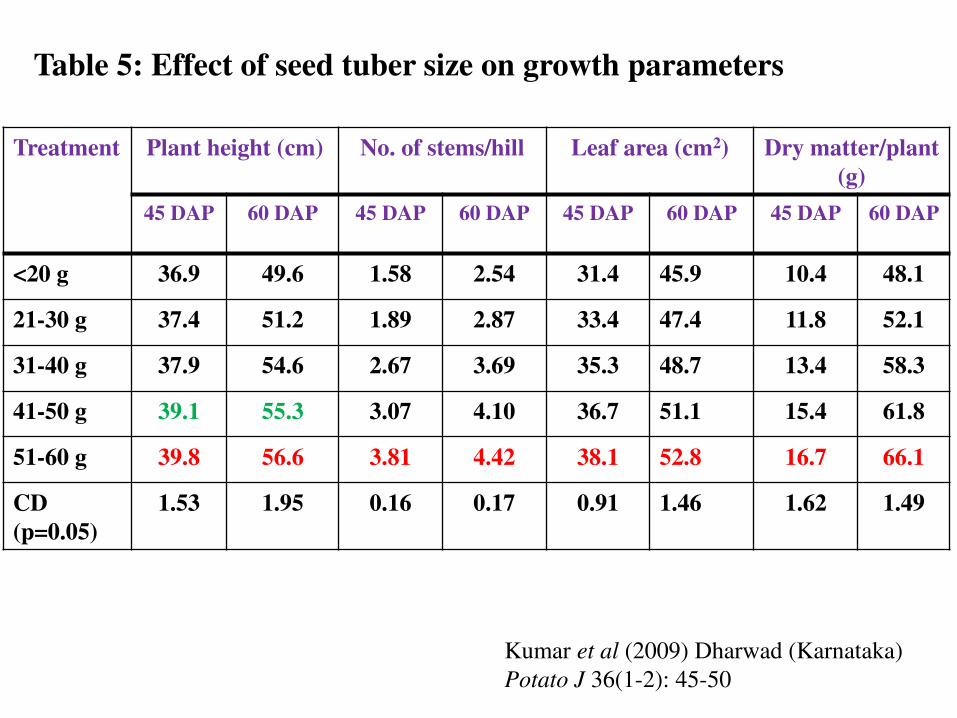
Treatment Plant height (cm) No. of stems/hill Leaf area (cm2) Dry matter/plant
(g)
45 DAP 60 DAP 45 DAP 60 DAP 45 DAP 60 DAP 45 DAP 60 DAP
<20 g 36.9 49.6 1.58 2.54 31.4 45.9 10.4 48.1
21-30 g 37.4 51.2 1.89 2.87 33.4 47.4 11.8 52.1
31-40 g 37.9 54.6 2.67 3.69 35.3 48.7 13.4 58.3
41-50 g 39.1 55.3 3.07 4.10 36.7 51.1 15.4 61.8
51-60 g 39.8 56.6 3.81 4.42 38.1 52.8 16.7 66.1
CD
(p=0.05)
1.53 1.95 0.16 0.17 0.91 1.46 1.62 1.49
Table 5: Effect of seed tuber size on growth parameters
Kumar et al (2009) Dharwad (Karnataka)
Potato J 36(1-2): 45-50
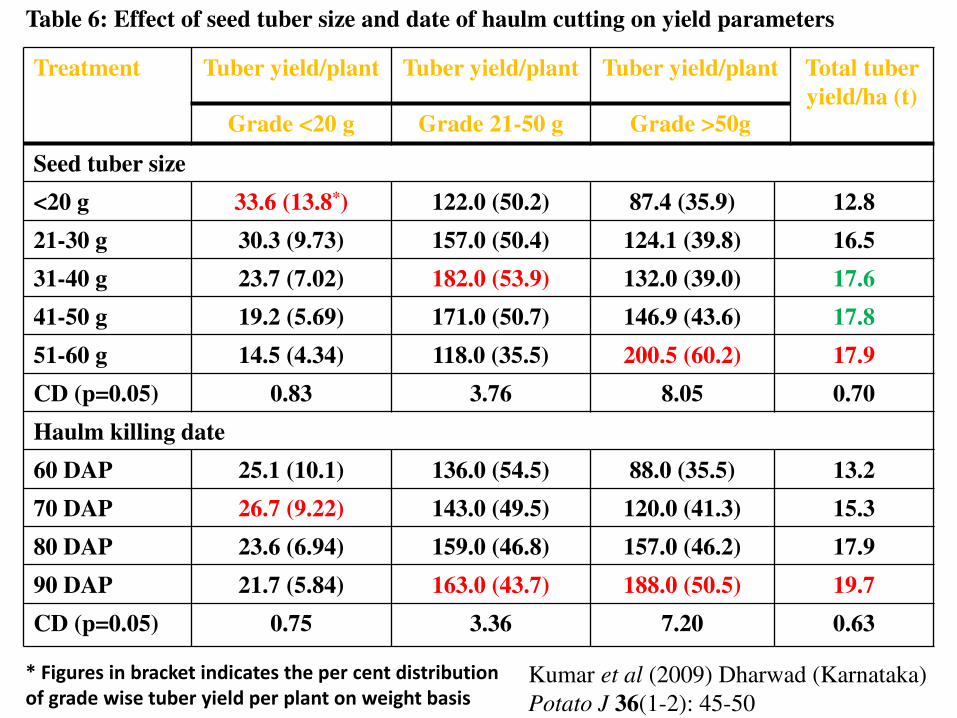
Treatment Tuber yield/plant Tuber yield/plant Tuber yield/plant Total tuber
yield/ha (t)
Grade <20 g Grade 21-50 g Grade >50g
Seed tuber size
<20 g 33.6 (13.8*) 122.0 (50.2) 87.4 (35.9) 12.8
21-30 g 30.3 (9.73) 157.0 (50.4) 124.1 (39.8) 16.5
31-40 g 23.7 (7.02) 182.0 (53.9) 132.0 (39.0) 17.6
41-50 g 19.2 (5.69) 171.0 (50.7) 146.9 (43.6) 17.8
51-60 g 14.5 (4.34) 118.0 (35.5) 200.5 (60.2) 17.9
CD (p=0.05) 0.83 3.76 8.05 0.70
Haulm killing date
60 DAP 25.1 (10.1) 136.0 (54.5) 88.0 (35.5) 13.2
70 DAP 26.7 (9.22) 143.0 (49.5) 120.0 (41.3) 15.3
80 DAP 23.6 (6.94) 159.0 (46.8) 157.0 (46.2) 17.9
90 DAP 21.7 (5.84) 163.0 (43.7) 188.0 (50.5) 19.7
CD (p=0.05) 0.75 3.36 7.20 0.63
Table 6: Effect of seed tuber size and date of haulm cutting on yield parameters
* Figures in bracket indicates the per cent distribution
of grade wise tuber yield per plant on weight basis Kumar et al (2009) Dharwad (Karnataka)
Potato J 36(1-2): 45-50
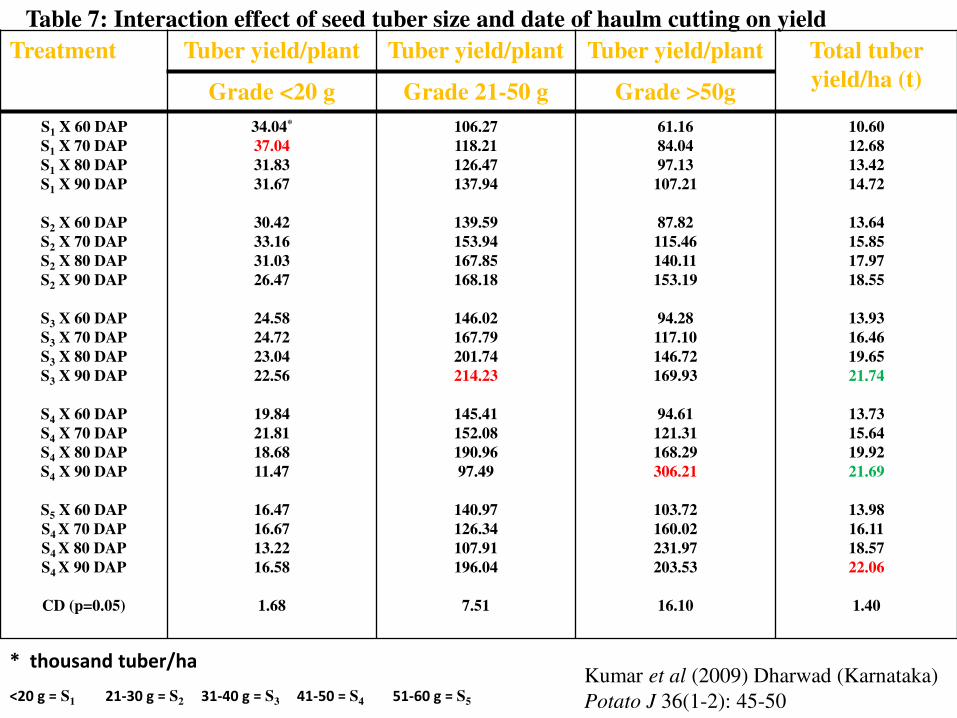
Treatment Tuber yield/plant Tuber yield/plant Tuber yield/plant Total tuber
yield/ha (t) Grade <20 g Grade 21-50 g Grade >50g
S1 X 60 DAP
S1 X 70 DAP
S1 X 80 DAP
S1 X 90 DAP
S2 X 60 DAP
S2 X 70 DAP
S2 X 80 DAP
S2 X 90 DAP
S3 X 60 DAP
S3 X 70 DAP
S3 X 80 DAP
S3 X 90 DAP
S4 X 60 DAP
S4 X 70 DAP
S4 X 80 DAP
S4 X 90 DAP
S5 X 60 DAP
S4 X 70 DAP
S4 X 80 DAP
S4 X 90 DAP
CD (p=0.05)
34.04*
37.04
31.83
31.67
30.42
33.16
31.03
26.47
24.58
24.72
23.04
22.56
19.84
21.81
18.68
11.47
16.47
16.67
13.22
16.58
1.68
106.27
118.21
126.47
137.94
139.59
153.94
167.85
168.18
146.02
167.79
201.74
214.23
145.41
152.08
190.96
97.49
140.97
126.34
107.91
196.04
7.51
61.16
84.04
97.13
107.21
87.82
115.46
140.11
153.19
94.28
117.10
146.72
169.93
94.61
121.31
168.29
306.21
103.72
160.02
231.97
203.53
16.10
10.60
12.68
13.42
14.72
13.64
15.85
17.97
18.55
13.93
16.46
19.65
21.74
13.73
15.64
19.92
21.69
13.98
16.11
18.57
22.06
1.40
Table 7: Interaction effect of seed tuber size and date of haulm cutting on yield
* thousand tuber/ha Kumar et al (2009) Dharwad (Karnataka)
Potato J 36(1-2): 45-50 <20 g = S1 21-30 g = S2 31-40 g = S3 41-50 = S4 51-60 g = S5
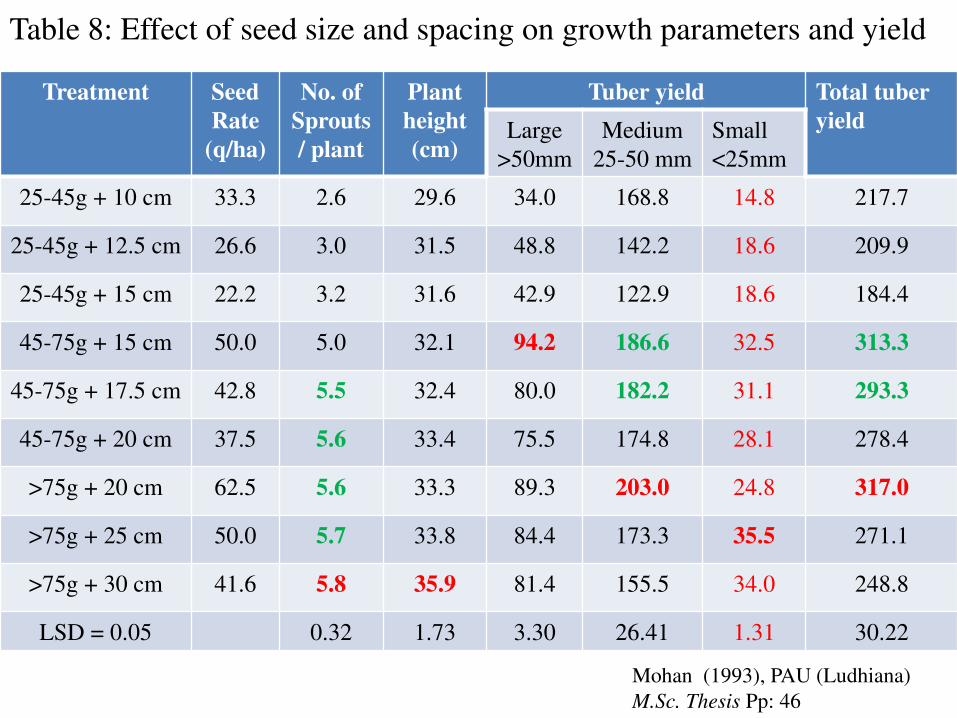
Table 8: Effect of seed size and spacing on growth parameters and yield
Treatment Seed
Rate
(q/ha)
No. of
Sprouts
/ plant
Plant
height
(cm)
Tuber yield Total tuber
yield Large
>50mm
Medium
25-50 mm
Small
<25mm
25-45g + 10 cm 33.3 2.6 29.6 34.0 168.8 14.8 217.7
25-45g + 12.5 cm 26.6 3.0 31.5 48.8 142.2 18.6 209.9
25-45g + 15 cm 22.2 3.2 31.6 42.9 122.9 18.6 184.4
45-75g + 15 cm 50.0 5.0 32.1 94.2 186.6 32.5 313.3
45-75g + 17.5 cm 42.8 5.5 32.4 80.0 182.2 31.1 293.3
45-75g + 20 cm 37.5 5.6 33.4 75.5 174.8 28.1 278.4
>75g + 20 cm 62.5 5.6 33.3 89.3 203.0 24.8 317.0
>75g + 25 cm 50.0 5.7 33.8 84.4 173.3 35.5 271.1
>75g + 30 cm 41.6 5.8 35.9 81.4 155.5 34.0 248.8
LSD = 0.05 0.32 1.73 3.30 26.41 1.31 30.22
Mohan (1993), PAU (Ludhiana)
M.Sc. Thesis Pp: 46
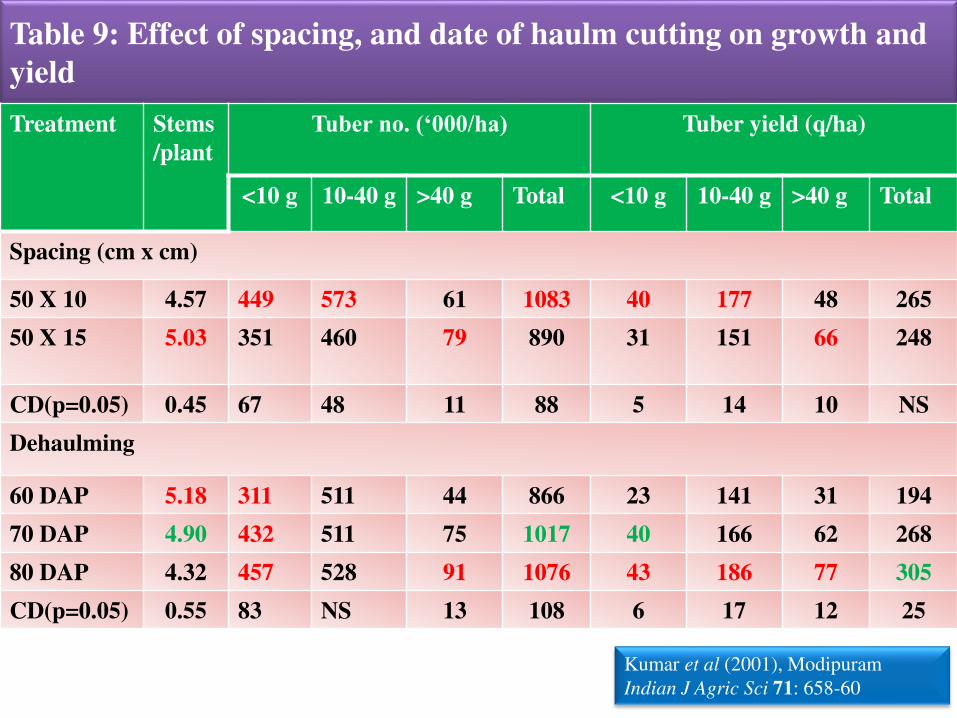
Table 9: Effect of spacing, and date of haulm cutting on growth and
yield
Treatment Stems
/plant
Tuber no. (‘000/ha) Tuber yield (q/ha)
<10 g 10-40 g >40 g Total <10 g 10-40 g >40 g Total
Spacing (cm x cm)
50 X 10 4.57 449 573 61 1083 40 177 48 265
50 X 15 5.03
351 460 79 890 31 151 66 248
CD(p=0.05) 0.45 67 48 11 88 5 14 10 NS
Dehaulming
60 DAP 5.18 311 511 44 866 23 141 31 194
70 DAP 4.90 432 511 75 1017 40 166 62 268
80 DAP 4.32 457 528 91 1076 43 186 77 305
CD(p=0.05) 0.55 83 NS 13 108 6 17 12 25
Kumar et al (2001), Modipuram
Indian J Agric Sci 71: 658-60
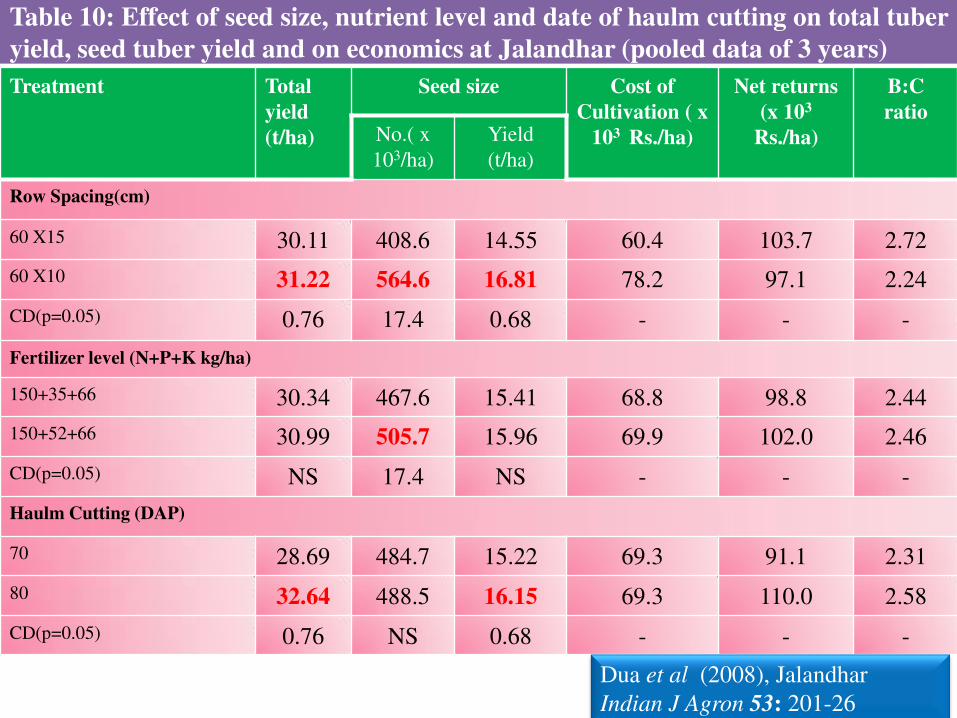
Table 10: Effect of seed size, nutrient level and date of haulm cutting on total tuber
yield, seed tuber yield and on economics at Jalandhar (pooled data of 3 years)
Treatment Total
yield
(t/ha)
Seed size Cost of
Cultivation ( x
103 Rs./ha)
Net returns
(x 103
Rs./ha)
B:C
ratio No.( x
103/ha)
Yield
(t/ha)
Row Spacing(cm)
60 X15 30.11 408.6 14.55 60.4 103.7 2.72
60 X10 31.22 564.6 16.81 78.2 97.1 2.24
CD(p=0.05) 0.76 17.4 0.68 - - -
Fertilizer level (N+P+K kg/ha)
150+35+66 30.34 467.6 15.41 68.8 98.8 2.44
150+52+66 30.99 505.7 15.96 69.9 102.0 2.46
CD(p=0.05) NS 17.4 NS - - -
Haulm Cutting (DAP)
70 28.69 484.7 15.22 69.3 91.1 2.31
80 32.64 488.5 16.15 69.3 110.0 2.58
CD(p=0.05) 0.76 NS 0.68 - - -
Dua et al (2008), Jalandhar
Indian J Agron 53: 201-26

Table 11: Effect of seed size, nutrient level and date of haulm cutting on total tuber
yield, seed tuber yield and on economics at Faizabad (pooled data of 3 years)
Treatment Total
yield
(t/ha)
Seed size Cost of
Cultivation (x
103 Rs./ha)
Net returns
(x 103
Rs./ha)
B:C
ratio No.( x
103/ha)
Yield
(t/ha)
Row Spacing(cm)
60 X15 27.53 450.5 14.71 57.9 96.4 2.67
60 X10 28.49 494.8 15.87 75.7 85.9 2.14
CD(p=0.05) 0.87 14.9 0.65 - - -
Fertilizer level (N+P+K kg/ha)
100+35+66 26.11 435.4 14.06 65.0 81.6 2.26
150+52+66 29.90 509.9 16.53 68.5 100.7 2.47
CD(p=0.05) 0.87 14.1 0.61 - - -
Haulm Cutting (DAP)
70 25.67 439.3 14.06 66.8 78.1 2.17
80 30.35 505.9 16.53 66.8 104.2 2.56
CD(p=0.05) 0.87 14.3 0.63 - - -
Dua et al (2008), Faizabad
Indian J Agron 53: 201-26
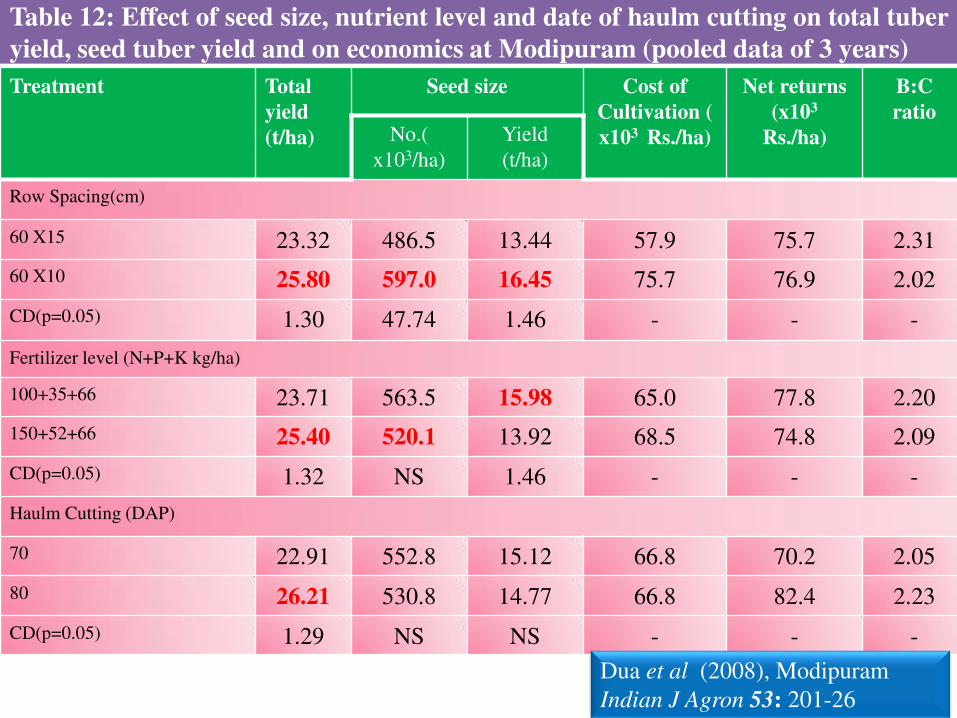
Table 12: Effect of seed size, nutrient level and date of haulm cutting on total tuber
yield, seed tuber yield and on economics at Modipuram (pooled data of 3 years)
Treatment Total
yield
(t/ha)
Seed size Cost of
Cultivation (
x103 Rs./ha)
Net returns
(x103
Rs./ha)
B:C
ratio No.(
x103/ha)
Yield
(t/ha)
Row Spacing(cm)
60 X15 23.32 486.5 13.44 57.9 75.7 2.31
60 X10 25.80 597.0 16.45 75.7 76.9 2.02
CD(p=0.05) 1.30 47.74 1.46 - - -
Fertilizer level (N+P+K kg/ha)
100+35+66 23.71 563.5 15.98 65.0 77.8 2.20
150+52+66 25.40 520.1 13.92 68.5 74.8 2.09
CD(p=0.05) 1.32 NS 1.46 - - -
Haulm Cutting (DAP)
70 22.91 552.8 15.12 66.8 70.2 2.05
80 26.21 530.8 14.77 66.8 82.4 2.23
CD(p=0.05) 1.29 NS NS - - -
Dua et al (2008), Modipuram
Indian J Agron 53: 201-26
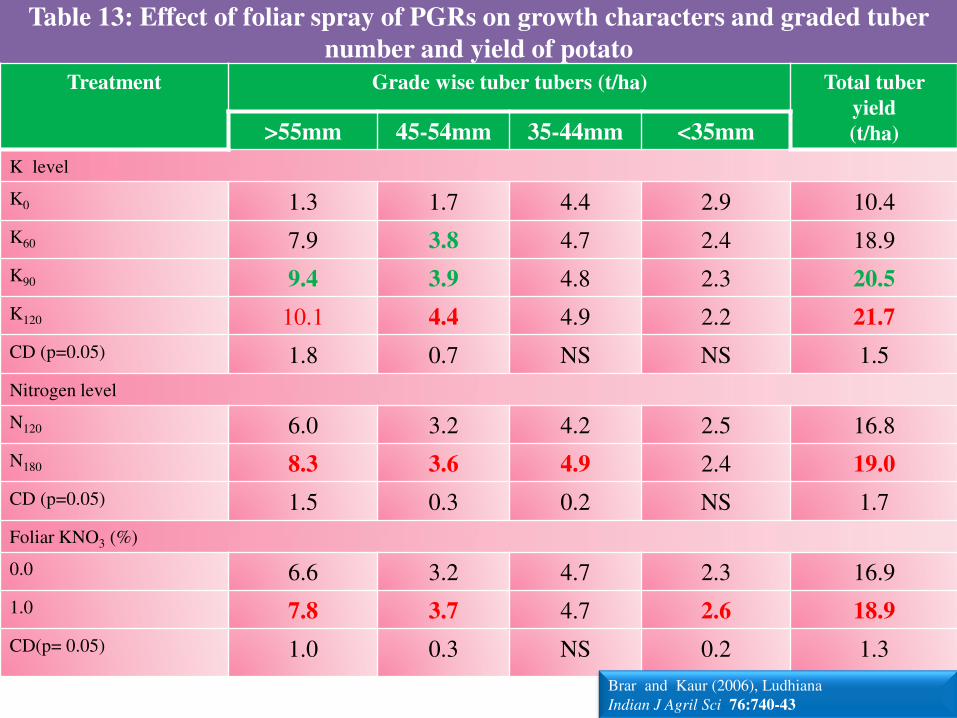
Table 13: Effect of foliar spray of PGRs on growth characters and graded tuber
number and yield of potato
Treatment Grade wise tuber tubers (t/ha) Total tuber
yield
(t/ha) >55mm 45-54mm 35-44mm <35mm
K level
K0 1.3 1.7 4.4 2.9 10.4
K60 7.9 3.8 4.7 2.4 18.9
K90 9.4 3.9 4.8 2.3 20.5
K120 10.1 4.4 4.9 2.2 21.7
CD (p=0.05) 1.8 0.7 NS NS 1.5
Nitrogen level
N120 6.0 3.2 4.2 2.5 16.8
N180 8.3 3.6 4.9 2.4 19.0
CD (p=0.05) 1.5 0.3 0.2 NS 1.7
Foliar KNO3 (%)
0.0 6.6 3.2 4.7 2.3 16.9
1.0 7.8 3.7 4.7 2.6 18.9
CD(p= 0.05) 1.0 0.3 NS 0.2 1.3
Brar and Kaur (2006), Ludhiana
Indian J Agril Sci 76:740-43
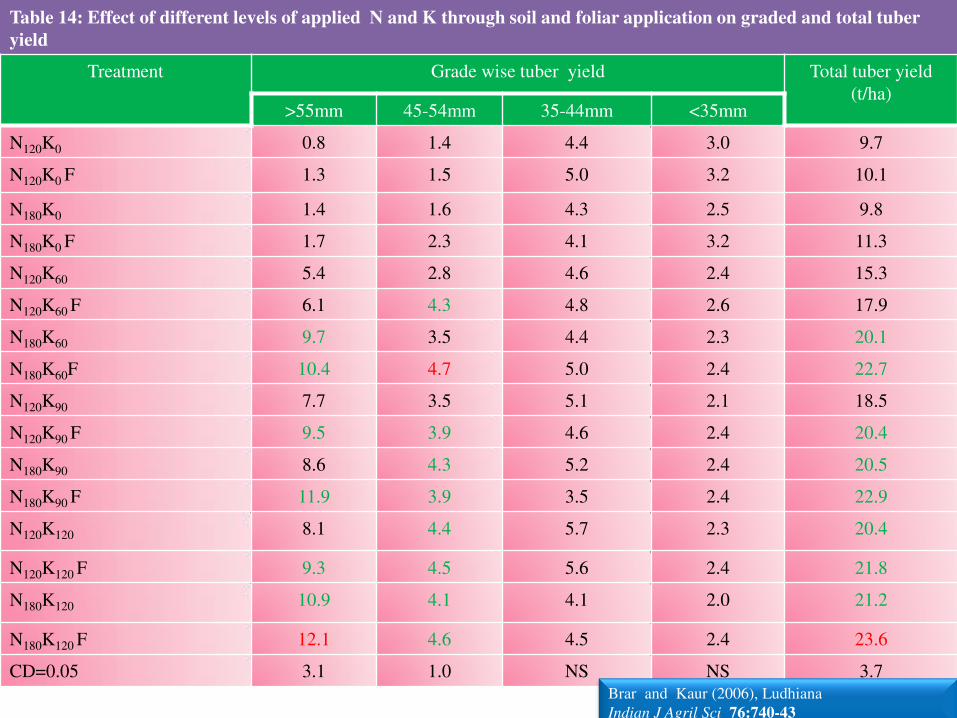
Table 14: Effect of different levels of applied N and K through soil and foliar application on graded and total tuber
yield
Treatment Grade wise tuber yield Total tuber yield
(t/ha) >55mm 45-54mm 35-44mm <35mm
N120K0 0.8 1.4 4.4 3.0 9.7
N120K0 F 1.3 1.5 5.0 3.2 10.1
N180K0 1.4 1.6 4.3 2.5 9.8
N180K0 F 1.7 2.3 4.1 3.2 11.3
N120K60 5.4 2.8 4.6 2.4 15.3
N120K60 F 6.1 4.3 4.8 2.6 17.9
N180K60 9.7 3.5 4.4 2.3 20.1
N180K60F 10.4 4.7 5.0 2.4 22.7
N120K90 7.7 3.5 5.1 2.1 18.5
N120K90 F 9.5 3.9 4.6 2.4 20.4
N180K90 8.6 4.3 5.2 2.4 20.5
N180K90 F 11.9 3.9 3.5 2.4 22.9
N120K120 8.1 4.4 5.7 2.3 20.4
N120K120 F 9.3 4.5 5.6 2.4 21.8
N180K120 10.9 4.1 4.1 2.0 21.2
N180K120 F 12.1 4.6 4.5 2.4 23.6
CD=0.05 3.1 1.0 NS NS 3.7
Brar and Kaur (2006), Ludhiana
Indian J Agril Sci 76:740-43
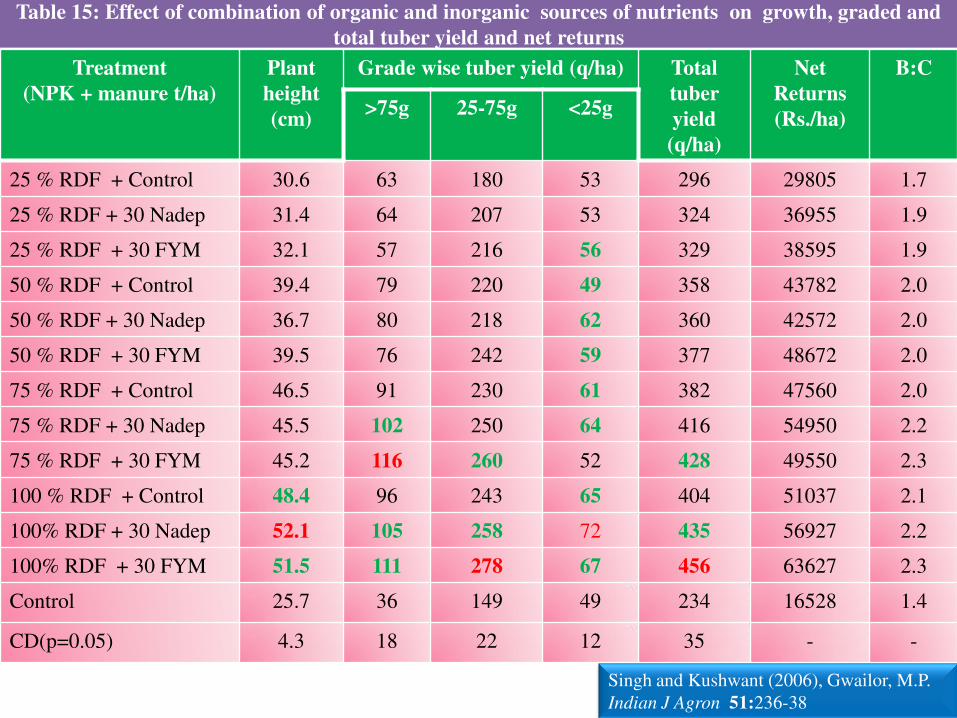
Table 15: Effect of combination of organic and inorganic sources of nutrients on growth, graded and
total tuber yield and net returns
Treatment
(NPK + manure t/ha)
Plant
height
(cm)
Grade wise tuber yield (q/ha) Total
tuber
yield
(q/ha)
Net
Returns
(Rs./ha)
B:C
>75g 25-75g <25g
25 % RDF + Control 30.6 63 180 53 296 29805 1.7
25 % RDF + 30 Nadep 31.4 64 207 53 324 36955 1.9
25 % RDF + 30 FYM 32.1 57 216 56 329 38595 1.9
50 % RDF + Control 39.4 79 220 49 358 43782 2.0
50 % RDF + 30 Nadep 36.7 80 218 62 360 42572 2.0
50 % RDF + 30 FYM 39.5 76 242 59 377 48672 2.0
75 % RDF + Control 46.5 91 230 61 382 47560 2.0
75 % RDF + 30 Nadep 45.5 102 250 64 416 54950 2.2
75 % RDF + 30 FYM 45.2 116 260 52 428 49550 2.3
100 % RDF + Control 48.4 96 243 65 404 51037 2.1
100% RDF + 30 Nadep 52.1 105 258 72 435 56927 2.2
100% RDF + 30 FYM 51.5 111 278 67 456 63627 2.3
Control 25.7 36 149 49 234 16528 1.4
CD(p=0.05) 4.3 18 22 12 35 - -
Singh and Kushwant (2006), Gwailor, M.P.
Indian J Agron 51:236-38
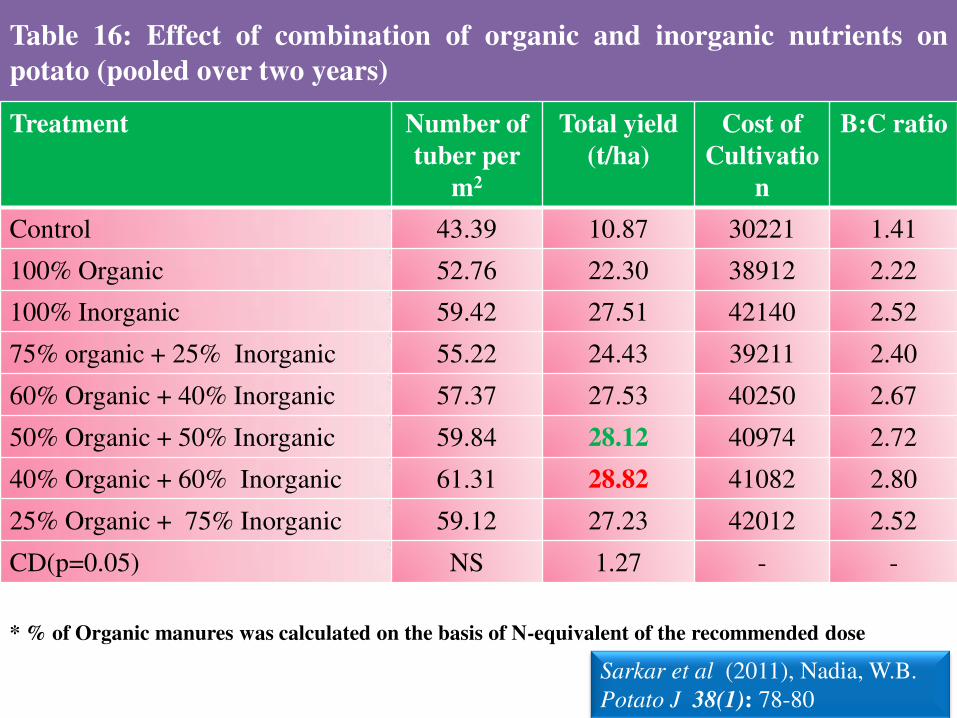
Table 16: Effect of combination of organic and inorganic nutrients on
potato (pooled over two years)
Treatment Number of
tuber per
m2
Total yield
(t/ha)
Cost of
Cultivatio
n
B:C ratio
Control 43.39 10.87 30221 1.41
100% Organic 52.76 22.30 38912 2.22
100% Inorganic 59.42 27.51 42140 2.52
75% organic + 25% Inorganic 55.22 24.43 39211 2.40
60% Organic + 40% Inorganic 57.37 27.53 40250 2.67
50% Organic + 50% Inorganic 59.84 28.12 40974 2.72
40% Organic + 60% Inorganic 61.31 28.82 41082 2.80
25% Organic + 75% Inorganic 59.12 27.23 42012 2.52
CD(p=0.05) NS 1.27 - -
Sarkar et al (2011), Nadia, W.B.
Potato J 38(1): 78-80
* % of Organic manures was calculated on the basis of N-equivalent of the recommended dose
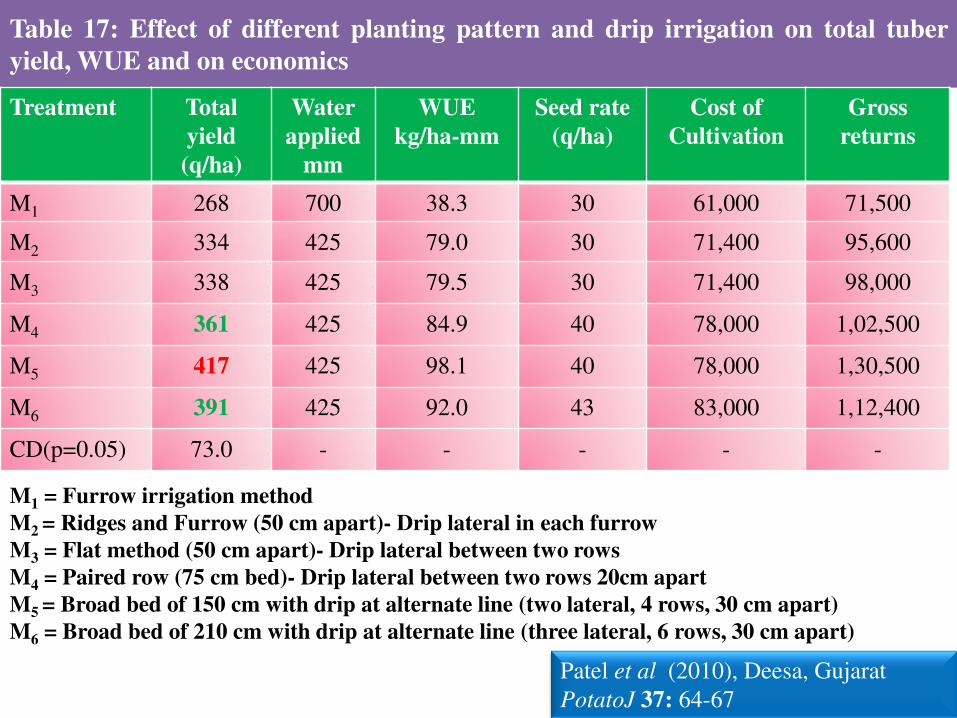
Table 17: Effect of different planting pattern and drip irrigation on total tuber
yield, WUE and on economics
Treatment Total
yield
(q/ha)
Water
applied
mm
WUE
kg/ha-mm
Seed rate
(q/ha)
Cost of
Cultivation
Gross
returns
M1 268 700 38.3 30 61,000 71,500
M2 334 425 79.0 30 71,400 95,600
M3 338 425 79.5 30 71,400 98,000
M4 361 425 84.9 40 78,000 1,02,500
M5 417 425 98.1 40 78,000 1,30,500
M6 391 425 92.0 43 83,000 1,12,400
CD(p=0.05) 73.0 - - - - -
Patel et al (2010), Deesa, Gujarat
PotatoJ 37: 64-67
M1 = Furrow irrigation method
M2 = Ridges and Furrow (50 cm apart)- Drip lateral in each furrow
M3 = Flat method (50 cm apart)- Drip lateral between two rows
M4 = Paired row (75 cm bed)- Drip lateral between two rows 20cm apart
M5 = Broad bed of 150 cm with drip at alternate line (two lateral, 4 rows, 30 cm apart)
M6 = Broad bed of 210 cm with drip at alternate line (three lateral, 6 rows, 30 cm apart)
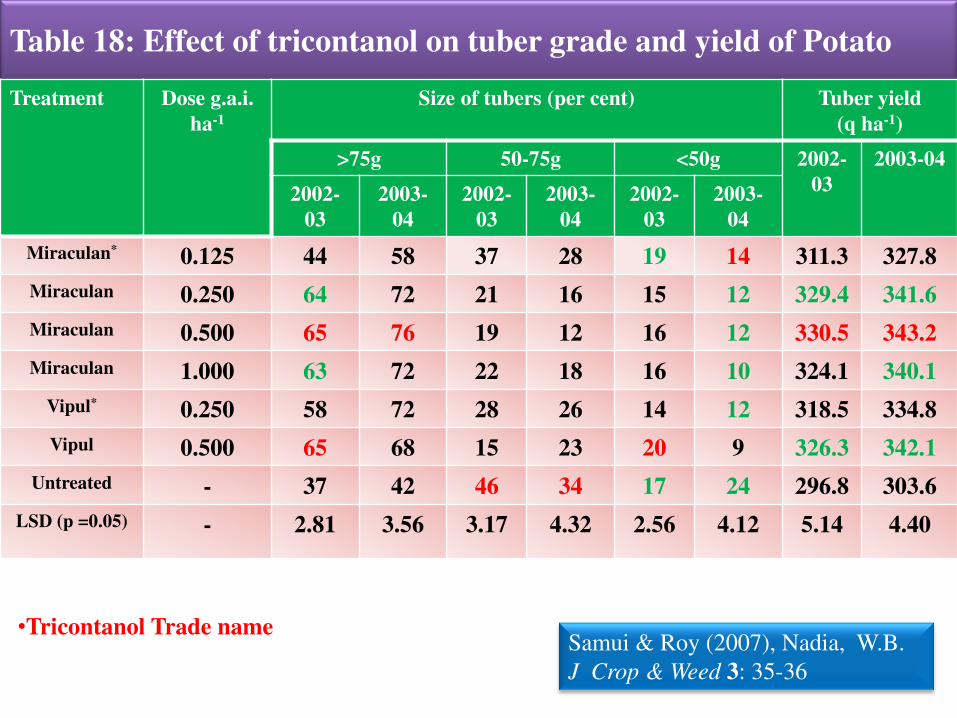
Table 18: Effect of tricontanol on tuber grade and yield of Potato
Treatment Dose g.a.i.
ha-1
Size of tubers (per cent) Tuber yield
(q ha-1)
>75g 50-75g <50g 2002-
03
2003-04
2002-
03
2003-
04
2002-
03
2003-
04
2002-
03
2003-
04
Miraculan* 0.125 44 58 37 28 19 14 311.3 327.8
Miraculan 0.250 64 72 21 16 15 12 329.4 341.6
Miraculan 0.500 65 76 19 12 16 12 330.5 343.2
Miraculan 1.000 63 72 22 18 16 10 324.1 340.1
Vipul* 0.250 58 72 28 26 14 12 318.5 334.8
Vipul 0.500 65 68 15 23 20 9 326.3 342.1
Untreated - 37 42 46 34 17 24 296.8 303.6
LSD (p =0.05) - 2.81 3.56 3.17 4.32 2.56 4.12 5.14 4.40
Samui & Roy (2007), Nadia, W.B.
J Crop & Weed 3: 35-36
•Tricontanol Trade name
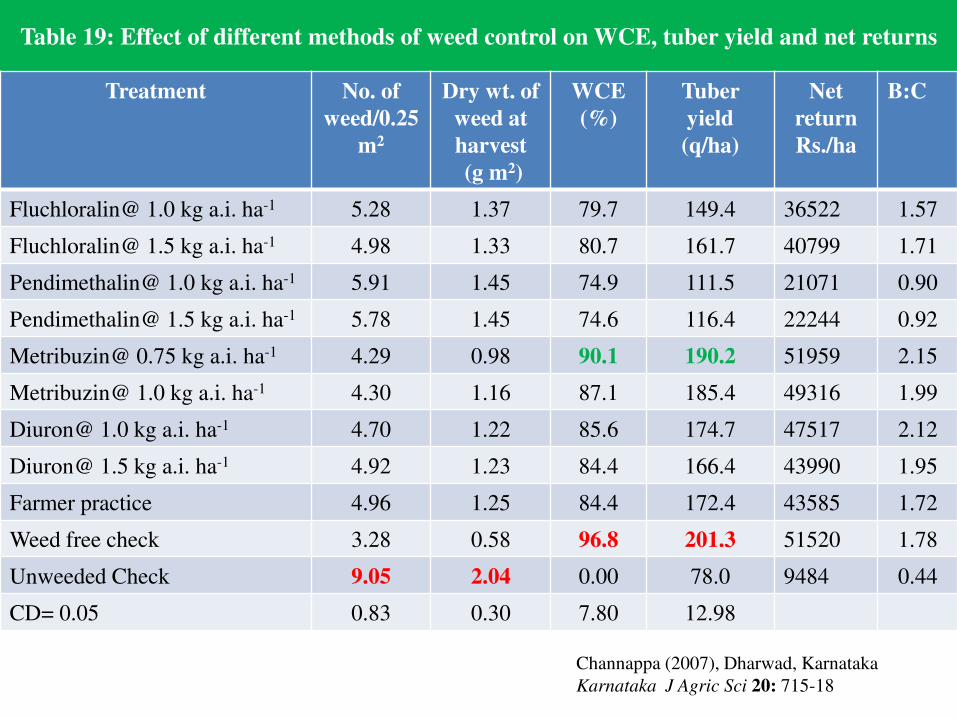
Table 19: Effect of different methods of weed control on WCE, tuber yield and net returns
Treatment No. of
weed/0.25
m2
Dry wt. of
weed at
harvest
(g m2)
WCE
(%)
Tuber
yield
(q/ha)
Net
return
Rs./ha
B:C
Fluchloralin@ 1.0 kg a.i. ha-1 5.28 1.37 79.7 149.4 36522 1.57
Fluchloralin@ 1.5 kg a.i. ha-1 4.98 1.33 80.7 161.7 40799 1.71
Pendimethalin@ 1.0 kg a.i. ha-1 5.91 1.45 74.9 111.5 21071 0.90
Pendimethalin@ 1.5 kg a.i. ha-1 5.78 1.45 74.6 116.4 22244 0.92
Metribuzin@ 0.75 kg a.i. ha-1 4.29 0.98 90.1 190.2 51959 2.15
Metribuzin@ 1.0 kg a.i. ha-1 4.30 1.16 87.1 185.4 49316 1.99
Diuron@ 1.0 kg a.i. ha-1 4.70 1.22 85.6 174.7 47517 2.12
Diuron@ 1.5 kg a.i. ha-1 4.92 1.23 84.4 166.4 43990 1.95
Farmer practice 4.96 1.25 84.4 172.4 43585 1.72
Weed free check 3.28 0.58 96.8 201.3 51520 1.78
Unweeded Check 9.05 2.04 0.00 78.0 9484 0.44
CD= 0.05 0.83 0.30 7.80 12.98
Channappa (2007), Dharwad, Karnataka
Karnataka J Agric Sci 20: 715-18
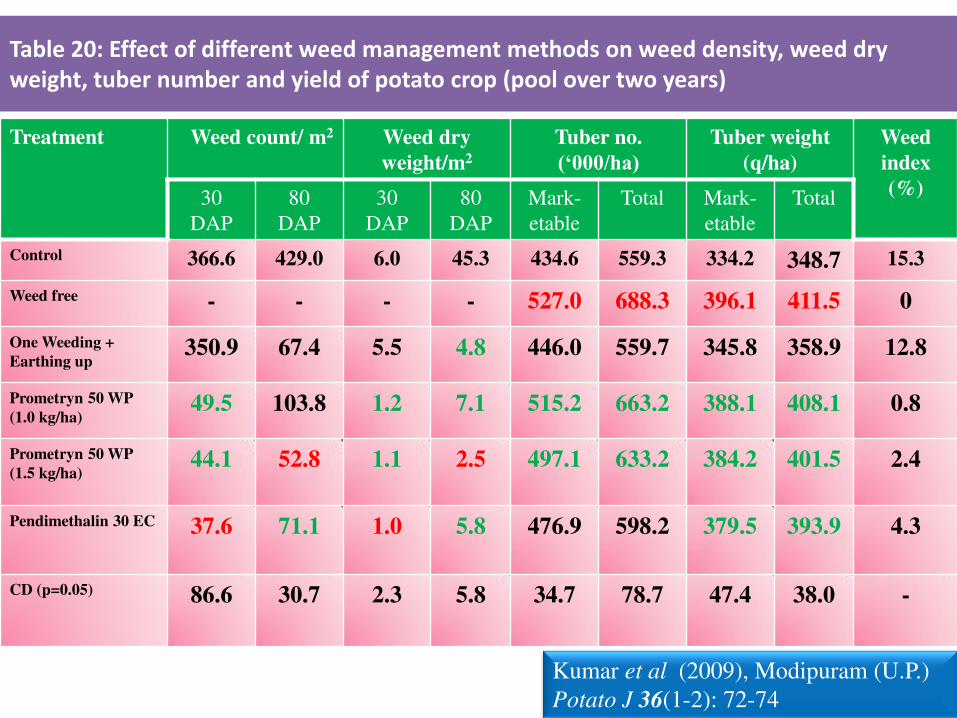
Table 20: Effect of different weed management methods on weed density, weed dry
weight, tuber number and yield of potato crop (pool over two years)
Treatment Weed count/ m2 Weed dry
weight/m2
Tuber no.
(‘000/ha) Tuber weight
(q/ha)
Weed
index
(%) 30
DAP
80
DAP
30
DAP
80
DAP
Mark-
etable
Total Mark-
etable
Total
Control 366.6 429.0 6.0 45.3 434.6 559.3 334.2 348.7 15.3
Weed free - - - - 527.0 688.3 396.1 411.5 0
One Weeding +
Earthing up 350.9 67.4 5.5 4.8 446.0 559.7 345.8 358.9 12.8
Prometryn 50 WP
(1.0 kg/ha) 49.5 103.8 1.2 7.1 515.2 663.2 388.1 408.1 0.8
Prometryn 50 WP
(1.5 kg/ha)
44.1 52.8 1.1 2.5 497.1 633.2 384.2 401.5 2.4
Pendimethalin 30 EC 37.6 71.1 1.0 5.8 476.9 598.2 379.5 393.9 4.3
CD (p=0.05)
86.6 30.7 2.3 5.8 34.7 78.7 47.4 38.0 -
Kumar et al (2009), Modipuram (U.P.)
Potato J 36(1-2): 72-74
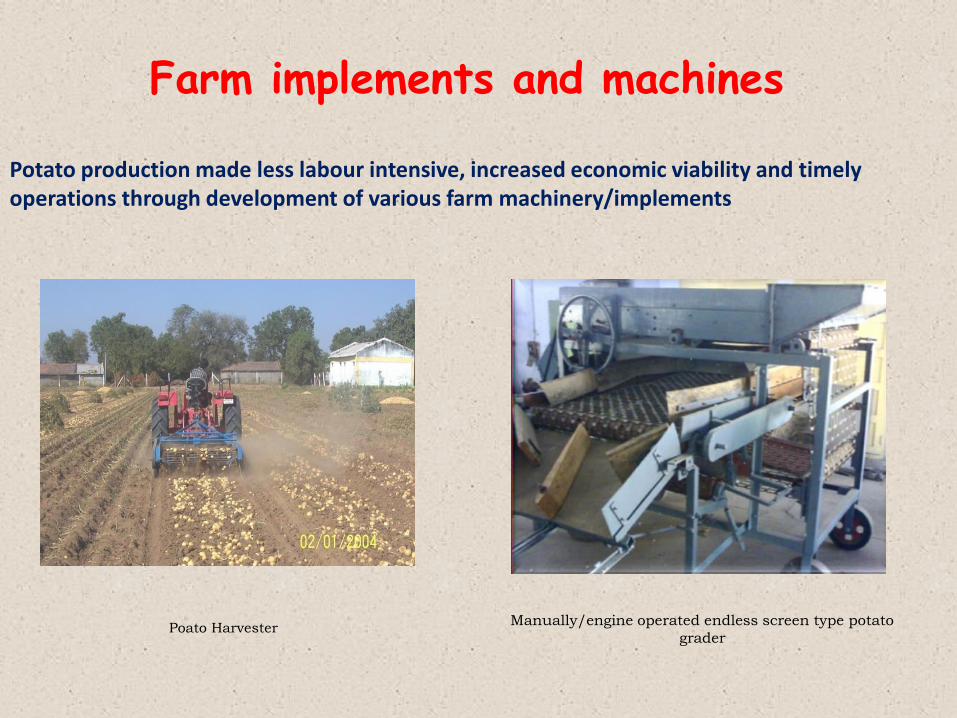
Farm implements and machines
Potato production made less labour intensive, increased economic viability and timely
operations through development of various farm machinery/implements
Manually/engine operated endless screen type potato
grader Poato Harvester
Conclusion Seed treatment with GA3 and Thiourea helps in breaking the
dormancy
Seed size of 30-40g gives higher yield of seed size tubers.
60 x 15 spacing is optimum for higher yield of seed size tubers
and in economic terms as well.
Haulm cutting at 80-90 DAP produces more no. of seed size
tubers
Application of FYM increase the seed tuber yield and total
yield
Drip irrigation improves the Water Use Efficiency.
Fertilization through integrated nutrient management gives
more returns per rupees invested.
Chemical weed control helps in large scale seed production.

Thank You