SeDuCe: a Testbed for Research on Thermal and Power ... · SeDuCe, a testbed that targets research...
7
HAL Id: hal-01855459 https://hal.archives-ouvertes.fr/hal-01855459 Submitted on 8 Aug 2018 HAL is a multi-disciplinary open access archive for the deposit and dissemination of sci- entific research documents, whether they are pub- lished or not. The documents may come from teaching and research institutions in France or abroad, or from public or private research centers. L’archive ouverte pluridisciplinaire HAL, est destinée au dépôt et à la diffusion de documents scientifiques de niveau recherche, publiés ou non, émanant des établissements d’enseignement et de recherche français ou étrangers, des laboratoires publics ou privés. SeDuCe: a Testbed for Research on Thermal and Power Management in Datacenters Jonathan Pastor, Jean-Marc Menaud To cite this version: Jonathan Pastor, Jean-Marc Menaud. SeDuCe: a Testbed for Research on Thermal and Power Man- agement in Datacenters. SoftCom 2018 - 26th International Conference on Software, Telecommunica- tions and Computer Networks, Sep 2018, Split, Croatia. pp.1-6, 10.23919/SOFTCOM.2018.8555773. hal-01855459
Transcript of SeDuCe: a Testbed for Research on Thermal and Power ... · SeDuCe, a testbed that targets research...

HAL Id: hal-01855459https://hal.archives-ouvertes.fr/hal-01855459
Submitted on 8 Aug 2018
HAL is a multi-disciplinary open accessarchive for the deposit and dissemination of sci-entific research documents, whether they are pub-lished or not. The documents may come fromteaching and research institutions in France orabroad, or from public or private research centers.
L’archive ouverte pluridisciplinaire HAL, estdestinée au dépôt et à la diffusion de documentsscientifiques de niveau recherche, publiés ou non,émanant des établissements d’enseignement et derecherche français ou étrangers, des laboratoirespublics ou privés.
SeDuCe: a Testbed for Research on Thermal and PowerManagement in DatacentersJonathan Pastor, Jean-Marc Menaud
To cite this version:Jonathan Pastor, Jean-Marc Menaud. SeDuCe: a Testbed for Research on Thermal and Power Man-agement in Datacenters. SoftCom 2018 - 26th International Conference on Software, Telecommunica-tions and Computer Networks, Sep 2018, Split, Croatia. pp.1-6, �10.23919/SOFTCOM.2018.8555773�.�hal-01855459�
SeDuCe: a Testbed for Research on Thermal andPower Management in Datacenters
Jonathan PastorIMT Atlantique - Nantes
Jean Marc MenaudIMT Atlantique - Nantes
Abstract—With the advent of Cloud Computing, the size ofdatacenters is ever increasing and the management of serversand their power consumption and heat production have becomechallenges. The management of the heat produced by servers hasbeen experimentally less explored than the management of theirpower consumption. It can be partly explained by the lack ofa public testbed that provides reliable access to both thermaland power metrics of server rooms. In this paper we proposeSeDuCe, a testbed that targets research on power and thermalmanagement of servers, by providing public access to precisedata about the power consumption and the thermal dissipationof 48 servers integrated in Grid’5000 as the new ecotype cluster.We present the chosen software and hardware architecture forthe first version of the SeDuCe testbed, highlighting its currentlimitation and proposing some improvements that will increaseits relevance.
Keywords–Datacenters; Scientific testbed; Thermal manage-ment; Power management; Green computing.
I. INTRODUCTION
The advent of web sites with a global audience and the de-mocratization of Cloud Computing have led to the constructionof datacenters all over the world. Datacenters are facilities thatconcentrate from a few servers up to hundreds of thousands ofservers hosted in rooms specially designed to provide energyand cooling for the servers. These facilities are widely usedfor applications such as the hosting of web services or HighPerfomance Computing.
In recent years, the size of datacenters is ever increasing,which leads to new challenges such as designing fault tolerantsoftware to manage at large scale the servers and energymanagement of server rooms. On the latter challenge, manyresearch efforts have been conducted [1] [2], most of themfocusing on the implementation of on demand power man-agement systems, such as Dynamic voltage scaling (DVFS)[3] [4] and vary-on vary-off (VOVO) [5] [6]. Some workhas been made to extend existing scientific testbeds withpower monitoring of experiments : for example Kwapi [7]enables researchers to track the power consumption of theirexperiments conducted on Grid’5000.
On the other hand, the thermal management of servershas been less explored, a large part of the existing workconsidering only simulations [8]. This can be explained, partly,by the difficulty of conducting experiments involving thermalmonitoring of servers : to ensure that data recorded experimen-tally is valid, experimentions must be conducted on a testbedthat contains many temperature sensors, not only positionnedon cooling systems, but also at the front and the back of eachserver of racks.
In addition, such a testbed must enable reproducible ex-perimentations, by providing its users with a full control onexperimental conditions of their experiments and by exposingits data in a non misleading way, via a well documented API(Application Programming Interface).
Finally, as power management and temperature manage-ment of servers are related problems [9], there is a need for atestbed that enables users to access to both thermal and powerdata of servers.
As far as we know, there is no public testbed that enablesresearchers to work on both power and thermal aspects ofservers functionning. The objective of the SeDuCe project isto propose such a testbed : SeDuCe testbed enables its usersto use, in the context of the ecotype cluster integrated in theGrid’5000 infrastructure [10], 48 servers located in 5 airtightracks with a dedicated central cooling system (CCS) positionedinside one of the rack. In parallel of conducting the experimentby leveraging the tools provided by Grid’5000, users can getaccess to thermal and power data of the testbed via a web portaland a user-friendly API. Stability of experimental conditions isguaranteed by hosting the testbed in a dedicated room equippedwith a secondary cooling system (SCS) that enables a precisethermo-regulation of the environment outside the cluster. Asresources of the testbed are made publicly available via theGrid’5000 infrastructure, all its users will be able to performreproducible research on thermal and power management ofservers.
II. TESTBED DESIGN
A. Ecotype : a Grid’5000 cluster dedicated to the study ofpower and thermal management of servers
We have built the ecotype cluster, which is composed of48 servers and has been designed for research related to powerand thermal management in datacenters. The ecotype cluster isintegrated in the Grid’5000 infrastructure and is made availableto any of its users : they can reserve servers of the ecotypecluster and conduct experiments on them by using the usualGrid’5000 tools. Meanwhile they can access in real time toinformation regarding the temperature of the servers involvedin their experiments, and get the power consumption of anyparts of the testbed (servers, switches, cooling systems, ...).
Each server of the ecotype cluster is a DELL PowerEdgeR630 that contains a pair of Intel Xeon E5-2630L v4 CPUs (10cores, 20 threads per CPU), 128GB of RAM, and 400GB SSD.The CPUs have been designed to have a power consumptionthat is lower than other CPUs of the XEON 26XX serie, with athermal design power (TDP) of 55W. Each server is connected

via two 10GBe links to the Grid’5000 production network, andvia a single 1GBe link to the Grid’5000 management network.Additionally, each server is certified to work in environmentswhere temperature can be up to 35°C.
The cluster is composed of 5 Racks (Z1, Z2, Z3, Z4,Z5) and, as shown on Figure 1, one rack (Z3) is in chargeof cooling the cluster by hosting a dedicated central coolingsystem (CCS), while remaining racks are computing racks andare dedicated to hosting servers.
As depicted by Figure 1, computing racks host 12 servers,following two layouts of server positions : one layout whereservers are organised in a concentrated way with no verticalspace between servers (Z1 and Z2), and a second layout whereservers are spaced at 1U intervals (Z4 and Z5).
We have deliberately chosen to use these two layouts : theywill enable to study the impact of a layout on the temperatureand the power consumption of servers.
In addition to servers, the cluster contains three networkswitches that are in charge of connecting servers to productionand management networks of the Grid’5000 testbed. Threeracks (Z2, Z4, Z5) are hosting each a network switch.
The cluster has also been designed to leverage “SchneiderElectric IN-ROW” racks that create an inside airtight environ-ment for servers, and guarantee that the environment outsidethe cluster has a limited impact on temperatures inside theracks. The temperature inside the cluster is regulated by centralcooling system (CCS), connected to a dedicated managementnetwork, which implements an SNMP service that enables toremote control the cooling and to access its operating data.
In addition, the temperature outside the cluster is regulatedby a secondary cooling system (SCS) which is mounted fromthe ceiling of the server room : the SCS is in charge ofmaintaining a constant temperature in the server room.
Finally, we have installed Airflow management panelsbetween servers, in order to separate the air of the hot aislefrom the air of the cold aisle.
B. Power Monitoring
Each element composing the cluster (servers, networkswitches, fans, condensators, ...) is electrically monitored, andits power consumption is recorded every second in a database.
Electrical plugs of servers and network switches are con-nected to power distribution units (PDUs), which in turn sharepower consumption of servers and network switches via adedicated service network. Each computing racks contains twoPDUs, and each server of a computing rack has two electricalplugs. As depicted in Figure 2, the electrical plugs of a serverare connected to two different PDUs, which enables servers tohave electrical redundancy. The power consumption of eachplug of a server can be fetched by issuing an SNMP requestto the PDU it is connected.
In a similar way, energy consumption of the CCS can befetched by requesting its SNMP service. This SNMP serviceis able to provide an overall power consumption of the CCSand also the power consumption of each internal part such asthe condensator or the fans. The SCS does not implement anybuilt-in networking access, and thus cannot share its metricswith any component over a network. To solve this problem, we
Figure 1. Layout of the ecotype cluster (front view)PDU 1 PDU 2
Temperature Sensor
Electrical plug
Bus (1wire)Scanner(wifi arduino)
Server
Power distribution unit
Figure 2. Back view of a server rack
instrumented several parts of the SCS by using a Fluksometer 1
: a Fluksometer is a connected device that can monitor severalelectrical metrics (power consumption, voltage, amperage, ...)and expose their values over a network via a web-service.
Finally, we have added an additional system that tracksoverall power consumption of both servers and the CCS. Thisadditional system is based on the Socomec G50 meteringboard 2, an electronic board that can measure in real timethe power consumption of several electrical plugs. We use theSocomec G50 for checking that the aforementioned source ofpower consumption data are sound. These additional metricsare fetched by using the modbus protocol.
1https://www.flukso.net/about2https://www.socomec.com/range-communication-interfaces en.html?
product=/diris-g en.html

C. Temperature Monitoring
In order to track the thermal behavior of the ecotype cluster,each server is monitored by a pair of temperature sensors : onesensor is positioned at the front of the server (in the cold aisle)and another sensor is positioned at the back of the server (inthe hot aisle).
As depicted by Figure 2, each temperature sensor is amember of a bus (based on the 1wire protocol) connected toa Scanner (implemented by using a wifi arduino) in charge ofgathering data from the temperature sensors of the bus. As thefront and the back of each server is monitored by temperaturesensors, computing racks have in total two Scanners and twobuses : a front bus for monitoring the cold aisle and a back busdedicated to the hot aisle. Scanners fetch temperatures fromtheir sensors at a frequency of one reading per sensor everysecond.
For a first version of the SeDuCe testbed, we have chosento use the DS18B20 sensor, a temperature sensor produced by“Maxim Integrated” 3 that costs approximately 3$. Accordingto the specifications provided by its constructor, this sensoris able to provide a temperature reading every 750ms with aprecision of 0.5°C between -10 °C and 85 °C.
The key feature of the DS18B20 sensor is that it is able towork as part of an 1wire bus. In the context of the SeDuCeinfrastructure, 12 DS18B20 sensors are connected together toform an 1wire bus, and a Scanner, an nodeMCU arduino withbuilt-in wifi capabilities, fetches periodically their temperaturereadings. The current version of the firmware used by Scannersscans an 1wire bus every seconds, and then pushes temperaturedata to a Temperature Registerer service, as illustrated inFigure 3.
We also developed a contextualisation tool to generatefirmwares for the Scanners. It leverages the PlatformIO frame-work to program a Scanner that pushes data to a web-service.Using this contextualisation tool is simple : a developer needsto define a program template in a language close to C languageand marks some parts of code with special tags to indicatethat these parts need to be contextualized with additionalinformation, such as initializing a variable with the ID of aScanner device or with the address of a remote web-service(such as the one that will receive temperature records). Thecontextualisation tool takes this program and a context asinput parameters, analyses the template program, and com-pletes parts that requires contextualisation with informationprovided in the context, which results in valid C languagesource file. Then, the firmware is compiled and automaticallyuploaded to Scanners via their serial ports. By leveraging thiscontextualisation tool, we can remotely configure Scanners andupdate their firmware.
D. Seduce portal
To help users to easily access power and thermal metricsgenerated by the SeDuCe testbed, we developed a platformthat exposes publicly two components : a web portal 4 and adocumented API 5 (Application Programming Interface).
3https://datasheets.maximintegrated.com/en/ds/DS18B20.pdf4https://seduce.fr5https://api.seduce.fr/apidocs
SeDuCe portal
InfluxDB
Power Consumption
CrawlersTemperatureRegisterer
Power sensors Scanners (wifi arduino)
APIUsers Scripts
polling pushing
Figure 3. Architecture of the SeDuCe portal
As illustrated by Figure 3, the web portal and the API fetchdata from a time series database (TSDB) based on InfluxDB 6.InfluxDB enables to store a large quantity of immutable timeseries data in a scalable way. In the background, InfluxDBcreates aggregates of data by grouping periodically data froma same series. These aggregated sets of data enable the webportal to promptly load data used for visualization.
Two kind of components are in charge of inserting datain the database : the Power consumption crawlers and theTemperature Registerer. Power consumption crawlers are pro-grams that are in charge of polling data from PDUs, Socomecs,Fluksometer, the CCS and the SCS. In turn, this data is insertedin the database. On the other hand, the Temperature Registereris a web service that receives temperature data pushed fromnodeMCU arduino devices, and inserts it in the database.
The web portal and the API are both written in Pythonand leverage the “Flask” micro web framework. The APIcomponent makes an extensive use of the Swagger framework7 which automatises the generation of complete REST webservices and their documentations from a single descriptionfile (written in JSON or YAML). This choice has enabled usto focus on the definition and the implementation of the API,by reducing the quantity of required boilerplate code.
All the components depicted in Figure 3 are implementedas micro-services. Our system is able to register 200 metricsper seconds with minimal hardware requirements (it is cur-rently hosted on a single computer). In the case we add moresensors to our testbed, it is likely that the existing componentswould be sufficient. In the case that one of the componentwould not be able to cope with the additional workload, itwould be easy to setup an high availability approach by usinga load balancer such as the Nginx web-server that can forwardrequests to a pool of instances of the component.
III. EVALUATING THE DS18B20 SENSOR
In this section we evaluate the behaviour of the DS18B20sensor in order to evaluate its fitness to the thermal measure-ment of the heat dissipated by servers.
A. Experimental SetupThe performance evaluation of the DS18B20 can be made
regarding two criteria : the precision the temperature it reports,and its response time. The precision of a sensor corresponds tothe difference between the reported temperature and the actual
6https://www.influxdata.com/7https://swagger.io/
temperature (usually it is estimated by a calibrated referencethermometer). On the other hand, the response time of a sensorcorresponds to the time taken by the temperature reported bythe sensor to converge to the reference temperature.
The evaluation of these two parameters requires an ex-perimental environment and the definition of an experimentalprotocol.
To ensure that the validation of the DS18B20 sensoris based on reliable data, we used an Hart Scientific 7103microbath which contained a silicon oil maintained at a spec-ified homogeneous temperature. The temperature inside themicrobath was controlled by two thermometers (a PT100 probeand a Hart Scientific 1502A). We conducted two experiments :a first experiment to evaluate the precision of the temperaturesreported by DS18B20 sensors, and a second experiment toevaluate the reaction time of DS18B20 sensors.
B. Sensor precision
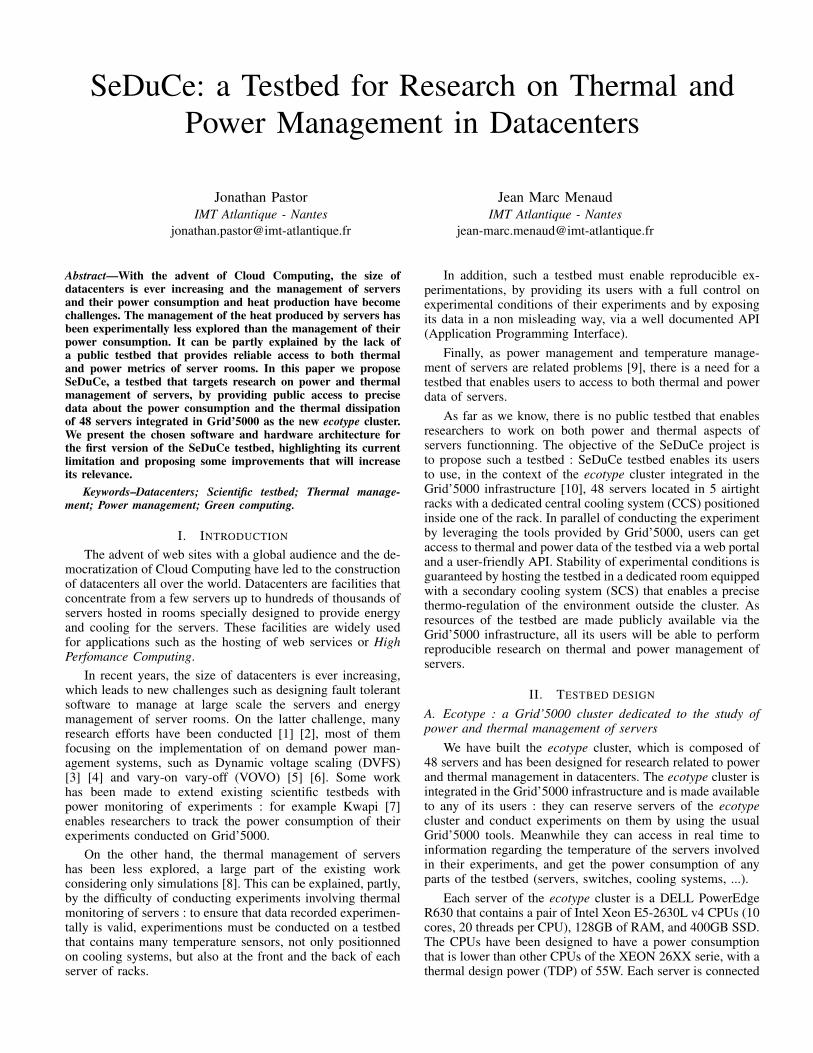
Target Sensors
Sensor 1 Sensor 3 Sensor 3 Sensor 4 Sensor 510 °C 10.86 ± 0.05 10.24 ± 0.03 10.06 ± 0.06 10.91 ± 0.05 10.13 ± 0.0220 °C 20.75 ± 0.00 20.00 ± 0.02 19.98 ± 0.05 20.86 ± 0.04 20.00 ± 0.0030 °C 30.74 ± 0.04 29.93 ± 0.07 29.91 ± 0.06 30.82 ± 0.06 29.97 ± 0.0640 °C 40.72 ± 0.05 39.81 ± 0.06 39.87 ± 0.05 40.77 ± 0.06 39.92 ± 0.0750 °C 50.72 ± 0.05 49.75 ± 0.07 49.85 ± 0.06 50.75 ± 0.07 49.89 ± 0.0860 °C 60.76 ± 0.03 59.76 ± 0.05 59.88 ± 0.03 60.79 ± 0.06 59.93 ± 0.0670 °C 70.83 ± 0.06 69.79 ± 0.06 69.92 ± 0.06 70.86 ± 0.03 69.99 ± 0.04
TABLE I. Comparison of 5 DS18B20 sensors (mean temperature ± standarddeviation)
To evaluate the precision of DS18B20 sensors, we plunged5 sensors into a silicon oil configured to be at a precisetarget temperature. Once the temperature of the silicon oil isstabilized, we measured the temperatures reported by the 5DS18B20 sensors during 20 minutes. The target temperaturewas initially set at 10 °C, and incrementally increased by stepsof 10 °C.
Table I summarizes the temperatures reported by DS18B20sensors at each step of temperature.
First, it is noticeable that for each targeted temperature,the average temperature reported by a DS18B20 sensor is ina range of 1°C band around the target temperature. While thisvalue is higher than the 0.5°C advertised by the manufacturer,it should be relativised : when the target temperature is set to20°C the difference between the worst sensor and the referencetemperature is less than 5%, and at 50°C it becomes lower than2%. These results should also be put in the perspective of theprice range of DS18B20 sensors (approximately 3$ per unit).
Second, it appears that for a given sensor, the differencebetween the reported temperature and the reference tempera-ture is stable for any temperature steps. Thus, by comparingseveral temperature records of a DS18B20 sensor with those ofa reference thermometer (such as the one we used to stabilizethe silicon oil), it would be possible to modelise the differencebetween the temperature reported by the sensor and the refer-ence temperature. This would enable the implementation of acalibration mechanism that will be in charge of correcting thedifference between the reported temperature and the referencetemperature.
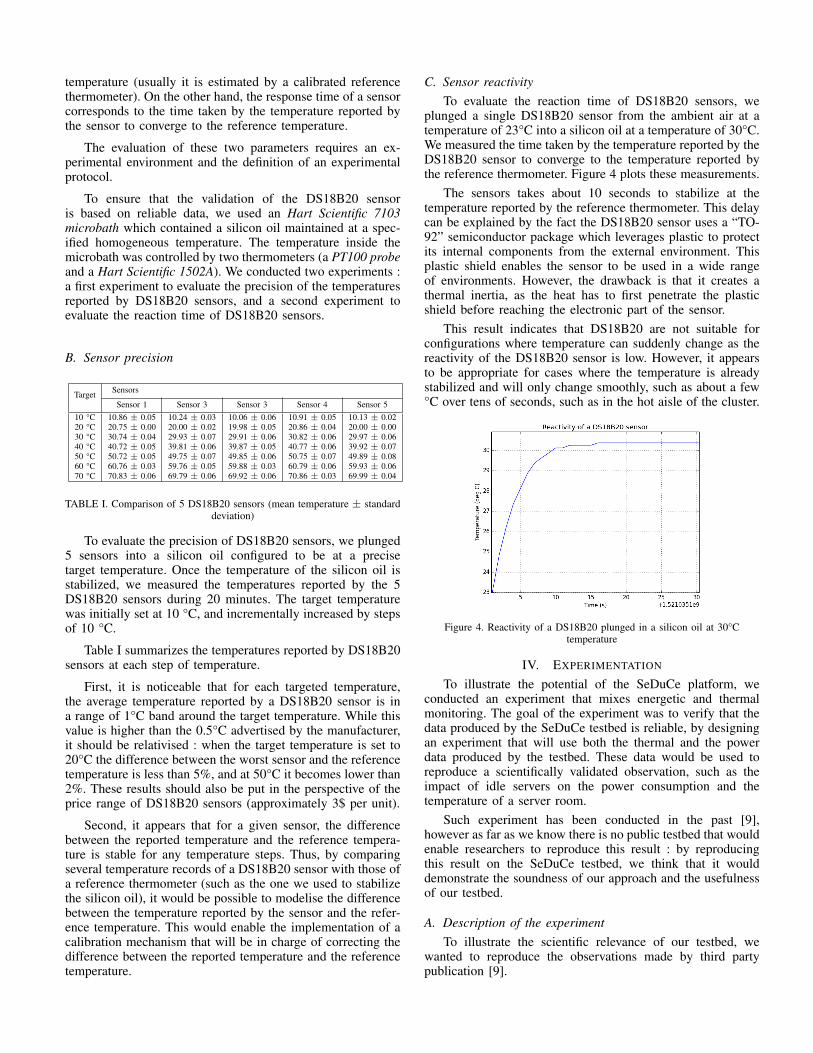
C. Sensor reactivityTo evaluate the reaction time of DS18B20 sensors, we
plunged a single DS18B20 sensor from the ambient air at atemperature of 23°C into a silicon oil at a temperature of 30°C.We measured the time taken by the temperature reported by theDS18B20 sensor to converge to the temperature reported bythe reference thermometer. Figure 4 plots these measurements.
The sensors takes about 10 seconds to stabilize at thetemperature reported by the reference thermometer. This delaycan be explained by the fact the DS18B20 sensor uses a “TO-92” semiconductor package which leverages plastic to protectits internal components from the external environment. Thisplastic shield enables the sensor to be used in a wide rangeof environments. However, the drawback is that it creates athermal inertia, as the heat has to first penetrate the plasticshield before reaching the electronic part of the sensor.
This result indicates that DS18B20 are not suitable forconfigurations where temperature can suddenly change as thereactivity of the DS18B20 sensor is low. However, it appearsto be appropriate for cases where the temperature is alreadystabilized and will only change smoothly, such as about a few°C over tens of seconds, such as in the hot aisle of the cluster.
Figure 4. Reactivity of a DS18B20 plunged in a silicon oil at 30°Ctemperature
IV. EXPERIMENTATION
To illustrate the potential of the SeDuCe platform, weconducted an experiment that mixes energetic and thermalmonitoring. The goal of the experiment was to verify that thedata produced by the SeDuCe testbed is reliable, by designingan experiment that will use both the thermal and the powerdata produced by the testbed. These data would be used toreproduce a scientifically validated observation, such as theimpact of idle servers on the power consumption and thetemperature of a server room.
Such experiment has been conducted in the past [9],however as far as we know there is no public testbed that wouldenable researchers to reproduce this result : by reproducingthis result on the SeDuCe testbed, we think that it woulddemonstrate the soundness of our approach and the usefulnessof our testbed.
A. Description of the experimentTo illustrate the scientific relevance of our testbed, we
wanted to reproduce the observations made by third partypublication [9].

In [9], authors have highlighted an interesting fact : in adatacenter idle servers (i.e. servers that are turned on while notbeing used to execute any workload) have a significant impacton power consumption and heat production. We decided to tryto reproduce this observation.
For this experiment, servers of the ecotype cluster aredivided in three sets of servers:
• Active servers: servers with an even number (ecotype-2, ecotype-4, ..., ecotype-48) were executing a bench-mark that generates a CPU intensive workload.
• Idle servers: a defined quantity (0, 6, 12, 18, 24servers) of servers with an odd number (ecotype-1,ecotype-3, ..., ecotype-47) was remaining idle.
• Turned-off servers: remaining servers were electricallyturned off.
and during one hour we recorded the power consumptionof the CCS and the average temperature in the hot aisle of theecotype cluster. The CPU intensive workload was based on the“sysbench” tool : the goal was to stress CPUs of each servers,resulting in an important power consumption and a biggerdissipation of heat. To guarantee the statistical significanceof the measurements, each experimental configuration wasrepeated 5 times, leading to a total number of 25 experiments.
We executed two sets of experiments : one with the SCSturned-on (Figure 5) and the other while the SCS was turnedoff (Figure 6). The objective of turning off the SCS was toidentify the impact of the SCS over the CCS.
B. Results
Figure 5 plots the cumulated power consumption of theCCS and the average temperature in the hot aisle of the clusterwith the SCS enabled.
First, it is noticeable that as the number of idle nodesincreases, both the energy consumed by the SCS and thetemperature in the hot aisle of the rack increase. This can beexplained by the fact that an idle node consumes some energyand produces some heat, which increases the workload of theCCS.
The second element highlighted by Figure 5 is that theimpact of idle nodes is not linear : the red line representingthe CCS consumption follows an exponential pattern and theblue line representing the average temperature in the hot aislefollows a sigmoid pattern. The exponential pattern of the powerconsumption of the CCS can be explained by the fact thatthe heat produced by a given server has an impact on thetemperature of surrounding servers, which causes the creationof “hot-spots”. These hot-spots are difficult to cool down, andthey increase the needs in terms of cooling. As the temperatureof hot spots is higher that the average temperature in racks,when a sensors of the CCS detects an hot-spot, it leads theCCS to work intensively and more frequently to reduce thehot-spot. On the other hand, the sigmoid pattern of the averagetemperature in the hot aisle is explained by the fact thatthe CCS has its own monitoring of the temperature insideracks, and when temperatures at the back of servers reach athreshold, the CCS works more frequently and intensively tomake the average temperature back under a specific threshold,thus attenuating the increase of the temperature in the hot aisle.
Figure 6 plots the cumulated power consumption of theCCS and the average temperature in the hot aisle of the clusterwhile the SCS is disabled. This figure highlights that thepower consumption of the CCS is lower when the SCS isdisabled. This can be explained by the fact that the SCS wasconfigured to maintain a temperature of 19 °C in the outsideroom, which corresponds to the maximum temperature targetof the CCS : the outside air, by means of thermal conduction,contributes to warm the air inside the racks at a temperaturethat activates the CCS. As a consequence, it increases the needsin term of cooling inside the cluster, leading to an higher powerconsumption of the CCS.
This experimental campaign has shown that idle servershave an important impact on the power consumption of coolingsystems and overall racks temperature, thus it confirms theobservation made in this publication [9].
Figure 5. Central cooling consumption and average temperature in the hotaisle (SCS enabled)
Figure 6. Central cooling consumption and average temperature in the hotaisle (SCS disabled)
C. Increasing the reactivity of temperature sensorsWhile being suitable for monitoring temperatures in the hot
aisle of our cluster, we have noticed that DS18B20 sensorswere experiencing difficulties track the sudden temperaturechanges that occur in the cold aisle when CCS is active. Figure7 compares a DS18B20 sensor and with several thermocouplebased sensors, one based on the Graphtec GL 220, and twothermocouples based on the MAX31850K card, all positionedin the cold aisle at the front of the “ecotype-42” server,and recording temperatures during a typical instance of theCCS workload. We used the GL 220 to define a referencetemperature in the cold aisle. At t=80s, the CCSs just finishedcooling the cold aisle, thus the temperature has reached its

Figure 7. Comparison between DS18B20 and thermocouples
lowest level and is going to increase. The CCS restarts tocool the cluster at t=180s. It is noticeable that the temperaturemeasured by the thermocouple based sensor drops significantlyafter few seconds, while the DS18B20 sensor measures atemperature that is falling gradually over a hundred of seconds.Even worse, we can see at t=430s that the minimal temperaturemeasured by the DS18B20 sensor does not correspond tothe minimal temperature reported by the thermocouple basedsensors, but rather to the intersection between its decreasingmeasured temperature and the increasing temperature mea-sured by thermocouples. We explain this observation by thethermal design of the DS18B20 : as stated in Section III-Cit leverages the “TO-92” semiconductor package which leadsto a significant thermal inertia in air environment. On theother hand, thermocouple based sensors have a better reactivity: they can reactively track the decrease of temperature. Itis also noticeable that the temperature reported by the twoMAX31850K board are very close to the reference temperaturereported by the GL 220. However, the two MAX31850K weused were embedded on the ADA1727 board, manufacturedby Adafruit, which has a unit cost of 14.95$. In Section V wewill study an approach that enables to reduce the unit cost ofMAX31850K thermocouples.
V. FUTURE WORK
Figure 8. Prototype of the SeDuCe board
In Section IV-C, the potential of thermocouple basedsensors for reactive temperature measurements has been high-lighted. For the second version of the SeDuCe testbed, we havestudied the replacement of DS18B20 sensors by thermocouplesensors based on the MAX31850K which is compatible withthe 1wire protocol. However, the most popular electronic cardfeaturing the MAX31850K, the ADA1727 board manufacturedby Adafruit, costs 15$, which 5 times more expensive than theDS18B20, and it only features a single thermocouple channel.
We have designed our own electronic board to reduce thecost of using many thermocouple based sensors. Figure 8
depicts our SeDuCe board, which features 16 thermocoupleschannels, based on 16 MAX31850K chips connected via an1wire bus. We have added 2 lines of pin female headers forpluggin a nodeMCU Arduino, and a micro USB port thatsupplies the board and the Arduino with electricity.
VI. CONCLUSION
In this article we have presented our initial work onbuilding the SeDuCe testbed, which targets research relatedto power and thermal management in datacenters. We havedescribed the architecture of the testbed, which is built onbuses of sensors, storage of power and thermal metrics in atime series oriented database (InfluxDB) and an user friendlyweb portal and a documented API. We have also detailed thecomponents used in this first version of the SeDuCe testbed,and their limitations such as the lack of reactivity of theDS18B20 sensor, a low cost temperature sensor that showsits limits in situation where temperature changes suddendly.However, this model of sensor remains relevant in a largenumber of situations. Future work on this first version of theSeDuCe testbed will mainly focus on evaluating more reactivetemperature sensors. We are thinking to replace all or a partof the existing sensors by thermocouple based sensors, whosemain advantages are that they are more reactive and moreprecise while remaining affordable.
REFERENCES[1] F. Hermenier, X. Lorca, J.-M. Menaud, G. Muller, and J. Lawall,
“Entropy: a consolidation manager for clusters,” in Proceedings ofthe 2009 ACM SIGPLAN/SIGOPS international conference on Virtualexecution environments. ACM, 2009, pp. 41–50.
[2] E. Feller, L. Rilling, and C. Morin, “Energy-aware ant colony basedworkload placement in clouds,” in Proceedings of the 2011 IEEE/ACM12th International Conference on Grid Computing. IEEE ComputerSociety, 2011, pp. 26–33.
[3] G. Von Laszewski, L. Wang, A. J. Younge, and X. He, “Power-awarescheduling of virtual machines in dvfs-enabled clusters,” in ClusterComputing and Workshops, 2009. CLUSTER’09. IEEE InternationalConference on. IEEE, 2009, pp. 1–10.
[4] C.-M. Wu, R.-S. Chang, and H.-Y. Chan, “A green energy-efficientscheduling algorithm using the dvfs technique for cloud datacenters,”Future Generation Computer Systems, vol. 37, 2014, pp. 141–147.
[5] E. Pinheiro, R. Bianchini, E. V. Carrera, and T. Heath, “Dynamic clusterreconfiguration for power and performance,” in Compilers and operatingsystems for low power. Springer, 2003, pp. 75–93.
[6] J. S. Chase, D. C. Anderson, P. N. Thakar, A. M. Vahdat, and R. P.Doyle, “Managing energy and server resources in hosting centers,”ACM SIGOPS operating systems review, vol. 35, no. 5, 2001, pp. 103–116.
[7] F. Clouet, S. Delamare, J.-P. Gelas, L. Lefevre, L. Nussbaum, C. Parisot,L. Pouilloux, and F. Rossigneux, “A unified monitoring frameworkfor energy consumption and network traffic,” in TRIDENTCOM-International Conference on Testbeds and Research Infrastructures forthe Development of Networks & Communities, 2015, p. 10.
[8] H. Sun, P. Stolf, and J.-M. Pierson, “Spatio-temporal thermal-awarescheduling for homogeneous high-performance computing datacenters,”Future Generation Computer Systems, vol. 71, 2017, pp. 157–170.
[9] J. D. Moore, J. S. Chase, P. Ranganathan, and R. K. Sharma, “Makingscheduling” cool”: Temperature-aware workload placement in datacenters.” in USENIX annual technical conference, General Track, 2005,pp. 61–75.
[10] R. Bolze, F. Cappello, E. Caron, M. Dayde, F. Desprez, E. Jeannot,Y. Jegou, S. Lanteri, J. Leduc, N. Melab et al., “Grid’5000: A large scaleand highly reconfigurable experimental grid testbed,” The InternationalJournal of High Performance Computing Applications, vol. 20, no. 4,2006, pp. 481–494.