
SEDS - Industrial Sector
14
SEDS - Industrial Sector Joseph M. Roop Olga V. Livingston Pacific Northwest National Laboratory
-
Upload
rina-guthrie -
Category
Documents
-
view
24 -
download
0
description
SEDS - Industrial Sector. Joseph M. Roop Olga V. Livingston Pacific Northwest National Laboratory. Industrial Sector in Context of SEDS. Converted Energy. Primary Energy. Macroeconomics. End-Use. Biomass. Biofuels. Buildings. Coal. Electricity. Heavy Transportation. - PowerPoint PPT Presentation
Transcript of SEDS - Industrial Sector
SEDS - Industrial Sector
Joseph M. Roop
Olga V. Livingston
Pacific Northwest National Laboratory
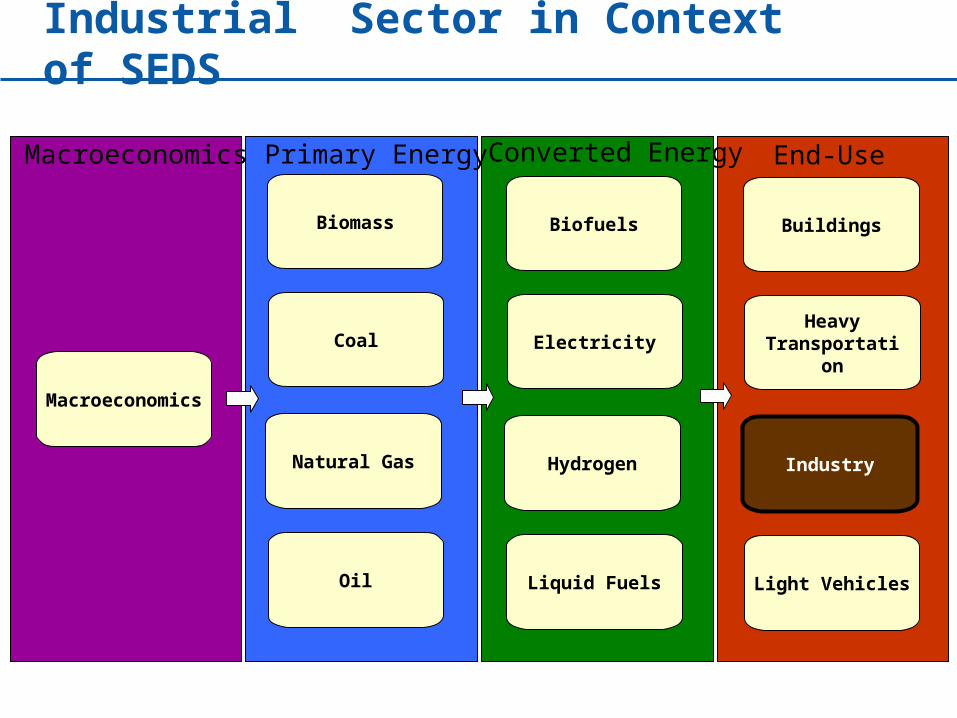
Industrial Sector in Context of SEDS
Macroeconomics
Biomass
Coal
Natural Gas
Oil
Biofuels
Electricity
Hydrogen
Liquid Fuels
Buildings
Heavy Transportation
Industry
Light Vehicles
Macroeconomics Converted EnergyPrimary Energy End-Use
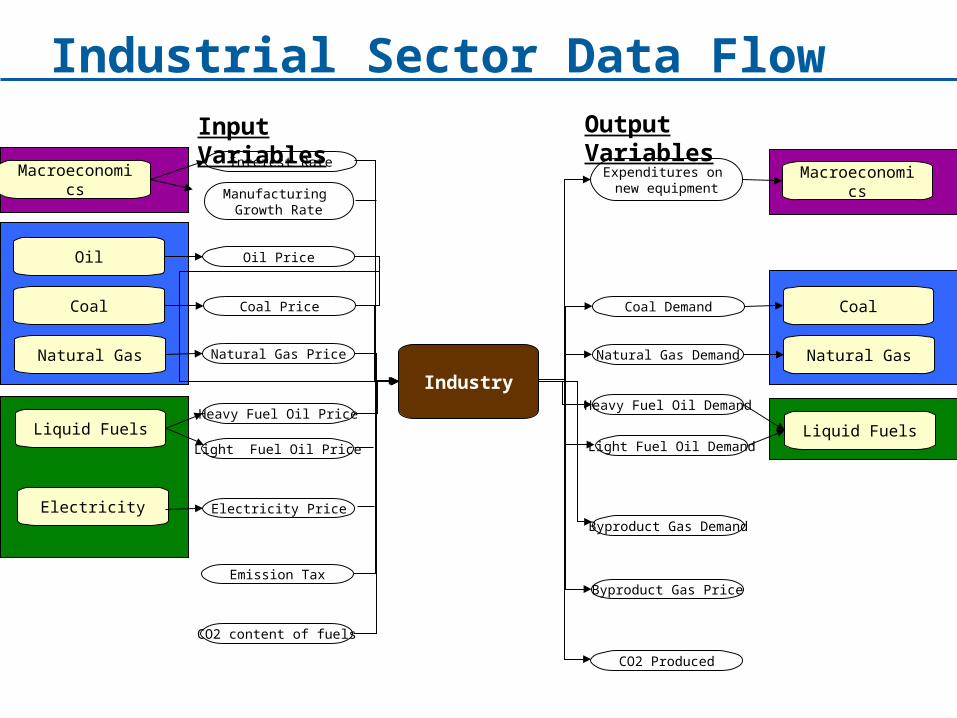
Industrial Sector Data Flow
Macroeconomics
Coal
Natural Gas
Liquid Fuels
Industry
Liquid Fuels
Oil
Coal
Natural Gas
Oil Price
Natural Gas Price
Emission Tax
Coal Price
Heavy Fuel Oil Price
Interest RateMacroeconomic
sExpenditures on new equipment
Coal Demand
Byproduct Gas Price
Natural Gas Demand
Heavy Fuel Oil Demand
CO2 Produced
Input Variables Output Variables
Manufacturing Growth Rate
Light Fuel Oil Price
Electricity Electricity Price
CO2 content of fuels
Light Fuel Oil Demand
Byproduct Gas Demand
Major Components of Industrial SectorProcesses
HVAC
Light
Steam
Compressors
Pumps Motors (shaft drive)
Weighted electricity cost per unit ofshaft drive requirement
DemandModule OP
DemandModule PH
DemandModule EC
DemandModule PR
DemandModule SH
DemandModule SC
DemandModule IND
Demand ModuleMOT5
Demand ModuleMOT6
DemandModule BL
DemandModule CO
Demand ModuleMOT1
Demand ModuleMOT2
Demand ModuleMOT3
Demand ModuleMOT4
Auxiliary servicerequirement
Shaft driverequirement
Subtotal fueldemanded
Subtotal electricitygeneration by cogenerators
Total electrgenerated
TOTAL FUELDEMANDED
Energy Demand
Demand ModuleDD
Demand ModuleFAN
Demand ModuleCON
Demand ModuleCPRS1
Demand ModuleCPRS2
Demand ModulePUMS1
Demand ModulePUMS2
Demand ModulePUMS3
Demand ModulePUMS4
Demand ModulePUMS5
Demand ModulePUMS6
Capitalexpenditures
CO2tracking
Efficiencymetric
Total output
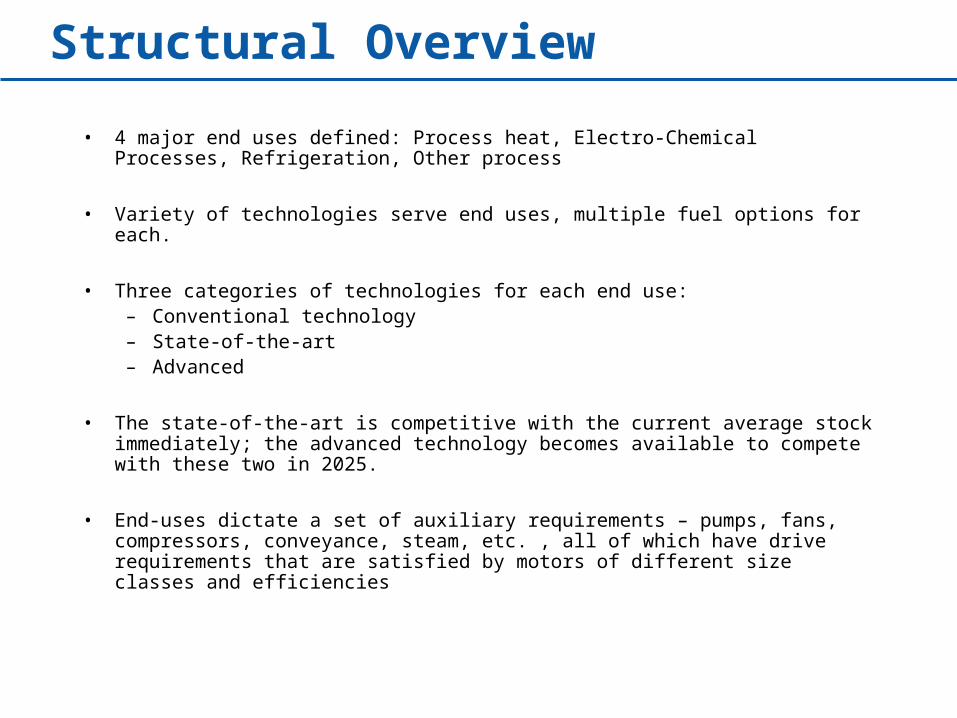
Structural Overview
• 4 major end uses defined: Process heat, Electro-Chemical Processes, Refrigeration, Other process
• Variety of technologies serve end uses, multiple fuel options for each.
• Three categories of technologies for each end use:– Conventional technology– State-of-the-art – Advanced
• The state-of-the-art is competitive with the current average stock immediately; the advanced technology becomes available to compete with these two in 2025.
• End-uses dictate a set of auxiliary requirements – pumps, fans, compressors, conveyance, steam, etc. , all of which have drive requirements that are satisfied by motors of different size classes and efficiencies
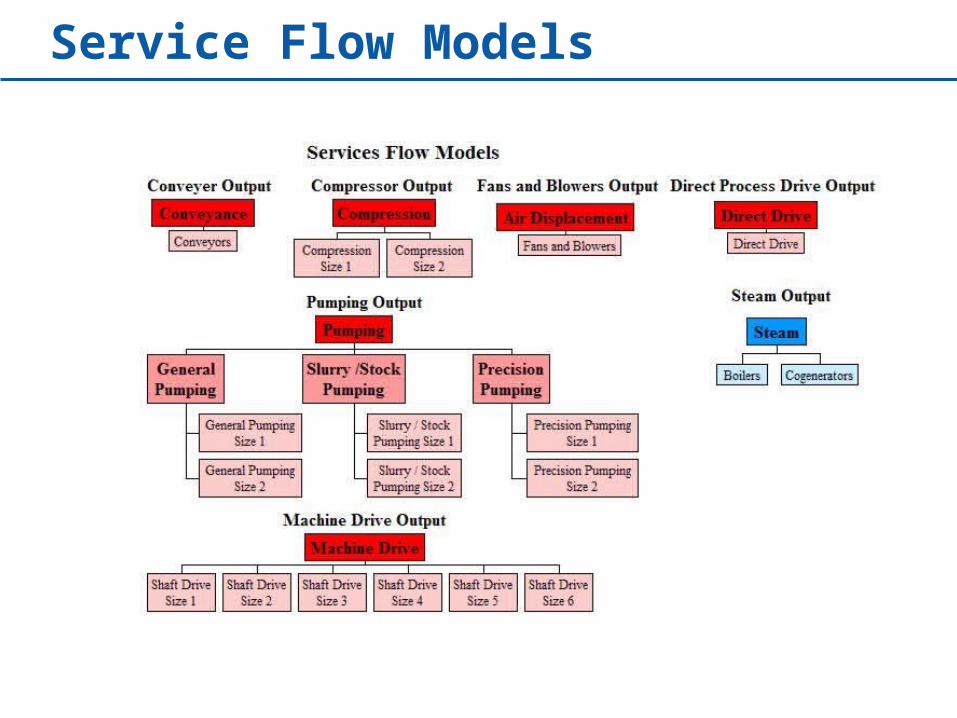
Service Flow Models
Major Assumptions
• Capital costs, operating and maintenance costs, and performance characteristics for all the auxiliary equipment are drawn from the CIMS-US data base, and are currently being updated.
• The major end-use categories that were defined are gross representations of averages of equipment contained in the CIMS data base, but themselves have no real-world technology equivalent.
• Where special studies have been conducted, the estimated parameter for the logit function is used. Otherwise, the default value is based on rule-of-thumb that a 15% cost differential captures 80% of the market share for new equipment.
• This module is a representation of the U. S. Manufacturing sector, thus it is both national in scope and lacks both regional and industry detail.
• The model is currently incapable of describing the introduction of a major new industry specific technology, such as an innovative substitute for the electric-arc furnace used in steelmaking, or a energy-saving option for the firing of black liquor in the pulp industry.
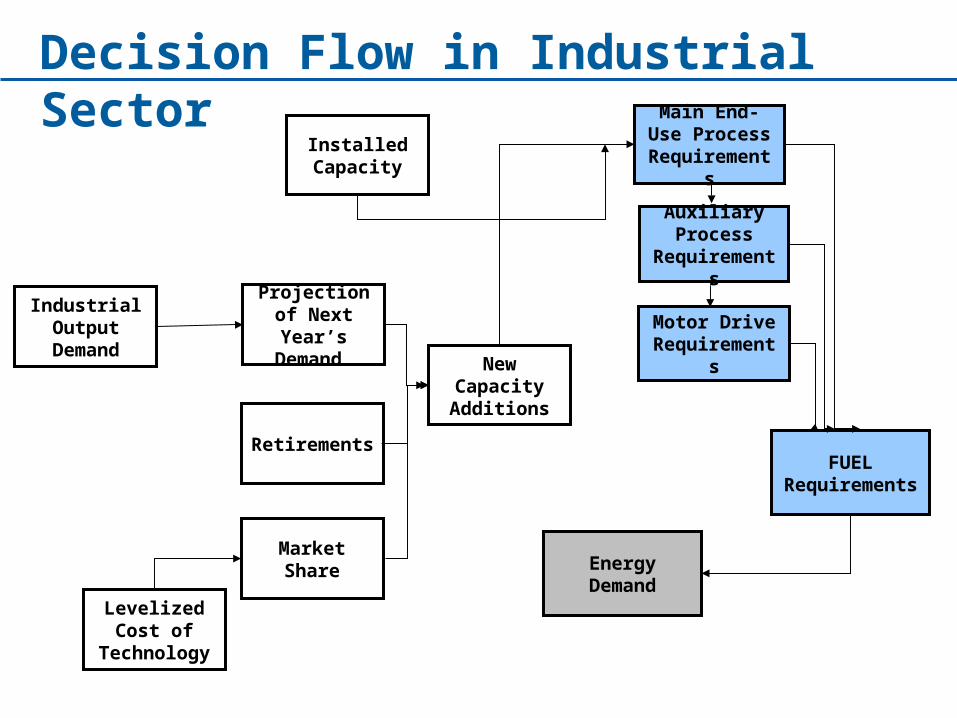
Decision Flow in Industrial Sector
Industrial Output
Demand
Projection of Next Year’s
Demand
Installed Capacity
Main End-Use Process
Requirements
Levelized Cost of
Technology
Market Share
Retirements
New Capacity Additions
Auxiliary Process
Requirements
Motor Drive Requirements
FUEL Requirements
Energy Demand
Sources of Data
• Output, energy use, and technology stocks calibrated to Manufacturing Energy Consumption Survey (MECS) data for 2002, then simulated and benchmarked to 2005 Annual Energy Outlook.
• This version of the industrial sector of SEDS was constructed from an aggregate model of the U. S. Manufacturing sector developed as part of the CIMS-US model.
– Integrated economic model of the energy produced and used in the United States.
– Developed in conjunction with the Energy and Materials Research Group at Simon Fraser University, British Columbia, Canada.
• R&D impact on fuel intensity– Intensity improvements computed from ITP energy savings estimates. – Detailed spreadsheets with savings estimates for each fuel type – Developed as part of annual benefits estimation for ITP by Energetics, Inc.
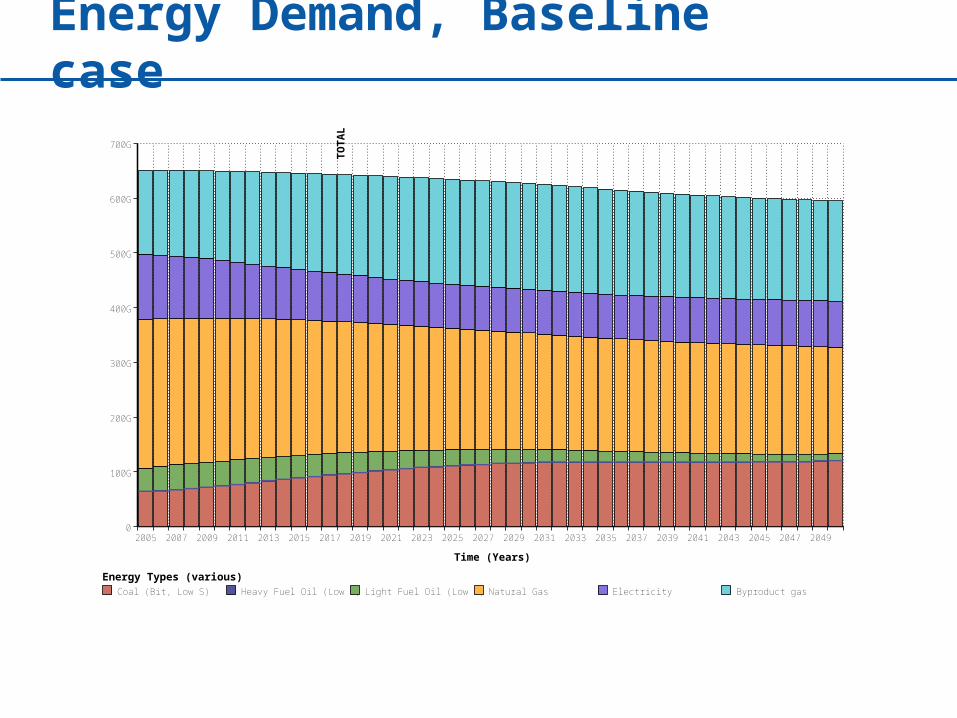
Energy Demand, Baseline case
2005 2007 2009 2011 2013 2015 2017 2019 2021 2023 2025 2027 2029 2031 2033 2035 2037 2039 2041 2043 2045 2047 20490
100G
200G
300G
400G
500G
600G
700G
Time (Years)
TO
TA
L F
UE
L D
EM
AN
DE
D (
Wa
tts)
Energy Types (various)Coal (Bit, Low S) Heavy Fuel Oil (Low S) Light Fuel Oil (Low S) Natural Gas Electricity Byproduct gas
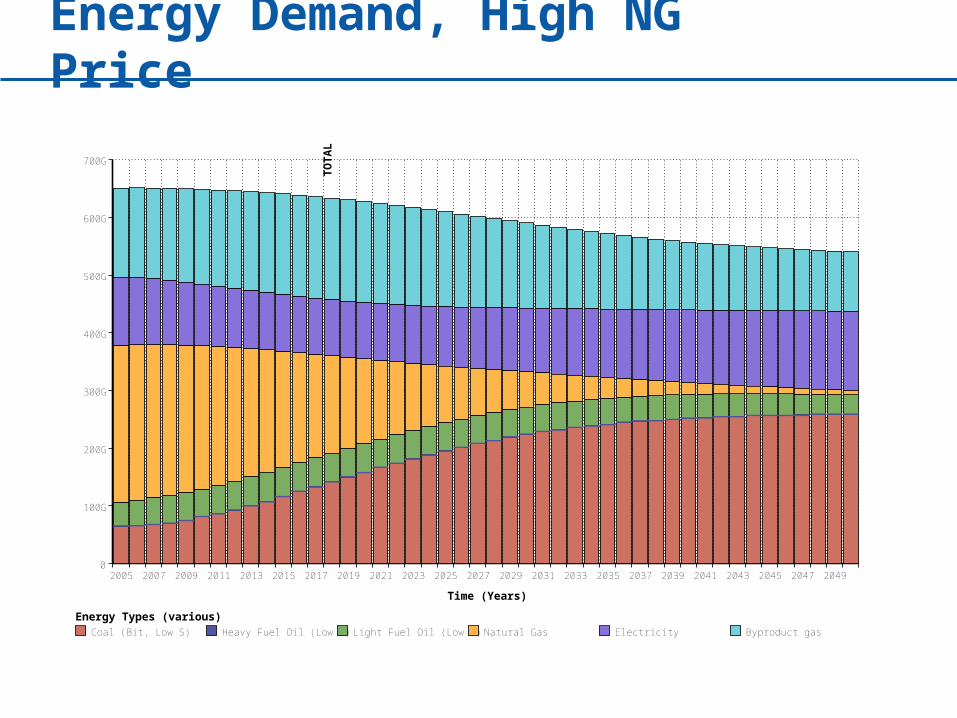
Energy Demand, High NG Price
2005 2007 2009 2011 2013 2015 2017 2019 2021 2023 2025 2027 2029 2031 2033 2035 2037 2039 2041 2043 2045 2047 20490
100G
200G
300G
400G
500G
600G
700G
Time (Years)
TO
TA
L F
UE
L D
EM
AN
DE
D (
Wa
tts
)
Energy Types (various)Coal (Bit, Low S) Heavy Fuel Oil (Low S) Light Fuel Oil (Low S) Natural Gas Electricity Byproduct gas
2005 2007 2009 2011 2013 2015 2017 2019 2021 2023 2025 2027 2029 2031 2033 2035 2037 2039 2041 2043 2045 2047 20490
100G
200G
300G
400G
500G
600G
700G
Time (Years)
TO
TA
L F
UE
L D
EM
AN
DE
D (
Wat
ts)
Energy Types (various)Coal (Bit, Low S) Heavy Fuel Oil (Low S) Light Fuel Oil (Low S) Natural Gas Electricity Byproduct gas
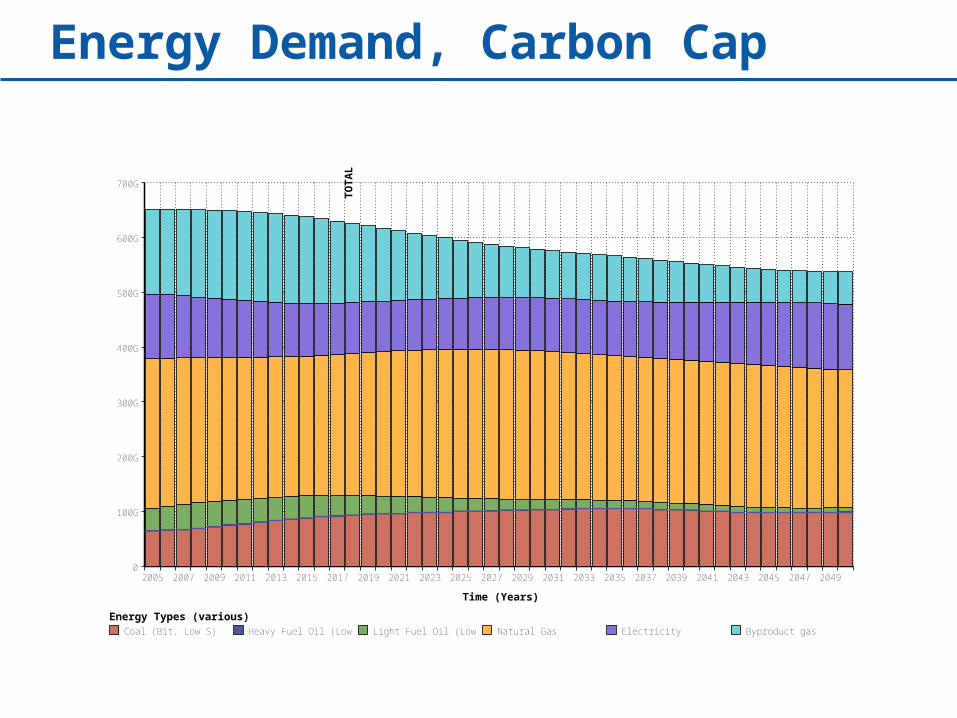
Energy Demand, Carbon Cap
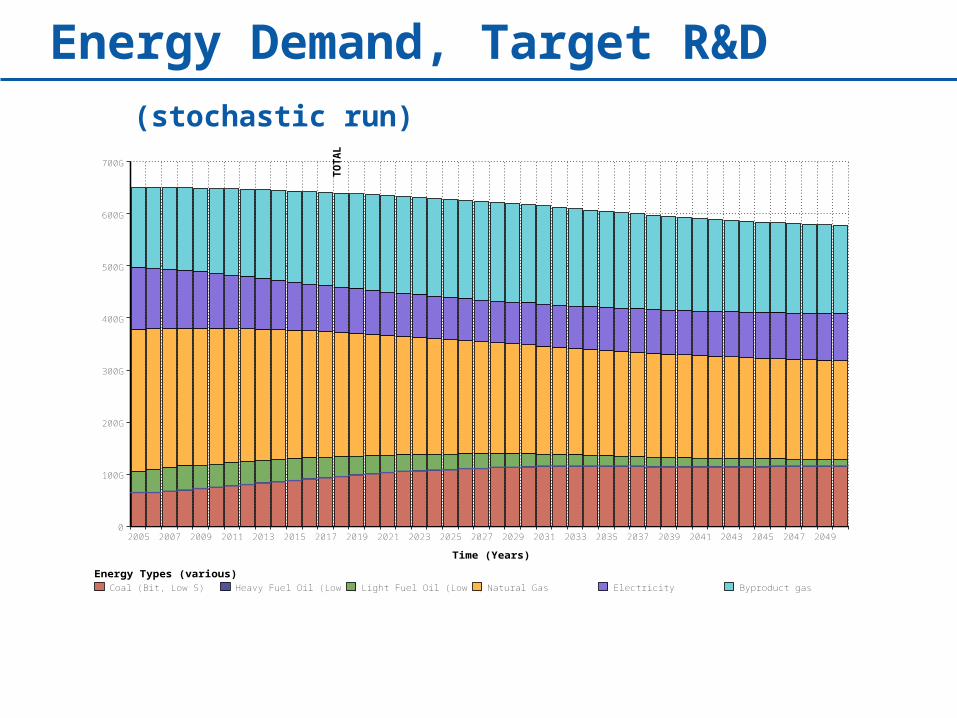
Energy Demand, Target R&D
2005 2007 2009 2011 2013 2015 2017 2019 2021 2023 2025 2027 2029 2031 2033 2035 2037 2039 2041 2043 2045 2047 20490
100G
200G
300G
400G
500G
600G
700G
Time (Years)
TO
TAL
FU
EL
DE
MA
ND
ED
(W
atts
)
Energy Types (various)Coal (Bit, Low S) Heavy Fuel Oil (Low S) Light Fuel Oil (Low S) Natural Gas Electricity Byproduct gas
(stochastic run)
Issues and Future Work
• Break out industrial sector into manufacturing and non-manufacturing industry
• Incorporate additional detail for energy-intensive industries– Pulp and Paper– Primary Iron and Steel
• Remove the industries analyzed as part of the liquid fuels model