Sedimentology and Reservoir Characterization of the...
41
Sedimentology and Reservoir Characterization of the Silurian Carbonates in the Mt. Auburn Trend of the Sangamon Arch, West-Central Illinois Yaghoob Lasemi, Beverly Seyler, Zakaria Lasemi, and Zohreh Askari Khorasgani Circular 577 2010 Institute of Natural Resource Sustainability ILLINOIS STATE GEOLOGICAL SURVEY CR CR SI CR CR CR d 0.5 mm 0 0 30 mi 48 km N N Mt. Auburn Trend IN KY MO AR TN MI RCG RR VB ILLINOIS BASIN THB THB VINCENNES BASIN IL MO IA SANGAMON ARCH
Transcript of Sedimentology and Reservoir Characterization of the...

Sedimentology and Reservoir Characterization of the Silurian Carbonates in the Mt. Auburn Trend of the Sangamon Arch, West-Central IllinoisYaghoob Lasemi, Beverly Seyler, Zakaria Lasemi, and Zohreh Askari Khorasgani
Circular 577 2010 Institute of Natural Resource SustainabilityILLINOIS STATE GEOLOGICAL SURVEY
CR
CR
SI
CR
CR
CR
d 0.5 mm
0
0 30 mi
48 kmNN
Mt. Auburn Trend
IN
KYMO
AR
TN
MI
RCGRR
VB
ILLINOIS BASIN
THB
THB
VINCENNES B
ASIN
IL
MO
IA
SANGAMON ARCH
© 2010 University of Illinois Board of Trustees. All rights reserved. For permissions information, contact the Illinois State Geological Survey.
Front Cover: (a) Location of the Illinois Basin and the Sangamon Arch in west-central Illinois. (b) Photo-micrograph of porous dolomitized grainstone facies under polarized light showing an irregular dolomi-tization front (arrows) on crinoid fragments (CR), dolomite rhombs, and void spaces (black) formed as a result of dolomitization. (c) Generalized depositional model depicting the distally steepened ramp of the Illinois Basin during Niagaran time.
a
b
c

Circular 577 2010
Institute of Natural Resource SustainabilityWilliam W. Shilts, Executive DirectorILLINOIS STATE GEOLOGICAL SURVEYE. Donald McKay III, Director615 East Peabody DriveChampaign, Illinois 61820-6964217-333-4747www.isgs.illinois.edu
Sedimentology and Reservoir Characterization of the Silurian Carbonates in the Mt. Auburn Trend of the Sangamon Arch, West-Central IllinoisYaghoob Lasemi, Beverly Seyler, Zakaria Lasemi, and Zohreh Askari Khorasgani

CONTENTS
Abstract 1
Introduction 1
Geologic Setting 1
Stratigraphic Setting 4
Stratigraphy of the Racine Formation 4 Unconformable Boundaries and Lateral Distribution 4 Cyclostratigraphy 7Petroleum Reservoirs and Seals 9 Non-reef Reservoir Units A, B, and C 13 Reservoir Unit A 14 Reservoir Unit B 21 Reservoir Unit C 21 Patch Reef Reservoir Unit D 27
Discussion 27 Depositional Environment and Carbonate Platform 27 Patch Reef Versus Pinnacle Reef 30 Dolomitization and Reservoir Development 31
Conclusions 31
Acknowledgments 31
References 31
Figures 1 Location of the Illinois Basin and the Sangamon Arch in west-central Illinois 2 2 Map of the Mt. Auburn trend of the Sangamon Arch 3 3 General stratigraphic column, sequences, and megagroups of the Illinois Basin 5 4 General stratigraphic column of the Upper Ordovician to lowermost Mississippian strata in the Sangamon Arch area 6 5 Subsurface gamma-ray and electric log stratigraphic reference section for the Mt. Auburn trend 7 6 Map of the Mt. Auburn trend area showing the lines of stratigraphic cross sections A–A through H–H 8 7 Northwest-southeast stratigraphic cross section A–A across the Mt. Auburn trend showing the Racine Formation sequences and the lateral variations in their thickness and lithology as a result of post-depositional erosion 9 8 Stratigraphic cross section B–B across the Mt. Auburn trend showing the lateral distribution of the Racine Formation 10 9 Stratigraphic cross section C–C along the Mt. Auburn trend showing rather uniform thickness and lithology for the Racine sequences 11 10 Cross section D–D across the Mt. Auburn trend showing erosional truncation and uneven topography in the upper boundary of the lower and upper Racine sequences 12 11 Thickness map of the New Albany Shale Group from the top of the Silurian to the base of the Chouteau Limestone 13 12 Structure contour map of the base of the New Albany Shale Group showing the direction of the regional dip toward the southeast 14 13 Digitized log and core photographs of the reservoir interval (reservoir unit B/C) in the Bernard Podolsky McMillen 4-B well in the Mt. Auburn Consolidated Field 15 14 Digitized log of the Pawnee Oil and Gas Inc. Garver No. 1 well in the Harristown Field 16 15 Digitized log of the Pawnee Oil and Gas Inc. Rothwell No. 1 well in the Blackland North Field 17
16 (a) Core photograph of a bioturbated lime mudstone to wackestone facies in the Pawnee Oil Corp. Elder No. 1 well that caps a dolomitized patch reef reservoir. (b) Photomicrograph of a coarsening-upward lime mudstone to bryozoan crinoid wackestone facies from an impermeable capping limestone. (c) Polished core slab photograph of a porous dolomitized grainstone facies. (d) Photomicrograph of a part of c under polarized light showing an irregular dolomitization front on crinoid fragments, dolomite rhombs, and void spaces 18 17 Photomicrographs of (a) a porous dolomitized non-reef reservoir under plane light in which the original texture has been destroyed by pervasive dolomitization; (b) a non-reef wackestone reservoir showing partially preserved crinoids and molds of bivalves and other unrecognizable grains in a finely crystalline dolomite groundmass; (c, d) dolomitized reef facies composed mainly of coral skeletons; (e) a thin section of d showing vuggy porosity as a result of dissolution of the skeletons; (f) an enlarged portion of e 19 18 Thickness map of the dolomite reservoir unit A in the Blackland North Field showing a very limited lateral extent of the reservoir due to lateral facies changes and post-Silurian erosion 20 19 Thickness map of the dolomite reservoir unit B in the Blackland North Field showing the lenticular nature of the reservoir 21 20 Thickness map showing the lateral distribution of the dolomite reservoir unit C along the Mt. Auburn trend 22 21 Northwest-southeast cross section E–E across the Mt. Auburn trend in the Harristown Field 23 22 West-east cross section F–F across the Mt. Auburn trend showing the development of reservoir units A, B, and C 24 23 Northwest-southeast cross section G–G across the Mt. Auburn trend in the Mt. Auburn Consolidated Field showing the development of reservoir units A and C 25 24 Cross section H–H parallel to the Mt. Auburn trend showing the development of reef and non-reef reservoirs in the upper part of the sequences of the Racine Formation 26 25 Cross-section H–H showing the occurrence of patch reef reservoirs within the upper part of the lower sequence of the Racine Formation 28 26 Enlarged portion of part of the regional structural contour map shown in Figure 12 29 27 Generalized depositional model depicting the distally steepened ramp of the Illinois Basin during Niagaran time 30

Illinois State Geological Survey Circular 577 1
AbstractThe Silurian succession of the San-gamon Arch, a broad southwest-trend-ing structure in west-central Illinois, is composed of hydrocarbon-bearing reservoirs that have produced mainly from dolomitized carbonate units in the upper part of the Niagaran Series. To determine the reservoir facies and to evaluate the occurrence, geometry, distribution, porosity development, and petroleum entrapment mecha-nism, the present study focuses on the Silurian deposits along the Mt. Auburn trend of the Sangamon Arch. In the Mt. Auburn trend along the southern flank of the arch, the only petroleum reservoir is the uppermost Niagaran Racine Formation (equivalent to the Moccasin Springs Formation of south-ern Illinois). The Racine Formation is characterized mostly by layers of lime-stone, dolomite, and silty argillaceous dolomitic limestone/dolomite that vary in thickness and lithology from place to place, making well-to-well cor-relation difficult. The Racine Forma-tion underlies the Upper Devonian to Lower Mississippian New Albany Shale Group with a distinct unconformity and sharply overlies the lower Niagaran Joliet Formation (equivalent to the St. Clair Formation of southern Illinois). The variable thickness and lithology in the lower part of the Racine Formation are interpreted to be the consequence of sea level fall and differential post-depositional erosion, thus indicating the presence of a prominent erosional unconformity within the Racine For-mation. This unconformity subdivides the Racine Formation into two third-order cycles (sequences) that include several producing dolomite reservoirs.
The reservoirs include dolomitized skeletal wackestone-grainstone facies in the upper sequence and coral patch reef/reef rudstone facies in the lower sequence. The reservoirs commonly constitute the upper part of fourth-order shallowing-upward cycles and are characterized by lenticular bodies of limited lateral extent. They normally grade laterally and vertically into later-ally extensive impermeable limestone facies, suggesting that fluctuations in sea level and seawater chemistry were the primary controls for early dolomitization of Silurian carbonates
in the study area. Petrographic stud-ies indicate that the Racine Formation was deposited within the high-energy depositional environment of the ramp margin (roughly parallel to the Mt. Auburn trend) and in the adjacent deeper subtidal setting. This gently sloping ramp was a part of a distally steepened ramp (the Vincennes Basin) located in the distal deep area of the Illinois Basin. Because the depositional wave energy was not strong enough in the homoclinal ramp setting of the Sangamon Arch, only bioclast grain-stone shoal facies and small patch reefs were developed—unlike the large pin-nacle reefs that developed along the steeper slope of the deep Illinois Basin margin.
Hydrocarbon production along the Mt. Auburn trend has been chiefly from the non-reef carbonate reservoirs in the uppermost part of the Silurian succes-sion. Most wells drilled thus far have only tested the uppermost part of the Niagaran deposits; only a few wells have tested the lower reservoirs that include the newly recognized patch reefs. The results of this study sug-gest that there are good possibilities of finding other productive areas with dolomitized patch reefs and non-reef reservoirs in the Mt. Auburn trend of the Sangamon Arch area.
IntroductionThe upper part of the Silurian succes-sion (Niagaran Series) in the Sangamon Arch of west-central Illinois contains prolific petroleum reservoirs that have been producing for over 80 years. More than 12 million barrels of oil have been produced from Silurian rocks in the Mt. Auburn trend located along the southern flank of the Sangamon Arch (Figures 1 and 2). The first commercial production from the area was in 1925 from the Decatur Field, but major exploration activity did not begin until 1954 after Sun Oil Company com-pleted the Damery No. 1 well in Macon County in December 1953. That well produced more than 700 barrels of oil per day after fracture treatment of the Silurian reservoir (Whiting 1956).
The Mt. Auburn trend includes a number of oil fields (Figure 2) that have produced chiefly from the dolomitized
carbonate reservoirs that occur in the upper part of the Silurian succession. However, there are conflicting views on reservoir development, petroleum entrapment, and their controls. To date there have been no documented studies regarding the reservoir facies types, porosity, occurrence, and petro-leum entrapment of these Silurian reservoirs. The objectives of this study are to determine reservoir facies and assess the occurrence, geometry, dis-tribution, porosity development, and petroleum entrapment mechanism in the Niagaran deposits along the Mt. Auburn trend of the Sangamon Arch. The intent is to generate renewed interest in the unexplored areas and encourage secondary recovery of its producing horizons. The depositional model developed in this study should help producers understand reservoir development and predict occurrences of productive Silurian rocks in other areas of the Illinois Basin.
Available subsurface data, including well cuttings, cores, and geophysical logs from more than 950 drill holes, were studied in detail to establish and outline facies distribution and res-ervoir characteristics of the Silurian deposits in the study area. Maps and stratigraphic cross sections from differ-ent areas along the Mt. Auburn trend were constructed using GeoGraphix and Adobe Illustrator software. The res-ervoir facies are classified on the basis of the textural classification schemes of Dunham (1962) and Embry and Klovan (1971).
Geologic SettingThe intracratonic Illinois Basin (Figure 1) began subsiding during the Late Cambrian Period over the northeast extension of the Late Precambrian to Middle Cambrian Reelfoot Rift system (Kolata and Nelson 1991). This subsid-ence was associated with the breakup of the Rodinia supercontinent during Late Precambrian to Early Cambrian time (Bond et al. 1984; Piper 2000, 2004; Meert and Torsvik 2003). During the Silurian Period, the rift system formed the axis of a southward plung-ing trough that opened to the adjacent Iapetus Ocean (Kolata and Nelson 1991). By the Middle to Late Silurian

2 Circular 577 Illinois State Geological Survey
0
0 30 mi
48 kmNN
Mt. Auburn Trend
IN
KYMO
AR
TN
MI
RCGRR
VBILLINO
IS BASIN
THB
THB
VINCENNES B
ASIN
IL
MO
IA
SANGAMON ARCH
Figure 1 Location of the Illinois Basin (Buschbach and Kolata 1991) and the Sangamon Arch in west-central Illinois. The Sangamon Arch is defined by the zero isopach contour of the Lower to Middle Devonian deposits (Whiting and Stevenson 1965) in the northwestern portion of the Illinois Basin. The Mt. Auburn trend is located along the southeastern flank of the Sangamon Arch and includes several oil fields (Figure 2). Line abbreviations: RR, the northwest limit of the Reelfoot Rift; RCG, the northern limit of the Rough Creek Graben (Kolata and Nelson 1991); VB, the northern limit of the Vincennes Basin; THB, the limit of the known pinnacle reefs in the Terre Haute reef bank (Droste and Shaver 1980, 1987). Both the Vincennes Basin and the Terre Haute reef bank may have marked a slope break in southern Illinois and southwestern Indiana with deeper water to the south.
Illinois State Geological Survey Circular 577 3
0 3 mi
0 4.8 kmNNOil well Abandoned oil well Dry hole County boundary Township boundary
MACON
T14N
T15N
T16N
T17N
R 2 ER 1 ER 1 WR 2 W
LOGAN
SANGAMON
CHRISTIAN
SHELBY
Forsyth
Decatur
HarristownSouth
Harristown
BlacklandSouth
Blackland
BlacklandNorth
Mt. Auburn Consolidated
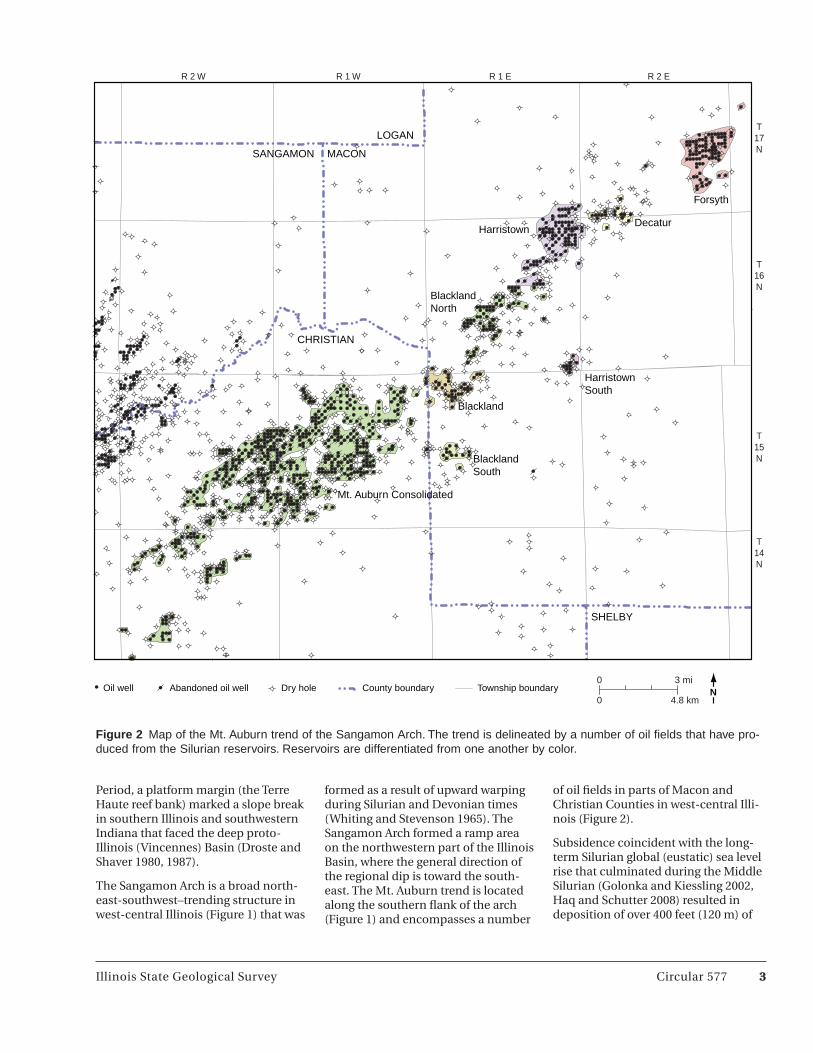
Figure 2 Map of the Mt. Auburn trend of the Sangamon Arch. The trend is delineated by a number of oil fields that have pro-duced from the Silurian reservoirs. Reservoirs are differentiated from one another by color.
Period, a platform margin (the Terre Haute reef bank) marked a slope break in southern Illinois and southwestern Indiana that faced the deep proto-Illinois (Vincennes) Basin (Droste and Shaver 1980, 1987).
The Sangamon Arch is a broad north-east-southwest–trending structure in west-central Illinois (Figure 1) that was
formed as a result of upward warping during Silurian and Devonian times (Whiting and Stevenson 1965). The Sangamon Arch formed a ramp area on the northwestern part of the Illinois Basin, where the general direction of the regional dip is toward the south-east. The Mt. Auburn trend is located along the southern flank of the arch (Figure 1) and encompasses a number
of oil fields in parts of Macon and Christian Counties in west-central Illi-nois (Figure 2).
Subsidence coincident with the long-term Silurian global (eustatic) sea level rise that culminated during the Middle Silurian (Golonka and Kiessling 2002, Haq and Schutter 2008) resulted in deposition of over 400 feet (120 m) of

4 Circular 577 Illinois State Geological Survey
mainly shallow marine carbonates in the Sangamon Arch area. Carbonate deposition was terminated as a result of the worldwide pre-Middle Devonian sea level fall (Sloss 1963, Vail et al. 1977, Haq and Schutter 2008) and upwarp-ing of the arch during Late Silurian through Middle Devonian times. In the deep basinal area to the south, however, deposition was continuous across the Silurian-Devonian bound-ary (Droste and Shaver 1987, Mikulic 1991).
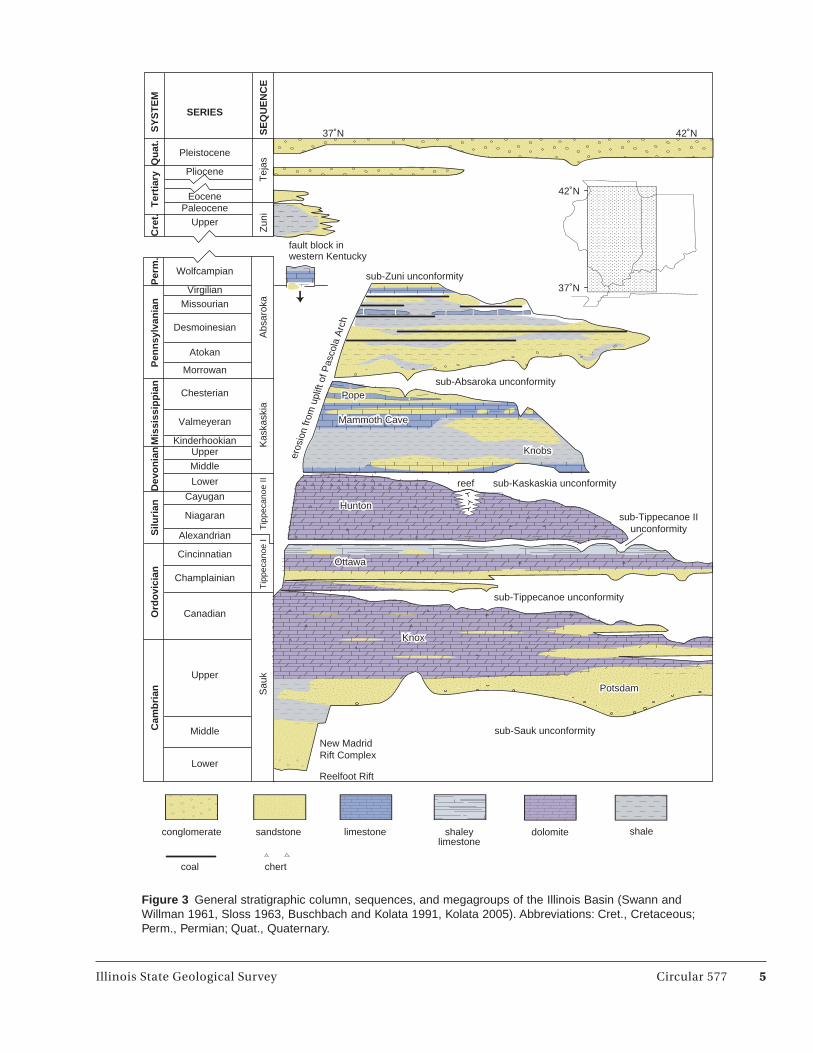
Stratigraphic SettingThe Silurian succession of the Illinois Basin is a part of the Silurian-Middle Devonian Hunton Megagroup (Swann and Willman 1961), which constitutes the upper part of the Tippecanoe sequence of Sloss (1963) and overlies the Upper Ordovician (Cincinnatian) deposits with the distinct unconfor-mity below the Tippecanoe II sub-sequence (Figure 3). In the platform areas (inner to mid ramp) of the Illinois Basin, the Silurian rocks unconform-ably underlie the Middle Devonian deposits with the pronounced sub-Kaskaskia erosional unconformity, but, in the deep part of the Basin, the Silurian-Devonian boundary is con-formable (Willman and Atherton 1975, Droste and Shaver 1987, Mikulic 1991). In the Sangamon Arch area, Lower and Middle Devonian deposits are absent (Whiting and Stevenson 1965), and Silurian carbonates are overlain by the Upper Devonian to lowermost Mis-sissippian New Albany Shale Group (Figure 4). In the Sangamon Arch area, the Silurian encompasses the Alexan-drian and Niagaran Series (Willman and Atherton 1975), which consist mainly of limestone and dolomite. The Alexandrian-Niagaran boundary is marked by an unconformity (Will-man and Atherton 1975, Mikulic 1991, Kluessendorf and Mikulic 1996). The unconformity corresponds with the major phase of the Caledonian Orog-eny during the Early Silurian through Late Devonian (Golonka and Kiessling 2002).
The Silurian System of the Illinois Basin has been the subject of several lithostratigraphic classifications (Will-man and Atherton 1975, Droste and Shaver 1987). In the present study, the
stratigraphic nomenclature scheme of Willman and Atherton (1975) for west-ern Illinois (Figure 4) has been adopted to identify the Silurian deposits of the Sangamon Arch area. Based on this classification, the Silurian deposits of the Mt. Auburn trend comprise, from base to top, the Alexandrian Edgewood and Kankakee Formations and the Niagaran Joliet and Racine Forma-tions. In the Mt. Auburn trend, the uppermost Niagaran Racine Formation includes several hydrocarbon-pro-ducing dolomite horizons. The Racine Formation (Hall 1861 in Willman and Atherton 1975) takes its name from the quarry exposures at Racine, Wis-consin. It is up to 300 feet (90 m) thick and consists of pure limestone and/or dolomite reef facies and silty argilla-ceous dolomite or limestone inter-reef facies (Willman and Atherton 1975). The Racine Formation is equivalent to the Moccasin Springs Formation of southern Illinois that displays a charac-teristic “two-kick, three-kick” interval (resistive signatures best recognized on old electric logs) in its lower part, just above the Niagaran St. Clair Formation (equivalent to the Joliet Formation) (Willman and Atherton 1975).
Stratigraphy of the Racine FormationIn the study area, the Racine Forma-tion underlies the Upper Devonian through the lowermost Mississippian New Albany Shale Group with an interregional unconformity (Figure 4). It overlies, with a sharp contact, the thick-bedded fossiliferous limestone of the Joliet Formation (equivalent to the St. Clair Limestone of southern Illinois) (Figure 5). A prominent unconformity subdivides the Racine Formation into two sequences (Y. Lasemi 2009a, 2009b).
A subsurface reference section, the Equitable Resources Explora-tion IL-3032 well (southwest of the Mt. Auburn Consolidated Field) in Christian County, has been chosen to illustrate significant and laterally continuous geophysical markers in the area (Figure 5). The reference section surfaces are designated in ascending order, from base to top, by letters a to g, which correspond to important
chronostratigraphic events and may coincide with the boundaries of lithostratigraphic units. The surfaces represent (a) the top of the Joliet For-mation, (b) the base of a thin radioac-tive shale, (c) the top of a radioactive calcareous shale or argillaceous lime-stone that may reach a thickness of 30 feet (9 m) above marker b, (d) the top of the lower Racine sequence, (e) the base of a resistive cherty limestone marker near the Silurian-Devonian boundary, (f) the top of the upper Racine sequence, and (g) the top of the New Albany Shale Group.
The lower part of the Racine Forma-tion displays characteristic and widely traceable geophysical log signatures, which commonly represent alternat-ing gray fossiliferous limestone, silty argillaceous dolomitic limestone/dolomite, and calcareous shale (Figure 5). The log signatures exhibit an over-all upward decrease in resistivity and an upward increase in radioactivity in the lower part of the formation (e.g., depths 2,100 to 2,030 feet in Figure 5). This interval is similar to the lower part of the Moccasin Springs Formation in southern Illinois, but the characteristic “two-kick, three-kick” resistivity signa-tures (Willman and Atherton 1975) are not fully discernible in the Mt. Auburn trend area.
The thickness of the Racine Formation on the Sangamon Arch is variable due to post-depositional erosion, as is dis-cussed more fully in the following sec-tion. Deposition of the Racine Forma-tion on the Sangamon Arch was coeval with the deposition of the Moccasin Springs Formation of southern Illi-nois and the lower part of the Wabash Formation of Indiana (Willman and Atherton 1975, Droste and Shaver 1987, Mikulic 1991).
Unconformable Boundaries and Lateral DistributionExamination of the geophysical log sig-natures and stratigraphic correlation in the study area (Figures 6 through 10) indicates fairly uniform thickness and lithology for the lower Niagaran Joliet Formation (equivalent to the St. Clair Formation of southern Illinois) and the underlying Alexandrian Edgewood-Kankakee Formations (Figure 7), which
Illinois State Geological Survey Circular 577 5
Potsdam
Knox
Ottawa
Hunton
Knobs
Mammoth Cave
Pope
New MadridRift Complex
sub-Sauk unconformity
sub-Tippecanoe unconformity
sub-Zuni unconformity
sub-Tippecanoe IIunconformity
sub-Kaskaskia unconformityreef
Pleistocene
Pliocene
EocenePaleocene
Upper
Wolfcampian
VirgilianMissourian
Desmoinesian
Atokan
Morrowan
Chesterian
Valmeyeran
KinderhookianUpper
Middle
Lower
Cayugan
Niagaran
Alexandrian
Cincinnatian
Champlainian
Canadian
Upper
Middle
Lower
Cam
bri
anO
rdo
vici
anS
iluri
anD
evo
nia
nM
issi
ssip
pia
nP
enn
sylv
ania
nP
erm
.C
ret.
Ter
tiar
yQ
uat
.
Sau
k
Potsdam
Knox
Pope
Mammoth Cave
Knobs
Hunton
Ottawa
eros
ion
from
upl
ift o
f Pas
cola
Arc
h
Tip
peca
noe
IT
ippe
cano
e II
Kas
kask
iaA
bsar
oka
Zun
iT
ejas
fault block inwestern Kentucky
chertcoal
shalesandstone limestone shaleylimestone
conglomerate dolomite
37˚N
37˚N
42˚N
42˚N
sub-Absaroka unconformity
SY
ST
EM
SERIES
SE
QU
EN
CE
Reelfoot Rift
Figure 3 General stratigraphic column, sequences, and megagroups of the Illinois Basin (Swann and Willman 1961, Sloss 1963, Buschbach and Kolata 1991, Kolata 2005). Abbreviations: Cret., Cretaceous; Perm., Permian; Quat., Quaternary.

6 Circular 577 Illinois State Geological Survey
suggests no differential erosion prior to the deposition of the upper Niagaran Racine Formation. The Racine Forma-tion, however, is characterized by vari-able thickness and lithology of strata, making well-to-well correlation diffi-cult (Figures 7 through 10).
The variable thickness and litholo-gies in the lower part of the Racine Formation (see Figures 7 through 10) are interpreted to be the consequence of global sea level fall and differential post-depositional erosion, thus indi-cating the presence of an erosional unconformity within the Racine For-mation (Y. Lasemi 2009a, 2009b). The presence of an unconformity within the Niagaran deposits was first sug-gested by Whiting and Oros (1957) in the vicinity of the study area. The differential erosion along this uncon-formity is as much as 70 feet (21 m) in parts of the study area (e.g., compare the Texas Co. Dipper No. 1 with Pawnee Oil & Gas, Inc. Beatty 5 in Figure 8). The intra-Racine unconformity records a major tectono-eustatic sea level fall during Middle Silurian time and divides the Racine Formation into two depositional sequences (Y. Lasemi 2009a, 2009b).
The interregional unconformity at the top of the Racine Formation is the consequence of a major global sea level fall at the Silurian-Devonian boundary (Sloss 1963, Vail et al. 1977, Haq and Schutter 2008) and could be partly the result of Late Silurian through Middle Devonian upwarping of the Sangamon Arch (Y. Lasemi 2009a, 2009b). Pro-longed exposure of the Sangamon Arch resulted in partial erosion of the Silurian deposits and formation of an uneven topography that was later buried by the Upper Devonian to lowermost Mississippian New Albany Shale. The uneven topography is well displayed on the isopach map of the New Albany Shale Group (Figure 11) and the structural contour map on the top of the Silurian succession (Figure 12), which shows several noses and a few minor closures. The irregular ero-sional topography is also illustrated by the stratigraphic cross sections that are hung on the base or top of marker horizons within the Silurian deposits (Figures 7 through 10). The New Albany Shale Group generally becomes thin-
Nia
gara
n
New
Alb
any
Sha
leG
roup
Dev
onia
n-M
issi
ssip
pian
Silu
rian
SY
ST
EM
SE
RIE
S
GR
OU
P/
FO
RM
ATIO
NJo
liet F
orm
atio
n
Mid
dle
Low
er
Rac
ine
For
mat
ion
UR
S
Maq
uoke
taS
hale
Gro
up
Edg
ewoo
d-K
anka
kee
For
mat
ion
Ord
ovic
ian
Upp
erA
lexa
ndria
n
limestone
shale
dolomite
argillaceous limestone/calcareous shale
lower Racine reservoir
upper Racine reservoir
argillaceous dolomite/calcareous shale
hiatus
LITHOLOGY
Upp
er D
evon
ian-
Kin
derh
ooki
an
LRS
Figure 4 General stratigraphic column of the Upper Ordovician to low-ermost Mississippian strata in the Sangamon Arch area. Note that the Lower and Middle Devonian deposits are absent in the Sangamon Arch area because of the pronounced sub-Kaskaskia unconformity and that the New Albany Shale Group rests on the Silurian strata. An unconformity subdivides the Racine Formation into lower and upper sequences. Note that non-reef reservoirs occur in the upper part of the upper sequence, but coral patch reefs exist in the upper part of the lower sequence. Abbreviations: LRS, lower Racine sequence; URS, upper Racine sequence.

Illinois State Geological Survey Circular 577 7
g
b
d
e
f
Nia
gara
nU
pper
Dev
onia
n-K
inde
rhoo
kian
New
Alb
any
Sha
leG
roup
Rac
ine
For
mat
ion
Dev
onia
n-M
issi
ssip
pian
Silu
rian
SY
ST
EM
SE
RIE
S
GR
OU
P/
FO
RM
ATIO
NJo
liet
Fm
Cht LsLR
SU
RS
c
TD = 2,200 feet
GAMMA-RAY RESISTIVITY
2,10
0
a
1,90
01,
800
2,00
0
0.2 2,000
0.2 2,000
0.2 2,000
FOC (Ohm-m)
ILM (Ohm-m)
ILD (Ohm-m)150API0
-200 SP (mV) 0
API No. 120212443100
Equitable Resources Exploration IL-3032T14N, R2W, Sec. 19
Christian County
Figure 5 Subsurface gamma-ray and electric log stratigraphic reference section for the Mt. Auburn trend. Significant and laterally continuous geophysical hori-zons are designated with letters a through g. Abbreviations: Cht Ls, Chouteau Limestone; Fm, Formation; FOC, focused; ILD, induction log deep; ILM, induction log medium; LRS, lower Racine sequence; SP, self-potential; TD, total depth; URS, upper Racine sequence.
ner toward the east and southeast on the Mt. Auburn trend, a positive Silu-rian remnant, but thickens toward the west and northwest along the crest of the arch, where the Silurian rocks are deeply eroded (Figures 10 and 11). The thickening of the New Albany could be explained by differential compaction of the shale over the Silurian erosional remnant and by increased accom-modation space for shale deposition, probably as a consequence of the downwarping of the Sangamon Arch area during Late Devonian time.
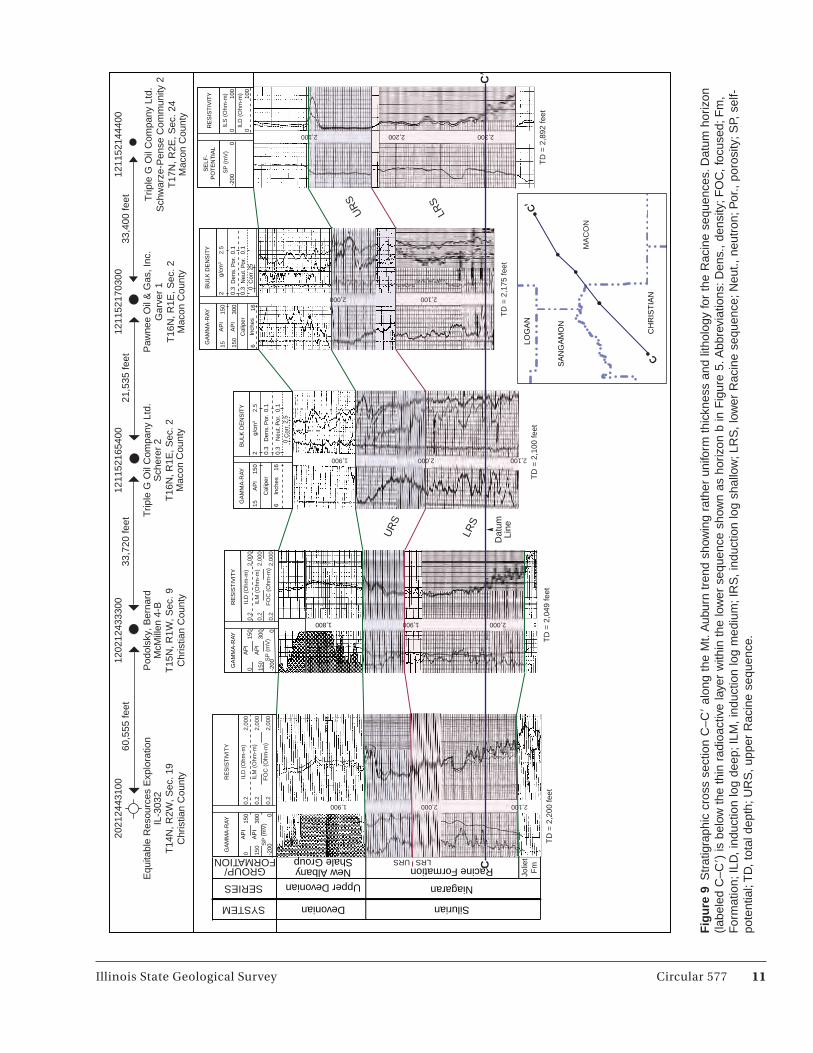
The thickness of the Racine Forma-tion is fairly uniform along the Mt. Auburn trend (cross section C–C in Figure 9). However, the thickness of the Racine Formation generally decreases toward the west and northwest and increases toward the northeast and east of the study area (Figures 7, 9, and 10). The Racine Formation reaches a maximum thickness of 235 feet (70.5 m) in the Forsyth Field (Triple G Oil Co. Schwarze-Pense Community No. 2 well in Figure 9) in Macon County. About 50 miles (80 km) to the east of the study area in Douglas County (Villa Grove Quadrangle, T16N, R9E, Sec. 30), Mikulic and Kluessendorf (2001) assigned over 400 feet (120 m) of the upper part of the Silurian succession to the Moccasin Springs Formation (equivalent to the Racine Formation of the Sangamon Arch). In Grafton Quarry (Jersey County) in western Illinois, about 75 miles (120 km) to the south-west of the study area, the uppermost Silurian interval of about 45 feet (14 m) that overlies the Joliet Formation was assigned to the Racine Formation by Willman and Atherton (1975). This youngest Silurian interval was recently correlated with the Sugar Run Forma-tion, a lithostratigraphic unit underly-ing the Racine Formation in northeast-ern Illinois (Mikulic and Kluessendorf 2000).
CyclostratigraphyThe erosional unconformity within the Racine Formation divides the Racine Formation into two third-order cycles (Y. Lasemi 2009a, 2009b) or deposi-tional sequences (in the sense of Vail et al. 1977 and Van Wagoner et al. 1988). Theses cycles are designated as lower
8 Circular 577 Illinois State Geological Survey
E’
0
0
3 mi
4.8 kmNN
MACON
T14N
T15N
T16N
T17N
R 2ER1ER1WR2W
LOGAN
SANGAMON
CHRISTIAN
SHELBY
B
B�
CC�
D
D�H
H�
F�
E
G
G�
A
F
A�
Oil well Abandoned oil well Dry hole County boundary Township boundary
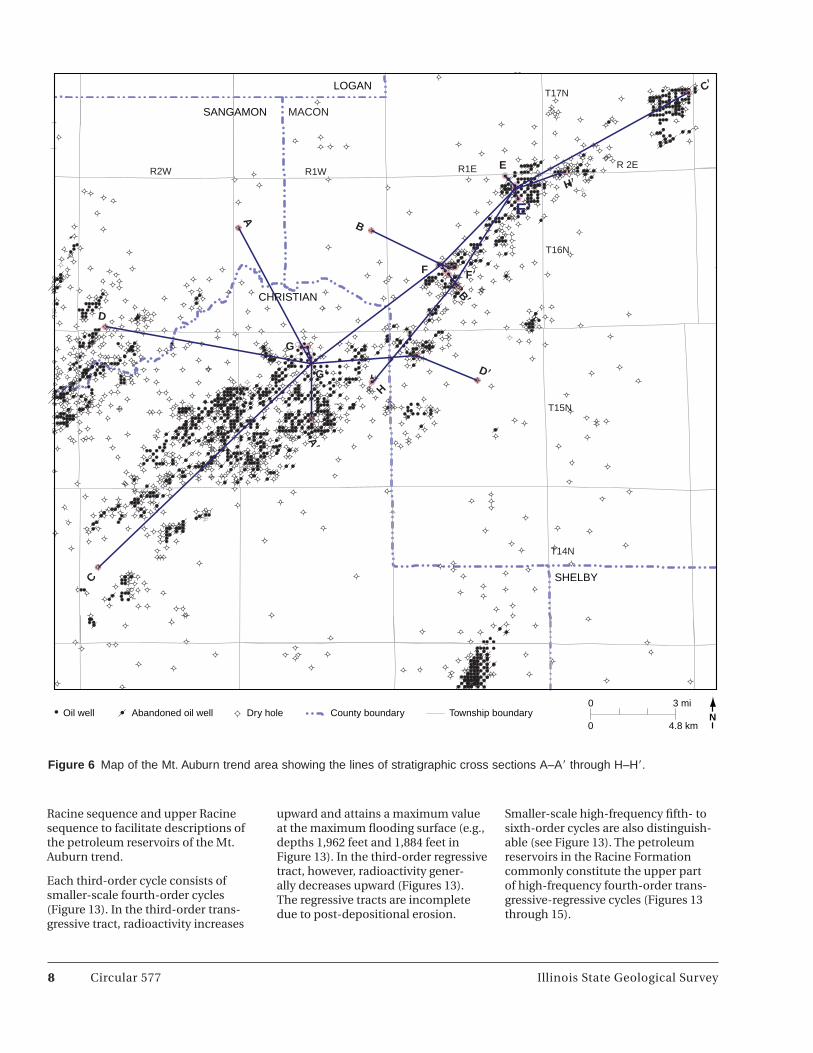
Figure 6 Map of the Mt. Auburn trend area showing the lines of stratigraphic cross sections A–A through H–H.
Racine sequence and upper Racine sequence to facilitate descriptions of the petroleum reservoirs of the Mt. Auburn trend.
Each third-order cycle consists of smaller-scale fourth-order cycles (Figure 13). In the third-order trans-gressive tract, radioactivity increases
upward and attains a maximum value at the maximum flooding surface (e.g., depths 1,962 feet and 1,884 feet in Figure 13). In the third-order regressive tract, however, radioactivity gener-ally decreases upward (Figures 13). The regressive tracts are incomplete due to post-depositional erosion.
Smaller-scale high-frequency fifth- to sixth-order cycles are also distinguish-able (see Figure 13). The petroleum reservoirs in the Racine Formation commonly constitute the upper part of high-frequency fourth-order trans-gressive-regressive cycles (Figures 13 through 15).

Illinois State Geological Survey Circular 577 9
6 mi0
0 9.6 kmNN
31,555 feet 11,213 feet121672506900
Equitable Resources ExplorationIL-3025
T16N, R1W, Sec. 7Sangamon County
120212433300
Podolsky, BernardMcMillen 4-B
T15N, R1W, Sec. 9Christian County
120210150100
Jarvis, S. D.Butcher, Owen E. 1T15N, R1W, Sec. 21
Christian County
Dev
onia
n
Nia
gara
n
Silu
rian
SY
ST
EM
SE
RIE
SU
pper
Ord
ovic
ian
Upp
er
LRS
UR
SR
acin
e F
orm
atio
nG
RO
UP
/F
OR
MA
TIO
NE
dge
wo
od
-Kan
kake
e-Jo
liet F
orm
atio
nM
aquo
keta
New
Alb
any
Sha
leG
roup
GAMMA-RAY RESISTIVITY
2,000
2,000ILM (Ohm-m)
ILD (Ohm-m)API0
-200SP (mV)
0.2
2,000FOC (Ohm-m)
0.2
0.2
200
0
API400200
1,80
0
GAMMA-RAY RESISTIVITY
2,000
2,000ILM (Ohm-m)
ILD (Ohm-m)API0
-200SP (mV)
0.2
API400200 0.2
200
0
RESISTIVITY
0
0ILS (Ohm-m)
ILD (Ohm-m)-200 0
SP (mV)
SELF-POTENTIAL
100
100
1,90
0
?
SANGAMON
SHELBY
LOGAN
MACON
CHRISTIAN
A�
A�
TD = 2,049
TD = 2,126 feet
A
1,70
01,
800
1,90
02,
000
TD = 2,525 feet
2,10
02,
200
URS
LRS
2,00
01,
900
2,00
0
DatumLine
A
Ale
xand
rian
Figure 7 Northwest-southeast stratigraphic cross section A–A across the Mt. Auburn trend showing the Racine Formation sequences and the lateral variations in their thickness and lithology as a result of post-depositional erosion. Note that the Silurian rocks underlying the Racine Formation (mainly resistive limestone) display fairly uniform thickness. Datum (labeled A–A) is horizon c (see Figure 5) within the lower sequence. Abbreviations: FOC, focused; ILD, induction log deep; ILM, induc-tion log medium; ILS, induction log shallow; LRS, lower Racine sequence; Ls, Limestone; SP, self-potential; TD, total depth; URS, upper Racine sequence.
Petroleum Reservoirs and SealsThe Racine Formation along the Mt. Auburn trend comprises several per-meability pinch-out zones (herein referred to as reservoir units) at differ-
ent horizons. These zones generally include dolomitized wackestone to grainstone facies in the upper Racine sequence and dolomitized coral patch reef/reef rudstone facies in the lower Racine sequence (Figure 4). The zones are interlayered with laterally extensive
impermeable units that have formed flow barriers dividing the Racine Formation into stratigraphic cycles of impervious and porous horizons (Figures 13, 14, and 15). The reservoir units are light yellowish brown, due to oil staining, instead of the light gray

10 Circular 577 Illinois State Geological Survey
28
1211
5223
2600
Equ
itabl
e R
esou
rces
Exp
lora
tion
IL-3
026
T16
N, R
1W, S
ec. 1
3S
anga
mon
Cou
nty
1211
5216
5400
Trip
le G
Oil
Com
pany
Ltd
.S
cher
er 2
T16
N, R
1E, S
ec. 2
1M
acon
Cou
nty
1211
5216
880
Paw
nee
Oil
& G
as, I
nc.
Bea
tty 3
T16
N, R
1E, S
ec. 2
1M
acon
Cou
nty
1211
5217
0600
Paw
nee
Oil
& G
as, I
nc.
Bea
tty 5
T16
N, R
1E, S
ec. 2
1M
acon
Cou
nty
1211
5006
9000
The
Tex
as C
ompa
nyD
ippe
r, D
. D. 1
T16
N, R
1E, S
ec. 2
8M
acon
Cou
nty
1,61
38 ft
1,47
4 ft
925
ft3,
267
ft
Upper
New AlbanyShale Group
DevonianSYSTEM
SERIES
GROUP/FORMATION
Racine Formation
Niagaran
Silurian
Edgewood-Kankakee-Joliet Formations
Maquoketa
Ordovician
Upper
LRS
?
GA
MM
A-R
AY
RE
SIS
TIV
ITY
2,00
0
2,00
0IL
M (
Ohm
-m)
ILD
(O
hm-m
)A
PI
0 -200
0.2
2,00
0F
OC
(O
hm-m
)0.
2
0.2
200 0
AP
I40
020
0 SP
(m
V)
1,800
Inch
es7
16
Cal
iper
GA
MM
A-R
AY
150
AP
I15
BU
LK D
EN
SIT
Y
2g/
cm3
025
Cor
r.3
Den
sity
Por
.0.
3-0
.1
Neu
tron
Por
.0.
3-0
.1
1,900
Inch
es7
16
Cal
iper
GA
MM
A-R
AYB
ULK
DE
NS
ITY
150
AP
I2
025
Cor
r.15
3
Den
sity
Por
.-0
.1
Neu
tron
Por
.0.
3-0
.1
0.3
Inch
es7
16
Cal
iper
GA
MM
A-R
AYB
ULK
DE
NS
ITY
150
AP
I2
025
Cor
r.15
3
Den
sity
Por
.0.
3-0
.1
Neu
tron
Por
.0.
3-0
.1
RE
SIS
TIV
ITY
00ILS
(O
hm-m
)
ILD
(O
hm-m
)-2
000
SP
(m
V)
SE
LF-
PO
TE
NT
IAL
100
100
TD
= 2
,200
feet
TD
= 2
,100
feet
B
2,000 2,100
2,000
1,900
Dat
umLi
neT
D =
2,0
50 fe
et
TD
= 2
,162
feet
LRS
UR
S
LRS
UR
S
1,900
TD
= 2
,021
feet
1,900 ,
2,000
B�
B
B�
MA
CO
N
CH
RIS
TIA
N
T16
N
T15
N
R1E
R1W
2,000 2,100
g/cm
3
g/c
m3
Alexandrian
Fig
ure
8 S
trat
igra
phic
cro
ss s
ectio
n B
–B
acro
ss t
he M
t. A
ubur
n tr
end
show
ing
the
late
ral d
istr
ibut
ion
of t
he R
acin
e F
orm
atio
n. N
ote
the
eros
iona
l tru
ncat
ion
and
unev
en t
opog
raph
y in
the
upp
er b
ound
ary
of t
he lo
wer
and
upp
er R
acin
e se
quen
ces.
Not
e al
so t
hat
the
low
er R
acin
e se
quen
ce t
hick
ens
and
the
uppe
r se
quen
ce
pinc
hes
out
tow
ard
the
nort
hwes
t. D
atum
hor
izon
(la
bele
d B
–B)
is b
elow
the
thi
n ra
dioa
ctiv
e la
yer
show
n as
hor
izon
b in
Fig
ure
5. A
bbre
viat
ions
: Cor
r., c
orre
c-tio
n; F
OC
, fo
cuse
d; I
LD,
indu
ctio
n lo
g de
ep; I
LM,
indu
ctio
n lo
g m
ediu
m; I
LS in
duct
ion
log
shal
low
; LR
S,
low
er R
acin
e se
quen
ce; P
or.,
poro
sity
; SP,
sel
f-po
tent
ial;
TD
, to
tal d
epth
; UR
S,
uppe
r R
acin
e se
quen
ce.
Illinois State Geological Survey Circular 577 11
60,5
55 fe
et20
2124
4310
0
Equ
itabl
e R
esou
rces
Exp
lora
tion
IL-3
032
T14
N, R
2W, S
ec. 1
9C
hris
tian
Cou
nty
1202
1243
3300
Pod
olsk
y, B
erna
rdM
cMill
en 4
-BT
15N
, R1W
, Sec
. 9C
hris
tian
Cou
nty
1211
5216
5400
Trip
le G
Oil
Com
pany
Ltd
.S
cher
er 2
T16
N, R
1E, S
ec. 2
Mac
on C
ount
y
33,7
20 fe
et21
,535
feet
33,4
00 fe
et12
1152
1703
00
Paw
nee
Oil
& G
as, I
nc.
Gar
ver
1T
16N
, R1E
, Sec
. 2M
acon
Cou
nty
1211
5214
4400
Trip
le G
Oil
Com
pany
Ltd
.S
chw
arze
-Pen
se C
omm
unity
2T
17N
, R2E
, Sec
. 24
Mac
on C
ount
y
Upper DevonianNew AlbanyShale Group
Racine Formation
Devonian
Niagaran
SilurianSYSTEM
SERIES
GROUP/FORMATION LRS URS
C
GA
MM
A-R
AYR
ES
IST
IVIT
Y
2,00
0
2,00
0IL
M (
Ohm
-m)
ILD
(O
hm-m
)A
PI
0 -200
SP
(m
V)
0.2
2,00
0F
OC
(O
hm-m
)0.
2
0.2
150
AP
I15
030
0 0
1,900 2,000 2,100
Jolie
tF
m
TD
= 2
,200
feet
GA
MM
A-R
AYR
ES
IST
IVIT
Y
2,00
0
2,00
0IL
M (
Ohm
-m)
ILD
(O
hm-m
)A
PI
0 -200
SP
(m
V)
0.2
2,00
0F
OC
(O
hm-m
)0.
2
0.2
150 0
AP
I15
030
0
Inch
es6
16
Cal
iper
GA
MM
A-R
AYB
ULK
DE
NS
ITY
150
AP
I2
g/cm
3
02.
5C
orr.
152.
5
0.3
0.1
Den
s. P
or.
0.3
0.1
Neu
t. P
or.
Inch
es6
16
Cal
iper
GA
MM
A-R
AYB
ULK
DE
NS
ITY
150
AP
I2
025
Cor
r.
152.
5
0.3
0.1
Den
s. P
or.
0.3
0.1
Neu
t. P
or.
300
AP
I15
0
RE
SIS
TIV
ITY
00IL
S (
Ohm
-m)
ILD
(O
hm-m
)-2
000
SP
(m
V)
SE
LF-
PO
TE
NT
IAL
100
100
2,0001,800 1,900
TD
= 2
,049
feet
Dat
umLi
ne
UR
S
LRS
1,900 2,000 2,100
TD
= 2
,100
feet
TD
= 2
,175
feet
2,1002,000
UR
S
LRS
2,200 2,3002,100
TD
= 2
,892
feet
C�
MA
CO
N
LOG
AN
SA
NG
AM
ON
CH
RIS
TIA
N
C
C�
g/cm
3
Fig
ure
9 S
trat
igra
phic
cro
ss s
ectio
n C
–C
alon
g th
e M
t. A
ubur
n tr
end
show
ing
rath
er u
nifo
rm t
hick
ness
and
lith
olog
y fo
r th
e R
acin
e se
quen
ces.
Dat
um h
oriz
on
(labe
led
C–C
) is
bel
ow t
he t
hin
radi
oact
ive
laye
r w
ithin
the
low
er s
eque
nce
show
n as
hor
izon
b in
Fig
ure
5. A
bbre
viat
ions
: Den
s.,
dens
ity; F
OC
, fo
cuse
d; F
m,
For
mat
ion;
ILD
, in
duct
ion
log
deep
; ILM
, in
duct
ion
log
med
ium
; IR
S,
indu
ctio
n lo
g sh
allo
w; L
RS
, lo
wer
Rac
ine
sequ
ence
; Neu
t., n
eutr
on; P
or.,
poro
sity
; SP,
sel
f-po
tent
ial;
TD
, to
tal d
epth
; UR
S,
uppe
r R
acin
e se
quen
ce.

12 Circular 577 Illinois State Geological Survey
42,9
11 fe
et12
1672
4844
00
Pod
olsk
y, B
erna
rdD
arna
ll 2
T16
N, R
2W, S
ec. 3
2S
anga
mon
Cou
nty
21,7
69 fe
et12
0212
4333
00
Pod
olsk
y, B
erna
rdM
cMill
en 4
-BT
15N
, R1W
, Sec
. 9C
hris
tian
Cou
nty
13,4
67 fe
et12
1150
0103
00
Sun
Oil
Com
pany
Dam
ery,
Jos
eph
F. 1
T15
N, R
1E, S
ec. 5
Mac
on C
ount
y
1211
5225
0000
Eas
tern
Am
eric
an E
nerg
y C
orp.
Bar
nard
, N. 1
T15
N, R
1E, S
ec. 1
0M
acon
Cou
nty
1,800
Niagaran
New AlbanyShale Group
Racine Formation
Upper Devonian-Kinderhookian
Devonian-Mississippian SilurianSYSTEM
SERIES
GROUP/FORMATION
JolietFm
Cht
Ls
D
1,600 1,700 1,900
LRS
GA
MM
A-R
AYR
ES
IST
IVIT
Y
2,00
0
2,00
0IL
M (
Ohm
-m)
ILD
(O
hm-m
)A
PI
0 -200
SP
(m
V)
0.2
2,00
0F
OC
(O
hm-m
)0.
2
0.2
150 0
AP
I15
030
0
TD
= 1
,955
feet
GA
MM
A-R
AYR
ES
IST
IVIT
Y
2,00
0
2,00
0IL
M (
Ohm
-m)
ILD
(O
hm-m
)A
PI
0 -200
SP
(m
V)
0.2
2,00
0F
OC
(O
hm-m
)0.
2
0.2
150 0
AP
I15
030
0
RE
SIS
TIV
ITY
00IL
S (
Ohm
-m)
ILD
(O
hm-m
)-2
000
SP
(m
V)
SE
LF-
PO
TE
NT
IAL
100
100
GA
MM
A-R
AYR
ES
IST
IVIT
Y
2,00
0
2,00
0IL
M (
Ohm
-m)
ILD
(O
hm-m
)A
PI
0 -200
SP
(m
V)
0.2
2,00
0F
OC
(O
hm-m
)0.
2
0.2
150 0
AP
I15
030
0
1,700 1,800 1,900
Dat
umLi
ne
TD
= 2
,049
feet
2,3002,100 2,200
2,1002,0001,9001,800
LRS
UR
S
TD
= 3
,780
feet
TD
= 2
,620
feet
D�
2,000
DD
�
MA
CO
NS
AN
GA
MO
N
CH
RIS
TIA
N
SH
ELB
Y
LO
GA
N
Fig
ure
10
Cro
ss s
ectio
n D
–D
acro
ss t
he M
t. A
ubur
n tr
end
show
ing
eros
iona
l tru
ncat
ion
and
unev
en t
opog
raph
y in
the
upp
er b
ound
ary
of t
he lo
wer
and
upp
er R
acin
e se
quen
ces.
Not
e th
at t
he N
ew A
lban
y S
hale
Gro
up t
hick
ens,
but
the
Rac
ine
For
mat
ion
beco
mes
thi
n-ne
r to
war
d th
e w
est.
Dat
um (
labe
led
D–D
) is
the
sam
e as
dat
um fo
r F
igur
e 9
(sho
wn
as h
oriz
on b
in F
igur
e 5)
. Abb
revi
atio
ns: C
ht L
s,
Cho
utea
u Li
mes
tone
; Fm
, F
orm
atio
n; F
OC
, fo
cuse
d; I
LD,
indu
ctio
n lo
g de
ep; I
LM,
indu
ctio
n lo
g m
ediu
m; I
LS,
indu
ctio
n lo
g sh
allo
w; L
RS
, lo
wer
Rac
ine
sequ
ence
; UR
S,
uppe
r R
acin
e se
quen
ce; S
P, s
elf-
pote
ntia
l; T
D,
tota
l dep
th.

Illinois State Geological Survey Circular 577 13
200
180
180
170
170
160
150
150
150
140
140
190
T14N
T15N
T16N
T17N
R2ER1ER1WR2W
MACON
LOGAN
SANGAMON
CHRISTIAN
130153175198220
Thickness (feet)
Oil well Abandoned oil well Dry hole County boundary Township boundary 10-foot contour intervals
0 3 mi
0 4.8 kmNN
Figure 11 Thickness map of the New Albany Shale Group from the top of the Silurian to the base of the Chouteau Limestone. The New Albany Shale Group thickens toward the northwest, away from the Mt. Auburn trend and toward the cen-ter of the Sangamon Arch (see Figure 1 for the location of the Sangamon Arch), suggesting that the arch area was subsiding at the onset of the Upper Devonian deposition. The closures in the Mt. Auburn trend area are due to pre-Devonian differential erosion.
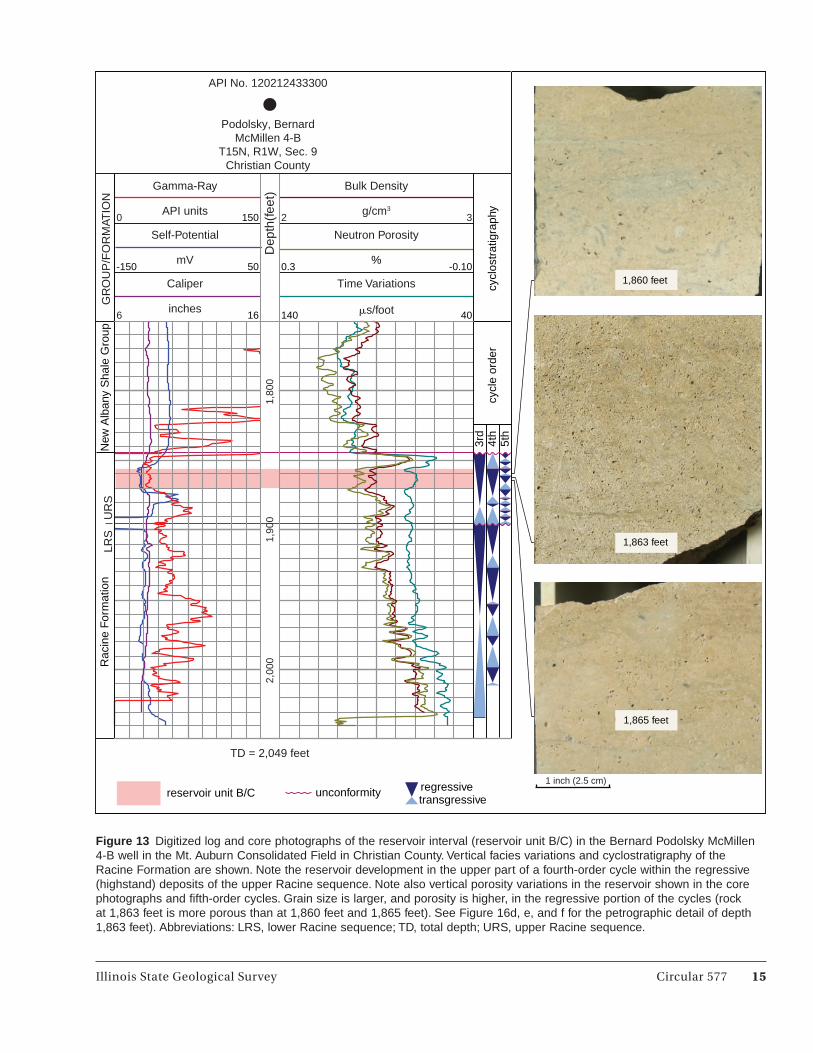
that is typical of non-reservoir facies. The reservoir units are defined here on the basis of facies and their strati-graphic position and are designated, from top to base, as non-reef reservoir units A, B, and C and patch reef/reef rudstone reservoir unit D. Individual reservoirs may show internal vertical porosity variations (e.g., the high-frequency fifth-order cycles and core photographs from the Bernard Podol-sky McMillen 4-B well in Figure 13).
No structural closures are present in the study area, and minor closures in some areas of the Sangamon Arch are the consequence of post-depositional erosion and the formation of uneven topography at the sequence boundar-ies (Y. Lasemi 2009c). A combination of depositional and diagenetic strati-graphic traps controlled petroleum entrapment in the Mt. Auburn trend, and the reservoirs are normally sealed by lime mudstones to packstones that
were deposited in quiet water environ-ments following the flooding stages of high-frequency sea level cycles (Y. Lasemi 2009c).
Non-reef Reservoir Units A, B, and CNon-reef reservoir units A, B, and C occur in the upper part of the upper sequence of the Racine Formation (Figure 4). They are characterized by

14 Circular 577 Illinois State Geological Survey
Oil well Abandoned oil well Dry hole County boundary Township boundary 25-foot contour intervals
0 3 mi
0 4.8 kmNN
MACON
LOGAN
SANGAMON
CHRISTIAN
T14N
T15N
T16N
T17N
R2ER1ER1WR2W
-1,706-1,514-1,322-1,130-938
Subsea elevation (feet)
-1500
-1625
-1750
-150
0
-1375
-1375
-1375
-1250
-125
0
-1250
-1125
-112
5
-125
0
Figure 12 Structure contour map of the base of the New Albany Shale Group showing the direction of the regional dip toward the southeast. Note minor closures and noses that are due to uneven pre-New Albany Shale Group topography.
porous dolomitized wackestone to grainstone (Figures 13; 16c, d; and 17a, b). The reservoirs contain partially dolomitized echinoderm fragments (Figures 16d and 17b) and molds of bioclasts that include crinoids, bra-chiopods, corals, and non-recognizable grains (Figure 17b). In some areas or in some horizons within a reservoir, only dolomite crystals are recognized, but they contain a very faint relict shadow-ing that could represent the organic residue of the original bioclasts that they replaced (Figure 17a). The res-
ervoirs are lenticular (Figures 18, 19, and 20) and are encased within imper-meable host limestone strata (Figure 16a, b) displaying cyclic patterns of non-reservoir to reservoir packages (Figures 4, 13, 14, 15, 21, 22, and 23). Porosity of the reservoir rocks exceeds 20% in some horizons. The highest reported initial production was 1,360 barrels of oil per day in the Comanche Oil Co. No. 3 Tomlin well, T15N, R2W, Sec. 7, Mt. Auburn Consolidated Field, in Christian County. Examination of the numerous wells in the Mt. Auburn
trend indicates that most of the wells drilled thus far have only tested the upper part of the upper sequence of the Racine Formation.
Reservoir Unit A Unit A is a lenticu-lar dolomite reservoir of limited lateral extent (Figure 18) that is recognized in the uppermost part of the upper Racine sequence (Figures 14, 15, 21, 22, and 23). Reservoir unit A is up to 14 feet (4 m) thick and is separated from unit B or C by up to 10 feet (3 m)
Illinois State Geological Survey Circular 577 15
API No. 120212433300
Podolsky, BernardMcMillen 4-B
T15N, R1W, Sec. 9Christian County
TD = 2,049 feet
Bulk Density
32g/cm3
Time Variations
Neutron PorositySelf-Potential
mV
6
Gamma-Ray
0
LRS
UR
SG
RO
UP
/FO
RM
ATIO
NR
acin
e F
orm
atio
nN
ew A
lban
y S
hale
Gro
up
1,80
01,
900
2,00
0D
epth
(fee
t)
cycl
e or
der
cycl
ostr
atig
raph
yAPI units
-150 50
150
16 �s/foot
%0.3
140
Caliper
inches
-0.10
40
3rd
4th
5th
1,860 feet
1,863 feet
1,865 feet
1 inch (2.5 cm)reservoir unit B/C unconformity
transgressiveregressive
Figure 13 Digitized log and core photographs of the reservoir interval (reservoir unit B/C) in the Bernard Podolsky McMillen 4-B well in the Mt. Auburn Consolidated Field in Christian County. Vertical facies variations and cyclostratigraphy of the Racine Formation are shown. Note the reservoir development in the upper part of a fourth-order cycle within the regressive (highstand) deposits of the upper Racine sequence. Note also vertical porosity variations in the reservoir shown in the core photographs and fifth-order cycles. Grain size is larger, and porosity is higher, in the regressive portion of the cycles (rock at 1,863 feet is more porous than at 1,860 feet and 1,865 feet). See Figure 16d, e, and f for the petrographic detail of depth 1,863 feet). Abbreviations: LRS, lower Racine sequence; TD, total depth; URS, upper Racine sequence.

16 Circular 577 Illinois State Geological Survey
API No. 121152170300
Pawnee Oil & Gas, Inc.Garver 1
T16N, R1E, Sec. 2Macon County
GR
OU
P/F
OR
MAT
ION
Density Porosity
%
Fou
rth-
/fifth
-ord
er c
ycle
s
g/cm3
Gamma-Ray
API units
%
Gamma-Ray
API units
Bulk Density
Neutron Porosity-0.100.3
32
0 450
-0.100.3
0 150
Dep
th (
feet
)1,
900
2,00
02,
100
TD = 2,175 feet
New
Alb
any
Sha
le G
roup
LRS
UR
SR
acin
e F
orm
atio
n
reservoir unit D
unconformity
reservoir unit A
reservoir unit C transgressive
regressive
Figure 14 Digitized log of the Pawnee Oil and Gas Inc. Garver No. 1 well in the Harristown Field, Macon County, showing cyclicity and reservoir development in the Racine Formation sequences. Note the development of reservoir units A and C in the upper sequence and reservoir unit D in the lower sequence (no cores/samples are available for this well, and the differentiation of reef and non-reef reservoirs is based on stratigraphic correlation). Note also that the reservoirs occur in the upper part of fourth-order cycles within the shallowing-upward portion (highstand tract) of the third-order cycles. Abbreviations: LRS, lower Racine sequence; TD, total depth; URS, upper Racine sequence.

Illinois State Geological Survey Circular 577 17
Figure 15 Digitized log of the Pawnee Oil and Gas Inc. Rothwell No. 1 well in the Blackland North Field in Macon County showing the development of non-reef reservoir units A, B, and C in the upper part of the upper Racine sequence. Note the occur-rence of the reservoirs in the regressive portion of fourth-order depositional cycles. Abbreviations: Cht Ls, Chouteau Limestone; LRS, lower Racine sequence; TD, total depth; URS, upper Racine sequence.
0-3.0 V/V
API No. 121152155700
Pawnee Oil & Gas, Inc.Rothwell 1
T16N, R1E, Sec. 21Macon County
ChtLs
Density Porosity
%
LRS
UR
SG
RO
UP
/FO
RM
ATIO
NR
acin
e F
orm
atio
nN
ew A
lban
y S
hale
Gro
up
four
th-/
fifth
-ord
er c
ycle
s
Gamma-Ray
API units
%
Dep
th (
feet
)
TD = 2,040 feet
Bulk Density
g/cm3
Neutron Porosity
Self-Potential
mV 0.3 -0.10
32
-150 50
0 150
-0.100.3
1,80
01,
900
2,00
0
reservoir unit C
unconformity transgressive
regressivereservoir unit A
reservoir unit B

18 Circular 577 Illinois State Geological Survey
CR
CR
CR
d 0.5 mm
CR
Si
CR
1,863 feet
c 2.5 cma 2.5 cm b 0.5 mm
Figure 16 (a) Core photograph of a bioturbated lime mudstone to wackestone facies in the Pawnee Oil Corp. Elder No. 1 well, T15N, R1W, Sec. 12, in the Mt. Auburn Consolidated Field in Christian County that caps a dolomitized patch reef reservoir. (b) Photomicrograph of a coarsening-upward lime mudstone to bryozoan crinoid wackestone facies from an impermeable capping limestone. The groundmass is partially replaced by very finely crystalline dolomite. (c) Polished core slab photograph of a porous dolomitized grainstone facies (also shown in Figure 13). (d) Photomicrograph of a part of c under polarized light showing an irregular dolo-mitization front (arrows) on crinoid fragments (CR), dolomite rhombs, and void spaces (black) formed as a result of dolomitization. Note that the crinoid fragment in the upper right is partially silicified (SI).

Illinois State Geological Survey Circular 577 19
CR
BI
BICR
2.5 cmc
0.7 mme
0.25 mmb0.5 mma
d 1.25 cm
f 0.5 mm
Figure 17 Photomicrographs a and b are from reservoir unit C in Bernard Podolsky McMillen 4-B well (depth 1,859, see Figure 13), T15N, R1W, Sec. 9, in the Mt. Auburn Consolidated Field in Christian County. (a) Porous dolomitized non-reef reservoir under plane light in which the original texture has been destroyed by pervasive dolomitization. Note the partial dissolution of the dolomite rhombs and enlargement of the pore spaces (arrow). (b) Photomicrograph of a non-reef wackestone reservoir showing partially preserved crinoids (CR) and molds of bivalves (BI) and other unrecognizable grains in a finely crystal-line dolomite groundmass. Core photographs c, d, e, and f are of a patch reef reservoir unit D in the Pawnee Oil Corp. Elder No. 1 well (depth 2,005 feet, see Figure 24), T15N, R1W, Sec. 12, in the Mt. Auburn Consolidated Field in Christian County. (c, d) Dolomitized reef facies composed mainly of coral skeletons. (e) Photomicrograph of a thin section of d show-ing vuggy porosity as a result of dissolution of the skeletons, which are hardly recognizable in thin section. (f) Photomicrograph of an enlarged portion of e. Note the organic residue of the original skeletons and the dissolution of dolomite rhombs (white arrow) to form larger pore spaces.

20 Circular 577 Illinois State Geological Survey
5 0
10
50
00
5 05
0
50
0 0.5 mi
0 0.8 kmNN
>10 feet
5–10 feet
0–5 feet
Oil well
Abandoned oil well
Dry hole
Section boundary
5-foot contour intervals
16
22
27
14
29
17
21
15
28 26
2320
Figure 18 Thickness map of the dolomite reservoir unit A in the Blackland North Field showing a very limited lateral extent of the reservoir due to lateral facies changes and post-Silurian erosion.
of impermeable cherty fossiliferous limestone. This tight limestone is just above marker horizon e (Figure 5) and is a laterally persistent horizon in the Mt. Auburn trend (Figures 7, 8, 9, 10, 21, 22, 23, and 24). Reservoir unit A is capped by impermeable limestone of variable thickness (Figures 14, 15, 21,
22, and 23), but, where it is removed by erosion, the New Albany Shale Group becomes the capping facies for petro-leum entrapment (Bernard Podolsky Vail 3-A, Figure 23). In some areas of the Mt. Auburn trend, however, the absence of reservoir unit A may be the result of post-Silurian erosion, which
is well illustrated in cross section G–G (Figure 23). In some areas of the Mt. Auburn trend, deep erosion has removed the interval that could other-wise include reservoir unit A (Figures 21, 22, and 23). In some areas of the Mt. Auburn trend, reservoir unit A is sub-divided into two horizons separated by

Illinois State Geological Survey Circular 577 21
0
0
0 0.5 mi
0 0.8 kmNN
0–4 feet
>4 feet Oil well
Abandoned oil well
Dry hole
Section boundary
4-foot contour intervals
0
04
0
0
04
16
22
27
14
29
17
21
15
28 26
2320
Figure 19 Thickness map of the dolomite reservoir unit B in the Blackland North Field showing the lenticular nature of the reservoir. Note that the reservoir lenses are aligned in a northeast-southwest direction lying roughly parallel to the Mt. Auburn trend.
a tight impermeable limestone (e.g., Bernard Podolsky McMillen 3-A, Figure 23).
Reservoir Unit B Reservoir unit B is another lenticular dolomitic horizon along the Mt. Auburn trend of the San-gamon Arch, and it is best developed in the Blackland North Field (Figures 2
and 19). Reservoir unit B is up to 5 feet (1.5 m) thick and occurs just below the impermeable and persistent limestone marker below geophysical marker e (Figures 15 and 22). A tight limestone up to 6 feet (2 m) thick separates reservoir unit B from the underlying reservoir unit C. In other fields of the Mt. Auburn trend, either reservoir unit
B pinches out, leaving reservoir unit C below the tight limestone as the only reservoir there, or the tight underlying limestone thins out, forming a single combined reservoir of units B and C (Figures 21 and 23).
Reservoir Unit C Reservoir unit C can attain a thickness of over 20 feet

22 Circular 577 Illinois State Geological Survey
Oil well
Abandoned oil well
Dry hole0–5 feet
>15 feet
5–10 feet
10–15 feet
Section boundary
5-foot contour intervals
0 0.5 mi
0 0.8 kmNN
16
22
27
14
29
17
21
15
28 26
2320
50
1015
5010
5
10
50
10
50
5
0
5
5
50
5
Figure 20 Thickness map showing the lateral distribution of the dolomite reservoir unit C along the Mt. Auburn trend. This lenticular dolomite unit is more extensive than reservoir units A and B and is present in all of the oil fields along the Mt. Auburn trend.
(6 m) of dolomite in parts of the Mt. Auburn trend and is more extensive than the other reservoirs (Figure 20). It is overlain by up to 6 feet (2 m) of impermeable limestone in Blackland North Field (Figures 15 and 22). This
tight limestone thins out laterally beyond the resolution of the geophysi-cal logs (Figures 21 and 23). Due to lateral thinning of this tight limestone, reservoir units B and C may coalesce, forming a single unit C reservoir
underlying the widespread imperme-able cherty limestone marker just below geophysical marker e (Figures 13, 21, and 23). Reservoir unit C is also lenticular (Figure 20) and pinches out laterally into impermeable facies (e.g.,
Illinois State Geological Survey Circular 577 23
28
1211
5214
8400
Com
anch
e O
il (n
ow A
tlant
ic E
nerg
y)P
aris
h, G
eral
d 6
T16
N, R
1E, S
ec. 2
Mac
on C
ount
y
1,87
6 fe
et12
1152
1475
00
Paw
nee
Oil
& G
as, I
nc.
Par
ish,
Jam
es 4
T16
N, R
1E, S
ec. 2
Mac
on C
ount
y
663
feet
1211
5217
0300
Paw
nee
Oil
& G
as, I
nc.
Gar
ver
1T
16N
, R1E
, Sec
. 2M
acon
Cou
nty
2,13
5 fe
et12
1152
1601
00
Com
anch
e O
il (n
ow A
tlant
ic E
nerg
y)R
oby-
Mill
er #
7-C
7-C
T16
N, R
1E, S
ec. 1
Mac
on C
ount
y
Upper Devonian
New AlbanyShale Group
Devonian
Niagaran
SilurianSYSTEM
SERIES
GROUP/FORMATION
RacineFm
Inch
esC
ALI
PE
R
GA
MM
A-R
AY
AP
I
Cor
r.
BU
LK D
EN
SIT
Y
g/cm
3
Den
sity
Por
osity
61615
02
025
153
0.3
-0.1
0
1,900 2,000
TD
= 2
,021
feet
TD
= 2
,055
feet
Inch
es
CA
LIP
ER
GA
MM
A-R
AYB
ULK
DE
NS
ITY
AP
Ig/
cm3
Den
sity
Por
osity
61615
02
025
Cor
r.
153
0.3
-0.1
0In
ches
CA
LIP
ER
GA
MM
A-R
AYB
ULK
DE
NS
ITY
AP
I
Neu
tron
Por
osity
AP
I
g/cm
3
Den
sity
Por
osity
61615
02
025
Cor
r.
153
0.3
-0.1
0
0.3
-0.1
0
300
150
Inch
esC
ALI
PE
R
GA
MM
A-R
AYB
ULK
DE
NS
ITY
AP
I
Neu
tron
Por
osity
g/cm
3
Den
sity
Por
osity
61615
02
025
Cor
r.15
3
0.3
-0.1
0
0.3
-0.1
0
2,0001,900
Dat
umLi
ne
1,900 2,000
2,0001,900
TD
= 2
,175
feet
TD
= 2
,073
feet
EE
�
T16
N
T15
N
R1E
R1W
MA
CO
N
CH
RIS
TIA
N
EE
�
2,100
rese
rvoi
r un
it A
rese
rvoi
r un
it C
rese
rvoi
r un
it D
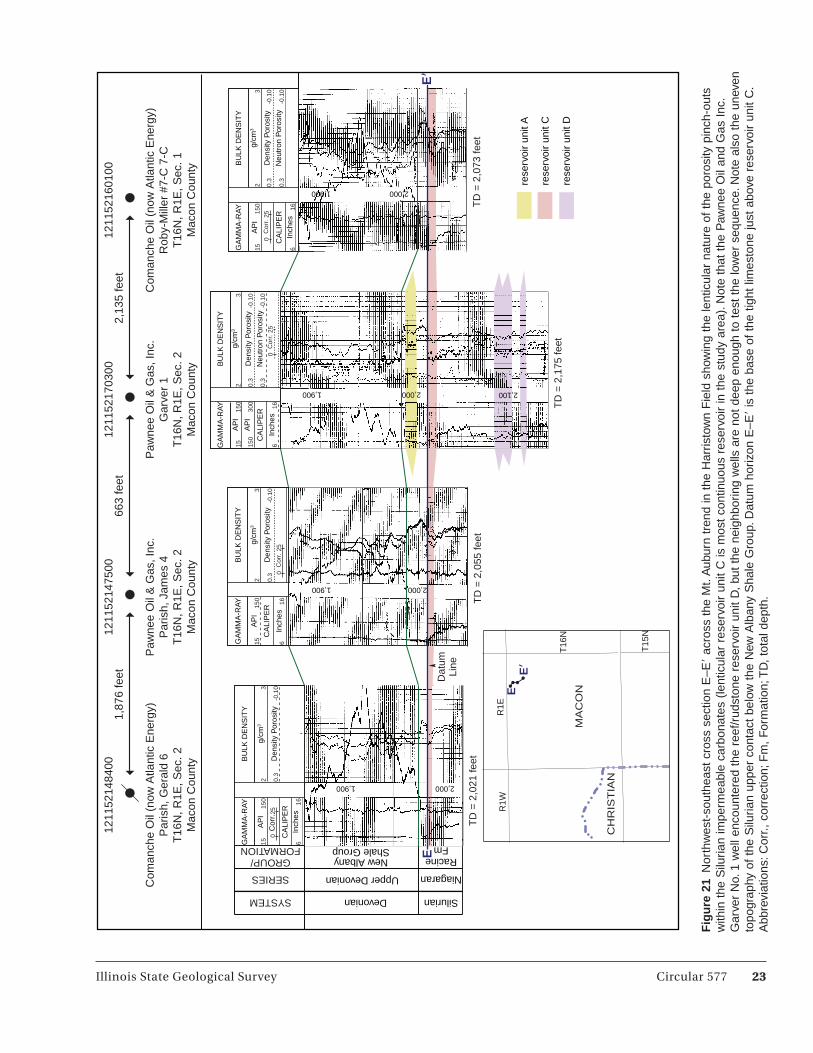
Fig
ure
21
Nor
thw
est-
sout
heas
t cr
oss
sect
ion
E–E
ac
ross
the
Mt.
Aub
urn
tren
d in
the
Har
risto
wn
Fie
ld s
how
ing
the
lent
icul
ar n
atur
e of
the
por
osity
pin
ch-o
uts
with
in t
he S
iluria
n im
perm
eabl
e ca
rbon
ates
(le
ntic
ular
res
ervo
ir un
it C
is m
ost
cont
inuo
us r
eser
voir
in t
he s
tudy
are
a). N
ote
that
the
Paw
nee
Oil
and
Gas
Inc
. G
arve
r N
o. 1
wel
l enc
ount
ered
the
ree
f/rud
ston
e re
serv
oir
unit
D,
but
the
neig
hbor
ing
wel
ls a
re n
ot d
eep
enou
gh t
o te
st t
he lo
wer
seq
uenc
e. N
ote
also
the
une
ven
topo
grap
hy o
f th
e S
iluria
n up
per
cont
act
belo
w t
he N
ew A
lban
y S
hale
Gro
up. D
atum
hor
izon
E–E
is
the
bas
e of
the
tig
ht li
mes
tone
just
abo
ve r
eser
voir
unit
C.
Abb
revi
atio
ns: C
orr.,
cor
rect
ion;
Fm
, F
orm
atio
n; T
D,
tota
l dep
th.
24 Circular 577 Illinois State Geological Survey
FF
�
28
rese
rvoi
r un
it A
rese
rvoi
r un
it C
rese
rvoi
r un
it B
664
feet
1211
5216
8200
Trip
le G
Oil
Com
pany
Ltd
.H
ill E
stat
e #1
T16
N, R
1E, S
ec. 2
0M
acon
Cou
nty
1,46
7 fe
et12
1152
1654
00
Trip
le G
Oil
Com
pany
Ltd
.S
cher
er 2
T16
N, R
1E, S
ec. 2
1M
acon
Cou
nty
1,32
3 fe
et12
1152
1689
00
Paw
nee
Oil
& G
as, I
nc.
Bea
tty 4
T16
N, R
1E, S
ec. 2
1M
acon
Cou
nty
1211
5215
5700
Paw
nee
Oil
& G
as, I
nc.
Rot
hwel
l 1T
16N
, R1E
, Sec
. 21
Mac
on C
ount
y
Inch
es
CA
LIP
ER
GA
MM
A-R
AY
AP
I
AP
I
Neu
tron
Por
osity
g/cm
3
Den
sity
Por
osity
61620
0
2
025
0
3
0.3
-0.1
0
0.3
-0.1
0
400
200
BU
LK D
EN
SIT
Y
Cor
r.
Inch
es
CA
LIP
ER
GA
MM
A-R
AY
AP
I
61615
015
BU
LK D
EN
SIT
Y
Neu
tron
Por
osity
g/cm
3
Den
sity
Por
osity
2
025
Cor
r.
3
0.3
-0.1
0
0.3
-0.1
0In
ches
CA
LIP
ER
GA
MM
A-R
AY
AP
I
AP
I
61615
015
300
150
BU
LK D
EN
SIT
Y
Cor
r.N
eutr
on P
oros
ity
g/cm
3
Den
sity
Por
osity
2
025
3
0.3
-0.1
0
0.3
-0.1
0In
ches
CA
LIP
ER
GA
MM
A-R
AY
AP
I
Cor
r.
Neu
tron
Por
osity
g/cm
3
Den
sity
Por
osity
BU
LK D
EN
SIT
Y
61615
02
025
153
0.3
-0.1
0
1515
0
UpperDevonian
New AlbanyShale Group Racine Formation
Devonian
Niagaran
SilurianSYSTEM
SERIES
GROUP/FORMATION
LRSURS
2,0001,900
TD
= 2
,100
feet
TD
= 2
,057
feet
TD
= 1
,966
feet
TD
= 2
,040
feet
1,900 1,950
1,900 2,000
1,900 2,000
2,100
LRS
UR
SD
atum
Line
MA
CO
NC
HR
IST
IAN
T16
N
T15
N
R1E
R1W
FF
�
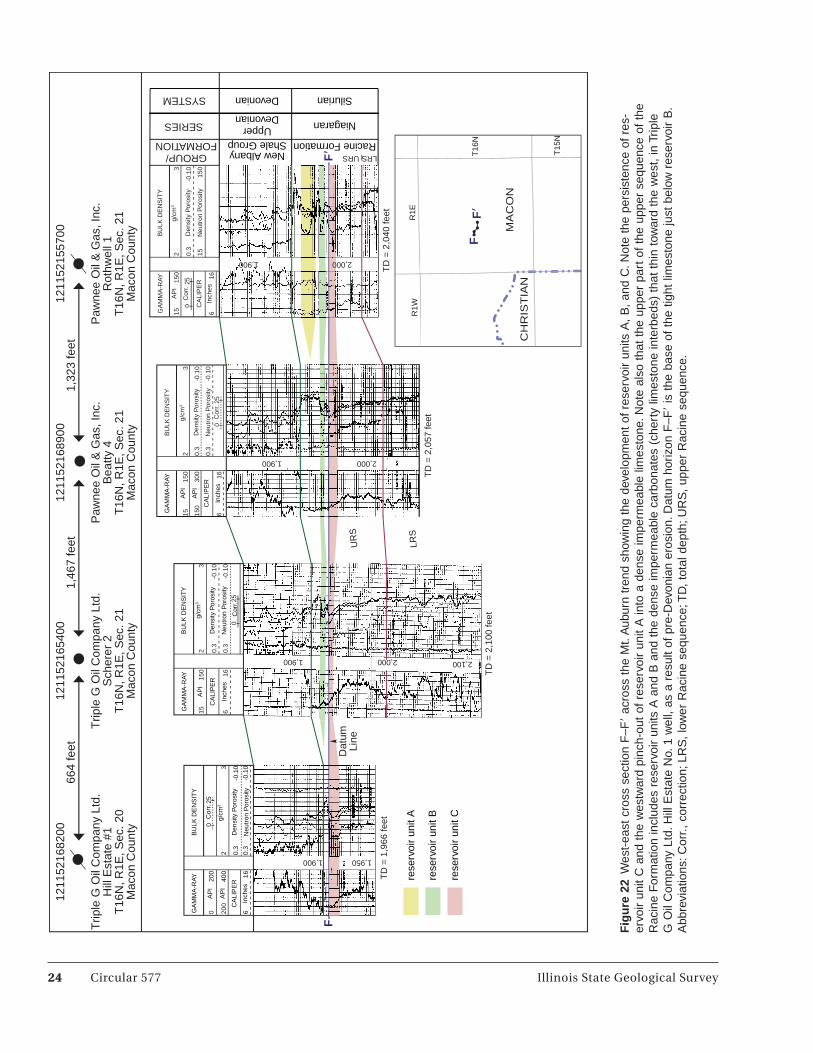
Fig
ure
22
Wes
t-ea
st c
ross
sec
tion
F–F
ac
ross
the
Mt.
Aub
urn
tren
d sh
owin
g th
e de
velo
pmen
t of
res
ervo
ir un
its A
, B
, an
d C
. Not
e th
e pe
rsis
tenc
e of
res
-er
voir
unit
C a
nd t
he w
estw
ard
pinc
h-ou
t of
res
ervo
ir un
it A
into
a d
ense
impe
rmea
ble
limes
tone
. Not
e al
so t
hat
the
uppe
r pa
rt o
f th
e up
per
sequ
ence
of
the
Rac
ine
For
mat
ion
incl
udes
res
ervo
ir un
its A
and
B a
nd t
he d
ense
impe
rmea
ble
carb
onat
es (
cher
ty li
mes
tone
inte
rbed
s) t
hat
thin
tow
ard
the
wes
t, in
Trip
le
G O
il C
ompa
ny L
td. H
ill E
stat
e N
o. 1
wel
l, as
a r
esul
t of
pre
-Dev
onia
n er
osio
n. D
atum
hor
izon
F–F
is
the
bas
e of
the
tig
ht li
mes
tone
just
bel
ow r
eser
voir
B.
Abb
revi
atio
ns: C
orr.,
cor
rect
ion;
LR
S,
low
er R
acin
e se
quen
ce; T
D,
tota
l dep
th; U
RS
, up
per
Rac
ine
sequ
ence
.

Illinois State Geological Survey Circular 577 25
Figu
re 1
9
GG
�
1900
28 GG
�
1,32
2 fe
et2,
230
feet
1,17
4 fe
et12
0210
0805
00
Pod
olsk
y, B
erna
rdV
ail 3
-AT
15N
, R1W
, Sec
. 4C
hris
tian
Cou
nty
1202
1005
7600
Pod
olsk
y, B
erna
rdR
ober
t Hei
rs 1
T15
N, R
1W, S
ec. 4
Chr
istia
n C
ount
y
1202
1009
8600
Pod
olsk
y, B
erna
rdM
cMill
en 3
-AT
15N
, R1W
, Sec
. 4C
hris
tian
Cou
nty
1202
1243
3300
Pod
olsk
y, B
erna
rdM
cMill
en 4
-BT
15N
, R1W
, Sec
. 9C
hris
tian
Cou
nty
Niagaran
SilurianSYSTEM
SERIES
GROUP/FORMATION
Cht Ls Racine
FormationNew AlbanyShale Group
Upper Devonian
Devonian
URS
RE
SIS
TIV
ITY
ILS
(O
hm-m
)
ILD
(O
hm-m
)
SP
(m
V)
RE
SIS
TIV
ITY
ILS
(O
hm-m
)
ILD
(O
hm-m
)
SP
(m
V)
SE
LF-
PO
TE
NT
IAL
SE
LF-
PO
TE
NT
IAL
00-2
000
100
100
00-2
0010
0
100
1,700 1,800
TD
= 1
,891
feet
Dat
umLi
ne
0
1,700 1,800T
D =
1,8
87 fe
et
RE
SIS
TIV
ITY
SP
(m
V)
SE
LF-
PO
TE
NT
IAL
ILS
(O
hm-m
)
ILD
(O
hm-m
)00
-200
010
0
100
1,700 1,800
TD
= 1
,880
feet
TD
= 2
,049
feet
1,700 1,800
AP
I
SP
(m
V)
AP
I
ILS
(O
hm-m
)
ILD
(O
hm-m
)
FO
C (
Ohm
-m)
0 -200
150 0
150
300
0.2
0.2
0.2
2,00
0
2,00
0
2,00
0
GA
MM
A-R
AYR
ES
IST
IVIT
Y
T16
N
T15
N
R1E
R1W
MA
CO
N
CH
RIS
TIA
N
rese
rvoi
r un
it A
rese
rvoi
r un
it C
Fig
ure
23
Nor
thw
est-
sout
heas
t cr
oss
sect
ion
G–G
ac
ross
the
Mt.
Aub
urn
tren
d in
the
Mt.
Aub
urn
Con
solid
ated
Fie
ld s
how
ing
the
deve
lopm
ent
of r
eser
voir
units
A a
nd C
. Not
e th
e irr
egul
ar t
opog
raph
y of
the
upp
er c
onta
ct o
f th
e R
acin
e F
orm
atio
n an
d th
e la
tera
l pin
ch-o
ut o
f re
serv
oir
unit
A in
to t
he o
verly
ing
New
A
lban
y S
hale
as
a re
sult
of p
ost-
Silu
rian
eros
ion.
Not
e al
so t
hat
in t
he B
erna
rd P
odol
sky
Vai
l 3-A
wel
l, th
e N
ew A
lban
y S
hale
Gro
up c
aps
the
rese
rvoi
r as
a
resu
lt of
ero
sion
and
rem
oval
of
the
dens
e ch
erty
lim
esto
ne t
hat
norm
ally
ove
rlies
res
ervo
ir un
it A
. Dat
um li
ne G
–G
is t
he b
ase
of t
he im
perm
eabl
e lim
esto
ne,
horiz
on (
Fig
ure
5),
just
abo
ve r
eser
voir
C. A
bbre
viat
ions
: Cht
Ls,
Cho
utea
u Li
mes
tone
; FO
C,
focu
sed;
ILD
, in
duct
ion
log
deep
; ILS
, in
duct
ion
log
shal
low
; SP,
se
lf-po
tent
ial;
TD
, to
tal d
epth
; UR
S,
uppe
r R
acin
e se
quen
ce.
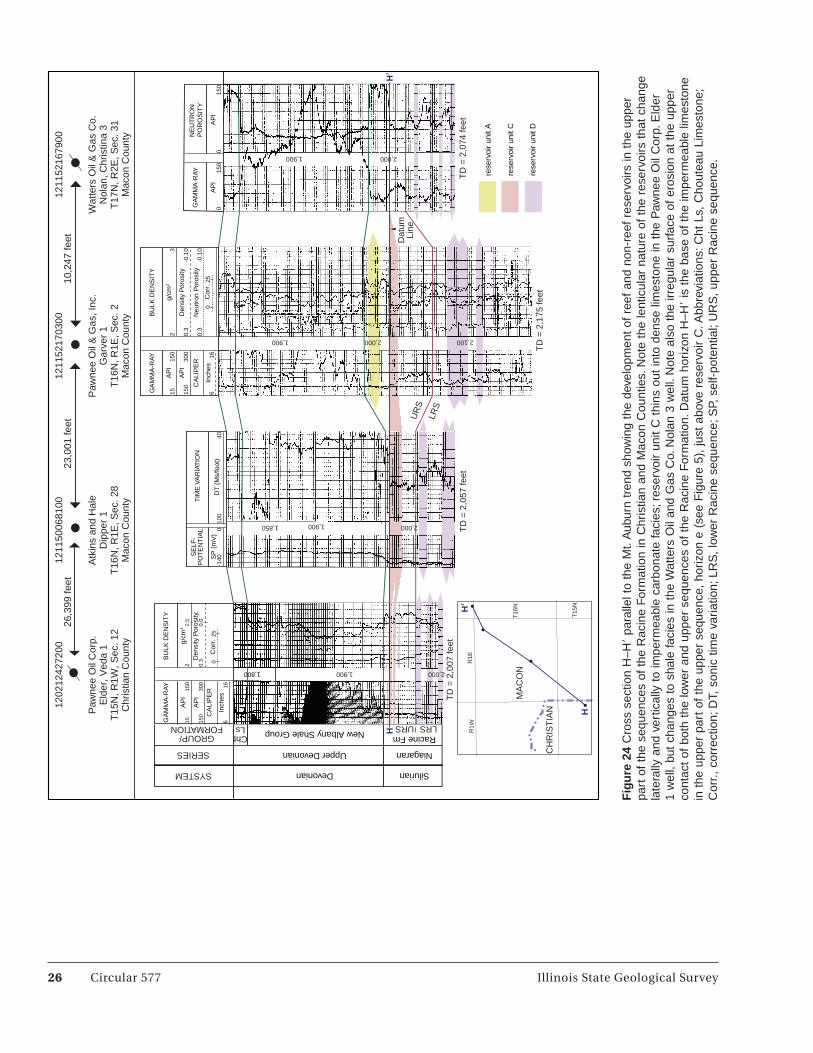
26 Circular 577 Illinois State Geological Survey
F’H
H�
H
28
H�
26,3
99 fe
et23
,001
feet
10,2
47 fe
et12
0212
4272
00
Paw
nee
Oil
Cor
p.E
lder
, Ved
a 1
T15
N, R
1W, S
ec. 1
2C
hris
tian
Cou
nty
1211
5006
8100
Atk
ins
and
Hal
eD
ippe
r 1
T16
N, R
1E, S
ec. 2
8M
acon
Cou
nty
1211
5217
0300
Paw
nee
Oil
& G
as, I
nc.
Gar
ver
1T
16N
, R1E
, Sec
. 2M
acon
Cou
nty
1211
5216
7900
Wat
ters
Oil
& G
as C
o.N
olan
, Chr
istin
a 3
T17
N, R
2E, S
ec. 3
1M
acon
Cou
nty
Upper Devonian
Devonian
Niagaran
SilurianSYSTEM
SERIES
GROUP/FORMATION New Albany Shale Group Racine FmCht
Ls LRSURS
Inch
es
CA
LIP
ER
GA
MM
A-R
AYB
ULK
DE
NS
ITY
AP
Ig/
cm3
Cor
r.
Den
sity
Por
osity
.A
PI
615 150
16150
300
2
0
0.3
25
2.5
0.0
2,0001,9001,800
TD
= 2
,057
feet
TD
= 2
,007
feet
DT
(M
s/fo
ot)
TIM
E V
AR
IAT
ION
SP
(m
V)
SE
LF-
PO
TE
NT
IAL
100
40-1
400
1,850 1,900 2,000
Inch
es
CA
LIP
ER
GA
MM
A-R
AYB
ULK
DE
NS
ITY
AP
Ig/
cm3
Cor
r.
Den
sity
Por
osity
Neu
tron
Por
osity
AP
I
616150
2
025
153
0.3
-0.1
0
0.3
-0.1
0
300
150
1,900 2,000 2,100
TD
= 2
,074
feet
TD
= 2
,175
feet
LRS
UR
S
Dat
umLi
ne
GA
MM
A-R
AY
AP
I
NE
UT
RO
NP
OR
OS
ITY
AP
I0
150
015
0
1,900 2,000
rese
rvoi
r un
it A
rese
rvoi
r un
it D
rese
rvoi
r un
it C
T16
N
T15
N
R1E
R1W
MA
CO
N
CH
RIS
TIA
N
Fig
ure
24
Cro
ss s
ectio
n H
–H
para
llel t
o th
e M
t. A
ubur
n tr
end
show
ing
the
deve
lopm
ent
of r
eef
and
non-
reef
res
ervo
irs in
the
upp
er
part
of
the
sequ
ence
s of
the
Rac
ine
For
mat
ion
in C
hris
tian
and
Mac
on C
ount
ies.
Not
e th
e le
ntic
ular
nat
ure
of t
he r
eser
voirs
tha
t ch
ange
la
tera
lly a
nd v
ertic
ally
to
impe
rmea
ble
carb
onat
e fa
cies
; res
ervo
ir un
it C
thi
ns o
ut in
to d
ense
lim
esto
ne in
the
Paw
nee
Oil
Cor
p. E
lder
1
wel
l, bu
t ch
ange
s to
sha
le fa
cies
in t
he W
atte
rs O
il an
d G
as C
o. N
olan
3 w
ell.
Not
e al
so t
he ir
regu
lar
surf
ace
of e
rosi
on a
t th
e up
per
cont
act
of b
oth
the
low
er a
nd u
pper
seq
uenc
es o
f th
e R
acin
e F
orm
atio
n. D
atum
hor
izon
H–H
is
the
bas
e of
the
impe
rmea
ble
limes
tone
in
the
upp
er p
art
of t
he u
pper
seq
uenc
e, h
oriz
on e
(se
e F
igur
e 5)
, ju
st a
bove
res
ervo
ir C
. Abb
revi
atio
ns: C
ht L
s, C
hout
eau
Lim
esto
ne;
Cor
r., c
orre
ctio
n; D
T, s
onic
tim
e va
riatio
n; L
RS
, lo
wer
Rac
ine
sequ
ence
; SP,
sel
f-po
tent
ial;
UR
S,
uppe
r R
acin
e se
quen
ce.

Illinois State Geological Survey Circular 577 27
Watters Oil and Gas Company Nolan No. 3 in Figure 24).
Patch Reef Reservoir Unit DBased on detailed inspection of well cuttings and cores and correlation of geophysical logs from a few wells that have penetrated the lower part of the Niagaran Series, a patch reef and asso-ciated rudstone facies are identified in the upper part of the lower sequence of the Racine Formation (Y. Lasemi 2009c). The patch reefs (Figures 14 and 17c, d, e, f ) are recognized in the following wells along the Mt. Auburn trend (Figures 24, 25, and 26):
• AtkinsandHaleDipperNo.1,T16N,R1E, Sec. 28, in the Blackland North Field in Macon County (Figure 25, depths 2,012–2,020 feet and 2,037–2,050 feet).
• PawneeOilCorp.GarverNo.1,T16N, R1E, Sec. 2, in the Harristown Field in Macon County (Figure 25, depths 2,082–2,103 feet and 2,112–2,118 feet).
• WattersOilandGasCo.GravesNo.1, T16N, R2E, Sec. 6; Dalton No. 4 and 5, T17N, R2E, Sec. 32; Nolan No. 1, T17N, R2E, Sec. 31; and Nolan No. 3, T17N, R2E, Sec. 31, all in the Decatur field in Macon County (see Figure 25, depths 2,030–2,035 feet, 2,048–2,051 feet, and 2,069–2,074 feet for the Nolan No. 3 well).
• PawneeOilCorp.ElderNo.1,T15N,R1W, Sec. 12, in the Mt. Auburn Con-solidated Field in Christian County (Figure 25, depths 1,988–1994 feet, 2,000–2,007 feet and 2,012–2,017 feet).
The patch reef facies is characterized by porous dolomitized coral reef/reef rudstone facies (Figure 17c, d, e, f ) and is the lowermost productive horizon recognized in the Racine Formation (Figures 14, 24, and 25). The patch reef facies consists of coarsely crystal-line dolomite containing remnants and molds of reef-building organisms (mainly corals). The reef-building skeletons are recognizable in cores and hand samples (Figure 17c, d), but the detail of their structure is lost due to pervasive dolomitization. In
thin sections, only very faint relicts of the organic material of the original skeleton are visible (Figure 17e, f ). Intercrystalline and moldic porosities can reach more than 25%; the highest initial production reported was 3,120 barrels of oil per day in the Atkins and Hale Dipper No. 1, T16N, R1E, Sec. 28, in Macon County.
The majority of wells in the study area have not tested the lower part of the Niagaran deposits that include the newly recognized patch reefs, and these potentially prolific lower hori-zons have been mostly overlooked. The highest initial production (over 3,000 barrels per day) is associated with this type of reservoir; therefore, more pro-ductive Niagaran patch reefs are likely to be found along the Sangamon Arch.
Discussion
Depositional Environment and Carbonate PlatformThe Racine Formation is composed mostly of various skeletal components that include fragments of echino-derms, bryozoans, brachiopods, and corals, suggesting deposition in an open marine setting. Coral fragments were probably derived by storm events from the reefs that had existed farther offshore in the deeper part of the basin. The Racine Formation consists of high-energy bioclast grainstone to pack-stone (Figure 16c, d), coral patch reef/reef rudstone facies (Figure 17c, d), and low-energy, below wave base, bioclastic mudstone to wackestone (Figure 16a, b), silty argillaceous dolomitic lime mudstone/dolomite, and calcareous shale. These facies were deposited in a gently sloping ramp with a ramp margin that was roughly parallel to the Mt. Auburn trend and graded basin-ward (southeast) into muddy carbon-ates (Figure 27) similar to the numer-ous modern and ancient examples (Wilson 1975, Tucker and Wright 1990, Flügel 2010). During deposition of the Racine Formation, long-term third-order sea level fluctuations resulted in the development of two third-order cycles consisting of short-term fourth- to fifth-order cycles as a result of short-term sea level variation (Figures 13 through 15).
The depositional model of the Racine Formation in the Sangamon Arch is that of a homoclinal ramp portion (ramp margin and its adjacent seaward margin) of a distally steepened ramp, just landward of the deep Vincennes Basin (Figure 27). According to Droste and Shaver (1980, 1987), during the Middle to Late Silurian Period, a plat-form margin (Terre Haute reef bank) marked a slope break in southern Illinois and southwestern Indiana that was facing the deep Vincennes Basin (Figures 1 and 27). Coburn (1986) and Whitaker (1988) envisioned a gently sloping ramp for the entire Illi-nois Basin that deepened toward the south and east during Silurian time. Restricted lagoonal and tidal flat facies of the inner ramp were presumably deposited landward of the Mt. Auburn trend, toward the Mississippi River Arch, but are absent due to post-depo-sitional erosion.
Although the carbonate ramp model (Ahr 1973, 1998; Read 1985; Burchette and Wright 1992) is appropriate for the Illinois Basin, reactivation of old normal faults along the northeastward extension of the Reelfoot Rift system during the Silurian Period possibly resulted in the formation of a distally steepened ramp (Read 1985) and the Vincennes Basin (Figures 1 and 27). This interpretation is supported by the thick Lower Devonian basinal deposits that thin to zero toward the platform area and by the steeper slope along the reef trend than in the platform and basinal settings (Droste and Shaver 1980, 1987). In addition, the southeast margin of the Vincennes Basin aligns with the trend of the Reelfoot Rift, and the platform margin parallels the trend of a northeastward extension of the rift (Figure 1), suggesting that footwall subsidence along the rift-related normal faults probably formed the relatively deep Vincennes Basin in southern Illinois. Lower Devonian through Mississippian deep marine deposits (including turbidites) are rec-ognized in the general area of southern Illinois (Lineback 1966, 1981; Banaee 1981; Cluff et al. 1981; Lineback and Cluff 1985; Z. Lasemi et al. 1998, 2003). These deposits, which conformably overlie the Silurian succession (Norby 1991, Mikulic 1991, Droste and Shaver

28 Circular 577 Illinois State Geological Survey
Fig
ure
25
Cro
ss s
ectio
n H
–H
(sam
e as
Fig
ure
24)
show
ing
the
occu
rren
ce o
f pa
tch
reef
res
ervo
irs w
ithin
the
upp
er p
art
of t
he lo
wer
seq
uenc
e of
the
R
acin
e F
orm
atio
n. D
atum
has
bee
n ch
ange
d to
the
top
of
a fo
urth
-ord
er t
rans
gres
sive
-reg
ress
ive
cycl
e at
the
bas
e of
a d
ense
faci
es w
ithin
the
upp
er
sequ
ence
. Not
e th
e irr
egul
ar s
urfa
ce o
f er
osio
n at
the
upp
er c
onta
cts
of b
oth
sequ
ence
s. A
bbre
viat
ions
: Cht
Ls,
Cho
utea
u Li
mes
tone
; Cor
r., c
orre
ctio
n; D
T,
soni
c tim
e va
riatio
n; L
RS
, lo
wer
Rac
ine
sequ
ence
; SP,
sel
f-po
tent
ial;
UR
S,
uppe
r R
acin
e se
quen
ce.
F’
28
MA
CO
N
CH
RIS
TIA
N
T16
N
T15
N
R1E
R1W
H
H�
26,3
99 fe
et23
,001
feet
10,2
47 fe
et12
0212
4272
00
Paw
nee
Oil
Cor
p.E
lder
, Ved
a 1
T15
N, R
1W, S
ec. 1
2C
hris
tian
Cou
nty
1211
5006
8100
Atk
ins
and
Hal
eD
ippe
r 1
T16
N, R
1E, S
ec. 2
8M
acon
Cou
nty
1211
5217
0300
Paw
nee
Oil
& G
as, I
nc.
Gar
ver
1T
16N
, R1E
, Sec
. 2M
acon
Cou
nty
1211
5216
7900
Wat
ters
Oil
& G
as C
o.N
olan
, Chr
istin
a 3
T17
N, R
2E, S
ec. 3
1M
acon
Cou
nty
Devonian SilurianSYSTEM
SERIES
GROUP/FORMATION
Upper Devonian Niagaran
New Albany Shale Group Racine FmChtLs LRSURSG
AM
MA
-RAY
BU
LK D
EN
SIT
Y
CA
LIP
ER
Cor
r.0
25
AP
Ig/
cm3
1515
02
2.5
Den
sity
Por
osity
.A
PI
150
300
0.3
0.0
Inch
es6
16
2,0001,9001,800
TD
= 2
,007
feet
H
TIM
E V
AR
IAT
ION
SE
LF-
PO
TE
NT
IAL
DT
(M
s/fo
ot)
SP
(m
V)
100
40-1
400 TD
= 2
,057
feet
1,850 1,900 2,000
GA
MM
A-R
AYB
ULK
DE
NS
ITY
AP
Ig/
cm3
150
215
3
Den
sity
Por
osity
AP
I0.
3-0
.10
300
150 C
ALI
PE
RN
eutr
on P
oros
ity0.
3-0
.10
Inch
esC
orr.
616
025
1,900 2,000 2,100
TD
= 2
,175
feet
LRS
U
RS
rese
rvoi
r un
it D
Dat
umLi
ne
GA
MM
A-R
AYN
EU
TR
ON
PO
RO
SIT
Y
AP
IA
PI
015
00
150
TD
= 2
,074
feet
1,900 2,000
H�
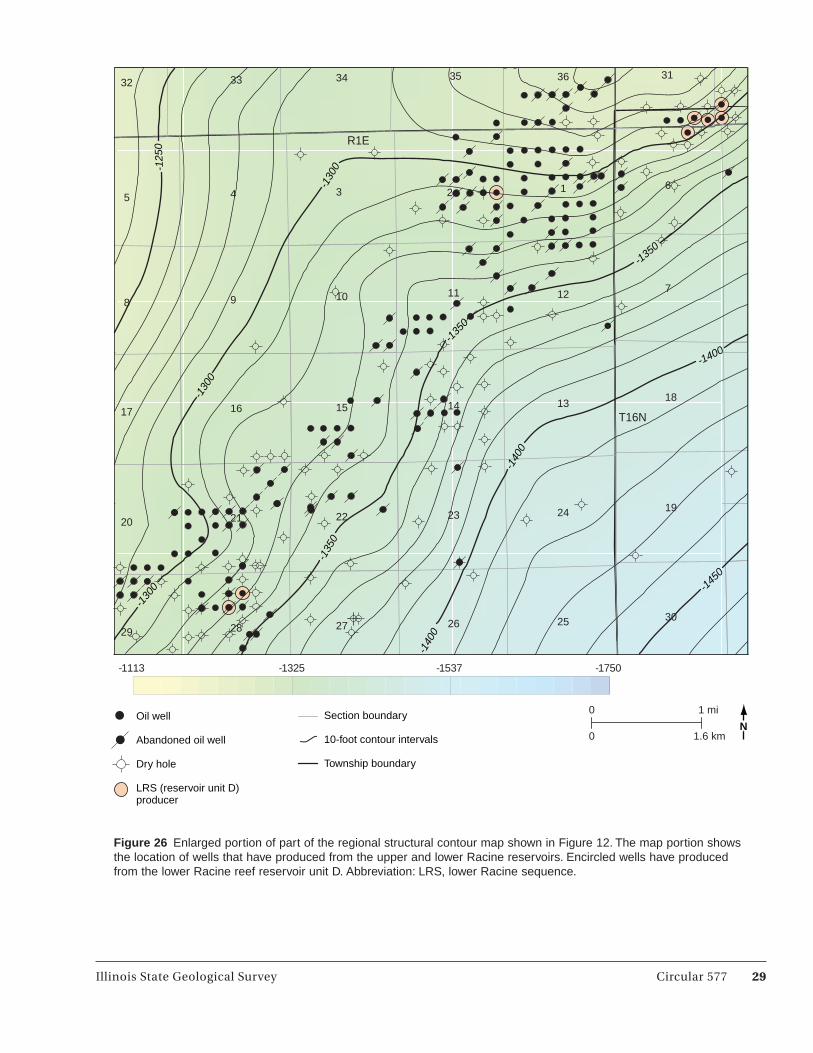
Illinois State Geological Survey Circular 577 29
Oil well
Abandoned oil well
Dry hole
LRS (reservoir unit D)producer
Section boundary
10-foot contour intervals
Township boundary
0 1 mi
0 1.6 kmNN
-1750-1537-1325-1113
-130
0
-130
0
-130
0
-125
0
-135
0
-135
0
-1350
-1400
-140
0
-140
0
-145
0
T16N
R1E
16
10
22
27
14
29
31
11
17
21
5
1924
33
1
1815
12
28
34 35
13
3
8
30
7
4
26 25
23
2
20
9
36
6
32
Figure 26 Enlarged portion of part of the regional structural contour map shown in Figure 12. The map portion shows the location of wells that have produced from the upper and lower Racine reservoirs. Encircled wells have produced from the lower Racine reef reservoir unit D. Abbreviation: LRS, lower Racine sequence.

30 Circular 577 Illinois State Geological Survey
1987), further suggest that a distally steepened ramp could have existed in the southern part of the Illinois Basin during the deposition of the Niagaran Series.
Patch Reef Versus Pinnacle ReefThe known productive reefs in Illi-nois are pinnacle reefs up to 700 feet (210 m) thick (Lowenstam 1949, Bristol 1974) that developed almost entirely during the Middle to Late Silurian Period along the northeast-southwest–trending platform margin (possibly along a distally steepened ramp margin) (Figure 27) facing the deep Vincennes Basin (Shaver et al. 1978, Droste and Shaver 1980, 1987). The presence of patch reef reservoirs in the Niagaran rocks of the Sangamon
Arch has recently been documented (Y. Lasemi 2009c). These patch reefs are of limited lateral and vertical extent in the upper part of the lower sequence of the Racine Formation (Figures 4, 14, 21, 24, and 25). They may occur in one to four horizons with a total thickness of up to 30 feet (9 m), and they constitute the upper parts of fourth- to fifth-order shallowing-upward cycles (Figures 14 and 25).
Patch reefs of the Sangamon Arch developed on the very gently sloping homoclinal ramp platform (ramp plat-form of Ahr 1973), similar to that in the present-day Persian Gulf (Purser 1973). Reef-building metazoans typi-cally build laterally and vertically along the platform margin, where nutrient supply is abundant and depositional energy is very high (Wilson 1975, James
1983). Because the depositional wave and current energy were not strong enough to cause the reef builders to construct large buildups in the homo-clinal ramp setting of the Sangamon Arch, only bioclast grainstone shoal facies and small patch reefs were devel-oped—in contrast to the large pinnacle reefs (Lowenstam 1949, Bristol 1974) that developed along the southern Illinois platform margin (Shaver et al. 1978; Droste and Shaver 1980, 1987). Whitaker (1988) suggested that pin-nacle reefs had existed in the shelf areas of the Illinois Basin, including the Sangamon Arch, but that much of their thickness had been reduced by pre-Devonian erosion. The present study, however, does not support the devel-opment of pinnacle reefs along the Sangamon Arch (see Y. Lasemi 2009c for further discussion).
land area
silty argillaceous limestone/calcareous shale (absent in the study area)
pinnacle/barrier reefs (absent in the study area)
coral patch reef/rudstone facies
bioclast grainstone shoal facies
bioclast lime mudstone-packstone/siltyargillaceous dolomite/limestone or calcareous shale
restricted facies(removed by erosion)
restricted facies(removed by erosion)
Deep ramp
(Vince
nnes Basin
)
Tidal flat
NW
SE
Outer rampMississippi R
iver A
rch Restricted lagoon
Ramp margin
Figure 27 Generalized depositional model depicting the distally steepened ramp of the Illinois Basin during Niagaran time. The depositional facies of the inner ramp (restricted lagoon and tidal flat facies) are absent due to subsequent erosion at the upper contact of the Niagaran sequences and the complete removal of the Silurian deposits toward the northwest in the Mississippi River Arch area. Small coral patch reefs developed seaward of the bioclastic ramp margin, and the large pinnacle reefs were mainly restricted to the distally steepened outer ramp margin. Seaward percolation of the denser dolomitizing flu-ids from the restricted lagoon, in the direction of arrows, could have been responsible for early dolomitization of the precursor limestone deposits.

Illinois State Geological Survey Circular 577 31
Dolomitization and Reservoir DevelopmentDetailed subsurface studies of the Silu-rian succession along the Mt. Auburn trend have revealed the presence of several lenticular dolomitized reser-voirs (permeability pinch-outs) that are interlayered with laterally extensive impermeable limestone intervals. The reservoirs generally constitute the upper parts of fourth-order transgres-sive-regressive cycles within the Racine Formation (Figures 13, 14, and 15). The laterally discontinuous reservoirs are cyclic and are commonly surrounded by impermeable pure limestone or finely crystalline silty argillaceous dolomitic limestone/dolomite (Figures 13, 14, 15, 21, 22, 23, and 24), suggest-ing that sea level fluctuations and seawater chemistry were the primary controls for early dolomitization of the compartmentalized Silurian reservoirs.
Based on comparisons with their modern counterparts, the initially impermeable mud-rich precursors had an initial porosity of around 70% (Enos and Sawatsky 1981, Z. Lasemi et al. 1990), which was reduced to less than 5% during burial diagenesis. Dolomi-tization was probably caused by reflux of slightly evaporated seawater (Sun 1995) in the inner ramp setting; the initial grainstone facies of the ramp margin and the adjacent open marine bioclastic packstone-wackestone acted as a conduit for the dolomitizing sea water. As shown by the depositional model (Figure 27), the slightly evapo-rated, denser water in the back barrier inner ramp lagoon, which had higher magnesium-to-calcium ratio than normal seawater, could have perco-lated through the sediments deposited during the previous sea level cycles, leading to early dolomitization and formation of laterally discontinuous dolomite lenses. The dolomitizing fluid apparently could not reach the distal portion and the lower part of the previ-ously deposited limestone cycle, lead-ing to lenticular dolomite bodies. This interpretation is supported by these findings:
• Thelenticulardolomitizedreser-voirs show gradational contacts with the underlying limestone, and their skeletal remains are identical
to those of the associated limestone; they change to dolomitic limestone and lose their porosity in both land-ward and basinward directions.
• Dolomitelayersareresistanttochemical compaction and the resulting cementation (Brown 1997, Lucia 2004, Ehrenberg et al. 2006), thus preserving their original poros-ity. Laterally continuous interlayered lime mudstone to packstone facies, however, compact and lose their initial high porosity during burial diagenesis.
It appears that dolomitization ini-tially affected the carbonate lime mud matrix of the groundmass (Figures 16b and 17b) and the more susceptible fossil fragments; crinoids were the last grains to be dolomitized (Figures 16d and 17b). Later reservoir porosity enhancement likely occurred during prolonged subaerial exposure, result-ing in partial dissolution of the dolo-mite crystals along the pore walls by fluids undersaturated with respect to dolomite (Figure 17a).
ConclusionsThe Racine Formation was deposited in a gently sloping ramp with a ramp margin roughly parallel to and south-east of the trend of the Sangamon Arch. The Racine Formation is subdivided into two depositional sequences that, in the Mt. Auburn trend, contain mul-tiple dolomitized reservoirs.
The reservoirs are compartmental-ized and are commonly surrounded by impermeable limestone, suggesting fluctuations in sea level and seawater chemistry as the primary controls for early dolomitization of the Silurian reservoirs. The interlayered undolomi-tized limestone was compacted during burial diagenesis, but the dolomite resisted compaction, thus retaining its porosity.
Examination of numerous wells indi-cates that most of those drilled thus far have tested the uppermost part of the Niagaran succession; only a few wells have tested the lower reservoirs that include the newly recognized patch reefs, so the potentially prolific lower horizons have been mostly overlooked.
AcknowledgmentsThe early draft of this article was reviewed by B.D. Keith at the Indiana Geological Survey, Indiana Univer-sity, who provided much critical and constructive advice. Reviews of the final version of the manuscript by B. Huff, J.H. Goodwin, D.G. Morse, and D.G. Mikulic at the Illinois State Geo-logical Survey greatly improved the manuscript. The authors thank C.K. Nimz for editorial improvement of the manuscript and M.W. Knapp for graphic assistance and layout. S. Lang, an independent petroleum geologist, provided core samples of Elder Well No. 1. R. R. Mumm and J. Freiburg at the Illinois State Geological Survey Geo-logical Samples Library and J. Brenizer (now with Rex Energy Corp.) provided assistance with cores and samples; J. Dexter prepared the core photographs. This work was partially supported by U.S. Department of Energy Contract number DE-FC26-04NT15510. The use of GeoGraphix software was made pos-sible through the University Grant Pro-gram provided by Landmark Graphics.
ReferencesAhr, W.M., 1973, The carbonate ramp:
An alternative to the shelf model: Transactions of the Gulf Coast Asso-ciation of Geological Scientists, v. 23, p. 221–225.
Ahr, W.M., 1998, Carbonate ramps, 1973–1996: A historical review, in V.P. Wright and T.P. Burchette, eds., Carbonate ramps: London, England, Geological Society of London, Spe-cial Publication 149, p. 7–14.
Banaee, J. 1981, Microfacies and depo-sitional environment of the Bailey Limestone (Lower Devonian), south-western Illinois, U.S.A., a carbonate turbidite: University of Illinois at Urbana-Champaign, M.S. thesis, 122 p.
Bond, G.D., P.A. Nickeson, and M.A. Kominz, 1984, Breakup of a super-continent between 635 Ma and 555 Ma: New evidence and implications for continental histories: Earth and Planetary Science Letters, v. 70, p. 325–345.
32 Circular 577 Illinois State Geological Survey
Bristol, H.M., 1974, Silurian pinnacle reefs and related oil production in southern Illinois: Illinois State Geo-logical Survey, Illinois Petroleum 102, 98 p.
Brown, A., 1997, Porosity variation in carbonates as a function of depth: Mississippian Madison Group, Williston Basin, in J.A. Kupecz, J. Gluyas, and S. Bloch, eds., Reservoir quality prediction in sandstones and carbonates: Tulsa, Oklahoma, AAPG Memoir 69, p. 29–46.
Burchette, T.P., and V.P. Wright, 1992, Carbonate ramp depositional sys-tems: Sedimentary Geology, v. 79, p. 3–57.
Buschbach, T.C., and D.R. Kolata, 1991, Regional setting of Illinois Basin, in M.W. Leighton, D.R. Kolata, D.F. Olts, and J.J. Eidel, eds., Interior cratonic basins: Tulsa, Oklahoma, AAPG Memoir 51, p. 29–55.
Cluff, R.M., M.L. Reinbold, and J.A. Lineback, 1981, The New Albany Shale Group of Illinois: Illinois State Geological Survey, Circular 518, 83 p.
Coburn, G.W., 1986, Silurian of the Illinois Basin: A carbonate ramp: Oil and Gas Journal, v. 84, p. 96–100.
Droste, J.B., and R.H. Shaver, 1980, Rec-ognition of buried Silurian reefs in southwestern Indiana: Application to the Terre Haute bank: Journal of Geology, v. 88, p. 567–587.
Droste, J.B., and R.H. Shaver, 1987, Upper Silurian and Lower Devo-nian stratigraphy of the central Illi-nois Basin: Bloomington, Indiana, Indiana Geological Survey, Special Report 39, 29 p.
Dunham, R.J., 1962, Classification of carbonate rocks according to depo-sitional texture, in W.E. Ham, ed., Classification of carbonate rocks: Tulsa, Oklahoma, AAPG Memoir 1, p. 108–121.
Ehrenberg, G.P., G.P. Eberli, M. Kera-mati, and S.A. Moallemi, 2006, Porosity-permeability relationships in interlayered limestone-dolomite reservoirs: AAPG Bulletin, v. 90, p. 91–114.
Embry, A.E., and J.E. Klovan, 1971, A Late Devonian reef tract on north-eastern Bank Island, Northwest Ter-ritories: Bulletin of Canadian Petro-leum Geology 19, p. 730–781.
Enos, P., and L.H. Sawatsky, 1981, Pore networks in Holocene carbonate sediments: Journal of Sedimentary Petrology, v. 51, p. 961–985.
Flügel, E., 2010, Microfacies of carbon-ate rocks: Berlin, Germany, Springer-Verlag, 984 p.
Golonka, J., and W. Kiessling, 2002, Phanerozoic time scale and defini-tion of time slices, in W. Kiessling, E. Flügel, and J. Golonka, eds., Phanerozoic reef patterns: Tulsa, Oklahoma, Society for Sedimentary Geology, Special Publication 72, p. 11–20.
Haq, B.U., and S.R. Schutter, 2008, A chronology of Paleozoic sea-level changes: Science, v. 322, p. 64–68.
James, N.P., 1983, Reef environment, in P.A. Scholle, D.G. Bebout, C.H. Moore, eds., Carbonate depositional environment: Tulsa, Oklahoma, AAPG Memoir 33, p. 345–440.
Kluessendorf, J., and D.G. Mikulic, 1996, An early Silurian sequence boundary in Illinois and Wisconsin, in B.J. Witzke, G.A. Ludigson, and J.E. Day, eds., Paleozoic sequence stratigraphy: Views from the North American craton: Boulder, Colorado, GSA Special Paper 306, p. 177–185.
Kolata, D.R., compiler, 2005, Bedrock geology of Illinois: Illinois State Geo-logical Survey, Illinois Map 14.
Kolata, D.R., and W.J. Nelson, 1991, Tec-tonic history of the Illinois Basin, in M.W. Leighton, D.R. Kolata, D.F. Oltz, and J.J. Eidel, eds., Interior cratonic basins: Tulsa, Oklahoma, AAPG Memoir 51, p. 263–285.
Lasemi, Y., 2009a, A prominent uncon-formable boundary within the upper Niagaran Racine Formation: Record of a major Middle Silurian tectono-eustatic event in the Sangamon Arch, west-central Illinois: GSA Abstracts with Programs, v. 41, p. 26.
Lasemi, Y., 2009b, Carbonate sequence stratigraphy and reservoir develop-ment: The Middle Silurian Racine Formation in the Sangamon Arch, west-central Illinois: Program and Abstracts, AAPG Eastern Section Thirty-eighth Annual Meeting, Sep-tember 20–22, 2009, Evansville, Indi-ana, p. 42–43.
Lasemi, Y., 2009c, Oil potential seen in Silurian reef-related reservoirs in Illinois Sangamon Arch: Oil and Gas Journal, v. 107, p. 36–40.
Lasemi, Z, R.D. Norby, and J.D. Tre-worgy, 1998, Depositional facies and sequence stratigraphy of a Lower Carboniferous bryozoan-crinoidal carbonate ramp in the Illinois Basin, mid-continent USA, in V.P. Wright and T.P. Burchette, eds., Carbonate ramps: London, England, Geological Society of London, Special Publica-tion 149, p. 369–395.
Lasemi, Z, R.D. Norby, J.E. Utgaard, W.R. Ferry, R.J. Cuffy, and G.R. Dever Jr, 2003, Mississippian carbonate buildups and development of cool-water-like carbonate platforms in the Illinois Basin, midcontinent USA, in W.M. Ahr, P.M. Harris, W.A. Morgan, and I.D. Somerville, eds., Permo-Carboniferous carbonate platforms and reefs: Tulsa, Okla-homa, AAPG Memoir 83, p. 69–95.
Lasemi, Z., P.A. Sandberg, and M.R. Boardman, 1990, New microtextural criterion for differentiation of com-paction and early cementation in fine-grained limestones: Geology, v. 18, p. 370–373.
Lineback, J.A., 1966, Deep-water sedi-ments adjacent to the Borden Silt-stone (Mississippian) delta in south-ern Illinois: Illinois State Geological Survey, Circular 401, 48 p.
Lineback, J.A., 1981, The eastern margin of the Burlington-Keokuk (Valmeyeran) carbonate bank in Illi-nois: Illinois State Geological Survey, Circular 520, 24 p.
Lineback, J.A., and R.M. Cluff, 1985, Ullin-Fort Payne, A Mississippian shallow to deep water carbonate transition in a cratonic basin, in P.D.

Illinois State Geological Survey Circular 577 33
Crevello and P.M. Harris, eds., Deep-water carbonates: Buildups, turbi-dites, debris flows and chalks: Tulsa, Oklahoma, Society of Economic Paleontologists and Mineralogists, Core Workshop 6, p. 1–26.
Lowenstam, H.A., 1949, Niagaran reefs in Illinois and their relation to oil accumulation: Illinois State Geologi-cal Survey, Report of Investigation 145, 36 p.
Lucia, F.J., 2004, Origin and petrophys-ics of dolostone pore space, in C.J.R. Braithwaite, G. Rizzi, and G. Darke, eds., The geometry and petrogenesis of dolomite hydrocarbon reservoirs: Geological Society of London, Spe-cial Publication 235, p. 141–155.
Meert, J.G., and T.H. Torsvik, 2003, The making and unmaking of a super-continent: Rodinia revisited: Tecto-nophysics, v. 375, p. 261–288.
Mikulic, D.G., 1991, Tippecanoe II sub-sequence Silurian System through Lower Devonian Series, in M.W. Leighton, D.R. Kolata, D.F. Oltz, and J.J. Eidel, eds., Interior cratonic basins: Tulsa, Oklahoma, AAPG Memoir 51, p. 101–107.
Mikulic, D.G., and J. Kluessendorf, 2000, Silurian geology and the his-tory of the stone industry at Grafton, Illinois, in R.D. Norby, Z. Lasemi, eds., Paleozoic and Quaternary geol-ogy of the St. Louis Metro East area of western Illinois: Illinois State Geo-logical Survey, Guidebook 32, p. 39–46.
Mikulic, D.G., and J. Kluessendorf, 2001, Geology of the Silurian rocks, in Z. Lasemi and R.C. Berg, eds., Three-dimensional geologic map-ping: A pilot program for resource and environmental assessment in the Villa Grove Quadrangle, Douglas County, Illinois: Illinois State Geo-logical Survey, Bulletin 106, p. 31–34.
Norby, R.D., 1991. Biostratigraphic zones in the Illinois Basin, in M.W. Leighton, D.R. Kolata, D.F. Oltz,
and J.J. Eidel, eds., Interior cratonic basins: Tulsa, Oklahoma, AAPG Memoir 51, p. 179–194.
Ogg, J.G., G.M. Ogg, and F.M. Grad-stein, 2008, The concise geologic time scale: Cambridge, England, Cambridge University Press, 178 p.
Piper, J.D.A., 2000, The neoproterozoic supercontinent: Rodinia or Palaeo-pangaea?: Earth and Planetary Sci-ence Letters, v. 176, p. 131–146.
Piper, J.D.A., 2004, Discussion on “The making and unmaking of a super-continent: Rodinia revisited,” by J.G. Meert and T.H. Torsvik, Tectono-physics 375(2003), p. 261–288: Tecto-nophysics, v. 383, p. 91–97.
Purser, B.H., 1973, The Persian Gulf: Berlin, Germany, Springer-Verlag, 471 p.
Read, J.F., 1985, Carbonate platform facies models: AAPG Bulletin 66, p. 860–879.
Shaver, R.H., C.H. Ault, W.I. Ausich, J.B. Droste, A.S. Horowitz, W.C. James, S.M. Okla, C.B. Rexroad, D.M. Suchomel, and J.R. Welch, 1978, The search for a Silurian reef model, Great Lakes area: Bloomington, Indiana, Indiana Geological Survey, Special Report 15, 36 p.
Sloss, L.L., 1963, Sequences in the cra-tonic interior of North America: GSA Bulletin, v. 74, p. 93–114.
Sun, S.Q., 1995, Dolomite reservoirs: Porosity evolution and reservoir characteristics: AAPG Bulletin, v. 79, p. 186–204.
Swann, D.H., and H.B. Willman, 1961, Megagroups in Illinois: AAPG Bul-letin, v. 45, p. 471–483.
Tucker, M.E., and V.P. Wright, 1990, Carbonate sedimentology: Oxford, England, Blackwell, 482 p.
Vail, P.R., R.M. Mitchum, and S. Thompson III, 1977, Seismic stra-tigraphy and global changes of sea
level: Part 4: Global cycles of relative changes of sea level, in C.E. Payton, ed., Seismic stratigraphy—Applica-tions to hydrocarbon exploration: Tulsa, Oklahoma, AAPG Memoir 26, p. 83–97.
Van Wagoner, J.C., H.W. Posamentier, R.M. Mitchum, Jr., P.R.Vail, T.S. Loutit, and J. Hardenbol, 1988, An overview of the fundamentals of sequence stratigraphy and key defi-nitions, in C.K. Wilgus, B.S. Hastings, H. Posamentier, J.C. Van Wagoner, C.A. Ross, and C.G. St. C. Kendall, eds., Sea-level changes—An inte-grated approach: Tulsa, Oklahoma, Society of Economic Paleontologists and Mineralogists, Special Publica-tion 42, p. 39–46.
Whitaker, S.T., 1988, Silurian pinnacle reef distribution in Illinois: Model for hydrocarbon exploration: Illi-nois State Geological Survey, Illinois Petroleum 130, 32 p.
Whiting, L.L., 1956, Geology and his-tory of oil production in the Deca-tur-Mt. Auburn-Springfield area, Illi-nois: Illinois State Geological Survey, Circular 211, 17 p.
Whiting, L.L., and M.O. Oros, 1957, Electric-log cross-sections of the Silurian-Devonian formations of a part of Central Illinois: Transactions of the Illinois State Academy of Sci-ence, v. 50, p. 172–179.
Whiting, L.L., and D.L. Stevenson, 1965, The Sangamon Arch: Illinois State Geological Survey, Circular 383, 20 p.
Willman, H.B., and E. Atherton, 1975, Silurian System, in H.B. Willman, E. Atherton, T.C. Buschbach, C. Col-linson, J.C. Frye, M.E. Hopkins, J.A. Lineback, and J.A. Simon, eds.: Illi-nois State Geological Survey, Hand-book of Illinois stratigraphy, Bulletin 95, p. 87–104.
Wilson, J.L., 1975, Carbonate facies in geologic history: Berlin, Germany, Springer-Verlag, 471 p.