
SEDIMENT ANALYSIS IN CHOCTAWHATCHEE BAY · SEDIMENT ANALYSIS IN CHOCTAWHATCHEE BAY Joy M. Brown Bay...
110
SEDIMENT ANALYSIS IN CHOCTAWHATCHEE BAY Joy M. Brown Bay Rally Program Manager Choctawhatchee Basin Alliance Okaloosa-Walton Community College 100 College Boulevard Niceville, Florida 32578 Jon M. Hemming, Ph.D. Environmental Toxicologist U.S. Fish and Wildlife Service Division of Ecological Services Panama City Field Office 1601 Balboa Avenue Panama City, Florida 32405 2004
Transcript of SEDIMENT ANALYSIS IN CHOCTAWHATCHEE BAY · SEDIMENT ANALYSIS IN CHOCTAWHATCHEE BAY Joy M. Brown Bay...

SEDIMENT ANALYSIS IN
CHOCTAWHATCHEE BAY
Joy M. Brown Bay Rally Program Manager
Choctawhatchee Basin Alliance Okaloosa-Walton Community College
100 College Boulevard Niceville, Florida 32578
Jon M. Hemming, Ph.D. Environmental Toxicologist
U.S. Fish and Wildlife Service Division of Ecological Services
Panama City Field Office 1601 Balboa Avenue
Panama City, Florida 32405
2004

ii
CONTENTS
INTRODUCTION .......................................................................................... 1 METHODS ..................................................................................................... 4 RESULTS ..................................................................................................... 10 DISCUSSION............................................................................................... 26 CONCLUSIONS .......................................................................................... 33 RECOMMENDATIONS.............................................................................. 34 REFERENCES ............................................................................................. 35 APPENDICES .............................................................................................. 40

iii
TABLES
Table 1 Sample information for sediment samples taken by CBA and U.S. Fish and
Wildlife Service in the Choctawhatchee Bay in August 2002, Station ID, Location, Latitude and Longitude (decimal degrees). ................................................................ 5
Table 2 Chemical analytes measured in sediment samples taken in Choctawhatchee Bay
in August 2002............................................................................................................ 7 Table 3 Percent composition of sediment samples taken in Choctawhatchee Bay in
August 2002, Gerg ID, Client ID, % Sand, % Silt and % Clay................................ 11 Table 4 Sediment samples taken in Choctawhatchee Bay in August 2002 with metal
analytes equal to or exceeding sediment quality guidelines (Long et al. 1995): Site, Analyte, Sediment Concentration (ug/g, ppm, dry weight), Effects Range Low (ERL), Effects Range Median (ERM). ..................................................................... 12
Table 5 Sediment samples taken in Choctawhatchee Bay in August 2002 with
organochlorines and pesticide analytes equal to or exceeding sediment quality guidelines (Long et al. 1995): Site, Analyte, Sediment Concentration (ng/g, ppb, dry weight), Effects Range Low (ERL), Effects Range Median (ERM). ....................... 13
Table 6 Sediment samples taken in Choctawhatchee Bay in August 2002 with
polycyclic aromatic hydrocarbon analytes equal to or exceeding sediment quality guidelines (Long et al. 1995): Site, Analyte, Sediment Concentration (ng/g, ppb, dry weight), Effects Range Low (ERL), Effects Range Median (ERM). ....................... 14
Table 7 Sediment samples taken in Choctawhatchee Bay in August 2002 with relatively
high concentrations of aliphatic hydrocarbon: Site, Analyte, Sediment Concentration (ug/g, ppb, dry weight), mean+1standard deviation (SD), mean+2 standard deviations (SD). ........................................................................................................ 15
Table 8 Sediment samples taken in Choctawhatchee Bay in August 2002 with relatively
high concentrations of chlorophenoxy herbicides: Site, Analyte, Sediment Concentration (ug/g, ppb, dry weight), mean+1SD, mean+2SD.............................. 16
Table 9 Dioxin total toxicity equivalents (TEQs) relative to 2,3,7,8-
tetrachlorodibenzodioxin in sediment samples taken in Choctawhatchee Bay in August 2002: Site, TEQs (ppt).................................................................................. 17

iv
FIGURES
Figure 1 Choctawhatchee Bay sediment stations sampled in August 2002. ................... 5 Figure 2 Sediment composition distribution for sediment samples taken in
Choctawhatchee Bay, August 2002. ......................................................................... 18 Figure 3 Estimated risk rank for polycyclic aromatic hydrocarbon (PAH) analytes in
sediment samples taken from Choctawhatchee Bay, 2002, exceeding Long et al. (1995) sediment quality guidelines........................................................................... 19
Figure 4 Estimated risk rank for organochlorine (OC) analytes in sediment samples
taken from Choctawhatchee Bay, 2002, exceeding Long et al. (1995) sediment quality guidelines. ..................................................................................................... 20
Figure 5 Estimated risk rank for metal analytes in sediment samples taken from
Choctawhatchee Bay, 2002, exceeding Long et al. (1995) sediment quality guidelines. ................................................................................................................. 21
Figure 6 Estimated risk rank for cumulative analytes (PAH, OC and Metals) in
sediment samples taken from Choctawhatchee Bay, 2002, exceeding Long et al. (1995) sediment quality guidelines........................................................................... 22
Figure 7 Dioxin toxicity equivalents (TEQs) calculated for dioxin and furan metabolic
analytes found in sediment samples collected from four sites in Choctawhatchee Bay, 2002. ................................................................................................................. 23
Figure 8 Estimated risk and need for further evaluation ranking scores for phenoxy
herbicides in sediment samples collected in Choctawhatchee Bay, 2002. ............... 24 Figure 9 Estimated risk and need for further evaluation ranking scores for aliphatic
hydrocarbons in sediment samples collected in Choctawhatchee Bay, 2002........... 25

v
APPENDICES Appendix A: Standard Operating Procedures for Field Collection of Sediment Samples (PCFO-EC SOP 004). Appendix B: Depth and bottom water temperature collected during sampling in the Choctawhatchee Bay, 2002. Appendix C: Dioxin data in sediment samples from Choctawhatchee Bay in Rocky, Tom’s and Hogtown Bayous, and Mullet Creek in the Choctawhatchee Bay, 2002. Appendix D: Aliphatic Hydrocarbon data in sediment samples collected from the Choctawhatchee Bay, 2002. Appendix E: Chlorophenoxy Herbicide data in sediment samples collected from the Choctawhatchee Bay, 2002. Appendix F: Pesticide and PCB data in sediment samples collected from the Choctawhatchee Bay, 2002. Appendix G: Polycyclic Aromatic Hydrocarbon data in sediment samples collected from Choctawhatchee Bay, 2002. Appendix H: Trace and Major Element data in sediment samples collected from the Choctawhatchee Bay, 2002. Appendix I: Lab Analysis Methods for Wellington and GERG labs.
vi
Acknowledgements Choctawhatchee Basin Alliance acknowledges the assistance and U.S. Fish and
Wildlife Coastal Program funding in this study. Appreciation is extended to the U.S.
Fish and Wildlife Service Panama City Field Office for direct assistance. Many people
have helped in the culmination of this paper, but in particular we thank: Michael Brim
and Robert Jarvis, U.S. Fish and Wildlife Service; Jim Barkuloo, Florida Wildlife
Federation; Russell Brown, Eglin Air Force Base; and Sandy Pizzolato, Jackson Guard.

vii
Abstract
A habitat quality survey was conducted in Choctawhatchee Bay at the request of
the U.S. Fish and Wildlife Service. Hogtown Bayou in southern Choctawhatchee Bay is
a documented frequent location and winter holding area for the Gulf sturgeon, Acipenser
oxyrinchus desotoi, a federally listed endangered species. Sediment sampling was
selected to characterize the chemical integrity of Choctawhatchee Bay. Sampling sites
were chosen to represent the extent of the bay and to provide particular focus on certain
areas. Focus areas were selected based on historical data from peer review literature and
personal knowledge of local citizens.
Sediment samples were collected from 13 sites in Choctawhatchee Bay in a
collaborative effort with the U.S. Fish and Wildlife Service and Choctawhatchee Basin
Alliance staff. Analyses on sediment samples included metals, pesticides,
organochlorines (OC), and polycyclic aromatic (PAH) and aliphatic hydrocarbons (AH).
Sediment samples collected from Mullet Creek, Rocky, Tom’s, and Hogtown bayous
were also subjected to dioxin compound analysis. Overall, sediment contamination in
Choctawhatchee Bay was low and found to be comparable to other bays in the Florida
panhandle. However, sites in Mullet Creek (pesticides, OC, PAH, AH, metals), Tom’s
Bayou (OC, AH, metals), Garnier’s Bayou (OC, PAH, AH, metals) and Cinco Bayou
(OC, PAH) possessed high concentrations of sediment contaminants relative to other sites
in Choctawhatchee Bay necessitating further investigation.
1
Introduction
Choctawhatchee Bay is located in the western Florida panhandle. The system was
originally oligohaline with input primarily from Choctawhatchee River which terminates at
the east end of the bay. The Choctawhatchee Bay and River watershed has a drainage area of
5,349 square miles in Florida and Alabama (NWFWMD, 1996). Historically, sea water input
entered the bay via only periodic breakthroughs to the Gulf of Mexico. A permanent pass to
the Gulf of Mexico was opened in 1929 at the west end of the bay (Livingston, 1987).
Marine Gulf of Mexico waters flowed through the western pass and combined with the
freshwaters from the Choctawhatchee River creating an estuary in transition.
Choctawhatchee Bay has an east to west longitudinal axis that stretches 27 miles
long, but is only four miles wide. Average depth of the bay is 22 feet (U.S. Department of
Commerce and NOAA, 1997). Choctawhatchee Bay has several small tributaries on the
northern shore. Eglin Air Force Base occupies the majority of the immediate drainage basin
on the northern shore. While the northern shore has experienced some development, the
southern shore of Choctawhatchee Bay has been the site of an exponential increase in
urbanized growth over the last few decades (NOAA, 1997).
Previous studies have identified high metal concentrations and low dissolved oxygen
in Choctawhatchee Bay and adjoining bayous (Livingston, 1987). Some have speculated that
the low dissolved oxygen concentrations result from the unique nature of Choctawhatchee
Bay, particularly the dramatic convergence of fresh and marine waters (NOAA, 1997).
Choctawhatchee Bay is stratified via a halocline separating freshwater at the surface from

2
marine waters at the bottom. The lack of mixing and gas exchange between the marine and
freshwaters creates a large anoxic zone in the marine (bottom) bay layer is capable of
supporting scant life (Livingston, 1987).
A literature review identified areas of concern in Choctawhatchee Bay and
distinguished possible problem sources (Livingston, 1987; NOAA, 1997; NWFWMD, 1996).
This review revealed that stormwater runoff and increased residential development were
responsible for increased nutrient loading to the bay. It was further suggested that these
nonpoint source inputs were exacerbating problems in the bayous where water quality was
often lower (CBA, 1998). Other reports showed that Choctawhatchee Bay had higher mean
organic nitrogen and organic carbon than the four other northwest Florida bays (Escambia,
East, Panama City, and Pensacola bays) according to figures from the Environmental
Protection Agency (EPA) and the U.S. Army Core of Engineers (Blaylock, 1983).
Choctawhatchee Bay also had the third highest mean total phosphorus level (NOAA, 1997).
Dr. Livingston, Director of the Center for Aquatic Research and Resource Management and
Professor at Florida State University, cited anthropogenic effects and marinas for the cause of
harmful stormwater runoff in his 1987 study of the Choctawhatchee Bay system (Livingston,
1997). In 1997 the National Oceanic and Atmospheric Administration (NOAA) performed a
study on the bays in the Florida panhandle (NOAA, 1997). Minimal metal enrichment was
found bay-wide, but elevated metal concentrations were recorded in Destin Harbor and near
Boggy Point. NOAA also found elevated levels of organic contaminants at several locations
including: Destin Harbor, Santa Rosa Sound and Boggy Point. Reported concentrations

3
were of the highest in the nation at the time (U.S. Department of Commerce and NOAA,
1997).
Habitat quality of aquatic systems has been evaluated via surveys of sediment
contamination (O’Connor, 1991; US NOAA, 1991; Bolton et al. , 1985). The challenge lies
in the interpretation of ecological risk posed by sediment contamination (Long et al., 1995).
For this reason, many have provided numeric criteria based on reported effects of exposure
as a means to estimate relative risk to living organisms (Buchman, 1999; Long et al., 1995;
MacDonald, 1993; Persaud, 1992; Di Toro et al., 1991; Long and Morgan, 1990; US EPA,
1989).
To assess the overall ecosystem health of Choctawhatchee Bay, a sediment survey
was conducted. The results of this survey were compared to the findings of Long et al.
(1995) to estimate risk to living resources. Long et al. (1995) developed Effects Range Low
(ERL) and Effects Range Median (ERM) criteria for evaluating sediment contamination in
marine and estuarine environments. Sediment contaminant concentrations exceeding the
criterion ERL indicated that adverse negative effects on living resources might increase in
incidence from rare to occasional. Sediment contaminant concentrations exceeding the ERM
may indicate adverse effects will occur frequently.
4
METHODS
Sampling Design
The locations of the individual sampling stations were chosen based on historical data
from literature review and personal communications with resident scientists. Stations were
chosen based on anticipated sediment composition and reported contamination. Station
locations were pre-selected, but were altered in cases where field collection of sediments was
not feasible.
Sample Collection
Thirteen sediment samples were taken from Choctawhatchee Bay over a 2-day period
in August 2002 (Figure 1, Table 1) according to the standard operating procedures (PCFO-
EC SOP 004) for field collection of sediment samples (Appendix A). The vessel was
navigated to the pre-determined stations; if the station was inaccessible or if the sediments at
the location were comprised of only sand with no silt or clay components, an alternate
location was chosen. In each case the original or the first alternate location was sufficient for
sampling. Vessel navigation and positioning were aided by a Garmin Global Positioning
System (GPS) 48 Personal Navigator unit and a supplemental navigation map.
Composite samples consisted of three 200 milliliter sub-samples. Samples were
collected with a standard ponar 316 stainless steel grab and deposited in a stainless steel tray.
The grab sampler and sampling utensils were acid washed with 10% dilute nitric acid,
acetone, deionized water and ambient site water before and after each sample was collected.
Three shallow grabs were most often sufficient for collecting samples. A stainless steel
spoon was used to collect two scoops from the central portion of each grab. Sub-samples
were combined in plastics bags, labeled, and placed on ice in a cooler.

5
Figure 1 Choctawhatchee Bay sediment stations sampled in August 2002.
Table 1 Sample information for sediment samples taken by CBA and U.S. Fish and Wildlife Service in the Choctawhatchee Bay in August 2002, Station ID, Location, Latitude and Longitude (decimal degrees).
Station ID Location Latitude Longitude
CBA 1 Rocky Bayou 30.50317 -86.43550 CBA 2 Tom’s Bayou 30.50117 -86.49150 CBA 3 Garnier’s Bayou 30.44617 -86.58917 CBA 4 Cinco Bayou 30.43233 -86.63667 CBA 5 Mid Bay off Piney Point 30.41667 -86.45000 CBA 6 Hogtown Bayou 30.41667 -86.28333 CBA 7 Mid Bay off Fourmile Point 30.43717 -86.33750 CBA 8 Mullet Creek 30.43233 -86.63667 CBA 9 Mouth of Basin Bayou 30.48550 -86.25167 CBA 10 La Grange Bayou 30.46717 -86.14567 CBA11 Mid Bay off Alligator Point 30.44750 -86.22367 CBA12 East end of Bay North shore 30.42550 -86.14917 CBA13 East end of Bay South shore 30.38533 -86.14900

6
Each sample was split into different containers relevant to their analytical needs with
stainless steel tools that were washed with 10% nitric acid, acetone and deionized water
between each sample. Each sample was separated into a clear jar with a Teflon lined lid and
two new plastic bags. Samples 1, 2, 6 and 8 were also dolled into brown glass jars with
Teflon lined lids to be sent for dioxin compound analysis.
All sediment samples were packed tightly into coolers with ice and bubble wrap. The
coolers were shipped by overnight courier with chain of custody that indicated the condition
of the samples and the time they were received at the laboratories.
Chemical Analysis
All 13 samples were analyzed for metals, organochlorines, pesticides, aliphatic and
polycyclic aromatic hydrocarbons (Table 2) by the Geochemical and Environmental
Research Group located on the Texas A&M University campus in College Station, Texas.
Wellington Laboratories of Ontario, Canada analyzed selected samples for dioxin and furan
compounds. Details of the analytical procedures performed at each lab are described in
Appendix H.
7
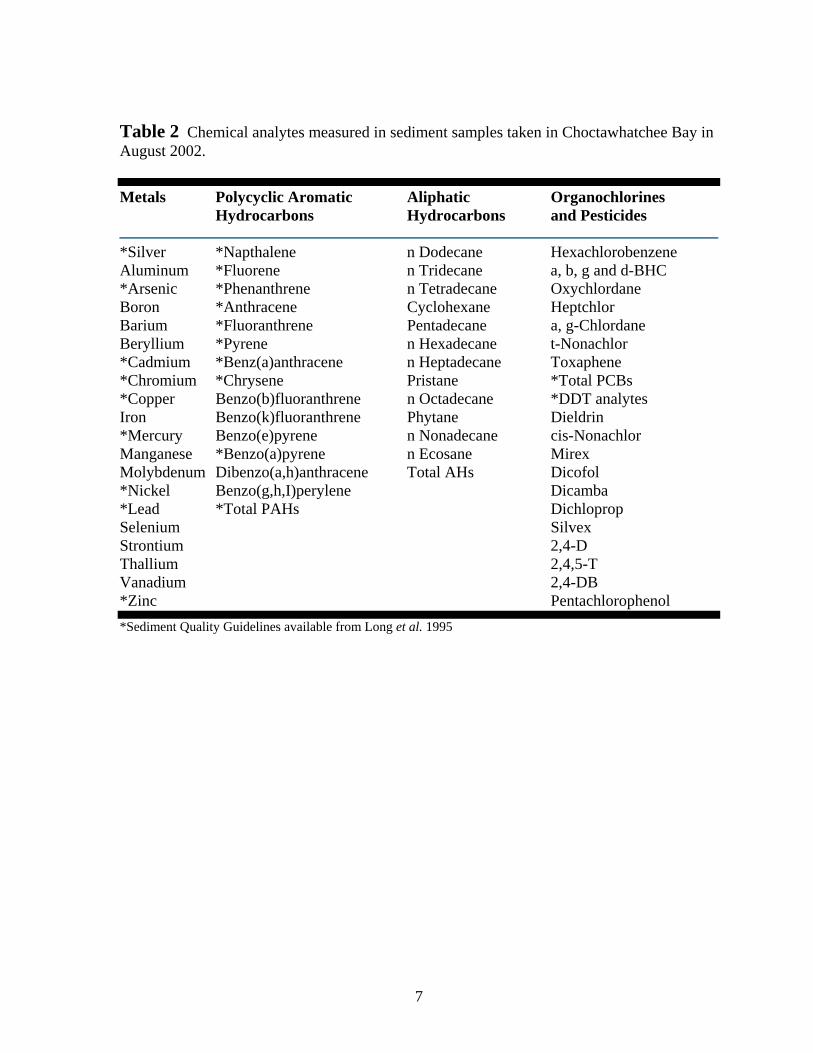
Table 2 Chemical analytes measured in sediment samples taken in Choctawhatchee Bay in August 2002.
Metals Polycyclic Aromatic Aliphatic Organochlorines Hydrocarbons Hydrocarbons and Pesticides
*Silver *Napthalene n Dodecane Hexachlorobenzene Aluminum *Fluorene n Tridecane a, b, g and d-BHC *Arsenic *Phenanthrene n Tetradecane Oxychlordane Boron *Anthracene Cyclohexane Heptchlor Barium *Fluoranthrene Pentadecane a, g-Chlordane Beryllium *Pyrene n Hexadecane t-Nonachlor *Cadmium *Benz(a)anthracene n Heptadecane Toxaphene *Chromium *Chrysene Pristane *Total PCBs *Copper Benzo(b)fluoranthrene n Octadecane *DDT analytes Iron Benzo(k)fluoranthrene Phytane Dieldrin *Mercury Benzo(e)pyrene n Nonadecane cis-Nonachlor Manganese *Benzo(a)pyrene n Ecosane Mirex Molybdenum Dibenzo(a,h)anthracene Total AHs Dicofol *Nickel Benzo(g,h,I)perylene Dicamba *Lead *Total PAHs Dichloprop Selenium Silvex Strontium 2,4-D Thallium 2,4,5-T Vanadium 2,4-DB *Zinc Pentachlorophenol *Sediment Quality Guidelines available from Long et al. 1995

8
Risk Analysis
The sediment quality guidelines used in this report to interpret much of the sediment
data were founded on an effects-based system produced by Long et al. (1995). It should be
noted that these are interpretive guidelines only. The guidelines are based on two
concentration values for each analyte, the ERL and ERM, which delineates three relative
safety ranges. The first range includes contaminant concentration values which fall below
the ERL. Sediments in this range will cause minimal effects with direct contact and adverse
biological effects would rarely be observed. The next range has a lower concentration limit
at the ERL and an upper limit at the ERM. Sediment concentrations within this possible
effects range would occasionally cause adverse effects in animals with direct contact to the
sediments. The third range includes sediment concentration values that are equal to and
above the ERM. Biological adverse effects would frequently occur to animals if they were to
come in contact with sediments within this probable effects range (Long et al. 1995).
Sediment stations were evaluated and scored for relative risk from sediment
contamination. This was done for those analytes for which sediment quality guidelines exist
from Long et al (1995) including: polycyclic aromatic hydrocarbons (PAHs),
organochlorines (OCs), and metals. The system consisted of assigning one point for each
chemical concentration that exceeded the ERL value but fell below the ERM value (possible
effects range), and two points for each concentration that was above the ERM value
(probable effects range). The score for all analytes detected within a sample were then
summed to provide a cumulative risk for each sample by chemical class and total analytes.
9
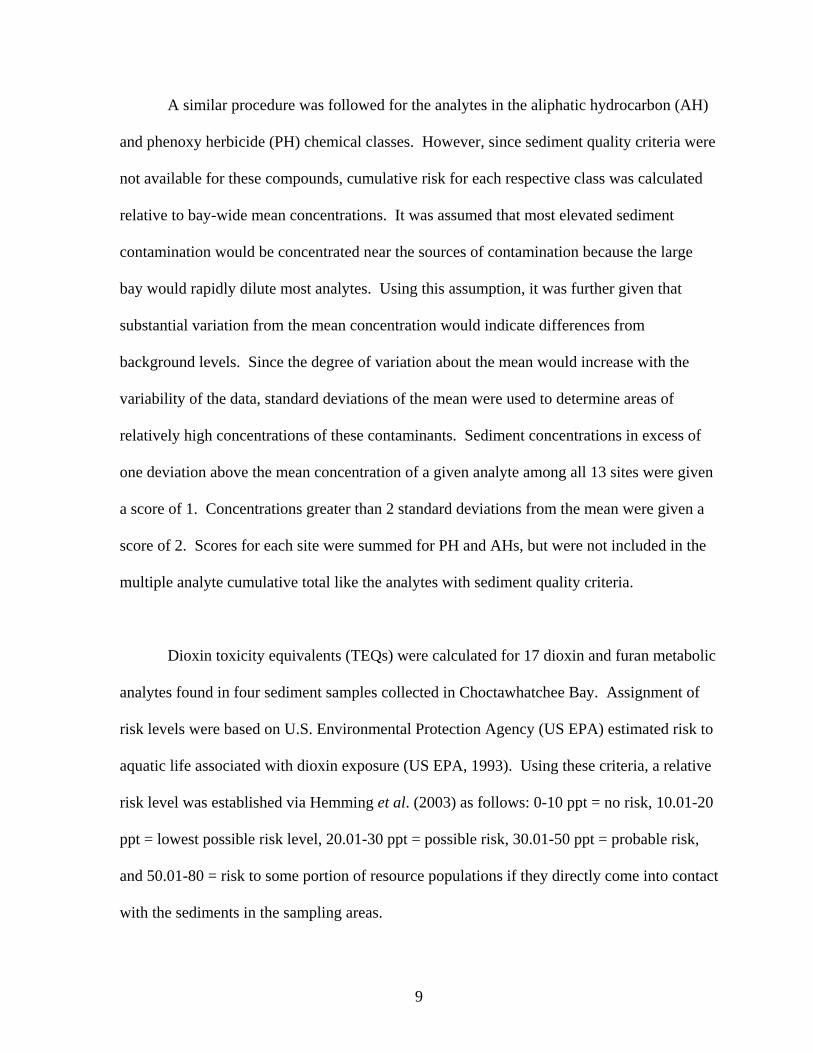
A similar procedure was followed for the analytes in the aliphatic hydrocarbon (AH)
and phenoxy herbicide (PH) chemical classes. However, since sediment quality criteria were
not available for these compounds, cumulative risk for each respective class was calculated
relative to bay-wide mean concentrations. It was assumed that most elevated sediment
contamination would be concentrated near the sources of contamination because the large
bay would rapidly dilute most analytes. Using this assumption, it was further given that
substantial variation from the mean concentration would indicate differences from
background levels. Since the degree of variation about the mean would increase with the
variability of the data, standard deviations of the mean were used to determine areas of
relatively high concentrations of these contaminants. Sediment concentrations in excess of
one deviation above the mean concentration of a given analyte among all 13 sites were given
a score of 1. Concentrations greater than 2 standard deviations from the mean were given a
score of 2. Scores for each site were summed for PH and AHs, but were not included in the
multiple analyte cumulative total like the analytes with sediment quality criteria.
Dioxin toxicity equivalents (TEQs) were calculated for 17 dioxin and furan metabolic
analytes found in four sediment samples collected in Choctawhatchee Bay. Assignment of
risk levels were based on U.S. Environmental Protection Agency (US EPA) estimated risk to
aquatic life associated with dioxin exposure (US EPA, 1993). Using these criteria, a relative
risk level was established via Hemming et al. (2003) as follows: 0-10 ppt = no risk, 10.01-20
ppt = lowest possible risk level, 20.01-30 ppt = possible risk, 30.01-50 ppt = probable risk,
and 50.01-80 = risk to some portion of resource populations if they directly come into contact
with the sediments in the sampling areas.

10
Results
Data are provided in tables and spatially relevant figures. Figures are qualified by
estimated sediment exposure risk. Exposure risks were estimated using the sediment quality
guidelines of Long et al. (1995), deviations from bay-wide mean concentrations, and U.S.
Environmental Protection Agency guidelines. Distribution of sediment composition profiles
are provided in Table 3 and the composition distribution is shown in Figure 2. Analytes
equal to or exceeding sediment quality guidelines (Long et al. 1995) are displayed: metals
(Table 4), OCs (Table 5) and PAHs (Table 6). Relatively high concentrations for AHs
(Table 7) and PHs (Table 8) are provided as well. Figures and estimated risk assessments are
provided for three categories of analytes: PAHs (Figure 3), OCs (Figure 4) and metals
(Figure 5). A cumulative risk level (Figure 6) was determined by adding scores from all
analyte categories at each site. An estimated risk level and need for further evaluation are
shown for PHs (Figure 8) and AHs (Figure 9). Results for the dioxin toxicity equivalents
(TEQs) calculations are displayed in Table 9 and are spatially illustrated in Figure 7.
Complete listings for the raw data collected are provided in the Appendices.

11
Table 3 Percent composition of sediment samples taken in Choctawhatchee Bay in August 2002, Gerg ID, Client ID, % Sand, % Silt and % Clay.
Gerg ID Client ID % Sand % Silt % Clay C42411 CBA1 32.8 37.7 29.5 C42412 CBA2 46.0 39.7 14.3 C42413 CBA3 23.8 49.8 26.4 C42414 CBA4 97.3 2.2 0.5 C42415 CBA5 90.7 5.2 4.1 C42416 CBA6 95.6 1.8 2.6 C42417 CBA7 42.7 29.9 27.5 C42418 CBA8 76.6 23.4 0.0 C42419 CBA9 99.6 0.2 0.2 C42420 CBA10 27.1 38.4 34.5 C42421 CBA11 39.7 28.1 32.2 C42422 CBA12 73.4 16.8 9.8 C42423 CBA13 87.2 6.8 6.0

12
Table 4 Sediment samples taken in Choctawhatchee Bay in August 2002 with metal analytes equal to or exceeding sediment quality guidelines (Long et al. 1995): Site, Analyte, Sediment Concentration (ug/g, ppm, dry weight), Effects Range Low (ERL), Effects Range Median (ERM).
Site Analyte Sediment Concentration ERL ERM CBA1 Arsenic 17.15 8.2 70 CBA2 Arsenic 11.59 8.2 70
" Copper 183.83 34 270 " Lead 57.25 46.7 218 " Mercury 0.34 0.15 0.71 " Silver 1.52 1 3.7
CBA3 Arsenic 21.75 8.2 70 " Lead 58.14 46.7 218 " Mercury 0.19 0.15 0.71 " Nickel 22.37 20.9 51.6
CBA7 Arsenic 30.00 8.2 70 " Nickel 27.96 20.9 51.6
CBA8 Mercury 0.18 0.15 0.71 CBA10 Arsenic 14.66 8.2 70 CBA11 Arsenic 28.82 8.2 70
" Nickel 25.86 20.9 51.6

13
Table 5 Sediment samples taken in Choctawhatchee Bay in August 2002 with organochlorines and pesticide analytes equal to or exceeding sediment quality guidelines (Long et al. 1995): Site, Analyte, Sediment Concentration (ng/g, ppb, dry weight), Effects Range Low (ERL), Effects Range Median (ERM).
Site Analyte Sediment Concentration ERL ERM CBA1 Total DDT 6.13 1.58 46.1 CBA2 Total DDT 43.20 1.58 46.1
" Total PCBs 221.63 22.7 180 CBA3 Total DDT 25.25 1.58 46.1
" Total PCBs 34.43 22.7 180 CBA4 Total PCBs 23.60 22.7 180 CBA7 Total DDT 2.69 1.58 46.1 CBA8 Total DDT 36.17 1.58 46.1
" Total PCBs 103.75 22.7 180 CBA10 Total DDT 3.24 1.58 46.1 CBA11 Total DDT 2.77 1.58 46.1

14
Table 6 Sediment samples taken in Choctawhatchee Bay in August 2002 with polycyclic aromatic hydrocarbon analytes equal to or exceeding sediment quality guidelines (Long et al. 1995): Site, Analyte, Sediment Concentration (ng/g, ppb, dry weight), Effects Range Low (ERL), Effects Range Median (ERM).
Site Analyte Sediment Concentration ERL ERM CBA2 Acenaphthylene 94.7 44 640
" Anthracene 191.3 85.3 1100 " Benzo(a)anthracene 345.2 261 1600 " Benzo(a)pyrene 436.1 430 1600 " Dibenzo(a,h)anthracene 66.4 63.4 260 " Total PAHs 12935.3 4022 44792
CBA3 Acenaphthylene 56.3 44 640 " Anthracene 115.4 85.3 1100 " Total PAHs 8382.7 4022 44792
CBA4 Anthracene 103.8 85.3 1100 " Benzo(a)anthracene 437.5 261 1600 " Benzo(a)pyrene 599.6 430 1600 " Chrysene 474.5 384 2800 " Dibenzo(a,h)anthracene 86.7 63.4 260 " Fluoranthene 1491.6 600 5100 " Pyrene 1331.3 665 2600 " Total PAHs 21618.0 4022 44792
CBA8 Total PAHs 719.6 4022 44792

15
Table 7 Sediment samples taken in Choctawhatchee Bay in August 2002 with relatively high concentrations of aliphatic hydrocarbon: Site, Analyte, Sediment Concentration (ug/g, ppb, dry weight), mean+1 standard deviation (SD), mean+2 standard deviations (SD).
Site Analyte Sediment Concentration mean+1SD mean+2SDCBA1 n-C10 20 17 28
" n-C11 82 64 104 " n-C15 238 101 161
CBA2 n-C10 19 17 28 " n-C12 7 3 6 " n-C13 12 9 14 " n-C14 16 11 16 " n-C17 1382 1240 1927 " Pristane 51 49 82
CBA3 n-C10 33 17 28 " n-C11 130 64 104 " n-C13 13 9 14
CBA8 n-C16 81 37 58 " n-C17 2411 1240 1927 " Pristane 116 49 82 " n-C18 302 114 196 " Phytane 218 83 142 " n-C19 2700 979 1719 " n-C20 666 250 432 " n-C21 1921 783 1294 " n-C22 1591 599 1028 " n-C23 4165 1584 2704 " n-C24 3060 1184 2004 " n-C25 11334 4610 7698 " n-C26 5174 1987 3371 " n-C27 42436 15441 27055 " n-C28 11021 4056 7058 " n-C29 111996 40896 71498 " n-C30 21874 7949 13938 " n-C31 43749 16402 28232 " n-C32 3197 1239 2094 " n-C33 8504 3370 5630 " n-C34 47711 17171 30299 " Total Alkanes 324262 119800 207926
CBA10 n-C13 10 9 14 CBA11 n-C12 6 3 6
" n-C14 12 11 16

16
Table 8 Sediment samples taken in Choctawhatchee Bay in August 2002 with relatively high concentrations of chlorophenoxy herbicides: Site, Analyte, Sediment Concentration (ug/g, ppb, dry weight), mean+1 standard deviation (SD), mean+2 standard deviations (SD).
Site Analyte Sediment
Concentration mean+1SD mean+2SD CBA1 Dicamba 320 210 355
" 2,4-D 370 304 516 " Dichlorprop 620 461 781 " 2,4-DB 260 211 339
CBA2 2,4,5-T 1322 567 971 CBA8 Total Phenoxy Herbicides 4551 1986 3300
" Dicamba 451 210 355 " 2,4-D 714 304 516 " Dichlorprop 1049 461 781 " 2,4-DB 445 211 339 " 2,4,5-T 744 567 971 " Silvex 1147 440 751

17
Table 9 Dioxin total toxicity equivalents (TEQs) relative to 2,3,7,8-tetrachlorodibenzodioxin in sediment samples taken in Choctawhatchee Bay in August 2002: Site, TEQs (ppt).
Site Total TEQs CBA 1 11.3 CBA 2 25.1 CBA 6 0.787 CBA 8 8.11

18
Figure 2 Sediment composition distribution for sediment samples taken in Choctawhatchee Bay, August 2002.

19
Figure 3 Estimated risk rank for polycyclic aromatic hydrocarbon (PAH) analytes in sediment samples taken from Choctawhatchee Bay, 2002, exceeding Long et al. (1995) sediment quality guidelines.

20
Figure 4 Estimated risk rank for organochlorine (OC) analytes in sediment samples taken from Choctawhatchee Bay, 2002, exceeding Long et al. (1995) sediment quality guidelines.

21
Figure 5 Estimated risk rank for metal analytes in sediment samples taken from Choctawhatchee Bay, 2002, exceeding Long et al. (1995) sediment quality guidelines.

22
Figure 6 Estimated risk rank for cumulative analytes (PAH, OC and Metals) in sediment samples taken from Choctawhatchee Bay, 2002, exceeding Long et al. (1995) sediment quality guidelines.
23
Figure 7 Dioxin toxicity equivalents (TEQs) calculated for dioxin and furan metabolic analytes found in sediment samples collected from four sites in Choctawhatchee Bay, 2002.

24
Figure 8 Estimated risk and need for further evaluation ranking scores for phenoxy herbicides in sediment samples collected in Choctawhatchee Bay, 2002.

25
Figure 9 Estimated risk and need for further evaluation ranking scores for aliphatic hydrocarbons in sediment samples collected in Choctawhatchee Bay, 2002.

26
DISCUSSION
Habitat degradation in Choctawhatchee Bay has been reported (Blaylock, 1983;
Livingston, 1997; NOAA, 1997). This study was designed to evaluate Choctawhatchee Bay
to assess the current status of the bay, particularly in areas previously reported to be
contaminated. Data was not dissimilar from earlier reports.
Sediment Composition
Sediment composition in Choctawhatchee Bay was comparable to other bay systems
of the northeastern Gulf of Mexico (Brim et al., 1998; Brim, 2000; Hemming et al. 2002).
Sand fractions in Choctawhatchee Bay sediments ranged from a low 27.1% to a high of
99.6% with only 5 of the 13 samples containing less than 70% sand. The silt and clay
fractions were correspondingly variable and reciprocal to the sand fractions. Silt ranged
from 1.8% to as high 49.8% and clay range from 0.2 to 32.2%. Most samples collected from
the deeper central portions of the bay were composed of silt, while sandy samples were
collected from the shallow perimeter of Choctawhatchee Bay. Typical samples were a dark
olivine color with an occasional sulfurous odor.
Metals
Arsenic, copper, lead, mercury, nickel, and silver were in excess of sediment quality
guidelines at the Effects Range Low (ERL) level, but none exceeded the Effects Range
Median (ERM) criteria (Long et al., 1995). Sediment arsenic concentrations most frequently
exceeded the sediment criterion with almost half the samples expected to increase the
incidence of adverse negative effects on living resources from rare to occasional (ERL, Long

27
et al., 1995). Mercury and nickel concentrations exceeded their respective ERLs at 3 sites
each. Lead surpassed its ERL at 2 sites and both copper and silver at 1 site each. The
sediment sample from Tom’s Bayou in the northwestern bay possessed all the above metals,
except nickel, at concentrations exceeding ERL criteria. Concern prompted an
environmental study by the Department of Environmental Protection in the late 90’s after the
Spence Boat Yard in Tom’s Bayou burned to the ground in January of that year (Butts,
1997). Similarly, the adjacent Garnier’s Bayou sediments contained all the listed metals, but
silver and copper, above the ERL criteria. This localized metals contamination indicates a
proximate source. Metal enrichment was found and sources were attributed to runoff from
golf courses, marina activity, Chromated Copper Arsenate (CCA) treated dock pilings,
antifouling paints, and general stormwater runoff from urban areas after rain event (Butts,
1997). A complete listing of the metal analytes are provided in Appendix G.
Polycyclic Aromatic Hydrocarbons (PAHs)
Like metals contamination, PAH concentrations exceeding ERL often occurred in
Tom’s Bayou and Garnier’s Bayou, but even more frequently in Cinco Bayou, just east of
Garnier’s Bayou. No other bayou in the Choctawhatchee Bay system was shown to have
sediment PAH contamination; however, Mullet Creek did exceed the ERL for total PAHs.
The total PAHs criterion was exceeded in each of the three bayous listed above, as was the
anthracene ERL criterion. Acenaphthylene, fluoranthene, pyrene, benzo(a)anthracene,
chrysene, benzo(a)pyrene, and dibenzo(a,h)anthracene were also found to exceed their
respective ERLs in 1 to 2 bayous each. High concentrations were found in previous studies
and reported sources included runoff, wastewater discharge, and illegal or accidental
28
dumping (CBA, 1998). As with metal contamination, sediments contaminated with PAHs at
concentrations considered to pose ecological risk to fish and wildlife resources were most
often found in the bayous of the northwestern bay. A complete listing of the PAH analytes
are provided in Appendix F.
Organochlorines/Pesticides
Organochlorine (OC) contamination of sediments was only found to exceed sediment
quality guidelines for the categories total polychlorinated biphenyls (PCBs) and total
dichlorodiphenyltrichloroethane (DDT). Total DDT exceeded the ERL criterion at 7 sites,
and was almost more than the ERM criterion in Tom’s Bayou. Total PCB sediment
concentrations exceeded the ERL in Garnier’s Bayou, Cinco Bayou, and Mullet Creek, and
were more than the ERM in Tom’s Bayou indicating frequent adverse effects may have been
expected from organochlorine compound exposure. The distribution of sediments
contaminated with OC compounds was quite similar to the distribution of sediments
contaminated with metals (described above). This type of contamination was also prevalent
in the bayous of the northwestern bay area where metal and PAH contamination were
predominant. Most of the areas with elevated organochlorine levels were drainage areas from
historical spray fields used in the late 60’s and early 70’s (U.S. Department of Health and
Human Services, 2003). A complete listing of the OC analytes are provided in Appendix E.
Dioxin
Dioxin contamination of sediments in Choctawhatchee Bay was not dissimilar from
dioxin concentrations found in the sediments from bay systems across the Florida panhandle

29
(Hemming et al. 2003). The highest dioxin and furan concentrations measured in
Choctawhatchee Bay were found in sediments taken from Tom’s Bayou. As a result, the
highest toxicity equivalency (TEQ) estimate was calculated for this bayou and it was more
than twice the estimate for any of the other three samples taken. The Tom’s Bayou sample
could have imposed possible risk to some natural resource populations if in contact with
these sediments; although, the other sites were likely to have posed only negligible risk
(USEPA 1993, Hemming et al. 2003). However, risk may increase with changes in the
distribution of these sediments via storm events or dredge and fill activities. Risk from
exposure to dioxin compounds also dramatically increases in more sensitive life stages,
different exposure routes (such as filtration feeding), and with concurrent exposure to other
contaminants.
Dioxin found in Choctawhatchee Bay sediment may have originated from numerous
historical spray fields and burial sites in the bay watershed (U.S. Department of Health and
Human Services, 2003). However, natural burning occurrences and industrial processes also
generate dioxin compounds (Harte et al., 1991; Hoffman et al., 2003; Schettler et al., 1999;
Im et al., 2002). Resulting atmospheric concentrations (<6 pg/m3 range) in the United States
are reportedly low (Smith et al., 1989; Harless et al., 1990; Maisel et al., 1990; Hunt et al.,
1990a; CDEP, 1988; Harless et al., 1991; Edgerton et al., 1989; Eitzer et al., 1989; Hunt et
al., 1990b), but can be traced to water body loading and sediment sequestering (Lodge and
Cook, 1989, Hemming et al. 2003). Dioxin compounds are transferred from the sediment
compartment to the food chain rather readily in aquatic systems. It is in the food chain that
dioxins can be biologically magnified and cause adverse ecological effects (Hoffman et al.,

30
2003; Rhodes et al., 1997; Woodford et al., 1998; Landis and Yu, 1999; Marvin et al., 2000;
Kannan et al., 2001; Im et al., 2002). A complete listing of the dioxin analytes are provided
in Appendix B.
Herbicides
Substantially more phenoxy herbicide residues were found in the sediment sample
taken from Mullet Creek; however, noteworthy concentrations were also found in sediments
from Tom’s Bayou and Rocky Bayous. The phenoxy herbicides analyzed for in this survey
included dicamba, 2,4-D, Dichloroprop, 2,4-DB, 2,4,5-T, and silvex. Dicamba is a synonym
for the herbicide trichlopyr, commonly found as the active ingredient in landscaping "weed
and feed" and brush control products (MeisterPro 2003). Phenoxy herbicides are systemic
pesticides used for controlling woody plants and broadleaf weeds. They are used on lawns,
golf courses, rights-of-way, non-irrigation ditch banks and agricultural fields (MeisterPro
2003). All three waterbodies with elevated concentrations of herbicides are lined with
private homes, but Mullet Creek also has a drainage connection to a large private
development on Lake Sharon.
Although no sediment quality guidelines were available for these chemicals, the
literature does suggest that phenoxy herbicide exposure can cause adverse effects (Arias
1994, Arbuckle 1999, Duchnowicz 2002, Kleszczynska 2003). The effects of sediment-
associated exposures are less clear (Romero 1998, Dorado and Almendros 2001). In any
event, the elevated concentrations found only in certain bay segments indicated probable sub-
watershed application of these herbicides and transport to the most proximate waterbody

31
(Felding et al. 1995, Hill et al. 2003). Appropriate pesticide management practices, such as
adequate buffer zones and application timing and method alterations, could significantly
reduce these inputs to the tributaries of Choctawhatchee Bay. A complete listing of the
herbicide analytes are provided in Appendix D.
Aliphatic Hydrocarbons
Like phenoxy herbicides, the highest concentrations of aliphatic hydrocarbons (AHs)
were found in sediments taken from Mullet Creek, Rocky Bayou, and Tom’s Bayous. In
addition to these sites, sediments from Garnier’s Bayou also possessed noteworthy AH
concentrations. While sediments from the above-mentioned bayous were contaminated with
higher concentrations of 3 to 5 AH analytes, Mullet Creek sediments were heavily
contaminated with over 20 AH analytes. Tom’s and Rocky bayous are proximate to the Fort
Walton Airport, but the land-use near Mullet Creek is mainly residential and owned by Eglin
Air Force Base. Mullet Creek is one of the historical drainage sites from spray fields used in
the late 60’s and early 70’s for testing of spray patterns and equipment. The test site above
Mullet Creek was also a drum disposal site during the same time frame (U.S. Department of
Health and Human Services, 2003). Mullet Creek is also in the vicinity of the Tri-Village
Fire Department which might contribute to high levels of AH in the creek.
AHs are a large component of petroleum, such as fuels and oils, and are found
associated with a variety of combustion engines from motor vehicles to aircraft. These
products are found at various concentrations throughout the world as a result of the presence
of petroleum (Hoffman et al 2003). Because of their wide use, occupational exposure

32
(Dudley et al. 2001, Spencer et al. 2002, Ritchie 2003) and environmental fate and transport
(Suchanek et al. 2000, Lindstrom and Braddock 2002) have been examined. However,
sediment quality guidelines are not yet available and risk assessments for this complex mix
of analytes are not easily made despite their environmental toxicity and hazard to organisms
(Hoffman et al. 2003). A complete listing of the AH analytes are provided in Appendix C.

33
CONCLUSIONS
The sediment quality of Choctawhatchee Bay was analogous to that reported for
sediments of other Bay systems in the Florida panhandle (Brim et al., 1998; Brim, 2000;
Hemming et al., 2003; Hemming et a. 2002). The occurrence of sediment contamination was
largely site-specific with probable ties to proximate sub-watershed land-uses. More specific
study of the distribution of contaminated sediments in these areas may reveal the historic
and/or current sources of pollution. Further investigation into the extent of the contamination
and the potential ecological risk posed is recommended for Mullet Creek, Rocky Bayou,
Tom’s Bayou, Garnier’s Bayou, Cinco Bayou, and possibly La Grange Bayou.
The cumulative impact of the multiple analytes detected in some sediment samples
has not been determined. However, the risk to the ecological systems in these bay areas is
likely to far exceed the estimated risk of exposure to individual analytes as proposed by Long
et al., 1995. To further compound and intensify the point, heavy contamination of these
same areas with contaminants not represented by the effects range categories (phenoxy
herbicides and aliphatic hydrocarbons) existed.

34
RECOMMENDATIONS
The following recommendations are offered for consideration.
1) Conduct a more systematic sediment survey throughout the following water bodies to
better assess the extent of contamination, level of contamination (increasing,
decreasing, or stable) and possible migration of the contamination to surrounding
areas: Mullet Creek, Rocky Bayou, Tom’s Bayou, Garnier’s Bayou, Cinco Bayou,
and La Grange Bayou.
2) Conduct a land-use survey evaluating activities, historic and present, that may be
related to site-specific contamination.
3) Monitor the biological tissues (especially reproductive tissues or eggs) of some
resident piscivorous birds, in particular, the brown pelican and osprey for
bioaccumulation of these contaminants to determine if remedial actions are needed.
4) Monitor the biological tissues (including unfertilized eggs) of coastal resident marine
species, particularly spotted seatrout, flounder, redfish, and long-lived, deep-water
clam species for bioaccumulation of these contaminants to determine if remedial
actions are needed.

35
REFERENCES
Arbuckle, Tye E.; Savitz, David A.; Curtis, Kathryn M., 1999. Exposure to Phenoxy Herbicides and the Risk of Spontaaneous Abortion. Epidemiology 10(6), 752. Arias, Elio, 1994. Acute toxicity to chick embryos of a formulated product containing the phenoxy herbicide 2,4-dichlorophenoxyacetic acid (2,4-D). Medical science research 22(1), 11. Blaylock, Dewey A. Choctawhatchee Bay: analysis and interpretation of baseline environmental data. 1983. NWFWMD and Marine Advisory Program, Florida Cooperative Extension Service, 146-149 pp. Bolton, H., R. Breteller, B. Vigon, J. Scanlon, S. Clark. 1985. National perspective on sediment quality. Prepared by Batelle Institute, Washington DC, for US EPA contract No. 68-01-6986. US Environmental Protection Agency, Washington DC. Brim, M.S., D. Bateman, R. Jarvis. 2000. Environmental Contaminants Evaluation of St. Joseph Bay, Florida. Publication No. PCFO-EC-00-01. U.S. Fish and Wildlife Service, Panama City Field Office, Panama City, Florida. ____________. 1998. Environmental Contaminants Evaluation of St. Andrew Bay, Florida. Publication No. PCFO-EC-98-01. U.S. Fish and Wildlife Service, Panama City Field Office, Panama City, Florida. Buchman, M.F. 1999. NOAA Screening quick reference tables, NOAA, HAZMAT Report 99-1, Seattle WA, Coastal Protection and Restoration Division, National Oceanic and Atmospheric Administration, 12 pp. Butts. Glenn L, 1997. An Environmental Assessment of Sediment Quality in Boggy Bayou, Okaloosa County. Choctawhatchee Bay Ecoregion. Florida Department of Environmental Protection. Pensacola, Florida. CBA (Choctawhatchee Basin Alliance). 1998. Breaking new ground: Management of the Choctawhatchee River and Bay watershed. Florida Department of Community Affairs, 22 pp. Connecticut Department of Environmental Protection, 1988. Measurement of selected polychlorinated dibenzo-p-dioxins and polychlorinated dibenzofurans in ambient air in the vicinity of Wallingford, Connecticut. Connecticut Department of Environmental Protection, Air Compliance Unit, Hartford, CT. Project report by ERT, Concord, MA. Project # 7265-001-004. July 8, 1988.

36
Di Toro, D., C. Zarba, D. Hansen, W. Berry, R. Swartz, C. Cowan, S. Pavlou, H. Allen, N. Thomas, P. Paquin. 1991. Technical basis for establishing sediment quality criteria for non-ionic organic chemicals using equilibrium partitioning. Environ Toxicol Chem. 10:1-43. Dorado, J.; Almendros, G., 2003. Assessment of Molecular Descriptors Involved in the Sorptive Interactions of Phenoxy-carboxylic Herbicides in Soil Treated with Different Concentrations of Humic Acid. Toxicological and Environmental Chemistry 84(1-4), 21-32(12). Duchnowicz, P.; Koter, M.; Duda, W, 2002. Damage of erythrocyte by phenoxyacetic herbicides and their metabolites. Pesticide Biochemistry and Physiology 74(1), 1-7(7) Elsevier Science (USA). Dudley, A.C.; Peden-Adams, M.M.; EuDaly, J.; Pollenz, R.S.; Keil, D.E., 2001. An Aryl Hydrocarbon Receptor Independent Mechanism of JP-8 Jet Fuel Immunotoxicity in Ah-Responsive and Ah-Nonresponsive Mice. Toxicological Sciences 59(2), 251-259(9). Edgerton, S.A., Czuczwa, J.M., Rench, J.D., Hodanbosi, R.F., Koval, P.S. 1989. Ambient air concentrations of polychlorinated dibenzo-p-dioxins and dibenzofurans in Ohio. Sources and Health Risk Assessment. Chemosphere 18(9/10), 1713-1730. Eitzer, B.D., Hites, R.A., 1989. Polychlorinated dibenzo-p-dioxins and dibenzofurans in the ambient atmosphere of Bloomington, Indiana. Environmental Science and Technology 23(11), 1389-1395. Felding, G.; Sorensen, J.B.; Mogensen, B.B.; Hansen, A.C., 1995. Phenoxyalkanoic acid herbicides in run-off. The Science of the Total Environment 175(3), 207-218(12). Harless, R.L., Lewis, R.G., 1991. Evaluation of a sampling and analysis method for determination of polyhalogenated dibenzo-p-dioxins and dibenzofurans in ambient air. Presented at: Dioxin '91, 11th Int. Symposium on Chlorinated Dioxins and Related Compounds, Research Triangle Park, NJC; Sept., 1991. ____________, McDaniel, D.D., Dupuy, A.E., 1990. Sampling and analysis for polychlorinated dibenzo-p-dioxins and dibenzofurans in ambient air. Proceedings of the Tenth International Symposium on Chlorinated Dioxins and Related Compounds. Bayreuth, Germany, September 10-14, 1990. Harte, J., Holdren, C., Schneider, R., Shirley, C., 1991.Toxics A to Z; A Guide to Everyday Pollution Hazards. University of California Press, Berkeley and Los Angeles, CA. Hemming, J.M., and M. Brim. 2003. Sediment Contamination Survey on St. Marks National Wildlife Refuge. Florida Scientist 66(4); 314-322.

37
____________, M. Brim, R. Jarvis. 2002. Survey of Dioxin and Furan Compounds in Sediments of Florida Panhandle Bay Systems. Marine Pollution Bulletin 46:491-521. Hill, B. D.; Inaba, D. J.; Byers, S. D.; Grant, C. A., 2003. Levels of "phenoxy" herbicides in prairie rainfall during 2000-2001. Canadian Journal of Plant Science 83(2), 467-470. Hoffman, D.J., Rattner, B.A., Burton, G.A., Cairnes, J., 2003. Handbook of Ecotoxicology. Second Edition. CRC Press, Boca Raton, FL. Hunt, G., Maisel, B., 1990a. Atmospheric PCDDs/PCDFs in wintertime in a northeastern U.S. urban coastal environment. Chemosphere 20, 1455-1462. ____________, Maisel,B. Hoyt, M.1990b. Ambient concentrations of PCDDs/PCDFs in the South Coast air basin. California Air Resources Board. Contract No. A6-100-32. Document No. 1200-005-700. Im, S.H., Kannan, K., Matsuda, M., Giesy, J.P., Wakimoto, T., 2002. Sources and distribution of polychlorinated dibenzo-p-dioxins and dibenzofurans in sediments from Masan Bay, Korea. Environmental Toxicology and Chemistry 21(2), 245-252. Kannan, K., Kober, J.L., Kang, Y.S., Masunaga, S., Nakanishi, J., Ostaszewski, A., Giesy, J.P., 2001. Polychlorinated naphthalenes, biphenyls, dibenzo-p-dioxins, and dibenzofurans as well as polycyclic aromatic hydrocarbons and alkylphenols in sediment from the Detroit and Rouge Rivers, Michigan, USA. Environmental Toxicology and Chemistry 20 (9), 1878-1889. Kleszczynska, H.; Bonarska, D.; Bielecki, K.; Sarapuk, J., 2003. The Hemolytic and Physiological Activities of Mixtures of some Phenoxy and Organophosphorus herbicides. Cellular and Molecular Biology Letters 8(1), 55-62. Landis, W.G., Yu, M.H., 1999. Introduction to Environmental Toxicology; Impacts of Chemicals Upon Ecological Systems, Second Edition. CRC Press, Boca Raton, FL. Lindstrom, J.E.; Braddock, J.F., 2002. Biodegradation of petroleum hydrocarbons at low temperature in the presence of the dispersant Corexit 9500. Marine Pollution Bulletin 44(8), 739-747(9). Livingston, Robert J. Distribution of Toxic Agents and Biological Response of Infaunal Macroinvertebrates in Choctawhatchee Bay System. Tallahassee: Center for Aquatic Research and Resource Management. 1987. Lodge, K.B., Cook, P.M., 1989. Partitioning studies of dioxin between sediment and water: the measurement of Koc between sediment and water. Chemosphere 19, 439-448. Long, E., D. MacDonald, S. Smith, F. Calder. 1995. Incidence of adverse biological effects within ranges of chemical concentrations in marine and estuarine sediments. Environ Manage 19(1): 81-97.

38
____________, L. Morgan. 1990. The potential for biological effects of sediment-sorbed contaminants tested in the National Status and Trends Program. NOAA Tech. Memo. NOS OMA 52. US National Oceanic and Atmospheric Administration, Seattle, WA, 175 pp. MacDonald, D.D. 1993. Development of an approach to the assessment of sediment quality in Florida coastal waters. Prepared by MacDonald Environmental Sciences, Ltd., Ladysmith, British Columbia. Prepared for Florida Department of Environmental Regulation, Tallahassee, Florida. Vol. 1 128 pp., Vol. 2 117 pp. Maisel, G.E., Hunt, G.T., 1990. Background concentrations of PCDDs/PCDFs in ambient air. A comparison of toxic equivalency factor (TEF) models. Chemosphere 20, 771-778. Marvin, C.H., Howell, E.T., Reiner, E.J., 2000. Polychlorinated dioxins and furans in sediments at a site colonized by Dreissena in Western Lake Ontario, Canada. Environmental Toxicology and Chemistry 19(2), 344-351. MeisterPro Information Resources. 2003. Crop Protection Handbook (Formerly the Farm Chemical Handbook). Meister Publishing Company, Willoughby, OH. Northwest Florida Water Management District.1996. Choctawhatchee River and Bay Surface Water Improvement and Management Plan. Havana: Northwest Florida Water Management District. Program Development Series 96-4. O’Connor, T.P. 1991. Concentrations of organic contaminants in mollusks and sediments at NOAA National Status and Trends sites in the coastal and estuarine United States. Environ Health Perspec 90:69-73. Persaud, D., R. Jaagumagi, A. Hayton. 1992. Guidelines for the protection and management of aquatic sediment quality in Ontario. Ontario Ministry of the Environment, Toronto, Canada. 23 pp. Rhodes, L.D., Gardner, G.R., Van Beneden, R.J., 1997. Short-term tissue distribution, depuration and possible gene expression effects of (3H)TCDD exposure in soft-shell clams (Mya arenaria). Environmental Toxicology and Chemistry 16(9), 1888-1894. Ritchie, G.; Still, K.; Rossi III, J.; Bekkedal, M.; Bobb, A.; Arfsten, D., 2003. Biological And Health Effects Of Exposure To Kerosene-Based Jet Fuels And Performance Additives. Journal of Toxicology and Environmental Health Part B: Critical Reviews 6(4), 357-451(95). Romero, E.; Dios, G.; Mingorance, M.D.; Matallo, M.B.; Pena, A.; Sanchez-Rasero, F, 1998. Photodegradation of mecoprop and dichlorprop on dry, moist and amended soil surfaces exposed to sunlight.. Chemosphere 37(3), 577-589(13). Schettler, T., Solomon, G., Valenti, M., Huddle, A.,1999. Generations at Risk. MIT Press, Cambridge, Massachusetts.

39
Smith, R.M., O'Keefe, P.W., Hilker, D.R., Aldous, K.M., Mo, S.H., Stelle, R.M., 1989. Ambient air and incinerator testing for chlorinated dibenzofurans and dioxins by low resolution mass spectrometry. Chemosphere 18, 585-592. Spencer, P.S.; Kim, M.S.; Sabri, M.I., 2002. Aromatic as well as aliphatic hydrocarbon solvent axonopathy. International Journal of Hygiene and Environmental Health 205(1-2), 131-136(6). Suchanek, M.; Kostal, J.; Demnerova, K.; Kralova, B., 2000. Use of sodium dodecyl sulphate for stimulation of biodegradation of n-alkanes without residual contamination by the surfactant. International Biodeterioration and Biodegradation 45(1), 27-33(7). U.S. Department of Commerce and US NOAA (United States National Oceanic and Atmospheric Administration), 1997. Magnitude and Extent of Sediment Toxicity in Four Bays of the Florida Panhandle: Pensacola, Choctawhatchee, St. Andrews and Apalachicola. Silver Springs Maryland. U.S. Department of Health and Human Services. 2003. Petitioned Public Health Assessment Eglin Air Force Base. EPA Facility ID FL8570024366. Agency for Toxic Substances and Disease Registry. 33-35 pp. US EPA (United States Environmental Protection Agency). 1989. Interim Procedures for Estimating Risks Associated with Exposures to Mixtures of Chlorinated Dibenzo-p-dioxins and -Dibenzofurans (CDDs and CDFs) and 1989 Update. EPA/625/3-89/016. ____________. 1993. Interim Report on Data and Methods for Assessment of 2,3,7,8-Tetrachlorodibenzo-p-dioxin Risk to Aquatic Life and Associated Wildlife. EPA/600/R93/055. ____________. 1989. Sediment classification methods compendium. Final draft report. United States Environmental Protection Agency, Washington, DC 243 pp. US NOAA (United States National Oceanic and Atmospheric Administration). 1991. National Status and Trends Program for marine environmental quality. Progress report. Second summary of data on chemical contaminants in sediments from the National Status and Trends Program. United States National Oceanic and Atmospheric Administration. Rockville, Maryland 29 pp. Woodford, J.E., Karasov, W.H., Meyer, M.W., Chambers, L., 1998. Impact of 2,3,7,8-TCDD exposure on survival, growth, and behavior of ospreys breeding in Wisconsin, USA. Environmental Toxicology and Chemistry 17(7), 1323-1331.

40
APPENDICES

41
Appendix A
Standard operating procedures for field collection of sediment samples (PCFO-EC SOP 004).
42
PCFO-EC SOP 004
STANDARD OPERATING PROCEDURES SEDIMENT SAMPLING FOR CHEMICAL ANALYSES
To maintain and assure quality control, sediment samples collected for shipment to USFWS-
approved analytical laboratories will be obtained and handled as follows: COLLECTON OF SAMPLES FROM COASTAL WATERS OR LARGE RIVERS
1. Sampling Devices - The following devices are approved for obtaining sediment samples:
A) Ponar grab, Standard. Manufactured from 316 stainless steel including jaws, side plates, underlip plate, screen. frame, screens and hinge pin. 583 micron mesh top screens; weight empty - 21 kg (45 lbs); sampling area 22.85 cm. x 22.85 cm (9" x 9").
B) Ponar grab, Petite. Manufactured with 316 stainless steel including jaws, side plates, underlip plate, screen frame, screens and hinge pin. 583 micron mesh top screens; weight empty - 6.8 kg (15 lbs); sampling area 15.24 x 15.24 cm (6" x 6").
2. Sediment Sampling Boat-
A) fiberglass boat with outboard motor equipped as follows:
1) navigation and positioning capabilities including: a) loran navigation system, b) chart-printing depth recorder, c) compass, d) appropriate navigation charts.
2) 12 volt electric winch; steel ginpole with heavy duty pulley; 100' of 1/2" braided nylon lift rope.
3. Other Equipment and Supplies -
A) Stainless steel sample pan 28 x 48 x 10 cm.

43
B) Pre-cleaned, chemical-free, glass 1.0 liter sample jars with screw-top lids having Teflon liners.
C) Pre-cleaned, chemical-free stainless steel utensils.
D) Clean insulated ice chests with ice.
E) Permanent, glass-adhesive markers.
F) Bound collection logbook or individual record sheets.
G) Disposable laboratory gloves.
H) Meters: dissolved oxygen, salinity, temperature, pH and others, as appropriate.
4. Operational Procedures -
A) Prior to each collection day the ponar sampler will be scrubbed and washed with a detergent solution, rinsed thoroughly with tap water, and then rinsed with distilled water. After each collection field trip the ponar will be cleaned, as above, and stored properly.
B) The daily collection plan shall provide, to the greatest extent possible, for sampling to begin at the least contaminated station, with work advancing toward the most contaminated station.
C) Sediment samples obtained at sampling stations will be composite samples. Each composite will consist of five individual ponar sub-samples collected 3 meters apart along a straight-line transect, with the collection boat anchored. Move from one sub-sample position to the next by slipping the anchor line to provide approximately 3 meters of horizontal drift.
D) Place each ponar sub-sample in the sample pan. Take approximately 150 grams - of sediment from the center of the sub-sample using appropriate utensils and place it in the collection jar designated for that station. After obtaining each sub-sample, rinse utensils, wash deck, sample pan, and the ponar sampler with seawater or river water.
Note: 150 grams of sub-sample collected from each of the 5 sub-sample positions (about 750 grams of sample total) should result in the sample jar being about 3/4 full. This leaves adequate space in the jar for any expansion of the sample during freezing.

44
E) During collection of the third ponar sub-sample, record the station location by loran positions and by latitude and longitude. At this time, also record all other station information (such as depth, water temperature, etc).
F) Place each sub-sample (total. n=5) in the appropriate pre-labeled, sample jar. Secure the lid and place sample on ice in a cooler.
G) After work at each sampling station is complete, clean the ponar. Sample pan, wash deck and utensils thoroughly and rinse with seawater or river water.
H) For field trips involving more than one day, samples will be frozen and stored in a portable field freezer.
I) After each collection day double-wrap each full sample jar with clean. heavy-duty aluminum foil, place a second identification label over the foil and store in a freezer.
J) Upon returning to the Panama City Field Office samples will be transferred to a laboratory freezer and held at -230 degrees centigrade (-10 Fahrenheit) until shipment for chemical analyses. Sediment samples for particle size analysis will be held at 40 degrees C.

45
Appendix B Depth and bottom water temperature collected during sampling.

46
Station ID Latitude Longitude Depth (m) Temperature (C) CBA1 30.50317 -86.43550 5.0 30.5CBA2 30.50117 -86.49150 4.3 31.5CBA3 30.44617 -86.58917 6.5 29.6CBA4 30.43233 -86.63667 2.1 32.5CBA5 30.41667 -86.45000 6.4 29.9CBA6 30.41667 -86.28333 3.7 30.2CBA7 30.43717 -86.33750 6.7 29.9CBA8 30.43233 -86.63667 0.9 26.4CBA9 30.48550 -86.25167 0.5 30.7CBA10 30.46717 -86.14567 4.0 30.9CBA11 30.44750 -86.22367 4.5 30.4CBA12 30.42550 -86.14917 2.1 31.2CBA13 30.38533 -86.14900 2.3 30.2

47
Appendix C Dioxin data on samples from Rocky, Tom’s and Hogtown Bayous, and Mullet Creek.

48
2002-457-CBA Table A: Dioxins and Furans: Soil (ppt) Rocky Bayou # of Tom's Bayou # of Hogtown Bayou # of Mullet Creek # of CBA1 8/22/02 1003 pks CBA2 8/22/02 1048 pks CBA6 8/21/02 1205 pks CBA8 8/21/02 0922 pksFurans: 2378-TCDF 0.4 2.9 NDR (0.3) 1.0 Total TCDFs 6.8 6 27.3 8 ND (0.3) 15.1 5 12378-PeCDF NDR (0.4) 1.5 ND (0.1) ND (0.1) 23478-PeCDF 0.4 4.2 ND (0.1) 0.6 Total PeCDFs 2.3 2 124 8 ND (0.1) 15.2 8 123478-HxCDF 0.5 13.3 ND (0.1) 1.5 123678-HxCDF 0.5 6.6 ND (0.1) 0.8 234678-HxCDF ND (0.1) 11.1 ND (0.1) 1.5 123789-HxCDF ND (0.1) NDR (0.8) ND (0.1) NDR (0.5) Total HxCDFs 2.6 3 117 6 ND (0.1) 21.6 6 1234678-HpCDF 3.7 79.3 0.7 13.4 1234789-HpCDF NDR (0.3) 5.9 ND (0.2) 1.1 Total HpCDFs 6.9 3 189 3 0.7 1 35.8 4 OCDF 4.6 1 124 1 1.9 1 23.5 1 Dioxins: 2378-TCDD 0.3 0.7 ND (0.2) 5.0 Total TCDDs 39.5 7 25.0 7 2.5 1 5.0 1 12378-PeCDD 1.1 2.7 ND (0.2) NDR (0.9) Total PeCDDs 63.4 7 38.7 6 3.6 3 ND (0.9) 123478-HxCDD NDR (3.5) 6.8 NDR (0.5) 2.2 123678-HxCDD 5.6 17.7 NDR (0.8) 4.0 123789-HxCDD 18.9 24.2 NDR (2.0) NDR (3.6) Total HxCDDs 527 5 488 7 36.1 3 42.5 6 1234678-HpCDD 253 543 25.0 71.5 Total HpCDDs 1106 2 1644 2 93.5 2 174 2 OCDD 5081 1 6217 1 528 1 824 1 Toxic Equivalent (TEQ) 11.3 ppt 25.1 ppt 0.787 ppt 8.11 ppt

49
2002-457-CBA Table A (cont.) Rocky Bayou Tom's Bayou Hogtown Bayou Mullet Creek % Recovery CBA1 8/22/02 1003 CBA2 8/22/02 1048 CBA6 8/21/02 1205 CBA8 8/21/02 0922 of Surrogates: 13C-2378-TCDF 84 64 74 82 13C-2378-TCDD 82 65 74 83 13C-12378-PeCDF 82 63 79 84 13C-23478-PeCDF 83 63 76 81 13C-12378-PeCDD 95 66 89 91 13C-123478-HxCDF 86 71 79 94 13C-123678-HxCDF 90 72 85 91 13C-234678-HxCDF 88 68 78 93 13C-123789-HxCDF 84 66 81 88 13C-123478-HxCDD 89 74 80 85 13C-123678-HxCDD 95 76 91 102 13C-1234678-HpCDF 84 66 76 88 13C-1234789-HpCDF 81 61 78 83 13C-1234678-HpCDD 90 68 81 89 13C-OCDD 83 66 74 86 ________________________________________________________ ND - none detected (detection limits in adjacent column) NDR - none detected based on peak ratio NDS - none detected based on peak shape

50
Appendix D Aliphatic hydrocarbon data in sediment samples collected from the Choctawhatchee Bay,
2002.
51
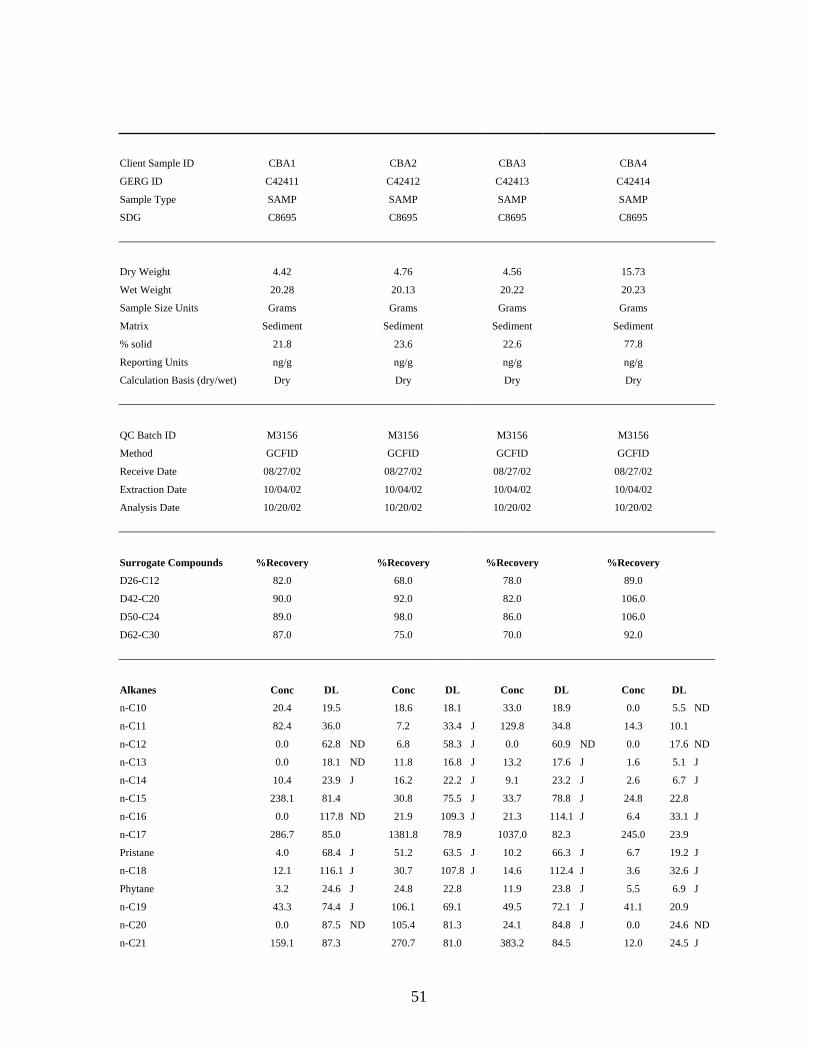
Client Sample ID CBA1 CBA2 CBA3 CBA4
GERG ID C42411 C42412 C42413 C42414
Sample Type SAMP SAMP SAMP SAMP
SDG C8695 C8695 C8695 C8695
Dry Weight 4.42 4.76 4.56 15.73
Wet Weight 20.28 20.13 20.22 20.23
Sample Size Units Grams Grams Grams Grams
Matrix Sediment Sediment Sediment Sediment
% solid 21.8 23.6 22.6 77.8
Reporting Units ng/g ng/g ng/g ng/g
Calculation Basis (dry/wet) Dry Dry Dry Dry
QC Batch ID M3156 M3156 M3156 M3156
Method GCFID GCFID GCFID GCFID
Receive Date 08/27/02 08/27/02 08/27/02 08/27/02
Extraction Date 10/04/02 10/04/02 10/04/02 10/04/02
Analysis Date 10/20/02 10/20/02 10/20/02 10/20/02
Surrogate Compounds %Recovery %Recovery %Recovery %Recovery
D26-C12 82.0 68.0 78.0 89.0
D42-C20 90.0 92.0 82.0 106.0
D50-C24 89.0 98.0 86.0 106.0
D62-C30 87.0 75.0 70.0 92.0
Alkanes Conc DL Conc DL Conc DL Conc DL
n-C10 20.4 19.5 18.6 18.1 33.0 18.9 0.0 5.5 ND
n-C11 82.4 36.0 7.2 33.4 J 129.8 34.8 14.3 10.1
n-C12 0.0 62.8 ND 6.8 58.3 J 0.0 60.9 ND 0.0 17.6 ND
n-C13 0.0 18.1 ND 11.8 16.8 J 13.2 17.6 J 1.6 5.1 J
n-C14 10.4 23.9 J 16.2 22.2 J 9.1 23.2 J 2.6 6.7 J
n-C15 238.1 81.4 30.8 75.5 J 33.7 78.8 J 24.8 22.8
n-C16 0.0 117.8 ND 21.9 109.3 J 21.3 114.1 J 6.4 33.1 J
n-C17 286.7 85.0 1381.8 78.9 1037.0 82.3 245.0 23.9
Pristane 4.0 68.4 J 51.2 63.5 J 10.2 66.3 J 6.7 19.2 J
n-C18 12.1 116.1 J 30.7 107.8 J 14.6 112.4 J 3.6 32.6 J
Phytane 3.2 24.6 J 24.8 22.8 11.9 23.8 J 5.5 6.9 J
n-C19 43.3 74.4 J 106.1 69.1 49.5 72.1 J 41.1 20.9
n-C20 0.0 87.5 ND 105.4 81.3 24.1 84.8 J 0.0 24.6 ND
n-C21 159.1 87.3 270.7 81.0 383.2 84.5 12.0 24.5 J

52
n-C22 78.4 64.1 113.7 59.5 87.6 62.1 9.0 18.0 J
n-C23 243.1 50.5 287.6 46.8 201.8 48.9 42.4 14.2
n-C24 246.8 85.3 300.0 79.2 175.3 82.6 24.5 23.9
n-C25 697.3 32.1 2895.1 29.8 2280.8 31.1 45.8 9.0
n-C26 321.1 29.2 399.7 27.1 360.0 28.3 82.3 8.2
n-C27 1154.8 22.2 1131.4 20.7 657.4 21.5 130.3 6.2
n-C28 411.0 67.8 274.5 63.0 174.9 65.7 37.1 19.0
n-C29 3910.9 29.6 3204.6 27.5 1645.4 28.6 438.6 8.3
n-C30 664.1 88.2 394.4 81.9 479.2 85.4 76.2 24.8
n-C31 2449.5 34.4 2380.8 32.0 1277.6 33.4 281.0 9.7
n-C32 126.1 72.8 227.8 67.6 152.6 70.5 373.8 20.4
n-C33 740.3 16.4 941.1 15.3 606.1 15.9 217.8 4.6
n-C34 934.0 89.7 1525.0 83.3 355.2 86.9 230.2 25.2
Total Alkanes 12836.8 16159.6 10224.4 2352.2
Reporting Units ug/g ug/g ug/g ug/g
Total Resolved 44.01 17.1 51.83 15.8 34.35 16.5 10.70 4.8
Total TPH 101.60 385.52 278.30 120.34
Total UCM 57.59 333.69 243.95 109.64
ND Not Detected J <MDL NA Not Applicable Q Results Outside QC I Interference B Blank Contamination >3xMDL D Dilution

53
Client Sample ID CBA5 CBA6 CBA7 CBA8
GERG ID C42415 C42416 C42417 C42418
Sample Type SAMP SAMP SAMP SAMP
SDG C8695 C8695 C8695 C8695
Dry Weight 12.80 14.26 5.60 1.65
Wet Weight 20.27 20.03 20.22 20.25
Sample Size Units Grams Grams Grams Grams
Matrix Sediment Sediment Sediment Sediment
% solid 63.2 71.2 27.7 8.1
Reporting Units ng/g ng/g ng/g ng/g
Calculation Basis (dry/wet) Dry Dry Dry Dry
QC Batch ID M3156 M3156 M3156 M3156
Method GCFID GCFID GCFID GCFID
Receive Date 08/27/02 08/27/02 08/27/02 08/27/02
Extraction Date 10/04/02 10/04/02 10/04/02 10/04/02
Analysis Date 10/20/02 10/20/02 10/21/02 10/21/02
Surrogate Compounds %Recovery %Recovery %Recovery %Recovery
D26-C12 70.0 73.0 74.0 57.0
D42-C20 74.0 80.0 82.0 63.0
D50-C24 75.0 78.0 83.0 73.0
D62-C30 75.0 95.0 74.0 38.0 Q
Alkanes Conc DL Conc DL Conc DL Conc DL
n-C10 11.0 6.7 0.0 6.1 ND 0.0 15.4 ND 0.0 52.4 ND
n-C11 39.2 12.4 0.0 11.1 ND 0.0 28.4 ND 34.5 96.5 J
n-C12 0.0 21.7 ND 0.0 19.5 ND 0.0 49.6 ND 0.0 168.6 ND
n-C13 1.3 6.3 J 0.0 5.6 ND 0.0 14.3 ND 0.0 48.7 ND
n-C14 2.2 8.3 J 2.5 7.4 J 8.1 18.9 J 0.0 64.2 ND
n-C15 9.1 28.1 J 33.2 25.2 35.3 64.2 J 0.0 218.3 ND
n-C16 6.6 40.6 J 5.9 36.5 J 16.9 93.0 J 80.5 316.0 J
n-C17 164.7 29.3 87.7 26.3 461.3 67.1 2411.3 228.0
Pristane 3.5 23.6 J 1.7 21.2 J 11.2 54.0 J 115.7 183.6 J
n-C18 3.3 40.1 J 2.6 36.0 J 20.1 91.6 J 302.2 311.5 J
Phytane 2.1 8.5 J 2.5 7.6 J 8.5 19.4 J 218.2 66.0
n-C19 7.0 25.7 J 4.7 23.1 J 48.6 58.7 J 2700.2 199.6
n-C20 3.9 30.2 J 3.4 27.1 J 21.8 69.1 J 665.7 234.9
n-C21 56.4 30.1 32.4 27.0 324.5 68.9 1921.4 234.2

54
n-C22 14.5 22.1 J 9.7 19.9 J 68.4 50.6 1590.5 171.9
n-C23 23.4 17.4 14.5 15.6 J 194.8 39.8 4164.5 135.4
n-C24 16.1 29.4 J 12.2 26.4 J 176.6 67.3 3060.4 228.9
n-C25 33.0 11.1 20.7 10.0 394.1 25.4 11334.3 86.2
n-C26 51.6 10.1 25.9 9.1 409.0 23.1 5173.8 78.4
n-C27 87.2 7.7 55.0 6.9 782.3 17.6 42436.2 59.7
n-C28 29.1 23.4 17.0 21.0 J 327.4 53.5 11020.8 182.0
n-C29 205.2 10.2 119.3 9.2 2024.0 23.3 111996.5 79.4
n-C30 35.2 30.4 13.8 27.3 J 331.3 69.6 21874.3 236.7
n-C31 153.8 11.9 88.7 10.7 1511.0 27.2 43748.6 92.4
n-C32 21.3 25.1 J 9.1 22.6 J 162.8 57.5 3197.3 195.3
n-C33 2.0 5.7 J 57.7 5.1 643.5 13.0 8504.4 44.1
n-C34 35.8 30.9 20.7 27.8 J 355.7 70.8 47711.3 240.6
Total Alkanes 1018.0 640.7 8336.9 324262.4
Reporting Units ug/g ug/g ug/g ug/g
Total Resolved 4.70 5.9 3.30 5.3 24.70 13.5 1127.10 45.8
Total TPH 39.55 20.12 89.03 1774.12
Total UCM 34.85 16.82 64.33 647.02
ND Not Detected J <MDL NA Not Applicable Q Results Outside QC I Interference B Blank Contamination >3xMDL D Dilution

55
Client Sample ID CBA9 CBA10 CBA11 CBA12
GERG ID C42419 C42420 C42421 C42422
Sample Type SAMP SAMP SAMP SAMP
SDG C8695 C8695 C8695 C8695
Dry Weight 14.70 5.83 4.88 10.88
Wet Weight 20.07 20.21 20.05 20.01
Sample Size Units Grams Grams Grams Grams
Matrix Sediment Sediment Sediment Sediment
% solid 73.3 28.8 24.3 54.4
Reporting Units ng/g ng/g ng/g ng/g
Calculation Basis (dry/wet) Dry Dry Dry Dry
QC Batch ID M3156 M3156 M3156 M3156
Method GCFID GCFID GCFID GCFID
Receive Date 08/27/02 08/27/02 08/27/02 08/27/02
Extraction Date 10/04/02 10/04/02 10/04/02 10/04/02
Analysis Date 10/21/02 10/21/02 10/21/02 10/21/02
Surrogate Compounds %Recovery %Recovery %Recovery %Recovery
D26-C12 73.0 69.0 66.0 66.0
D42-C20 80.0 83.0 79.0 96.0
D50-C24 80.0 74.0 74.0 75.0
D62-C30 94.0 72.0 74.0 62.0
Alkanes Conc DL Conc DL Conc DL Conc DL
n-C10 0.0 5.9 ND 0.0 14.8 ND 0.0 17.7 ND 0.0 7.9 ND
n-C11 0.0 10.8 ND 0.0 27.3 ND 0.0 32.6 ND 1.6 14.6 J
n-C12 0.0 18.9 ND 0.0 47.6 ND 6.3 56.9 J 0.0 25.5 ND
n-C13 0.7 5.5 J 10.2 13.8 J 8.3 16.4 J 1.2 7.4 J
n-C14 2.8 7.2 J 8.8 18.1 J 12.4 21.7 J 2.2 9.7 J
n-C15 19.7 24.4 J 35.5 61.7 J 30.8 73.6 J 19.3 33.0 J
n-C16 5.5 35.4 J 0.0 89.2 ND 25.9 106.6 J 1.7 47.8 J
n-C17 23.5 25.5 J 581.2 64.4 272.0 76.9 58.4 34.5
Pristane 0.6 20.6 J 0.0 51.9 ND 3.8 61.9 J 0.9 27.8 J
n-C18 1.9 34.9 J 13.2 88.0 J 14.3 105.1 J 3.8 47.1 J
Phytane 2.3 7.4 J 21.2 18.6 10.7 22.3 J 5.3 10.0 J
n-C19 0.0 22.4 ND 44.1 56.4 J 37.3 67.3 J 12.6 30.2 J
n-C20 5.0 26.3 J 24.8 66.3 J 26.7 79.2 J 0.0 35.5 ND
n-C21 6.0 26.2 J 181.3 66.1 105.9 79.0 37.9 35.4

56
n-C22 3.6 19.3 J 101.3 48.6 99.4 58.0 25.5 26.0 J
n-C23 6.9 15.2 J 456.8 38.2 266.9 45.7 81.9 20.5
n-C24 13.6 25.6 J 401.7 64.6 206.6 77.2 69.6 34.6
n-C25 7.7 9.7 J 1155.8 24.3 684.0 29.1 157.1 13.0
n-C26 11.6 8.8 450.3 22.2 406.5 26.5 95.0 11.9
n-C27 19.4 6.7 1850.7 16.9 1003.8 20.1 291.2 9.0
n-C28 34.2 20.4 686.0 51.4 497.0 61.4 112.4 27.5
n-C29 66.1 8.9 5282.5 22.4 3108.6 26.8 1304.2 12.0
n-C30 25.6 26.5 J 783.7 66.8 557.3 79.8 160.3 35.8
n-C31 34.2 10.3 3868.4 26.1 2361.6 31.2 896.6 14.0
n-C32 1.4 21.9 J 353.7 55.2 282.4 65.9 50.7 29.5
n-C33 11.5 4.9 1237.5 12.5 1030.5 14.9 299.9 6.7
n-C34 0.0 26.9 ND 741.1 68.0 291.5 81.1 291.1 36.4
Total Alkanes 303.6 18289.8 11350.5 3980.2
Reporting Units ug/g ug/g ug/g ug/g
Total Resolved 2.51 5.1 57.03 12.9 31.96 15.4 12.51 6.9
Total TPH 13.58 160.80 102.66 33.30
Total UCM 11.07 103.77 70.70 20.79
ND Not Detected J <MDL NA Not Applicable Q Results Outside QC I Interference B Blank Contamination >3xMDL D Dilution

57
Alkanes Conc DL
Client Sample ID CBA13 n-C10 1.2 6.1 J
GERG ID C42423 n-C11 1.5 11.3 J
Sample Type SAMP n-C12 0.0 19.7 ND
SDG C8695 n-C13 2.6 5.7 J
n-C14 2.6 7.5 J
n-C15 20.7 25.5 J
Dry Weight 14.12 n-C16 7.7 36.9 J
Wet Weight 20.08 n-C17 179.3 26.6
Sample Size Units Grams Pristane 1.0 21.4 J
Matrix Sediment n-C18 5.5 36.3 J
% solid 70.3 Phytane 8.7 7.7
Reporting Units ng/g n-C19 7.5 23.3 J
Calculation Basis (dry/wet) Dry n-C20 7.2 27.4 J
n-C21 40.7 27.3
n-C22 16.5 20.1 J
QC Batch ID M3156 n-C23 46.8 15.8
Method GCFID n-C24 35.7 26.7
Receive Date 08/27/02 n-C25 92.2 10.1
Extraction Date 10/04/02 n-C26 54.9 9.1
Analysis Date 10/21/02 n-C27 157.6 7.0
n-C28 73.8 21.2
n-C29 512.3 9.3
Surrogate Compounds %Recovery n-C30 75.3 27.6
D26-C12 72.0 n-C31 388.6 10.8
D42-C20 84.0 n-C32 35.3 22.8
D50-C24 77.0 n-C33 150.8 5.1
D62-C30 78.0 n-C34 78.8 28.1
Total Alkanes 2004.4
Reporting Units ug/g
Total Resolved 6.59 5.3
Total TPH 21.49
Total UCM 14.90 ND Not Detected
J <MDL NA Not Applicable Q Results Outside QC I Interference B Blank Contamination >3xMDL D Dilution

58
Appendix E Chlorophenoxy herbicide data in sediment samples collected from the Choctawhatchee Bay,
2002.

59
Client Sample ID CBA1 CBA2 CBA3 CBA4
GERG ID C42411 C42412 C42413 C42414
Sample Type SAMP SAMP SAMP SAMP
SDG C8695 C8695 C8695 C8695
Dry Weight 4.40 4.75 4.52 15.66
Wet Weight 20.21 20.10 20.06 20.14
Sample Size Units Grams Grams Grams Grams
Matrix Sediment Sediment Sediment Sediment
% solid 21.8 23.6 22.6 77.8
Reporting Units ng/g ng/g ng/g ng/g
Calculation Basis (dry/wet) Dry Dry Dry Dry
QC Batch ID M3157 M3157 M3157 M3157
Method GCMS GCECD GCECD GCECD
Receive Date 8/27/2002 8/27/2002 8/27/2002 8/27/2002
Extraction Date 10/8/2002 10/8/2002 10/8/2002 10/8/2002
Analysis Date 11/1/2002 10/18/2002 10/19/2002 10/19/2002
Pehnoxy Herbicides Conc DL Conc DL Conc DL Conc DL
Dicamba 320 227 13 210 J 9 221 J 11 64
2,4-D 370 227 38 210 24 221 0 64 ND
Dichlorprop 620 227 36 210 13 221 J 6 64 J
2,4-DB 260 454 55 421 35 442 J 33 128
2,4,5-T 50 227 1322 210 0 221 ND 0 64 ND
Silvex 190 227 112 210 15 221 J 0 64 ND
ND Not Detected J <MDL NA Not Applicable Q Results Outside QC I Interference B Blank Contamination >3xMDL d Dilution EC Exceeds Calibration

60
Client Sample ID CBA5 CBA6 CBA7 CBA8
GERG ID C42415 C42416 C42417 C42418
Sample Type SAMP SAMP SAMP SAMP
SDG C8695 C8695 C8695 C8695
Dry Weight 12.78 14.25 5.56 1.64
Wet Weight 20.23 20.02 20.07 20.16
Sample Size Units Grams Grams Grams Grams
Matrix Sediment Sediment Sediment Sediment
% solid 63.2 71.2 27.7 8.1
Reporting Units ng/g ng/g ng/g ng/g
Calculation Basis (dry/wet) Dry Dry Dry Dry
QC Batch ID M3157 M3157 M3157 M3157
Method GCECD GCECD GCECD GCECD
Receive Date 8/27/2002 8/27/2002 8/27/2002 8/27/2002
Extraction Date 10/8/2002 10/8/2002 10/8/2002 10/8/2002
Analysis Date 10/19/2002 10/19/2002 10/19/2002 10/19/2002
Pehnoxy Herbicides Conc DL Conc DL Conc DL Conc DL
Dicamba 0 78 ND 0 70 ND 14 180 J 451 610
2,4-D 0 78 ND 0 70 ND 22 180 714 610
Dichlorprop 6 78 J 0 70 ND 29 180 1049 610
2,4-DB 11 157 J 9 140 J 56 360 445 1220
2,4,5-T 0 78 ND 0 70 ND 5 180 J 744 610
Silvex 7 78 J 0 70 ND 76 180 1147 610
ND Not Detected J <MDL NA Not Applicable Q Results Outside QC I Interference B Blank Contamination >3xMDL d Dilution EC Exceeds Calibration

61
Client Sample ID CBA9 CBA10 CBA11
GERG ID C42419 C42420 C42421
Sample Type SAMP SAMP SAMP
SDG C8695 C8695 C8695
Dry Weight 14.72 5.81 4.91
Wet Weight 20.09 20.13 20.17
Sample Size Units Grams Grams Grams
Matrix Sediment Sediment Sediment
% solid 73.3 28.8 24.3
Reporting Units ng/g ng/g ng/g
Calculation Basis (dry/wet) Dry Dry Dry
QC Batch ID M3157 M3157 M3157
Method GCECD GCECD GCECD
Receive Date 8/27/2002 8/27/2002 8/27/2002
Extraction Date 10/8/2002 10/8/2002 10/8/2002
Analysis Date 10/19/2002 10/19/2002 10/19/2002
Pehnoxy Herbicides Conc DL Conc DL Conc DL
Dicamba 9 68 9 172 J 0 204 ND
2,4-D 0 68 ND 21 172 8 204 J
Dichlorprop 0 68 ND 31 172 6 204 J
2,4-DB 21 136 95 344 0 407 ND
2,4,5-T 0 68 ND 0 172 ND 0 204 ND
Silvex 0 68 ND 79 172 20 204
ND Not Detected J <MDL NA Not Applicable Q Results Outside QC I Interference B Blank Contamination >3xMDL d Dilution EC Exceeds Calibration

62
Client Sample ID CBA12 CBA13
GERG ID C42422 C42423
Sample Type SAMP SAMP
SDG C8695 C8695
Dry Weight 10.88 14.09
Wet Weight 20.01 20.05
Sample Size Units Grams Grams
Matrix Sediment Sediment
% solid 54.4 70.3
Reporting Units ng/g ng/g
Calculation Basis (dry/wet) Dry Dry
QC Batch ID M3157 M3157
Method GCECD GCECD
Receive Date 8/27/2002 8/27/2002
Extraction Date 10/8/2002 10/8/2002
Analysis Date 10/19/2002 10/19/2002
Pehnoxy Herbicides Conc DL Conc DL
Dicamba 0 92 ND 0 71 ND
2,4-D 6 92 J 0 71 ND
Dichlorprop 12 92 10 71
2,4-DB 45 184 18 142
2,4,5-T 0 92 ND 0 71 ND
Silvex 27 92 13 71
ND Not Detected J <MDL NA Not Applicable Q Results Outside QC I Interference B Blank Contamination >3xMDL d Dilution EC Exceeds Calibration

63
Appendix F Pesticide and PCB data in sediment samples collected from the Choctawhatchee Bay, 2002.

64
Client Sample ID CBA1 CBA2 CBA3 CBA4
GERG ID C42411 C42412 C42413 C42414
Sample Type SAMP SAMP SAMP SAMP
SDG C8695 C8695 C8695 C8695
Dry Weight 4.42 4.76 4.56 15.73
Wet Weight 20.28 20.13 20.22 20.23
Sample Size Units Grams Grams Grams Grams
Matrix Sediment Sediment Sediment Sediment
% solid 21.8 23.6 22.6 77.8
Reporting Units ng/g ng/g ng/g ng/g
Calculation Basis (dry/wet) Dry Dry Dry Dry
QC Batch ID M3156 M3156 M3156 M3156
Method GCECD GCECD GCECD GCECD
Receive Date 8/27/2002 8/27/2002 8/27/2002 8/27/2002
Extraction Date 10/4/2002 10/4/2002 10/4/2002 10/4/2002
Analysis Date 10/18/2002 10/18/2002 10/19/2002 10/19/2002
Surrogate Compounds % Recov % Recov % Recov % Recov
DBOFB 98.0 87.1 94.9 98.6
PCB103* 101.4 86.1 92.3 94.0
PCB198 93.9 78.8 83.1 89.2
Totals Conc Conc Conc Conc
Total PCBs 10.61 221.63 34.43 23.60
Total PCBs (SandT) 5.06 166.83 24.79 11.02
Pesticides Conc DL Conc DL Conc DL Conc DL
Chlorinated Benzenes
Tetrachlorobenzene 1,2,4,5 1.96 0.4 2.16 0.4 2.77 0.4 0.64 0.1
Tetrachlorobenzene 1,2,3,4 0.05 0.6 J 0.04 0.6 J 0.02 0.6 J 0.01 0.2 J
Pentachlorobenzene 0.25 0.3 J 0.25 0.3 J 0.30 0.3 J 0.11 0.1
Hexachlorobenzene 0.00 0.2 ND 0.00 0.2 ND 0.00 0.2 ND 0.11 0.0
Hexachlorocyclohexanes
Alpha HCH 0.04 0.2 J 0.39 0.1 0.29 0.2 0.02 0.0 J
Beta HCH 0.00 0.6 ND 0.00 0.6 ND 0.00 0.6 ND 0.00 0.2 ND
Gamma HCH 0.13 0.4 J 0.44 0.4 0.28 0.4 J 0.04 0.1 J
Delta HCH 0.00 0.2 ND 0.06 0.2 J 0.14 0.2 J 0.00 0.1 J

65
Chlordane-related Compounds
Heptachlor 0.00 0.5 ND 0.20 0.5 J 0.08 0.5 J 0.02 0.1 J
Heptachlor Epoxide 0.00 0.2 ND 0.26 0.2 0.03 0.2 J 0.04 0.0 J
Oxychlordane 0.00 0.2 ND 0.04 0.2 J 0.00 0.2 ND 0.08 0.0
Alpha Chlordane 0.07 0.4 J 1.22 0.3 0.79 0.3 0.46 0.1
Gamma Chlordane 0.05 0.1 J 1.33 0.1 0.54 0.1 0.77 0.0
Cis-Nonachlor 0.02 0.2 J 0.46 0.2 0.10 0.2 J 0.25 0.1
Trans-Nonachlor 0.00 0.3 ND 0.46 0.3 0.25 0.3 J 0.44 0.1
Other Cyclodiene Pesticides
Aldrin 0.00 0.2 ND 0.00 0.2 ND 0.00 0.2 ND 0.00 0.1 ND
Dieldrin 0.00 0.1 ND 0.35 0.1 0.03 0.1 J 0.01 0.0 J
Endrin 0.00 0.2 ND 0.20 0.2 J 0.48 0.2 0.08 0.1
Pesticides Conc DL Conc DL Conc DL Conc DL
Other Chlorinated Pesticides
Pentachloroanisole 0.21 0.4 J 0.18 0.3 J 0.11 0.3 J 0.02 0.1 J
Chlorpyrifos 0.11 0.4 J 0.16 0.3 J 0.44 0.4 0.39 0.1
Mirex 0.00 0.3 ND 0.59 0.3 0.08 0.3 J 0.21 0.1
Endosulfan II 0.03 0.5 J 0.95 0.4 0.77 0.5 0.59 0.1
DDTs and Related Compounds
2,4' DDE 0.28 0.2 0.65 0.2 1.48 0.2 0.01 0.1 J
4,4' DDE 4.92 0.1 29.21 0.1 20.34 0.1 0.55 0.0
2,4' DDD 0.21 0.5 J 3.40 0.4 0.44 0.5 J 0.04 0.1 J
4,4' DDD 0.52 0.2 7.67 0.1 2.08 0.2 0.29 0.0
2,4' DDT 0.03 0.2 J 0.36 0.2 0.09 0.2 J 0.01 0.1 J
4,4' DDT 0.17 0.5 J 1.89 0.5 0.81 0.5 0.32 0.1
Individual PCBs Conc DL Conc DL Conc DL Conc DL PCB1* 1.26 1.3 J 1.22 1.2 J 0.92 1.3 J 0.68 0.4
PCB7/9* 0.00 1.3 ND 0.41 1.2 J 0.00 1.3 ND 0.00 0.4 ND
PCB8/5 0.40 0.6 J 2.69 0.5 0.84 0.5 0.12 0.2 J
PCB30* 0.00 1.3 ND 0.32 1.2 J 0.07 1.3 J 0.02 0.4 J
PCB18/17 0.18 0.3 J 1.91 0.3 0.40 0.3 0.09 0.1
PCB15* 0.10 1.3 J 2.50 1.2 0.44 1.3 J 0.09 0.4 J
PCB24/27* 0.00 1.3 ND 0.30 1.2 J 0.00 1.3 ND 0.00 0.4 J
PCB16/32* 1.12 1.3 J 2.04 1.2 1.07 1.3 J 0.32 0.4 J
PCB29 0.00 0.3 ND 0.05 0.3 J 0.00 0.3 ND 0.01 0.1 J
PCB26* 0.00 1.3 ND 1.52 1.2 0.00 1.3 ND 0.00 0.4 ND
PCB25* 0.00 1.3 ND 1.16 1.2 J 0.00 1.3 ND 0.25 0.4 J
PCB31* 0.75 1.3 J 0.27 1.2 J 0.07 1.3 J 0.05 0.4 J
PCB28 0.08 0.9 J 9.12 0.8 3.21 0.9 0.31 0.3
PCB33/20* 0.10 1.3 J 2.30 1.2 0.33 1.3 J 0.09 0.4 J
PCB53* 0.00 1.3 ND 0.90 1.2 J 0.10 1.3 J 0.00 0.4 ND
PCB22/51* 0.00 1.3 ND 0.66 1.2 J 0.01 1.3 J 0.01 0.4 J
PCB45* 0.00 1.3 ND 0.94 1.2 J 0.00 1.3 ND 0.00 0.4 ND
PCB46 * 0.13 1.3 J 0.72 1.2 J 0.32 1.3 J 0.00 0.4 ND
PCB39* 0.00 1.3 ND 0.00 1.2 ND 0.00 1.3 ND 0.00 0.4 ND

66
PCB69* 0.06 1.3 J 0.00 1.2 ND 0.00 1.3 ND 0.00 0.4 ND
PCB52 0.20 0.3 J 10.60 0.3 0.73 0.3 1.68 0.1
PCB49* 0.10 1.3 J 8.59 1.2 1.09 1.3 J 0.11 0.4 J
PCB47/75* 0.08 1.3 J 3.55 1.2 0.64 1.3 J 0.06 0.4 J
PCB48* 0.00 1.3 ND 1.79 1.2 0.00 1.3 ND 3.22 0.4
PCB44 0.13 0.5 J 6.94 0.4 0.26 0.4 J 0.10 0.1 J
PCB42/59/37* 0.00 1.3 ND 4.21 1.2 0.35 1.3 J 0.00 0.4 ND
PCB72* 0.00 1.3 ND 0.18 1.2 J 0.00 1.3 ND 0.02 0.4 J
PCB41/64* 27.21 1.3 I 9.36 1.2 I 15.86 1.3 I 8.99 0.4 I
PCB40* 0.01 1.3 J 1.68 1.2 0.27 1.3 J 0.14 0.4 J
PCB67* 0.00 1.3 ND 0.38 1.2 J 0.00 1.3 ND 0.00 0.4 ND
PCB63* 0.15 1.3 J 0.00 1.2 ND 0.29 1.3 J 0.00 0.4 ND
PCB74/61* 0.46 1.3 J 5.02 1.2 0.17 1.3 J 0.06 0.4 J
PCB70* 0.00 1.3 ND 7.98 1.2 0.17 1.3 J 0.09 0.4 J
PCB66 0.05 0.2 J 8.74 0.2 0.38 0.2 0.09 0.1
PCB95/80* 0.08 1.3 J 6.83 1.2 0.63 1.3 J 0.08 0.4 J
PCB55/91* 0.00 1.3 ND 3.69 1.2 0.67 1.3 J 0.30 0.4 J
PCB56/60* 0.18 1.3 J 6.77 1.2 0.25 1.3 J 0.25 0.4 J
PCB92* 0.00 1.3 ND 1.44 1.2 0.06 1.3 J 0.12 0.4 J
Individual PCBs Conc DL Conc DL Conc DL Conc DL PCB84* 0.00 1.3 ND 3.15 1.2 0.00 1.3 ND 0.03 0.4 J
PCB101/90 0.18 1.4 J 8.86 1.3 1.44 1.4 0.11 0.4 J
PCB99* 0.18 1.3 J 6.14 1.2 1.15 1.3 J 0.08 0.4 J
PCB119* 0.00 1.3 ND 0.33 1.2 J 0.08 1.3 J 0.10 0.4 J
PCB83* 1.06 1.3 J 0.25 1.2 J 0.13 1.3 J 0.00 0.4 ND
PCB97* 0.00 1.3 ND 4.74 1.2 0.21 1.3 J 0.03 0.4 J
PCB81* 0.00 1.3 ND 0.76 1.2 J 0.80 1.3 J 0.72 0.4
PCB87/115 0.00 0.2 ND 2.75 0.2 0.12 0.2 J 0.04 0.1 J
PCB85* 0.03 1.3 J 0.60 1.2 J 0.03 1.3 J 0.01 0.4 J
PCB136* 0.08 1.3 J 1.18 1.2 J 0.31 1.3 J 0.32 0.4 J
PCB110/77 0.20 0.9 J 10.90 0.9 1.00 0.9 0.68 0.3
PCB82* 0.00 1.3 ND 1.64 1.2 0.16 1.3 J 0.01 0.4 J
PCB151* 0.00 1.3 ND 1.42 1.2 0.13 1.3 J 0.02 0.4 J
PCB135* 0.00 1.3 ND 0.92 1.2 J 0.14 1.3 J 0.01 0.4 J
PCB107* 0.00 1.3 ND 2.64 1.2 0.45 1.3 J 0.27 0.4 J
PCB149/123* 0.06 1.3 J 3.93 1.2 0.64 1.3 J 0.09 0.4 J
PCB118 0.02 1.2 J 7.52 1.1 0.55 1.2 J 0.16 0.3 J
PCB114* 0.00 1.3 ND 0.00 1.2 ND 0.00 1.3 ND 0.00 0.4 ND
PCB146* 0.00 1.3 ND 1.01 1.2 J 0.15 1.3 J 0.02 0.4 J
PCB153/132 0.26 4.5 J 7.00 4.1 1.48 4.3 J 0.25 1.3 J
PCB105 0.06 1.8 J 3.87 1.7 0.20 1.8 J 0.07 0.5 J
PCB141/179* 0.00 1.3 ND 1.24 1.2 0.34 1.3 J 0.23 0.4 J
PCB130* 0.00 1.3 ND 3.28 1.2 1.32 1.3 0.89 0.4
PCB176/137* 0.11 1.3 J 1.80 1.2 0.68 1.3 J 0.89 0.4
PCB138 /160 0.21 4.2 J 6.65 3.9 1.09 4.1 J 0.29 1.2 J
PCB158* 0.00 1.3 ND 0.79 1.2 J 0.20 1.3 J 0.03 0.4 J
PCB129* 0.00 1.3 ND 0.00 1.2 ND 0.00 1.3 ND 0.00 0.4 ND

67
PCB126* 0.38 1.3 J 0.00 1.2 ND 0.00 1.3 ND 0.00 0.4 ND
PCB178* 0.09 1.3 J 1.69 1.2 0.82 1.3 J 1.18 0.4
PCB166* 0.00 1.3 ND 0.23 1.2 J 0.02 1.3 J 0.04 0.4 J
PCB175* 0.11 1.3 J 0.36 1.2 J 0.27 1.3 J 0.43 0.4
PCB187 0.16 2.6 J 3.19 2.4 0.91 2.5 J 1.90 0.7
PCB183 * 0.00 1.3 ND 0.71 1.2 J 0.12 1.3 J 0.00 0.4 ND
PCB128 0.04 0.4 J 1.16 0.4 0.16 0.4 J 0.06 0.1 J
PCB167* 0.12 1.3 J 0.94 1.2 J 0.39 1.3 J 0.51 0.4
PCB185 * 0.16 1.3 J 1.04 1.2 J 0.50 1.3 J 0.92 0.4
PCB174* 0.00 1.3 ND 1.38 1.2 0.00 1.3 ND 0.00 0.4 ND
PCB177* 0.00 1.3 ND 0.00 1.2 ND 0.00 1.3 ND 0.00 0.4 ND
PCB171/202* 0.07 1.3 J 1.11 1.2 J 0.19 1.3 J 0.18 0.4 J
PCB156* 0.20 1.3 J 3.70 1.2 0.92 1.3 J 0.97 0.4
PCB201/157/173* 0.00 1.3 ND 0.54 1.2 J 0.00 1.3 ND 0.09 0.4 J
PCB172* 0.10 0.2 J 1.27 0.2 0.48 0.2 0.56 0.0
PCB197* 0.16 1.3 J 1.38 1.2 0.67 1.3 J 0.62 0.4
PCB180 0.12 5.1 J 3.51 4.8 J 0.51 5.0 J 0.14 1.4 J
PCB193* 0.05 1.3 J 0.18 1.2 J 0.07 1.3 J 0.03 0.4 J
PCB191* 0.00 1.3 ND 0.00 1.2 ND 0.00 1.3 ND 0.38 0.4
PCB200* 0.00 1.3 ND 0.12 1.2 J 0.00 1.3 ND 0.05 0.4 J
PCB169* 0.00 1.3 ND 0.00 1.2 ND 0.00 1.3 ND 0.00 0.4 ND
PCB170/190 1.30 2.8 I 11.93 2.6 I 9.95 2.7 I 20.10 0.8 I
PCB199* 0.12 1.3 J 2.00 1.2 0.51 1.3 J 0.21 0.4 J
PCB203/196* 0.13 1.3 J 1.57 1.2 0.26 1.3 J 0.27 0.4 J
Individual PCBs Conc DL Conc DL Conc DL Conc DL PCB189* 0.00 1.3 ND 0.32 1.2 J 0.05 1.3 J 0.03 0.4 J
PCB195/208 0.11 0.4 J 0.67 0.4 0.00 0.4 ND 0.00 0.1 ND
PCB207* 0.00 1.3 ND 0.00 1.2 ND 0.00 1.3 ND 0.00 0.4 ND
PCB194* 0.08 1.3 J 2.77 1.2 0.80 1.3 J 1.19 0.4
PCB205 * 0.00 1.3 ND 0.00 1.2 ND 0.00 1.3 ND 0.00 0.4 ND
PCB206 0.14 0.2 J 0.56 0.2 0.07 0.2 J 0.02 0.1 J
PCB209 0.18 0.2 J 0.40 0.2 0.16 0.2 J 0.11 0.1
Totals by Chlorination Level
CL1 1.26 1.22 0.92 0.68
CL2 0.49 5.61 1.28 0.20
CL3 2.22 19.65 5.15 1.17
CL4 1.57 73.44 6.49 6.84
CL5 2.19 61.67 6.20 1.77
CL6 0.97 33.46 7.31 3.73
CL7 0.97 16.57 4.60 6.63
CL8 0.60 9.06 2.24 2.43
CL9 0.14 0.56 0.07 0.02
CL10 0.18 0.40 0.16 0.11
Total PCBs 10.61 221.63 34.43 23.60

68
Client Sample ID CBA5 CBA6 CBA7 CBA8
GERG ID C42415 C42416 C42417 C42418
Sample Type SAMP SAMP SAMP SAMP
SDG C8695 C8695 C8695 C8695
Dry Weight 12.80 14.26 5.60 1.65
Wet Weight 20.27 20.03 20.22 20.25
Sample Size Units Grams Grams Grams Grams
Matrix Sediment Sediment Sediment Sediment
% solid 63.2 71.2 27.7 8.1
Reporting Units ng/g ng/g ng/g ng/g
Calculation Basis (dry/wet) Dry Dry Dry Dry
QC Batch ID M3156 M3156 M3156 M3156
Method GCECD GCECD GCECD GCECD
Receive Date 8/27/2002 8/27/2002 8/27/2002 8/27/2002
Extraction Date 10/4/2002 10/4/2002 10/4/2002 10/4/2002
Analysis Date 10/19/2002 10/19/2002 10/19/2002 10/19/2002
Surrogate Compounds % Recov % Recov % Recov % Recov
DBOFB 92.8 87.7 90.3 93.6
PCB103* 96.3 94.9 91.6 104.0
PCB198 87.3 90.0 87.2 89.8
Totals Conc Conc Conc Conc
Total PCBs 1.57 1.19 11.23 103.75
Total PCBs (SandT) 1.35 0.67 5.57 34.78
Pesticides Conc DL Conc DL Conc DL Conc
Chlorinated Benzenes
Tetrachlorobenzene 1,2,4,5 0.74 0.1 0.57 0.1 1.67 0.3 3.85
Tetrachlorobenzene 1,2,3,4 0.01 0.2 J 0.00 0.2 ND 0.02 0.5 J 0.11 J
Pentachlorobenzene 0.06 0.1 J 0.07 0.1 J 0.24 0.3 J 0.00 ND
Hexachlorobenzene 0.00 0.1 ND 0.00 0.1 ND 0.00 0.1 ND 0.00 ND
Hexachlorocyclohexanes
Alpha HCH 0.01 0.1 J 0.02 0.0 J 0.04 0.1 J 0.62
Beta HCH 0.00 0.2 ND 0.00 0.2 ND 0.02 0.5 J 0.11 J
Gamma HCH 0.02 0.2 J 0.01 0.1 J 0.11 0.4 J 0.32 J
Delta HCH 0.00 0.1 J 0.00 0.1 J 0.01 0.2 J 0.12 J
Chlordane-related Compounds

69
Heptachlor 0.00 0.2 J 0.02 0.2 J 0.00 0.4 ND 1.83
Heptachlor Epoxide 0.00 0.1 ND 0.00 0.1 ND 0.00 0.1 ND 0.39 J
Oxychlordane 0.00 0.1 ND 0.00 0.1 ND 0.00 0.1 ND 0.34 J
Alpha Chlordane 0.02 0.1 J 0.03 0.1 J 0.42 0.3 16.13
Gamma Chlordane 0.02 0.0 J 0.01 0.0 J 0.03 0.1 J 12.81
Cis-Nonachlor 0.01 0.1 J 0.01 0.1 J 0.03 0.2 J 6.87
Trans-Nonachlor 0.01 0.1 J 0.00 0.1 ND 0.01 0.2 J 12.45
Other Cyclodiene Pesticides
Aldrin 0.00 0.1 ND 0.00 0.1 J 0.01 0.2 J 0.09 J
Dieldrin 0.00 0.0 ND 0.01 0.0 J 0.01 0.1 J 0.05 J
Endrin 0.07 0.1 J 0.06 0.1 J 0.15 0.2 J 0.75
Pesticides Conc DL Conc DL Conc DL Conc
Other Chlorinated Pesticides
Pentachloroanisole 0.02 0.1 J 0.01 0.1 J 0.07 0.3 J 2.34
Chlorpyrifos 0.04 0.1 J 0.03 0.1 J 0.08 0.3 J 0.68 J
Mirex 0.00 0.1 ND 0.00 0.1 ND 0.00 0.2 ND 0.36 J
Endosulfan II 0.00 0.2 ND 0.00 0.1 J 0.00 0.4 ND 0.38 J
DDTs and Related Compounds
2,4' DDE 0.07 0.1 J 0.00 0.1 J 0.11 0.2 J 0.37 J
4,4' DDE 0.16 0.0 0.07 0.0 1.50 0.1 17.97
2,4' DDD 0.35 0.2 0.27 0.1 0.69 0.4 2.33
4,4' DDD 0.05 0.1 J 0.01 0.0 J 0.14 0.1 12.24
2,4' DDT 0.02 0.1 J 0.00 0.1 J 0.05 0.2 J 0.42 J
4,4' DDT 0.03 0.2 J 0.01 0.2 J 0.20 0.4 J 2.84
Individual PCBs Conc DL Conc DL Conc DL Conc PCB1* 0.00 0.5 ND 0.00 0.4 ND 0.39 1.1 J 4.12
PCB7/9* 0.00 0.5 ND 0.00 0.4 ND 0.00 1.1 ND 0.00 ND
PCB8/5 0.06 0.2 J 0.03 0.2 J 0.38 0.4 J 2.53
PCB30* 0.00 0.5 ND 0.00 0.4 J 0.02 1.1 J 0.17 J
PCB18/17 0.05 0.1 J 0.04 0.1 J 0.18 0.2 J 1.13
PCB15* 0.04 0.5 J 0.06 0.4 J 0.19 1.1 J 0.42 J
PCB24/27* 0.00 0.5 ND 0.00 0.4 ND 0.00 1.1 ND 0.00 ND
PCB16/32* 0.18 0.5 J 0.10 0.4 J 0.97 1.1 J 11.14
PCB29 0.00 0.1 ND 0.02 0.1 J 0.04 0.2 J 0.72 J
PCB26* 0.00 0.5 ND 0.01 0.4 J 0.00 1.1 ND 0.19 J
PCB25* 0.00 0.5 ND 0.02 0.4 J 0.03 1.1 J 2.71 J
PCB31* 0.02 0.5 J 0.14 0.4 J 2.31 1.1 10.69
PCB28 0.13 0.3 J 0.02 0.3 J 0.18 0.7 J 1.45 J
PCB33/20* 0.01 0.5 J 0.01 0.4 J 0.08 1.1 J 0.00 ND
PCB53* 0.02 0.5 J 0.02 0.4 J 0.06 1.1 J 0.41 J
PCB22/51* 0.00 0.5 ND 0.02 0.4 J 0.03 1.1 J 0.14 J
PCB45* 0.00 0.5 ND 0.00 0.4 ND 0.00 1.1 ND 0.00 ND
PCB46 * 0.00 0.5 ND 0.01 0.4 J 0.13 1.1 J 0.27 J
PCB39* 0.00 0.5 ND 0.00 0.4 ND 0.00 1.1 ND 0.00 ND
PCB69* 0.00 0.5 ND 0.00 0.4 ND 0.00 1.1 ND 0.75 J

70
PCB52 0.09 0.1 J 0.00 0.1 J 0.11 0.3 J 0.54 J
PCB49* 0.07 0.5 J 0.02 0.4 J 0.14 1.1 J 0.98 J
PCB47/75* 0.11 0.5 J 0.02 0.4 J 0.08 1.1 J 0.12 J
PCB48* 0.00 0.5 ND 0.00 0.4 ND 0.00 1.1 ND 0.00 ND
PCB44 0.00 0.2 ND 0.01 0.1 J 0.03 0.4 J 0.88 J
PCB42/59/37* 0.00 0.5 ND 0.01 0.4 J 0.05 1.1 J 0.00 ND
PCB72* 0.00 0.5 ND 0.00 0.4 ND 0.00 1.1 ND 1.40 J
PCB41/64* 0.27 0.5 I 0.64 0.4 I 14.42 1.1 I 153.43 I
PCB40* 0.00 0.5 J 0.00 0.4 J 0.01 1.1 J 0.13 J
PCB67* 0.00 0.5 ND 0.00 0.4 ND 0.00 1.1 ND 0.49 J
PCB63* 0.00 0.5 ND 0.00 0.4 ND 0.00 1.1 ND 1.42 J
PCB74/61* 0.03 0.5 J 0.00 0.4 ND 0.00 1.1 ND 7.82
PCB70* 0.00 0.5 ND 0.00 0.4 ND 0.00 1.1 ND 0.00 ND
PCB66 0.05 0.1 J 0.01 0.1 J 0.02 0.2 J 0.63
PCB95/80* 0.03 0.5 J 0.01 0.4 J 0.16 1.1 J 0.17 J
PCB55/91* 0.00 0.5 ND 0.00 0.4 ND 0.00 1.1 ND 4.24
PCB56/60* 0.00 0.5 ND 0.12 0.4 J 0.00 1.1 ND 0.57 J
PCB92* 0.00 0.5 ND 0.01 0.4 J 0.00 1.1 ND 6.60
Individual PCBs Conc DL Conc DL Conc DL Conc PCB84* 0.00 0.5 ND 0.01 0.4 J 0.00 1.1 ND 0.00 ND
PCB101/90 0.03 0.5 J 0.00 0.4 ND 0.05 1.1 J 0.93 J
PCB99* 0.06 0.5 J 0.04 0.4 J 0.15 1.1 J 1.77 J
PCB119* 0.00 0.5 ND 0.01 0.4 J 0.03 1.1 J 0.84 J
PCB83* 0.00 0.5 ND 0.02 0.4 J 0.53 1.1 J 0.90 J
PCB97* 0.00 0.5 ND 0.01 0.4 J 0.02 1.1 J 0.70 J
PCB81* 0.07 0.5 J 0.00 0.4 ND 0.21 1.1 J 0.74 J
PCB87/115 0.00 0.1 ND 0.01 0.1 J 0.01 0.2 J 0.16 J
PCB85* 0.00 0.5 J 0.00 0.4 J 0.01 1.1 J 0.10 J
PCB136* 0.00 0.5 J 0.01 0.4 J 0.04 1.1 J 0.27 J
PCB110/77 0.07 0.3 J 0.03 0.3 J 0.12 0.7 J 3.23
PCB82* 0.00 0.5 ND 0.00 0.4 ND 0.00 1.1 ND 0.00 ND
PCB151* 0.00 0.5 ND 0.00 0.4 ND 0.10 1.1 J 0.00 ND
PCB135* 0.00 0.5 ND 0.00 0.4 ND 0.07 1.1 J 0.02 J
PCB107* 0.05 0.5 J 0.01 0.4 J 0.29 1.1 J 0.00 ND
PCB149/123* 0.02 0.5 J 0.01 0.4 J 0.23 1.1 J 0.44 J
PCB118 0.02 0.4 J 0.01 0.4 J 0.03 1.0 J 2.19 J
PCB114* 0.00 0.5 ND 0.00 0.4 ND 0.00 1.1 ND 0.00 ND
PCB146* 0.02 0.5 J 0.01 0.4 J 0.06 1.1 J 0.14 J
PCB153/132 0.09 1.5 J 0.06 1.4 J 0.63 3.5 J 1.52 J
PCB105 0.01 0.6 J 0.00 0.6 J 0.08 1.5 J 0.54 J
PCB141/179* 0.00 0.5 ND 0.00 0.4 ND 0.15 1.1 J 1.07 J
PCB130* 0.02 0.5 J 0.00 0.4 J 0.10 1.1 J 0.53 J
PCB176/137* 0.00 0.5 ND 0.00 0.4 ND 0.20 1.1 J 0.91 J
PCB138 /160 0.09 1.5 J 0.09 1.3 J 0.43 3.3 J 1.66 J
PCB158* 0.00 0.5 ND 0.00 0.4 ND 0.00 1.1 ND 0.00 ND
PCB129* 0.00 0.5 ND 0.00 0.4 ND 0.00 1.1 ND 0.00 ND
PCB126* 0.02 0.5 J 0.00 0.4 ND 0.00 1.1 ND 1.69 J

71
PCB178* 0.00 0.5 ND 0.00 0.4 ND 0.05 1.1 J 0.15 J
PCB166* 0.00 0.5 ND 0.00 0.4 ND 0.00 1.1 ND 0.00 ND
PCB175* 0.06 0.5 J 0.07 0.4 J 0.11 1.1 J 0.07 J
PCB187 0.02 0.9 J 0.00 0.8 ND 0.17 2.1 J 0.61 J
PCB183 * 0.00 0.5 ND 0.00 0.4 ND 0.13 1.1 J 0.00 ND
PCB128 0.00 0.1 ND 0.00 0.1 ND 0.04 0.3 J 0.52 J
PCB167* 0.00 0.5 ND 0.00 0.4 ND 0.03 1.1 J 0.49 J
PCB185 * 0.00 0.5 ND 0.00 0.4 ND 0.10 1.1 J 1.48 J
PCB174* 0.00 0.5 ND 0.00 0.4 ND 0.07 1.1 J 0.10 J
PCB177* 0.00 0.5 ND 0.00 0.4 ND 0.14 1.1 J 4.11
PCB171/202* 0.00 0.5 ND 0.00 0.4 ND 0.04 1.1 J 0.96 J
PCB156* 0.00 0.5 ND 0.00 0.4 ND 0.37 1.1 J 0.67 J
PCB201/157/173* 0.00 0.5 ND 0.00 0.4 ND 0.00 1.1 ND 1.97 J
PCB172* 0.00 0.1 ND 0.00 0.1 ND 0.00 0.1 ND 0.59
PCB197* 0.00 0.5 ND 0.00 0.4 ND 0.00 1.1 ND 0.94 J
PCB180 0.03 1.8 J 0.02 1.6 J 0.30 4.0 J 0.69 J
PCB193* 0.00 0.5 ND 0.01 0.4 J 0.03 1.1 J 1.51 J
PCB191* 0.00 0.5 ND 0.00 0.4 ND 0.00 1.1 ND 0.41 J
PCB200* 0.00 0.5 ND 0.00 0.4 ND 0.00 1.1 ND 0.00 ND
PCB169* 0.00 0.5 ND 0.00 0.4 ND 0.00 1.1 ND 0.00 ND
PCB170/190 0.32 1.0 I 0.04 0.9 J 0.68 2.2 I 6.92 I
PCB199* 0.00 0.5 ND 0.02 0.4 J 0.22 1.1 J 2.69 J
PCB203/196* 0.00 0.5 ND 0.00 0.4 ND 0.12 1.1 J 0.37 J
Individual PCBs Conc DL Conc DL Conc DL Conc PCB189* 0.00 0.5 ND 0.00 0.4 ND 0.00 1.1 ND 0.00 ND
PCB195/208 0.00 0.1 ND 0.00 0.1 ND 0.09 0.3 J 0.44 J
PCB207* 0.00 0.5 ND 0.00 0.4 ND 0.00 1.1 ND 0.00 ND
PCB194* 0.00 0.5 ND 0.00 0.4 ND 0.00 1.1 ND 0.49 J
PCB205 * 0.00 0.5 ND 0.00 0.4 ND 0.00 1.1 ND 0.21 J
PCB206 0.00 0.1 ND 0.00 0.1 ND 0.04 0.2 J 0.85
PCB209 0.00 0.1 ND 0.00 0.1 ND 0.03 0.2 J 0.28 J
Totals by Chlorination Level
CL1 0.00 0.00 0.39 4.12
CL2 0.10 0.09 0.57 2.95
CL3 0.39 0.37 3.84 28.33
CL4 0.43 0.22 0.85 21.38
CL5 0.29 0.16 1.48 19.82
CL6 0.23 0.18 2.27 7.33
CL7 0.11 0.15 1.33 11.57
CL8 0.00 0.02 0.44 7.11
CL9 0.00 0.00 0.04 0.85
CL10 0.00 0.00 0.03 0.28
Total PCBs 1.57 1.19 11.23 103.75

72
Client Sample ID CBA9 CBA10 CBA11
GERG ID C42419 C42420 C42421
Sample Type SAMP SAMP SAMP
SDG C8695 C8695 C8695
Dry Weight 14.70 5.83 4.88
Wet Weight 20.07 20.21 20.05
Sample Size Units Grams Grams Grams
Matrix Sediment Sediment Sediment
% solid 73.3 28.8 24.3
Reporting Units ng/g ng/g ng/g
Calculation Basis (dry/wet) Dry Dry Dry
QC Batch ID M3156 M3156 M3156
Method GCECD GCECD GCECD
Receive Date 8/27/2002 8/27/2002 8/27/2002
Extraction Date 10/4/2002 10/4/2002 10/4/2002
Analysis Date 10/19/2002 10/19/2002 10/19/2002
Surrogate Compounds % Recov % Recov % Recov
DBOFB 79.5 88.3 96.1
PCB103* 87.0 91.2 100.7
PCB198 84.2 85.5 96.9
Totals Conc Conc Conc
Total PCBs 0.92 15.48 12.89
Total PCBs (SandT) 0.83 8.80 8.70
Pesticides Conc DL Conc DL Conc DL
Chlorinated Benzenes
Tetrachlorobenzene 1,2,4,5 0.58 0.1 1.42 0.3 1.70 0.4
Tetrachlorobenzene 1,2,3,4 0.00 0.2 ND 0.07 0.5 J 0.04 0.6 J
Pentachlorobenzene 0.05 0.1 J 0.21 0.2 J 0.15 0.3 J
Hexachlorobenzene 0.00 0.0 ND 0.00 0.1 ND 0.00 0.1 ND
Hexachlorocyclohexanes
Alpha HCH 0.01 0.0 J 0.05 0.1 J 0.04 0.1 J
Beta HCH 0.00 0.2 ND 0.00 0.5 ND 0.00 0.6 ND
Gamma HCH 0.01 0.1 J 0.26 0.3 J 0.13 0.4 J
Delta HCH 0.00 0.1 ND 0.06 0.2 J 0.08 0.2 J
Chlordane-related Compounds

73
Heptachlor 0.00 0.2 J 0.00 0.4 ND 0.00 0.5 ND
Heptachlor Epoxide 0.00 0.1 ND 0.00 0.1 ND 0.00 0.2 ND
Oxychlordane 0.00 0.0 ND 0.00 0.1 ND 0.00 0.1 ND
Alpha Chlordane 0.00 0.1 ND 0.03 0.3 J 0.06 0.3 J
Gamma Chlordane 0.01 0.0 J 0.03 0.1 J 0.02 0.1 J
Cis-Nonachlor 0.00 0.1 J 0.04 0.2 J 0.01 0.2 J
Trans-Nonachlor 0.00 0.1 ND 0.02 0.2 J 0.02 0.3 J
Other Cyclodiene Pesticides
Aldrin 0.00 0.1 ND 0.00 0.2 ND 0.00 0.2 ND
Dieldrin 0.00 0.0 ND 0.00 0.1 ND 0.00 0.1 ND
Endrin 0.05 0.1 J 0.20 0.2 0.12 0.2 J
Pesticides Conc DL Conc DL Conc DL
Other Chlorinated Pesticides
Pentachloroanisole 0.02 0.1 J 0.10 0.3 J 0.14 0.3 J
Chlorpyrifos 0.01 0.1 J 0.08 0.3 J 0.15 0.3 J
Mirex 0.00 0.1 ND 0.00 0.2 ND 0.00 0.3 ND
Endosulfan II 0.00 0.1 J 0.27 0.4 J 0.00 0.4 ND
DDTs and Related Compounds
2,4' DDE 0.01 0.1 J 0.02 0.2 J 0.03 0.2 J
4,4' DDE 0.10 0.0 1.67 0.1 1.53 0.1
2,4' DDD 0.29 0.1 1.00 0.4 0.90 0.4
4,4' DDD 0.03 0.0 J 0.36 0.1 0.12 0.1 J
2,4' DDT 0.00 0.1 J 0.02 0.2 J 0.02 0.2 J
4,4' DDT 0.01 0.1 J 0.17 0.4 J 0.18 0.4 J
Individual PCBs Conc DL Conc DL Conc DL PCB1* 0.00 0.4 ND 0.84 1.0 J 0.33 1.2 J
PCB7/9* 0.00 0.4 ND 0.00 1.0 ND 0.00 1.2 ND
PCB8/5 0.04 0.2 J 0.59 0.4 0.88 0.5
PCB30* 0.00 0.4 ND 0.00 1.0 ND 0.00 1.2 ND
PCB18/17 0.04 0.1 J 0.23 0.2 0.49 0.3
PCB15* 0.02 0.4 J 0.24 1.0 J 0.43 1.2 J
PCB24/27* 0.00 0.4 ND 0.00 1.0 ND 0.00 1.2 ND
PCB16/32* 0.13 0.4 J 1.25 1.0 1.86 1.2
PCB29 0.00 0.1 ND 0.04 0.2 J 0.00 0.3 ND
PCB26* 0.00 0.4 ND 0.00 1.0 ND 0.00 1.2 ND
PCB25* 0.01 0.4 J 0.00 1.0 ND 0.00 1.2 ND
PCB31* 0.05 0.4 J 3.56 1.0 1.71 1.2
PCB28 0.01 0.3 J 0.49 0.7 J 0.39 0.8 J
PCB33/20* 0.01 0.4 J 0.13 1.0 J 0.14 1.2 J
PCB53* 0.00 0.4 ND 0.00 1.0 ND 0.00 1.2 ND
PCB22/51* 0.01 0.4 J 0.00 1.0 ND 0.06 1.2 J
PCB45* 0.00 0.4 ND 0.00 1.0 ND 0.00 1.2 ND
PCB46 * 0.01 0.4 J 0.19 1.0 J 0.06 1.2 J
PCB39* 0.00 0.4 ND 0.00 1.0 ND 0.00 1.2 ND
PCB69* 0.00 0.4 ND 0.00 1.0 ND 0.00 1.2 ND

74
PCB52 0.02 0.1 J 0.24 0.2 0.32 0.3
PCB49* 0.02 0.4 J 0.32 1.0 J 0.17 1.2 J
PCB47/75* 0.02 0.4 J 0.00 1.0 ND 0.00 1.2 ND
PCB48* 0.00 0.4 ND 0.00 1.0 ND 0.00 1.2 ND
PCB44 0.01 0.1 J 0.13 0.3 J 0.11 0.4 J
PCB42/59/37* 0.00 0.4 ND 0.09 1.0 J 0.13 1.2 J
PCB72* 0.00 0.4 ND 0.00 1.0 ND 0.00 1.2 ND
PCB41/64* 0.10 0.4 I 7.42 1.0 I 12.60 1.2 I
PCB40* 0.00 0.4 J 0.07 1.0 J 0.08 1.2 J
PCB67* 0.00 0.4 ND 0.00 1.0 ND 0.04 1.2 J
PCB63* 0.00 0.4 ND 0.00 1.0 ND 0.00 1.2 ND
PCB74/61* 0.00 0.4 ND 0.16 1.0 J 0.08 1.2 J
PCB70* 0.00 0.4 ND 0.05 1.0 J 0.00 1.2 ND
PCB66 0.02 0.1 J 0.07 0.2 J 0.13 0.2 J
PCB95/80* 0.02 0.4 J 0.17 1.0 J 0.09 1.2 J
PCB55/91* 0.00 0.4 ND 0.22 1.0 J 0.00 1.2 ND
PCB56/60* 0.00 0.4 ND 0.35 1.0 J 0.00 1.2 ND
PCB92* 0.00 0.4 ND 0.00 1.0 ND 0.05 1.2 J
Individual PCBs Conc DL Conc DL Conc DL PCB84* 0.00 0.4 J 0.05 1.0 J 0.25 1.2 J
PCB101/90 0.00 0.4 ND 0.19 1.1 J 0.41 1.3 J
PCB99* 0.02 0.4 J 0.18 1.0 J 0.27 1.2 J
PCB119* 0.00 0.4 ND 0.02 1.0 J 0.03 1.2 J
PCB83* 0.01 0.4 J 0.41 1.0 J 0.88 1.2 J
PCB97* 0.00 0.4 ND 0.10 1.0 J 0.02 1.2 J
PCB81* 0.00 0.4 ND 0.00 1.0 ND 0.05 1.2 J
PCB87/115 0.00 0.1 ND 0.04 0.1 J 0.00 0.2 ND
PCB85* 0.00 0.4 J 0.01 1.0 J 0.00 1.2 J
PCB136* 0.01 0.4 J 0.02 1.0 J 0.03 1.2 J
PCB110/77 0.02 0.3 J 0.36 0.7 J 0.17 0.8 J
PCB82* 0.00 0.4 ND 0.02 1.0 J 0.01 1.2 J
PCB151* 0.00 0.4 ND 0.00 1.0 ND 0.00 1.2 ND
PCB135* 0.02 0.4 J 0.06 1.0 J 0.03 1.2 J
PCB107* 0.00 0.4 ND 0.72 1.0 J 0.07 1.2 J
PCB149/123* 0.01 0.4 J 0.14 1.0 J 0.03 1.2 J
PCB118 0.03 0.4 J 0.16 0.9 J 0.03 1.1 J
PCB114* 0.00 0.4 ND 0.00 1.0 ND 0.00 1.2 ND
PCB146* 0.00 0.4 ND 0.04 1.0 J 0.05 1.2 J
PCB153/132 0.07 1.3 J 0.20 3.4 J 0.22 4.0 J
PCB105 0.01 0.6 J 0.14 1.4 J 0.15 1.7 J
PCB141/179* 0.01 0.4 J 0.00 1.0 ND 0.00 1.2 ND
PCB130* 0.01 0.4 J 0.00 1.0 ND 0.00 1.2 ND
PCB176/137* 0.00 0.4 ND 0.19 1.0 J 0.31 1.2 J
PCB138 /160 0.05 1.3 J 0.33 3.2 J 0.26 3.8 J
PCB158* 0.00 0.4 ND 0.00 1.0 ND 0.00 1.2 ND
PCB129* 0.00 0.4 ND 0.00 1.0 ND 0.00 1.2 ND
PCB126* 0.00 0.4 ND 0.51 1.0 J 0.12 1.2 J

75
PCB178* 0.00 0.4 ND 0.08 1.0 J 0.05 1.2 J
PCB166* 0.00 0.4 ND 0.00 1.0 ND 0.00 1.2 ND
PCB175* 0.07 0.4 J 0.05 1.0 J 0.14 1.2 J
PCB187 0.01 0.8 J 0.21 2.0 J 0.10 2.4 J
PCB183 * 0.00 0.4 ND 0.00 1.0 ND 0.00 1.2 ND
PCB128 0.00 0.1 ND 0.04 0.3 J 0.02 0.4 J
PCB167* 0.00 0.4 ND 0.11 1.0 J 0.08 1.2 J
PCB185 * 0.00 0.4 ND 0.05 1.0 J 0.06 1.2 J
PCB174* 0.00 0.4 ND 0.00 1.0 ND 0.00 1.2 ND
PCB177* 0.00 0.4 ND 0.00 1.0 ND 0.00 1.2 ND
PCB171/202* 0.00 0.4 ND 0.02 1.0 J 0.03 1.2 J
PCB156* 0.00 0.4 ND 0.15 1.0 J 0.19 1.2 J
PCB201/157/173* 0.00 0.4 ND 0.00 1.0 ND 0.04 1.2 J
PCB172* 0.00 0.0 ND 0.00 0.1 ND 0.00 0.1 ND
PCB197* 0.00 0.4 ND 0.00 1.0 ND 0.00 1.2 ND
PCB180 0.02 1.5 J 0.08 3.9 J 0.12 4.6 J
PCB193* 0.00 0.4 ND 0.00 1.0 ND 0.00 1.2 ND
PCB191* 0.00 0.4 ND 0.00 1.0 ND 0.00 1.2 ND
PCB200* 0.00 0.4 ND 0.00 1.0 ND 0.00 1.2 ND
PCB169* 0.00 0.4 ND 0.00 1.0 ND 0.00 1.2 ND
PCB170/190 0.08 0.9 J 0.80 2.1 J 0.57 2.6 J
PCB199* 0.04 0.4 J 0.06 1.0 J 0.15 1.2 J
PCB203/196* 0.00 0.4 ND 0.00 1.0 ND 0.00 1.2 ND
Individual PCBs Conc DL Conc DL Conc DL PCB189* 0.00 0.4 ND 0.00 1.0 ND 0.00 1.2 ND
PCB195/208 0.00 0.1 ND 0.04 0.3 J 0.10 0.4 J
PCB207* 0.00 0.4 ND 0.00 1.0 ND 0.00 1.2 ND
PCB194* 0.00 0.4 ND 0.00 1.0 ND 0.24 1.2 J
PCB205 * 0.00 0.4 ND 0.00 1.0 ND 0.00 1.2 ND
PCB206 0.00 0.1 ND 0.00 0.2 ND 0.03 0.2 J
PCB209 0.00 0.1 ND 0.44 0.2 0.02 0.2 J
Totals by Chlorination Level
CL1 0.00 0.84 0.33
CL2 0.06 0.83 1.31
CL3 0.26 5.70 4.65
CL4 0.10 1.90 1.17
CL5 0.11 3.09 2.55
CL6 0.18 1.09 0.92
CL7 0.18 1.48 1.38
CL8 0.04 0.10 0.53
CL9 0.00 0.00 0.03
CL10 0.00 0.44 0.02
Total PCBs 0.92 15.48 12.89

76
Client Sample ID CBA12 CBA13
GERG ID C42422 C42423
Sample Type SAMP SAMP
SDG C8695 C8695
Dry Weight 10.88 14.12
Wet Weight 20.01 20.08
Sample Size Units Grams Grams
Matrix Sediment Sediment
% solid 54.4 70.3
Reporting Units ng/g ng/g
Calculation Basis (dry/wet) Dry Dry
QC Batch ID M3156 M3156
Method GCECD GCECD
Receive Date 8/27/2002 8/27/2002
Extraction Date 10/4/2002 10/4/2002
Analysis Date 10/19/2002 10/19/2002
Surrogate Compounds % Recov % Recov
DBOFB 88.7 98.1
PCB103* 89.4 99.2
PCB198 88.4 95.0
Totals Conc Conc
Total PCBs 8.43 3.43
Total PCBs (SandT) 6.19 2.41
Pesticides Conc DL Conc DL
Chlorinated Benzenes
Tetrachlorobenzene 1,2,4,5 0.53 0.2 0.44 0.1
Tetrachlorobenzene 1,2,3,4 0.02 0.3 J 0.01 0.2 J
Pentachlorobenzene 0.10 0.1 J 0.03 0.1 J
Hexachlorobenzene 0.00 0.1 ND 0.00 0.1 ND
Hexachlorocyclohexanes
Alpha HCH 0.01 0.1 J 0.01 0.0 J
Beta HCH 0.00 0.2 ND 0.00 0.2 ND
Gamma HCH 0.08 0.2 J 0.02 0.1 J
Delta HCH 0.03 0.1 J 0.00 0.1 ND
Chlordane-related Compounds

77
Heptachlor 0.04 0.2 J 0.00 0.2 ND
Heptachlor Epoxide 0.00 0.1 ND 0.00 0.1 ND
Oxychlordane 0.00 0.1 ND 0.00 0.1 ND
Alpha Chlordane 0.05 0.1 J 0.02 0.1 J
Gamma Chlordane 0.04 0.0 J 0.01 0.0 J
Cis-Nonachlor 0.02 0.1 J 0.00 0.1 J
Trans-Nonachlor 0.01 0.1 J 0.01 0.1 J
Other Cyclodiene Pesticides
Aldrin 0.03 0.1 J 0.00 0.1 ND
Dieldrin 0.00 0.0 ND 0.05 0.0
Endrin 0.07 0.1 J 0.06 0.1 J
Pesticides Conc DL Conc DL
Other Chlorinated Pesticides
Pentachloroanisole 0.04 0.1 J 0.02 0.1 J
Chlorpyrifos 0.05 0.1 J 0.04 0.1 J
Mirex 0.00 0.1 ND 0.00 0.1 ND
Endosulfan II 0.04 0.2 J 0.00 0.1 ND
DDTs and Related Compounds
2,4' DDE 0.07 0.1 J 0.14 0.1
4,4' DDE 0.40 0.0 0.20 0.0
2,4' DDD 0.14 0.2 J 0.14 0.1 J
4,4' DDD 0.00 0.1 J 0.03 0.1 J
2,4' DDT 0.01 0.1 J 0.05 0.1 J
4,4' DDT 0.24 0.2 0.09 0.2 J
Individual PCBs Conc DL Conc DL PCB1* 0.00 0.5 ND 0.02 0.4 J
PCB7/9* 0.00 0.5 ND 0.00 0.4 ND
PCB8/5 0.30 0.2 0.16 0.2 J
PCB30* 0.00 0.5 ND 0.00 0.4 ND
PCB18/17 0.12 0.1 0.05 0.1 J
PCB15* 0.51 0.5 J 0.01 0.4 J
PCB24/27* 0.00 0.5 ND 0.00 0.4 ND
PCB16/32* 0.49 0.5 J 0.39 0.4 J
PCB29 0.00 0.1 ND 0.02 0.1 J
PCB26* 0.00 0.5 ND 0.00 0.4 ND
PCB25* 0.00 0.5 ND 0.00 0.4 ND
PCB31* 1.30 0.5 0.63 0.4
PCB28 0.21 0.4 J 0.15 0.3 J
PCB33/20* 0.03 0.5 J 0.02 0.4 J
PCB53* 0.00 0.5 ND 0.00 0.4 ND
PCB22/51* 0.19 0.5 J 0.00 0.4 ND
PCB45* 0.00 0.5 ND 0.02 0.4 J
PCB46 * 0.00 0.5 ND 0.00 0.4 ND
PCB39* 1.03 0.5 0.00 0.4 ND
PCB69* 0.00 0.5 ND 0.14 0.4 J

78
PCB52 0.04 0.1 J 0.02 0.1 J
PCB49* 0.03 0.5 J 0.06 0.4 J
PCB47/75* 0.01 0.5 J 0.00 0.4 ND
PCB48* 0.15 0.5 J 0.00 0.4 ND
PCB44 0.04 0.2 J 0.00 0.1 ND
PCB42/59/37* 0.00 0.5 ND 0.00 0.4 ND
PCB72* 0.00 0.5 ND 0.00 0.4 ND
PCB41/64* 0.12 0.5 J 0.04 0.4 J
PCB40* 75.66 0.5 I 0.09 0.4 J
PCB67* 0.08 0.5 J 0.01 0.4 J
PCB63* 0.00 0.5 ND 0.00 0.4 ND
PCB74/61* 0.02 0.5 J 0.00 0.4 ND
PCB70* 0.00 0.5 ND 0.00 0.4 ND
PCB66 0.01 0.1 J 0.03 0.1 J
PCB95/80* 0.02 0.5 J 0.02 0.4 J
PCB55/91* 0.00 0.5 ND 0.00 0.4 ND
PCB56/60* 0.00 0.5 ND 0.12 0.4 J
PCB92* 0.00 0.5 ND 0.03 0.4 J
Individual PCBs Conc DL Conc DL PCB84* 0.00 0.5 J 0.00 0.4 ND
PCB101/90 0.05 0.6 J 0.03 0.5 J
PCB99* 0.07 0.5 J 0.03 0.4 J
PCB119* 0.01 0.5 J 0.01 0.4 J
PCB83* 0.33 0.5 J 0.11 0.4 J
PCB97* 0.00 0.5 ND 0.04 0.4 J
PCB81* 0.00 0.5 ND 0.00 0.4 ND
PCB87/115 0.01 0.1 J 0.00 0.1 ND
PCB85* 0.00 0.5 J 0.00 0.4 J
PCB136* 0.02 0.5 J 0.01 0.4 J
PCB110/77 0.05 0.4 J 0.03 0.3 J
PCB82* 0.01 0.5 J 0.02 0.4 J
PCB151* 0.00 0.5 ND 0.00 0.4 ND
PCB135* 0.00 0.5 ND 0.00 0.4 ND
PCB107* 0.02 0.5 J 0.06 0.4 J
PCB149/123* 0.03 0.5 J 0.01 0.4 J
PCB118 0.03 0.5 J 0.01 0.4 J
PCB114* 0.00 0.5 ND 0.00 0.4 ND
PCB146* 0.04 0.5 J 0.01 0.4 J
PCB153/132 0.05 1.8 J 0.04 1.4 J
PCB105 0.14 0.7 J 0.02 0.6 J
PCB141/179* 0.06 0.5 J 0.03 0.4 J
PCB130* 0.00 0.5 ND 0.06 0.4 J
PCB176/137* 0.07 0.5 J 0.00 0.4 ND
PCB138 /160 1.49 1.7 J 0.42 1.3 J
PCB158* 0.00 0.5 ND 0.00 0.4 ND
PCB129* 0.00 0.5 ND 0.00 0.4 ND
PCB126* 0.00 0.5 ND 0.00 0.4 ND

79
PCB178* 0.02 0.5 J 0.01 0.4 J
PCB166* 0.00 0.5 ND 0.00 0.4 ND
PCB175* 0.21 0.5 J 0.10 0.4 J
PCB187 0.14 1.1 J 0.05 0.8 J
PCB183 * 0.00 0.5 ND 0.00 0.4 ND
PCB128 0.00 0.2 J 0.00 0.1 J
PCB167* 0.04 0.5 J 0.01 0.4 J
PCB185 * 0.02 0.5 J 0.00 0.4 J
PCB174* 0.00 0.5 ND 0.00 0.4 ND
PCB177* 0.01 0.5 J 0.00 0.4 ND
PCB171/202* 0.08 0.5 J 0.03 0.4 J
PCB156* 0.05 0.5 J 0.01 0.4 J
PCB201/157/173* 0.00 0.5 ND 0.00 0.4 ND
PCB172* 0.00 0.1 ND 0.00 0.1 ND
PCB197* 0.00 0.5 ND 0.00 0.4 ND
PCB180 0.12 2.1 J 0.06 1.6 J
PCB193* 0.01 0.5 J 0.00 0.4 ND
PCB191* 0.10 0.5 J 0.00 0.4 ND
PCB200* 0.01 0.5 J 0.00 0.4 ND
PCB169* 0.00 0.5 ND 0.00 0.4 ND
PCB170/190 0.20 1.2 J 0.12 0.9 J
PCB199* 0.06 0.5 J 0.03 0.4 J
PCB203/196* 0.00 0.5 ND 0.00 0.4 ND
Individual PCBs Conc DL Conc DL PCB189* 0.00 0.5 ND 0.00 0.4 ND
PCB195/208 0.06 0.2 J 0.03 0.1 J
PCB207* 0.04 0.5 J 0.00 0.4 ND
PCB194* 0.00 0.5 ND 0.00 0.4 ND
PCB205 * 0.02 0.5 J 0.00 0.4 ND
PCB206 0.00 0.1 ND 0.00 0.1 ND
PCB209 0.11 0.1 0.01 0.1 J
Totals by Chlorination Level
CL1 0.00 0.02
CL2 0.81 0.17
CL3 3.37 1.26
CL4 0.48 0.54
CL5 0.73 0.40
CL6 1.78 0.61
CL7 0.97 0.37
CL8 0.14 0.06
CL9 0.04 0.00
CL10 0.11 0.01
Total PCBs 8.43 3.43
ND Not Detected J <MDL NA Not Applicable Q Results Outside QC I Interference B Blank Contamination >3xMDL d Dilution EC Exceeds Calibration

80
Appendix G Polycyclic Aromatic Hydrocarbon data in sediment samples collected from Choctawhatchee
Bay, 2002.

81
Client Sample ID CBA1 CBA2 CBA3 CBA4
GERG ID C42411 C42412 C42413 C42414
Sample Type SAMP SAMP SAMP SAMP
SDG C8695 C8695 C8695 C8695
Dry Weight 4.42 4.76 4.56 15.73
Wet Weight 20.28 20.13 20.22 20.23
Sample Size Units Grams Grams Grams Grams
Matrix Sediment Sediment Sediment Sediment
% solid 21.8 23.6 22.6 77.8
Reporting Units ng/g ng/g ng/g ng/g
Calculation Basis (dry/wet) Dry Dry Dry Dry
QC Batch ID M3156 M3156 M3156 M3156
Method GCMS GCMS GCMS GCMS
Receive Date 08/27/02 08/27/02 08/27/02 08/27/02
Extraction Date 10/04/02 10/04/02 10/04/02 10/04/02
Analysis Date 10/19/02 10/19/02 10/19/02 10/19/02
Surrogate Compounds % Recov % Recov % Recov % Recov
d8-Naphthalene 54.6 31.0 Q 54.0 54.1
d10-Acenaphthene 86.6 65.2 90.3 91.1
d10-Phenanthrene 80.1 97.8 76.5 77.0
d12-Chrysene 83.2 99.8 149.1 I 151.3 I
d12-Perylene 100.4 94.0 89.1 96.4
Total PAHs Conc Conc Conc Conc
Total PAHs with Perylene 866.1 5227.6 3373.5 8230.8
Total PAHs without Perylene 787.6 5095.2 3297.3 8144.1
Total NSandT PAHs 420.2 2612.5 1712.0 5243.0
PAH Compounds Conc DL Conc DL Conc DL Conc DL
Naphthalene 6.8 4.0 14.5 3.7 16.9 3.8 11.0 1.1
C1-Naphthalenes 4.0 3.2 9.8 3.0 7.5 3.1 6.6 0.9
C2-Naphthalenes 8.5 6.3 10.7 5.9 6.7 6.1 2.1 1.8
C3-Naphthalenes 3.4 5.0 J 13.5 4.6 2.9 4.8 J 1.5 1.4
C4-Naphthalenes 2.1 5.0 J 12.8 4.6 1.5 4.8 J 0.3 1.4 J
Biphenyl 3.2 3.2 J 3.1 3.0 4.0 3.1 1.8 0.9
Acenaphthylene 21.1 2.6 94.7 2.4 56.3 2.5 18.5 0.7

82
Acenaphthene 1.7 4.0 J 8.1 3.7 4.0 3.9 4.1 1.1
Fluorene 4.9 3.5 16.9 3.3 6.5 3.4 5.4 1.0
C1-Fluorenes 4.6 7.1 J 17.9 6.5 4.7 6.8 J 2.9 2.0
C2-Fluorenes 4.9 7.1 J 35.3 6.5 8.5 6.8 6.2 2.0
C3-Fluorenes 5.0 7.1 J 47.1 6.5 11.1 6.8 9.7 2.0
Phenanthrene 11.6 2.4 60.5 2.2 43.4 2.3 182.0 0.7
Anthracene 40.0 2.4 191.3 2.2 115.4 2.3 103.8 0.7
C1-Phenanthrenes/Anthracenes 9.6 4.0 76.9 3.7 30.6 3.9 100.2 1.1
C2-Phenanthrenes/Anthracenes 7.9 4.0 87.1 3.7 27.6 3.9 60.5 1.1
C3-Phenanthrenes/Anthracenes 5.0 4.0 56.9 3.7 23.0 3.9 42.8 1.1
C4-Phenanthrenes/Anthracenes 1.6 4.0 J 18.2 3.7 8.5 3.9 18.3 1.1
Dibenzothiophene 1.5 1.0 5.9 0.9 3.4 0.9 6.3 0.3
C1-Dibenzothiophenes 1.9 1.9 J 11.8 1.8 3.3 1.9 8.8 0.5
C2-Dibenzothiophenes 2.5 1.9 26.8 1.8 6.7 1.9 15.5 0.5
C3-Dibenzothiophenes 2.2 1.9 28.1 1.8 10.2 1.9 22.8 0.5
Fluoranthene 26.1 1.8 376.5 1.7 249.8 1.7 1491.6 0.5
Pyrene 28.2 1.7 361.6 1.6 253.1 1.6 1331.3 0.5
C1-Fluoranthenes/Pyrenes 29.3 3.5 262.8 3.2 148.0 3.4 438.7 1.0
Benzo(a)anthracene 40.7 2.5 345.2 2.4 200.1 2.5 437.5 0.7
Chrysene 26.4 2.4 289.1 2.2 193.7 2.3 474.5 0.7
C1-Chrysenes 32.3 4.8 231.9 4.5 111.0 4.7 167.0 1.4
C2-Chrysenes 16.3 4.8 124.8 4.5 49.1 4.7 82.9 1.4
C3-Chrysenes 5.8 4.8 21.0 4.5 9.2 4.7 15.4 1.4
C4-Chrysenes 21.9 4.8 18.4 4.5 10.2 4.7 14.0 1.4
Benzo(b)fluoranthene 96.1 1.6 713.9 1.5 546.5 1.5 950.3 0.4
Benzo(k)fluoranthene 30.3 1.7 183.6 1.6 124.6 1.7 201.7 0.5
Benzo(e)pyrene 47.2 1.6 279.4 1.5 193.8 1.6 390.1 0.5
Benzo(a)pyrene 77.3 1.7 436.1 1.6 285.2 1.7 599.6 0.5
Perylene 78.5 1.4 132.4 1.3 76.2 1.3 86.7 0.4
Indeno(1,2,3-c,d)pyrene 76.8 0.8 301.3 0.8 264.5 0.8 471.5 0.2
Dibenzo(a,h)anthracene 17.3 0.8 66.4 0.7 48.0 0.8 86.7 0.2
Benzo(g,h,i)perylene 61.5 1.1 235.4 1.0 207.9 1.0 360.5 0.3
2-Methylnaphthalene 2.6 1.7 6.6 1.5 5.3 1.6 5.0 0.5
1-Methylnaphthalene 1.4 1.6 J 3.3 1.4 2.2 1.5 1.6 0.4
2,6-Dimethylnaphthalene 4.4 3.2 6.3 2.9 8.2 3.1 1.6 0.9
1,6,7-Trimethylnaphthalene 0.9 2.5 J 6.4 2.3 1.2 2.4 J 0.5 0.7 J
1-Methylphenanthrene 1.8 2.0 J 15.3 1.9 6.1 1.9 28.9 0.6
ND Not Detected J <MDL NA Not Applicable Q Results Outside QC I Interference B Blank Contamination >3xMDL D Dilution

83
Client Sample ID CBA5 CBA6 CBA7 CBA8
GERG ID C42415 C42416 C42417 C42418
Sample Type SAMP SAMP SAMP SAMP
SDG C8695 C8695 C8695 C8695
Dry Weight 12.80 14.26 5.60 1.65
Wet Weight 20.27 20.03 20.22 20.25
Sample Size Units Grams Grams Grams Grams
Matrix Sediment Sediment Sediment Sediment
% solid 63.2 71.2 27.7 8.1
Reporting Units ng/g ng/g ng/g ng/g
Calculation Basis (dry/wet) Dry Dry Dry Dry
QC Batch ID M3156 M3156 M3156 M3156
Method GCMS GCMS GCMS GCMS
Receive Date 08/27/02 08/27/02 08/27/02 08/27/02
Extraction Date 10/04/02 10/04/02 10/04/02 10/04/02
Analysis Date 10/19/02 10/19/02 10/19/02 10/19/02
Surrogate Compounds % Recov % Recov % Recov % Recov
d8-Naphthalene 66.7 72.0 60.8 32.2 Q
d10-Acenaphthene 90.8 87.1 85.5 115.7
d10-Phenanthrene 88.1 81.8 91.0 85.4
d12-Chrysene 103.6 92.7 97.5 93.2
d12-Perylene 83.1 72.1 82.0 84.1
Total PAHs Conc Conc Conc Conc
Total PAHs with Perylene 89.2 19.2 291.7 3065.6
Total PAHs without Perylene 84.6 17.4 249.9 2203.1
Total NSandT PAHs 42.1 9.9 165.2 1927.1
PAH Compounds Conc DL Conc DL Conc DL Conc DL
Naphthalene 0.8 1.4 J 0.3 1.2 J 7.1 3.1 28.3 10.6
C1-Naphthalenes 0.6 1.1 J 0.3 1.0 J 3.0 2.5 19.5 8.6
C2-Naphthalenes 0.5 2.2 J 0.3 2.0 J 2.5 5.0 J 84.8 17.0
C3-Naphthalenes 0.4 1.7 J 0.3 1.5 J 1.8 3.9 J 60.2 13.3
C4-Naphthalenes 0.3 1.7 J 0.2 1.5 J 1.1 3.9 J 10.4 13.3 J
Biphenyl 0.6 1.1 J 0.4 1.0 J 2.0 2.6 J 5.5 8.7 J
Acenaphthylene 0.7 0.9 J 0.3 0.8 J 3.8 2.1 26.8 7.0

84
Acenaphthene 0.1 1.4 J 0.0 1.2 J 0.8 3.2 J 9.2 10.8 J
Fluorene 0.4 1.2 J 0.2 1.1 J 2.2 2.8 J 12.5 9.5
C1-Fluorenes 0.4 2.4 J 0.4 2.2 J 2.5 5.6 J 12.5 18.9 J
C2-Fluorenes 1.0 2.4 J 0.7 2.2 J 3.7 5.6 J 15.3 18.9 J
C3-Fluorenes 0.7 2.4 J 0.1 2.2 J 2.2 5.6 J 3.5 18.9 J
Phenanthrene 1.5 0.8 0.6 0.7 J 8.3 1.9 43.5 6.4
Anthracene 1.2 0.8 0.4 0.7 J 7.4 1.9 78.8 6.4
C1-Phenanthrenes/Anthracenes 0.9 1.4 J 0.5 1.2 J 4.6 3.2 38.3 10.7
C2-Phenanthrenes/Anthracenes 0.9 1.4 J 0.4 1.2 J 4.8 3.2 24.1 10.7
C3-Phenanthrenes/Anthracenes 0.4 1.4 J 0.1 1.2 J 1.7 3.2 J 10.6 10.7 J
C4-Phenanthrenes/Anthracenes 0.5 1.4 J 0.0 1.2 J 1.0 3.2 J 15.2 10.7
Dibenzothiophene 0.2 0.3 J 0.1 0.3 J 1.2 0.8 8.0 2.6
C1-Dibenzothiophenes 0.2 0.7 J 0.1 0.6 J 1.3 1.5 J 4.1 5.2 J
C2-Dibenzothiophenes 0.4 0.7 J 0.2 0.6 J 1.9 1.5 7.4 5.2
C3-Dibenzothiophenes 0.4 0.7 J 0.1 0.6 J 1.9 1.5 5.2 5.2 J
Fluoranthene 5.9 0.6 1.1 0.6 18.7 1.4 146.7 4.8
Pyrene 5.3 0.6 1.0 0.5 18.6 1.3 105.5 4.5
C1-Fluoranthenes/Pyrenes 2.4 1.2 0.5 1.1 J 9.8 2.7 114.4 9.3
Benzo(a)anthracene 2.9 0.9 0.6 0.8 J 12.1 2.0 165.4 6.8
Chrysene 3.9 0.8 0.8 0.7 9.1 1.9 146.4 6.5
C1-Chrysenes 1.6 1.7 J 0.2 1.5 J 6.9 3.8 226.5 12.9
C2-Chrysenes 4.4 1.7 0.9 1.5 J 4.2 3.8 24.6 12.9
C3-Chrysenes 0.1 1.7 J 0.0 1.5 J 0.7 3.8 J 9.2 12.9 J
C4-Chrysenes 2.1 1.7 0.7 1.5 J 5.3 3.8 16.7 12.9
Benzo(b)fluoranthene 9.4 0.5 1.6 0.5 26.4 1.2 259.5 4.2
Benzo(k)fluoranthene 2.6 0.6 0.4 0.5 J 5.5 1.4 74.4 4.6
Benzo(e)pyrene 5.0 0.6 0.7 0.5 12.9 1.3 107.8 4.4
Benzo(a)pyrene 6.6 0.6 0.9 0.5 13.6 1.4 133.6 4.7
Perylene 4.7 0.5 1.8 0.4 41.7 1.1 862.5 3.7
Indeno(1,2,3-c,d)pyrene 9.5 0.3 1.1 0.3 18.8 0.7 110.8 2.2
Dibenzo(a,h)anthracene 1.7 0.3 0.2 0.2 J 2.9 0.6 26.4 2.1
Benzo(g,h,i)perylene 8.2 0.4 0.9 0.3 17.6 0.9 11.9 2.9
2-Methylnaphthalene 0.4 0.6 J 0.2 0.5 J 2.1 1.3 13.0 4.5
1-Methylnaphthalene 0.2 0.5 J 0.1 0.5 J 0.9 1.2 J 6.5 4.2
2,6-Dimethylnaphthalene 0.7 1.1 J 0.6 1.0 J 3.8 2.5 16.1 8.5
1,6,7-Trimethylnaphthalene 0.2 0.9 J 0.1 0.8 J 0.8 2.0 J 5.6 6.7 J
1-Methylphenanthrene 0.3 0.7 J 0.1 0.6 J 1.1 1.6 J 19.6 5.4
ND Not Detected J <MDL NA Not Applicable Q Results Outside QC I Interference B Blank Contamination >3xMDL D Dilution

85
QC Batch ID M3156 M3156 M3156
Method GCMS GCMS GCMS
Receive Date 08/27/02 08/27/02 08/27/02
Extraction Date 10/04/02 10/04/02 10/04/02
Analysis Date 10/19/02 10/19/02 10/19/02
Surrogate Compounds % Recov % Recov % Recov
d8-Naphthalene 59.9 48.5 64.1
d10-Acenaphthene 76.6 86.4 92.1
d10-Phenanthrene 74.0 82.2 92.7
d12-Chrysene 81.5 108.4 102.5
d12-Perylene 67.3 79.9 86.6
Total PAHs Conc Conc Conc
Total PAHs with Perylene 20.2 835.3 334.9
Total PAHs without Perylene 18.9 571.2 259.0
Total NSandT PAHs 11.4 489.0 193.9
PAH Compounds Conc DL Conc DL Conc DL
Naphthalene 0.3 1.2 J 12.6 3.0 7.8 3.6
C1-Naphthalenes 0.2 1.0 J 6.8 2.4 4.4 2.9
C2-Naphthalenes 0.2 1.9 J 7.2 4.8 3.9 5.7 J
C3-Naphthalenes 0.1 1.5 J 3.7 3.8 J 2.6 4.5 J
C4-Naphthalenes 0.1 1.5 J 2.0 3.8 J 1.1 4.5 J
Biphenyl 0.3 1.0 J 2.9 2.5 3.2 2.9
Acenaphthylene 0.3 0.8 J 5.9 2.0 3.8 2.4
Acenaphthene 0.0 1.2 J 1.5 3.0 J 1.1 3.6 J
Fluorene 0.1 1.1 J 3.8 2.7 3.1 3.2 J
C1-Fluorenes 0.2 2.1 J 5.6 5.3 3.8 6.4 J
C2-Fluorenes 0.5 2.1 J 13.0 5.3 5.9 6.4 J
C3-Fluorenes 0.1 2.1 J 15.2 5.3 3.0 6.4 J
Phenanthrene 0.4 0.7 J 9.1 1.8 10.8 2.2
Anthracene 0.4 0.7 J 14.1 1.8 7.9 2.1
C1-Phenanthrenes/Anthracenes 0.3 1.2 J 12.1 3.0 5.5 3.6
C2-Phenanthrenes/Anthracenes 0.5 1.2 J 18.2 3.0 5.4 3.6
C3-Phenanthrenes/Anthracenes 0.1 1.2 J 16.9 3.0 5.4 3.6
C4-Phenanthrenes/Anthracenes 0.1 1.2 J 7.5 3.0 1.9 3.6 J
Dibenzothiophene 0.1 0.3 J 1.7 0.7 1.4 0.9
C1-Dibenzothiophenes 0.1 0.6 J 4.3 1.5 1.4 1.7 J
C2-Dibenzothiophenes 0.1 0.6 J 9.3 1.5 2.2 1.7
C3-Dibenzothiophenes 0.0 0.6 J 17.3 1.5 2.2 1.7
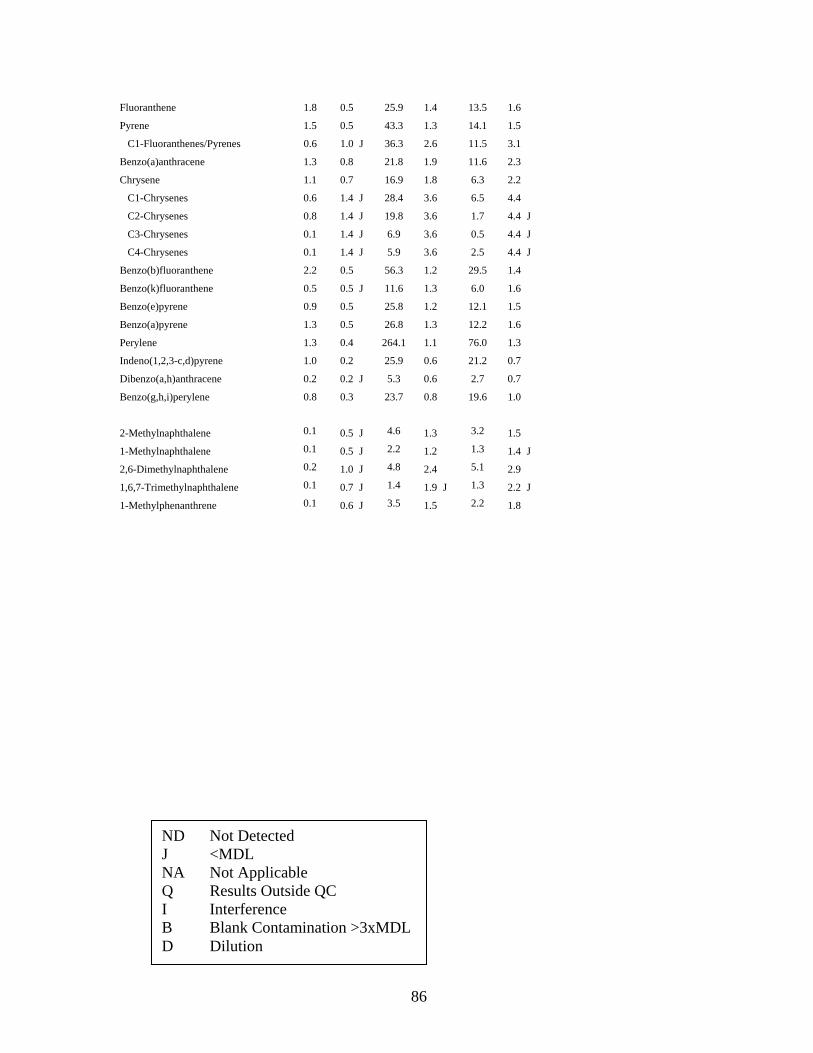
86
Fluoranthene 1.8 0.5 25.9 1.4 13.5 1.6
Pyrene 1.5 0.5 43.3 1.3 14.1 1.5
C1-Fluoranthenes/Pyrenes 0.6 1.0 J 36.3 2.6 11.5 3.1
Benzo(a)anthracene 1.3 0.8 21.8 1.9 11.6 2.3
Chrysene 1.1 0.7 16.9 1.8 6.3 2.2
C1-Chrysenes 0.6 1.4 J 28.4 3.6 6.5 4.4
C2-Chrysenes 0.8 1.4 J 19.8 3.6 1.7 4.4 J
C3-Chrysenes 0.1 1.4 J 6.9 3.6 0.5 4.4 J
C4-Chrysenes 0.1 1.4 J 5.9 3.6 2.5 4.4 J
Benzo(b)fluoranthene 2.2 0.5 56.3 1.2 29.5 1.4
Benzo(k)fluoranthene 0.5 0.5 J 11.6 1.3 6.0 1.6
Benzo(e)pyrene 0.9 0.5 25.8 1.2 12.1 1.5
Benzo(a)pyrene 1.3 0.5 26.8 1.3 12.2 1.6
Perylene 1.3 0.4 264.1 1.1 76.0 1.3
Indeno(1,2,3-c,d)pyrene 1.0 0.2 25.9 0.6 21.2 0.7
Dibenzo(a,h)anthracene 0.2 0.2 J 5.3 0.6 2.7 0.7
Benzo(g,h,i)perylene 0.8 0.3 23.7 0.8 19.6 1.0
2-Methylnaphthalene 0.1 0.5 J 4.6 1.3 3.2 1.5
1-Methylnaphthalene 0.1 0.5 J 2.2 1.2 1.3 1.4 J
2,6-Dimethylnaphthalene 0.2 1.0 J 4.8 2.4 5.1 2.9
1,6,7-Trimethylnaphthalene 0.1 0.7 J 1.4 1.9 J 1.3 2.2 J
1-Methylphenanthrene 0.1 0.6 J 3.5 1.5 2.2 1.8
ND Not Detected J <MDL NA Not Applicable Q Results Outside QC I Interference B Blank Contamination >3xMDL D Dilution

87
Client Sample ID CBA12 CBA13
GERG ID C42422 C42423
Sample Type SAMP SAMP
SDG C8695 C8695
Dry Weight 10.88 14.12
Wet Weight 20.01 20.08
Sample Size Units Grams Grams
Matrix Sediment Sediment
% solid 54.4 70.3
Reporting Units ng/g ng/g
Calculation Basis (dry/wet) Dry Dry
QC Batch ID M3156 M3156
Method GCMS GCMS
Receive Date 08/27/02 08/27/02
Extraction Date 10/04/02 10/04/02
Analysis Date 10/19/02 10/19/02
Surrogate Compounds % Recov % Recov
d8-Naphthalene 62.5 64.3
d10-Acenaphthene 88.3 85.6
d10-Phenanthrene 85.5 86.1
d12-Chrysene 96.1 102.1
d12-Perylene 84.4 80.3
Total PAHs Conc Conc
Total PAHs with Perylene 138.2 62.3
Total PAHs without Perylene 100.5 50.6
Total NSandT PAHs 88.1 35.2
PAH Compounds Conc DL Conc DL
Naphthalene 3.6 1.6 1.1 1.2 J
C1-Naphthalenes 1.9 1.3 0.8 1.0 J
C2-Naphthalenes 1.8 2.6 J 0.7 2.0 J
C3-Naphthalenes 0.8 2.0 J 0.4 1.6 J
C4-Naphthalenes 0.3 2.0 J 0.2 1.6 J
Biphenyl 1.2 1.3 J 0.6 1.0 J
Acenaphthylene 1.6 1.1 1.1 0.8

88
Acenaphthene 0.4 1.6 J 0.3 1.3 J
Fluorene 1.2 1.4 J 0.5 1.1 J
C1-Fluorenes 1.1 2.9 J 0.7 2.2 J
C2-Fluorenes 2.0 2.9 J 1.4 2.2 J
C3-Fluorenes 1.2 2.9 J 0.7 2.2 J
Phenanthrene 3.3 1.0 1.2 0.7
Anthracene 3.5 1.0 2.3 0.7
C1-Phenanthrenes/Anthracenes 2.1 1.6 1.0 1.3 J
C2-Phenanthrenes/Anthracenes 1.9 1.6 1.2 1.3 J
C3-Phenanthrenes/Anthracenes 1.4 1.6 J 0.6 1.3 J
C4-Phenanthrenes/Anthracenes 0.6 1.6 J 0.3 1.3 J
Dibenzothiophene 0.4 0.4 J 0.2 0.3 J
C1-Dibenzothiophenes 0.5 0.8 J 0.3 0.6 J
C2-Dibenzothiophenes 0.6 0.8 J 0.3 0.6 J
C3-Dibenzothiophenes 0.4 0.8 J 0.3 0.6 J
Fluoranthene 6.7 0.7 2.9 0.6
Pyrene 8.7 0.7 3.0 0.5
C1-Fluoranthenes/Pyrenes 5.1 1.4 2.2 1.1
Benzo(a)anthracene 4.9 1.0 2.4 0.8
Chrysene 3.1 1.0 1.4 0.8
C1-Chrysenes 3.3 2.0 1.6 1.5
C2-Chrysenes 1.9 2.0 J 0.9 1.5 J
C3-Chrysenes 1.1 2.0 J 0.4 1.5 J
C4-Chrysenes 3.3 2.0 1.7 1.5
Benzo(b)fluoranthene 9.7 0.6 5.8 0.5
Benzo(k)fluoranthene 1.9 0.7 1.2 0.5
Benzo(e)pyrene 4.1 0.7 2.3 0.5
Benzo(a)pyrene 4.9 0.7 3.0 0.5
Perylene 37.7 0.6 11.7 0.4
Indeno(1,2,3-c,d)pyrene 4.7 0.3 2.8 0.3
Dibenzo(a,h)anthracene 1.0 0.3 0.6 0.2
Benzo(g,h,i)perylene 4.6 0.4 2.5 0.3
2-Methylnaphthalene 1.2 0.7 0.5 0.5
1-Methylnaphthalene 0.6 0.6 0.2 0.5 J
2,6-Dimethylnaphthalene 1.6 1.3 1.0 1.0
1,6,7-Trimethylnaphthalene 0.4 1.0 J 0.2 0.8 J
1-Methylphenanthrene 0.6 0.8 J 0.3 0.6 J
ND Not Detected J <MDL NA Not Applicable Q Results Outside QC I Interference B Blank Contamination >3xMDL D Dilution
89
Appendix H
Trace and Major Element data in sediment samples collected from the Choctawhatchee Bay, 2002.

90
Client Sample ID CBA1 CBA2 CBA3 GERG Sample ID C42411 C42412 C42413 Sample Type SAMP SAMP SAMP GERG SDG C8695 C8695 C8695 Receipt Date 08/27/02 08/27/02 08/27/02 Matrix Sediment Sediment Sediment Acid Digest QC Batch SD-230 SD-230 SD-230 Acid Digestion Wt 1.02 1.08 1.01 Acid Digestion Date 10/10/02 10/10/02 10/10/02 Hg Digest QC Batch Hg-1112 Hg-1112 Hg-1112 Hg Digestion Wt 0.20 0.20 0.22 Hg Digestion Date 10/21/2002 10/21/2002 10/21/2002 Wt Units Grams Grams Grams Unit Qual Dry Dry Dry % Moisture 78.22 76.36 77.44 % Solid 21.78 23.64 22.56 Conc Units ug/g DL QUAL ug/g DL QUAL ug/g DL QUAL
GFAA
Arsenic 17.15 0.49 D5 11.59 0.46 D5 21.75 0.49 D5 Cadmium 0.55 0.20 0.56 0.19 0.65 0.20
Lead 19.15 0.98 D5 57.25 0.93 D10 58.14 0.99 D10 Selenium 1.34 0.98 0.96 0.93 1.14 0.99 D2
Silver 0.08 0.10 J 1.52 0.09 D1.5 0.21 0.10 Thallium 0.19 0.98 J 0.25 0.93 J 0.27 0.99 J
ICP Aluminum 29778 9.76 D15 20410 9.29 D8 32128 9.85 D15
Barium 22.56 0.98 25.60 0.93 23.18 0.99 Berylium 2.85 0.20 1.54 0.19 2.75 0.20
Boron 51.31 2.93 34.68 2.79 54.41 2.96 Chromium 60.34 0.98 43.75 0.93 60.45 0.99
Copper 11.75 0.98 183.83 0.93 26.43 0.99 Iron 36216 9.76 D15 20801 9.29 D8 35456 9.85 D15
Magnesium 10396 9.76 D4 5264 9.29 D2 13968 9.85 D15 Manganese 506 4.88 346 4.65 1093 4.93
Molybdenum 2.74 1.95 2.53 1.86 2.91 1.97 Nickel 18.97 1.95 12.89 1.86 22.37 1.97
Strontium 70.66 1.95 43.42 1.86 78.03 1.97 Vanadium 47.14 0.98 36.80 0.93 51.62 0.99
Zinc 53.14 0.98 84.89 0.93 92.04 0.99 CVAA
Mercury 0.15 0.20 J 0.34 0.20 0.19 0.18
ND Not Detected J <DL NA Not Applicable Q Results Outside QC I Interference B Blank Contamination >3*DL Dx Diluted x times EL Exceeds Linear Range

91
Client Sample ID CBA4 CBA5 CBA6 GERG Sample ID C42414 C42415 C42416 Sample Type SAMP SAMP SAMP GERG SDG C8695 C8695 C8695 Receipt Date 08/27/02 08/27/02 08/27/02 Matrix Sediment Sediment Sediment Acid Digest QC Batch SD-230 SD-230 SD-230 Acid Digestion Wt 1.12 1.11 1.13 Acid Digestion Date 10/10/02 10/10/02 10/10/02 Hg Digest QC Batch Hg-1112 Hg-1112 Hg-1112 Hg Digestion Wt 0.30 0.23 0.28 Hg Digestion Date 10/21/2002 10/21/2002 10/21/2002 Wt Units Grams Grams Grams Unit Qual Dry Dry Dry % Moisture 22.22 36.84 28.83 % Solid 77.78 63.16 71.17 Conc Units ug/g DL QUAL ug/g DL QUAL ug/g DL QUAL
GFAA
Arsenic 0.88 0.45 2.85 0.45 D2 1.87 0.44 D2 Cadmium 0.07 0.18 J 0.02 0.18 J 0.02 0.18 J
Lead 10.17 0.90 D5 3.85 0.90 D2 2.67 0.88 D2 Selenium 0.14 0.90 J 0.09 0.90 J 0.07 0.88 J
Silver 0.01 0.09 J 0.01 0.09 J 0.01 0.09 J Thallium 0.01 0.90 J 0.08 0.90 J 0.05 0.88 J
ICP Aluminum 876 8.96 4435 8.98 D2 2543 8.83
Barium 1.60 0.90 3.97 0.90 2.85 0.88 Berylium 0.06 0.18 J 0.45 0.18 0.24 0.18
Boron 5.14 2.69 10.53 2.70 7.40 2.65 Chromium 2.79 0.90 8.87 0.90 5.96 0.88
Copper 4.62 0.90 1.78 0.90 0.70 0.88 J Iron 914 8.96 6078 8.98 D2 3878 8.83
Magnesium 491 8.96 2065 8.98 944 8.83 Manganese 3 4.48 J 135 4.49 74 4.42
Molybdenum 0.00 1.79 ND 0.10 1.80 J 0.00 1.77 ND Nickel 1.00 1.79 J 3.19 1.80 1.58 1.77 J
Strontium 4.29 1.79 24.39 1.80 23.92 1.77 Vanadium 2.00 0.90 8.99 0.90 7.16 0.88
Zinc 16.80 0.90 13.43 0.90 7.13 0.88 CVAA
Mercury 0.03 0.13 J 0.04 0.18 J 0.03 0.14 J
ND Not Detected J <DL NA Not Applicable Q Results Outside QC I Interference B Blank Contamination >3*DL Dx Diluted x times EL Exceeds Linear Range

92
Client Sample ID CBA7 CBA8 CBA9 GERG Sample ID C42417 C42418 C42419 Sample Type SAMP SAMP SAMP GERG SDG C8695 C8695 C8695 Receipt Date 08/27/02 08/27/02 08/27/02 Matrix Sediment Sediment Sediment Acid Digest QC Batch SD-230 SD-230 SD-230 Acid Digestion Wt 1.08 0.52 1.13 Acid Digestion Date 10/10/02 10/10/02 10/10/02 Hg Digest QC Batch Hg-1112 Hg-1112 Hg-1112 Hg Digestion Wt 0.24 0.19 0.34 Hg Digestion Date 10/21/2002 10/21/2002 10/21/2002 Wt Units Grams Grams Grams Unit Qual Dry Dry Dry % Moisture 72.32 91.87 26.73 % Solid 27.68 8.13 73.27 Conc Units ug/g DL QUAL ug/g DL QUAL ug/g DL QUAL
GFAA
Arsenic 30.00 0.46 D5 4.56 0.96 D2 0.89 0.44 Cadmium 0.14 0.19 J 0.53 0.38 0.03 0.18 J
Lead 27.86 0.93 D5 24.44 1.92 D5 2.11 0.88 J D5 Selenium 1.64 0.93 3.90 1.92 0.15 0.88 J
Silver 0.04 0.09 J 0.06 0.19 J 0.00 0.09 ND Thallium 0.24 0.93 J 0.35 1.92 J 0.06 0.88 J
ICP Aluminum 47387 9.27 D25 6640 19.22 754 8.83
Barium 33.56 0.93 24.25 1.92 3.77 0.88 Berylium 4.35 0.19 0.72 0.38 0.07 0.18 J
Boron 38.55 2.78 14.52 5.77 4.18 2.65 Chromium 78.90 0.93 14.94 1.92 3.82 0.88
Copper 12.18 0.93 6.31 1.92 0.15 0.88 J Iron 60785 9.27 D25 1916 19.22 1050 8.83
Magnesium 12508 9.27 D5 2229 19.22 393 8.83 Manganese 829 4.64 12 9.61 12 4.41
Molybdenum 0.00 1.85 ND 0.51 3.84 J 0.00 1.77 ND Nickel 27.96 1.85 5.08 3.84 1.00 1.77 J
Strontium 66.44 1.85 42.56 3.84 13.01 1.77 Vanadium 94.35 0.93 11.76 1.92 2.75 0.88
Zinc 83.03 0.93 38.37 1.92 4.81 0.88 CVAA
Mercury 0.12 0.16 J 0.18 0.21 J 0.02 0.12 J
ND Not Detected J <DL NA Not Applicable Q Results Outside QC I Interference B Blank Contamination >3*DL Dx Diluted x times EL Exceeds Linear Range

93
Client Sample ID CBA10 CBA11 GERG Sample ID C42420 C42421 Sample Type SAMP SAMP GERG SDG C8695 C8695 Receipt Date 08/27/02 08/27/02 Matrix Sediment Sediment Acid Digest QC Batch SD-230 SD-230 Acid Digestion Wt 1.06 1.04 Acid Digestion Date 10/10/02 10/10/02 Hg Digest QC Batch Hg-1112 Hg-1112 Hg Digestion Wt 0.22 0.24 Hg Digestion Date 10/21/2002 10/21/2002 Wt Units Grams Grams Unit Qual Dry Dry % Moisture 71.15 75.65 % Solid 28.85 24.35 Conc Units ug/g DL QUAL ug/g DL QUAL
GFAA
Arsenic 14.66 0.47 D5 28.82 0.48 D5 Cadmium 0.44 0.19 0.22 0.19
Lead 17.26 0.95 D5 24.25 0.96 D5 Selenium 0.94 0.95 J 1.65 0.96
Silver 0.03 0.09 J 0.03 0.10 J Thallium 0.26 0.95 J 0.26 0.96 J
ICP Aluminum 24431 9.45 D15 46321 9.64 D25
Barium 21.48 0.95 35.83 0.96 Berylium 2.74 0.19 4.40 0.19
Boron 31.31 2.84 46.65 2.89 Chromium 55.12 0.95 79.03 0.96
Copper 8.72 0.95 9.30 0.96 Iron 39847 9.45 D15 65864 9.64 D25
Magnesium 7567 9.45 D3 10786 9.64 D4 Manganese 220 4.73 528 4.82
Molybdenum 0.25 1.89 J 0.35 1.93 J Nickel 14.49 1.89 25.86 1.93
Strontium 67.31 1.89 72.12 1.93 Vanadium 42.57 0.95 103.43 0.96
Zinc 60.60 0.95 74.85 0.96 CVAA
Mercury 0.12 0.18 J 0.12 0.16 J
ND Not Detected J <DL NA Not Applicable Q Results Outside QC I Interference B Blank Contamination >3*DL Dx Diluted x times EL Exceeds Linear Range

94
Client Sample ID CBA12 CBA13 GERG Sample ID C42422 C42423 Sample Type SAMP SAMP GERG SDG C8695 C8695 Receipt Date 08/27/02 08/27/02 Matrix Sediment Sediment Acid Digest QC Batch SD-230 SD-230 Acid Digestion Wt 1.10 1.07 Acid Digestion Date 10/10/02 10/10/02 Hg Digest QC Batch Hg-1112 Hg-1112 Hg Digestion Wt 0.23 0.25 Hg Digestion Date 10/21/2002 10/21/2002 Wt Units Grams Grams Unit Qual Dry Dry % Moisture 44.92 36.27 % Solid 55.08 63.73 Conc Units ug/g DL QUAL ug/g DL QUAL
GFAA
Arsenic 5.27 0.45 D2 4.70 0.47 D2 Cadmium 0.13 0.18 J 0.06 0.19 J
Lead 6.79 0.91 D5 4.76 0.93 D5 Selenium 0.29 0.91 J 0.20 0.93 J
Silver 0.01 0.09 J 0.01 0.09 J Thallium 0.16 0.91 J 0.12 0.93 J
ICP Aluminum 9105 9.08 D6 6014 9.33 D4
Barium 10.81 0.91 6.77 0.93 Berylium 1.09 0.18 0.71 0.19
Boron 14.02 2.72 11.11 2.80 Chromium 20.23 0.91 12.65 0.93
Copper 2.30 0.91 1.33 0.93 Iron 15525 9.08 D6 10667 9.33 D4
Magnesium 2264 9.08 1496 9.33 Manganese 60 4.54 64 4.66
Molybdenum 0.00 1.82 ND 0.00 1.87 ND Nickel 6.36 1.82 4.31 1.87
Strontium 18.32 1.82 11.27 1.87 Vanadium 22.01 0.91 17.11 0.93
Zinc 25.32 0.91 16.45 0.93 CVAA
Mercury 0.05 0.17 J 0.04 0.16 J
ND Not Detected J <DL NA Not Applicable Q Results Outside QC I Interference B Blank Contamination >3*DL Dx Diluted x times EL Exceeds Linear Range

95
Appendix I
Lab analysis methods for Wellington and GERG labs.

96
The four samples chosen for Dioxin analysis were received intact in the lab and
refrigerated at four degrees Celsius in the dark until they were processed. Wellington
Laboratories used the US EPA 1613 revision B method for the HRGC/HRMS analysis for
PCDD/PCDF analysis. The lab commented that the surrogate recoveries, the lab blank and
all other QA/QC data associated with this analysis were acceptable according to the reference
method. Dioxin and Furan data is provided for the soil samples in parts per trillion (ppt).
Thirteen (13) sediment samples were received in one sample delivery group under on
August 27, 2002. Samples were logged in under custody and stored at –20�C. Samples were
homogenized. Samples were analyzed for Aliphatic and Aromatic Hydrocarbons, Pesticides
and Polychlorinated Biphenyls (PCBs), Trace metals, selected Chlorophenoxy Herbicides,
Particle Size Distribution and Nutrients. The samples were extracted in QC batch M3156 on
October 4, 2002 for analysis for hydrocarbons, pesticides and PCBs. The samples were also
extracted on October 8, 2002 in QC Batch M3157 for the chlorophenoxy herbicides. Samples
were digested for mercury analysis on October 21, 2002 in QC Batch Hg-1112 and digested
for the other metals in QC Batch SD-230 on October 10, 2002. The data for these analyses
are reported here.
Analysis Request Standard Operating Procedures
The samples were analyzed for particle size distribution following the protocol contained in
the following SOPs used at GERG: SOP-8908.
Sediment Grain Size Analyses – Gravel, Sand, Silt, Clay only. Rev 2 as of May 27, 1992.
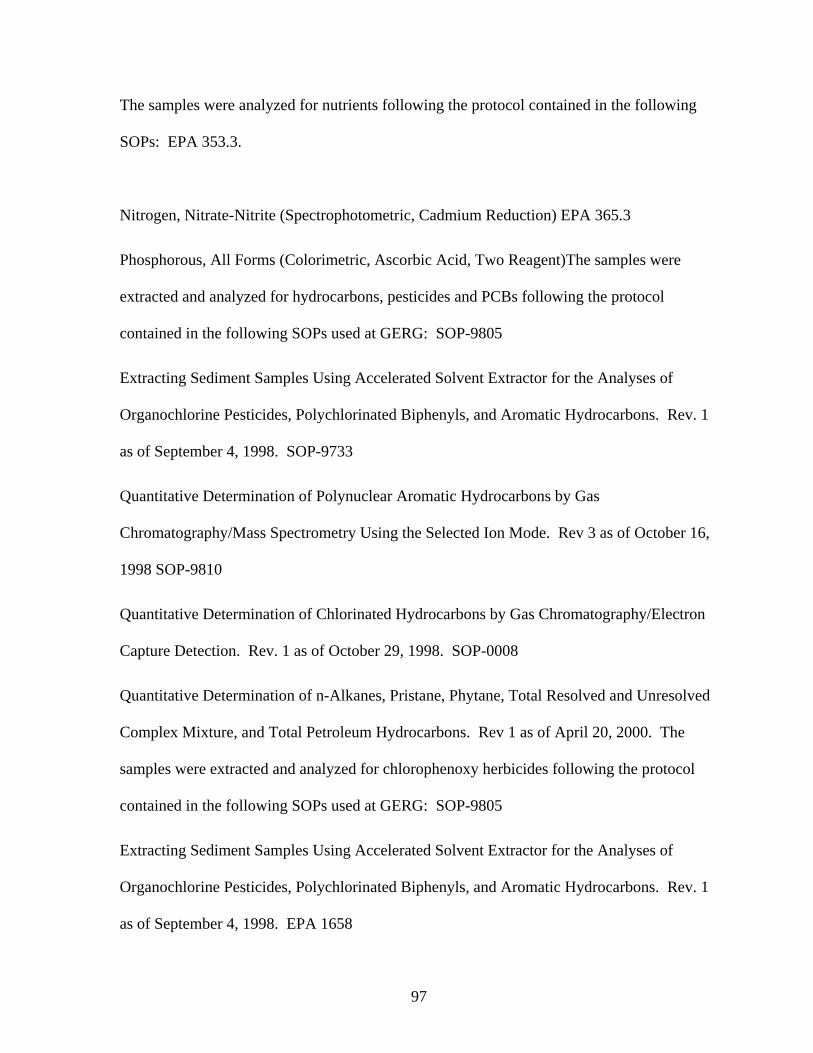
97
The samples were analyzed for nutrients following the protocol contained in the following
SOPs: EPA 353.3.
Nitrogen, Nitrate-Nitrite (Spectrophotometric, Cadmium Reduction) EPA 365.3
Phosphorous, All Forms (Colorimetric, Ascorbic Acid, Two Reagent)The samples were
extracted and analyzed for hydrocarbons, pesticides and PCBs following the protocol
contained in the following SOPs used at GERG: SOP-9805
Extracting Sediment Samples Using Accelerated Solvent Extractor for the Analyses of
Organochlorine Pesticides, Polychlorinated Biphenyls, and Aromatic Hydrocarbons. Rev. 1
as of September 4, 1998. SOP-9733
Quantitative Determination of Polynuclear Aromatic Hydrocarbons by Gas
Chromatography/Mass Spectrometry Using the Selected Ion Mode. Rev 3 as of October 16,
1998 SOP-9810
Quantitative Determination of Chlorinated Hydrocarbons by Gas Chromatography/Electron
Capture Detection. Rev. 1 as of October 29, 1998. SOP-0008
Quantitative Determination of n-Alkanes, Pristane, Phytane, Total Resolved and Unresolved
Complex Mixture, and Total Petroleum Hydrocarbons. Rev 1 as of April 20, 2000. The
samples were extracted and analyzed for chlorophenoxy herbicides following the protocol
contained in the following SOPs used at GERG: SOP-9805
Extracting Sediment Samples Using Accelerated Solvent Extractor for the Analyses of
Organochlorine Pesticides, Polychlorinated Biphenyls, and Aromatic Hydrocarbons. Rev. 1
as of September 4, 1998. EPA 1658

98
The Determination of Phenoxy-Acid Herbicides in Municipal and Industrial Wastewater.
August 1993. The samples were digested and analyzed for metals following the protocol
contained in the following SOPs used at GERG: SOP-0203
Digestion of Sediment, Soil and Geological Samples Prior to Mercury Analysis Using the
Cold Vapor Atomic Absorption Technique. Rev 1 as of May 21, 2002 SOP-0204
Digestion of Sediment or Soil for the Determination of Total Recoverable Trace Metals. Rev
1 as of May 21, 2002. SOP-9802
Standard Operating Procedure for Trace Metal Analysis Using Inductively Coupled Plasma
(ICP) Emission Spectroscopy. Rev 1 as of June 3, 1998. SOP –0201
Determination of Trace metals by Graphite Furnace Atomic Absorption Spectrometry. Rev 1
as of February 6, 2002. SOP-0202
Determination of Mercury by Cold vapor Atomic Absorption Spectrometry. Rev 1 as of
March 22, 2002.
SOP Modifications
None noted.
Quality Control
Laboratory Qualifiers
All of the analytical data have been qualified based on the most recent method
detection limits determined. Concentrations that were less than the MDL, which are adjusted
for sample size and dilution, are qualified “J”. Those analytes not detected are qualified
“ND”. Concentrations that exceeded the calibration limits are qualified “EC”. The

99
concentrations that are determined by analyses of a diluted aliquot are qualified “D”. If the
quantification of an analyte is interfered with by another analyte due to its high concentration
the data will be left blank and qualified “I” to denote this interference. Analytes may be
found above the three times the detection limits in the blank. These may cause possible
contamination in samples that are less than ten times the observed level in the blank. These
data are qualified “B” to denote this possible contamination.
Analytical Difficulties
Bulk Parameters
For the particle size determination, two duplicates were chosen. The relative percent
differences (RPD) for the duplicate pairs were within the QC limits of +/- 25%. No action
was required. During the nutrient analyses, one duplicate was performed for each analyte.
The RPD were within the QC criteria of +/- 25%. A spiked blank was performed and the
recovery of the spike was within the QC limits of 75 to 125%. A laboratory control sample
was also analyzed. The recovery of this sample also was within the QC limits. No further
action was required.
Aliphatic and Aromatic Hydrocarbon Analyses
There were two samples with low recovery of d8-naphthalene. This surrogate can be
lost during concentration steps if there are low levels of hydrocarbons in the sample. In both
of these the levels of the low molecular weight hydrocarbons are low. This should not affect
the data since the samples are corrected for surrogate recovery. The other surrogates were
well within the QC criteria. The recoveries were qualified “Q’ to denote the variance. No
further action was taken.

100
For two other samples d12-chrysene had high recoveries. The ion ratios for this
compound did not match. The secondary ion was used to quantify the peaks that are based
on deuterated chrysene. The recoveries are qualified “I” to denote the interference. No
further action was taken.
No analytes were measured above the detection limits for the procedural blank
(GERG ID Q20703). No action was required.
The recoveries for matrix spike/matrix spike duplicate of sample CBA1 (GER Ids
Q20704 and Q20705) met the QC criteria of 40 to 120% for all but 2 analytes, n-C30 and n-
C34. The peaks were checked for possible interference, but none was found. Several spiked
analytes in the aromatic hydrocarbon (PAH) analysis were invalid due to the concentrations
of these analytes in the original sample. These analytes are qualified “I” to denote the
interference from the native concentrations in the sample. The overall QC objective was met
with average recovery of 106.4 and 105.5% for the aliphatic analyses and 86.7 and 102.1 for
the PAH analyses. The RPD of the duplicate spikes were 3.8 and 21.4. These meet the
overall QC objectives. No further action was required.
The GERG STD Oil 2000 (REF Oil) is run on the instrument prior to each analytical
batch. The sample is a solution of petroleum oil in methylene chloride with a concentration
of about 800 mg/milliliter of solution. The analysis (GERG Ids W00943 for aliphatics and
W42925 for PAHs) were compared to the running average for the laboratory for all single
analyte peaks, which are primarily alkanes and non-alkylated PAH analytes. The control
limits for the GERG STD Check samples (REF Oil) are +/- 35% of the laboratory average for
each single component analyte. No control limits are applied to the alkylated PAH
homologue clusters (multi-peak analytes) because the variation in the analytical results (and

101
associated uncertainty) increases with increased alkylation and increased number of
homologues within the cluster. This effect can be seen in the data table that includes the
laboratory average and one standard deviation for each analyte. All analytes were with the
prescribed QC limits. No action was required.
Pesticide and PCB Analysis
Three analytes were measured above the detection limits, but less than three times the
MDL, in the procedural blank (GERG ID Q20703). These peaks were qualified “<3xMDL”
to denote this variance. No further action was required.
The recoveries for matrix spike/matrix spike duplicate of sample CBA1 (GER Ids
Q20704 and Q20705) met the QC criteria of 40 to 120% for all analytes. The overall QC
objective was met with average recovery of 84.5 and 95.9%. The RPD of the duplicate
spikes was 12.7%. This met the overall QC objectives. No further action was required.
The PCB Mix (REF) is run on the instrument at the end of each analytical batch. The
sample is a solution of known amounts of four aroclors in hexane. The analysis (GERG ID
S16049) was compared to the running average for the laboratory. The control limits for the
PCB Mix samples (REF) are +/- 35% of the laboratory average for each analyte. All
analytes, except PCB 105 were with the prescribed QC limits. The peak was checked but no
improvement was found. The data is qualified to denote this variance. No further action was
taken.
Chlorophenoxy-Acid Herbicide Analysis

102
No analytes were measured above the detection limits in the procedural blank (GERG
ID Q20703). No action was required.
A duplicate analysis was performed on sample CBA11 (GERG ID Q20704). No
RPD was determined since all analytes are near or below detection limits. No action was
required.
The recoveries for matrix spike of sample CBA11 (GERG ID Q20705) did not meet
the QC criteria of 30 to 120% for all analytes. Two analytes had poor recovery. The spike
level was too low. The samples should have been spiked at a level 10 times the detection
limit. In this case the level was 2 times the detection limits. On review of the date, there is
the possibility that these 2 analytes may not be recovered from this type of matrix well.
GERG has seen this with other herbicides and estuarine sediments. The recoveries were
qualifies “Q” to denote the variance. No further action was taken.
Trace Metal Analysis
No analytes were measured above the detection limits in the procedural blank (GERG
Ids I3945 and I3951). No action was required.
Recovery of all spiked analytes in spiked blanks (GERG Ids I3946 and I3952) met the
QC criteria. No action was required.
A duplicate analysis was performed on sample CBA13 (GERG ID C42423D). The
RPD were within the QC criteria of +/- 25% for all analytes except Thallium. Several
analytes, including thallium were below the detection limits. No action was required.

103
The recoveries for matrix spike of sample CBA13 (GERG ID C42423S) did meet the
QC criteria of 30 to 120% for all analytes. No further action was required.
The recovery of certified values for NRCC MESS-3 (GERG Ids I3947 and I3953)
and NIST 1944 (GERG Ids I3948 and I3954) were within the normal +/-35% QC limits for
most analytes. The certified values are based on a total digest and these samples were
digested by a total recoverable method. The levels measured are consistent with our method
and historical data for these SRMs. Since the overall QC objectives were achieved, no
further action was taken.
No further variances or difficulties were observed.


