security analysis.ppt
29
SECURITY ANALYSIS Presented by: S.Anusha V. Jyothsna sowgandhi MIC College of Technology
-
Upload
anusha-sunkara -
Category
Documents
-
view
321 -
download
4
Transcript of security analysis.ppt
SECURITY ANALYSIS
Presented by:
S.Anusha
V. Jyothsna sowgandhi
MIC College of Technology

CONTENT
• Introduction to stock exchange
• Security meaning
• Types of securities
• Security analysis types – fundamental analysis– Technical analysis
• Conclusion
STOCK MARKET
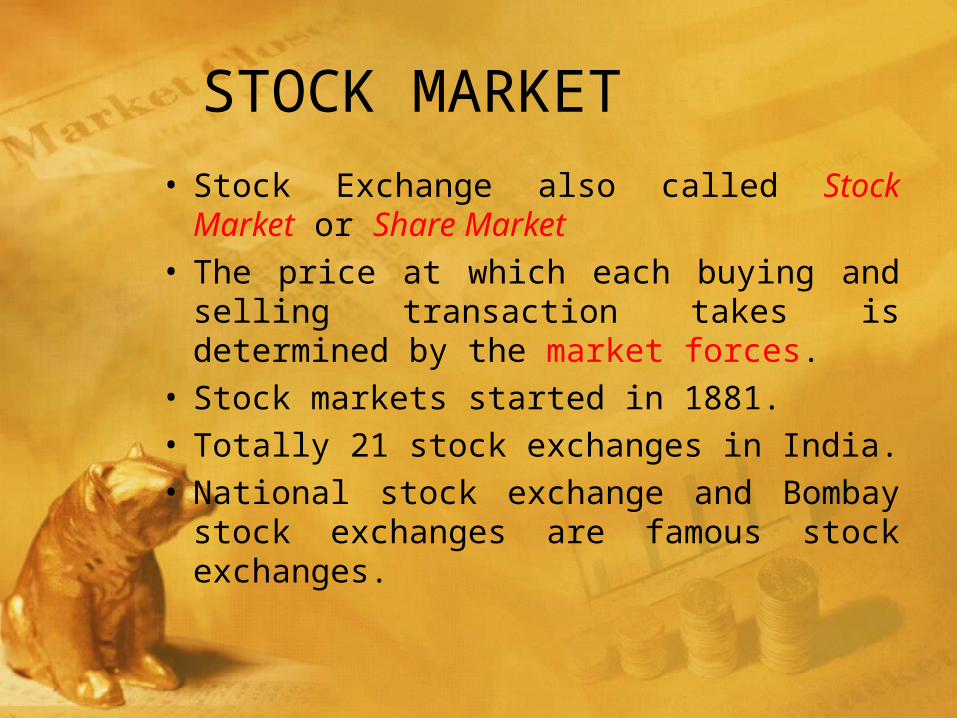
• Stock Exchange also called Stock Market or Share Market
• The price at which each buying and selling transaction takes is determined by the market forces.
• Stock markets started in 1881.• Totally 21 stock exchanges in India.• National stock exchange and Bombay stock
exchanges are famous stock exchanges.

TYPES OF SECURITIES

EQUITY SHARE CERTIFICATE
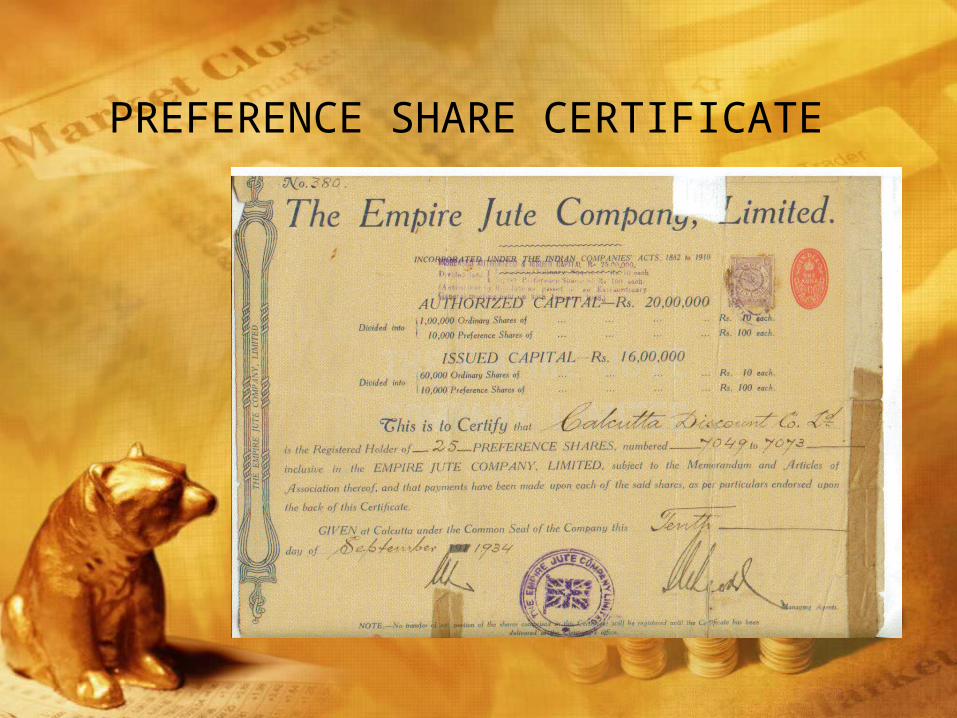
PREFERENCE SHARE CERTIFICATE
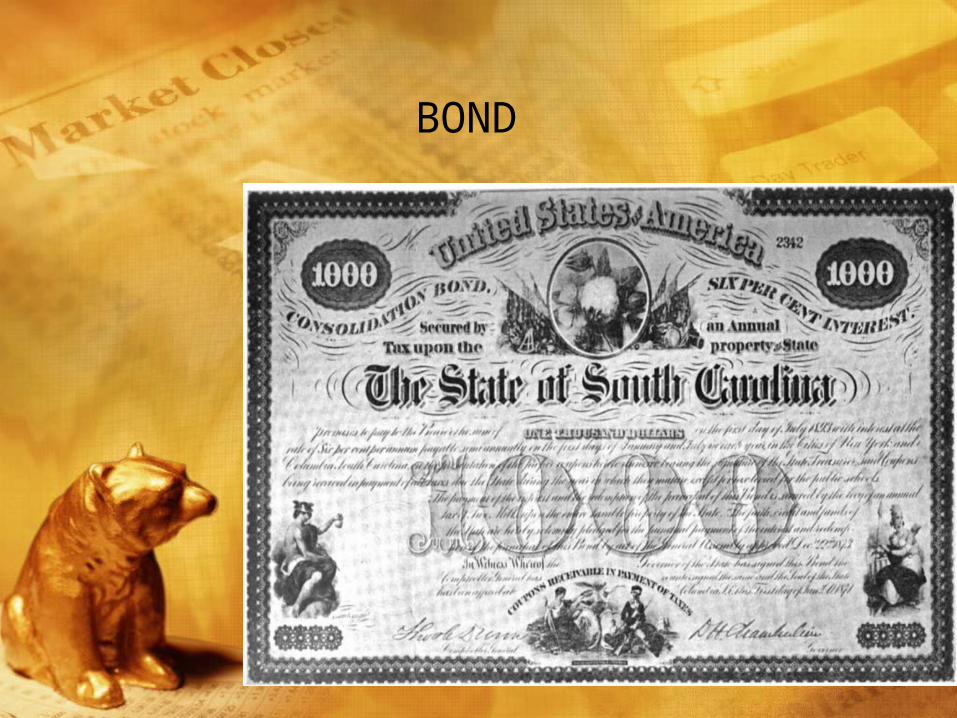
BOND
DEBENTURE
DERIVATIVES

SECURITY ANALYSIS
• The analysis of various tradable financial instruments is called security analysis.
• It is the initial phase of the portfolio management process.
• This step consists of examining the risk-return characteristics of individual securities.
• Buy under priced securities and sell over priced securities.

TYPES OF SECURITY ANALYSIS
FUNDAMENTAL ANALYSIS
• It is a logical and systematic approach to estimating the future dividends and share price.
• It is based on the basic premise that share price is determined by a number of fundamental factors.
• The fundamental factors are relating to EIC analysis framework

EIC analysis framework
ECONOMY ANALYSIS
• Factors including while making economy analysis
– GDP
– Interest rates
– Inflation
– Exchange rates
– Government revenue , expenditure and deficits
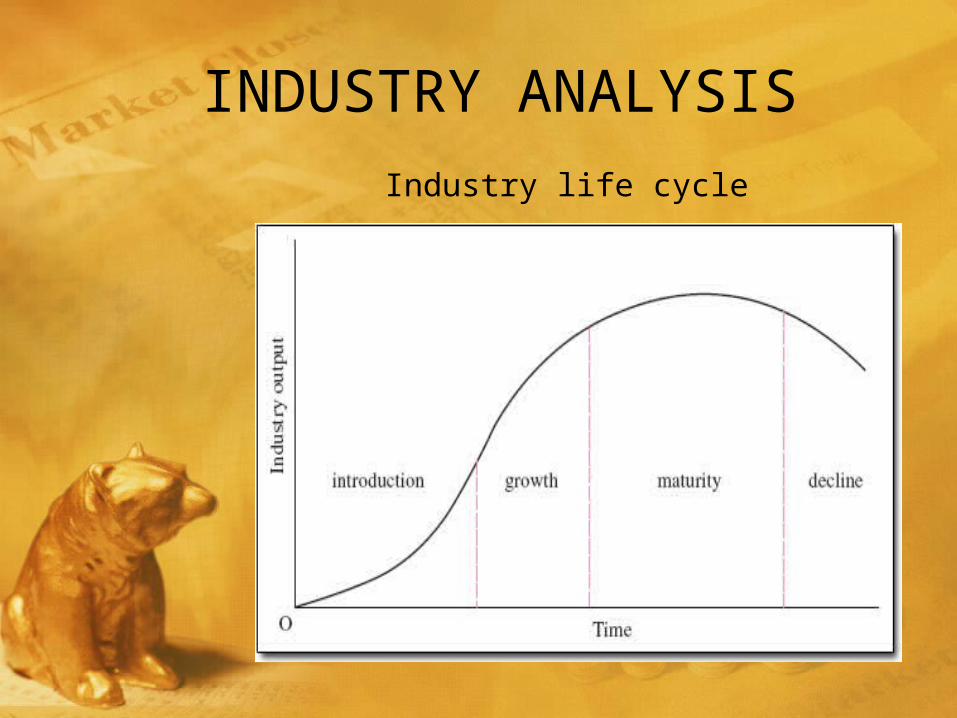
INDUSTRY ANALYSIS
Industry life cycle

• There are 24 sectors in Indian industry. They are– Banking sector
– Information technology sector
– Pharmaceutical sector
– Agriculture sector
– Real estate sector
– Telecommunication sector
– Textiles sector
– Media sector
– Auto mobile sector etc….

COMPANY ANALYSIS
[Factors that affect present and future values]
TECHNICAL ANALYSIS
• A technical analyst tries to identify the historical patterns from the chart, based on this he/she is going to forecast the future price movement.
• stages in technical analysis:– Collecting data
– Represent in charts
– Evaluation of historical patterns
– Forecasting the prices
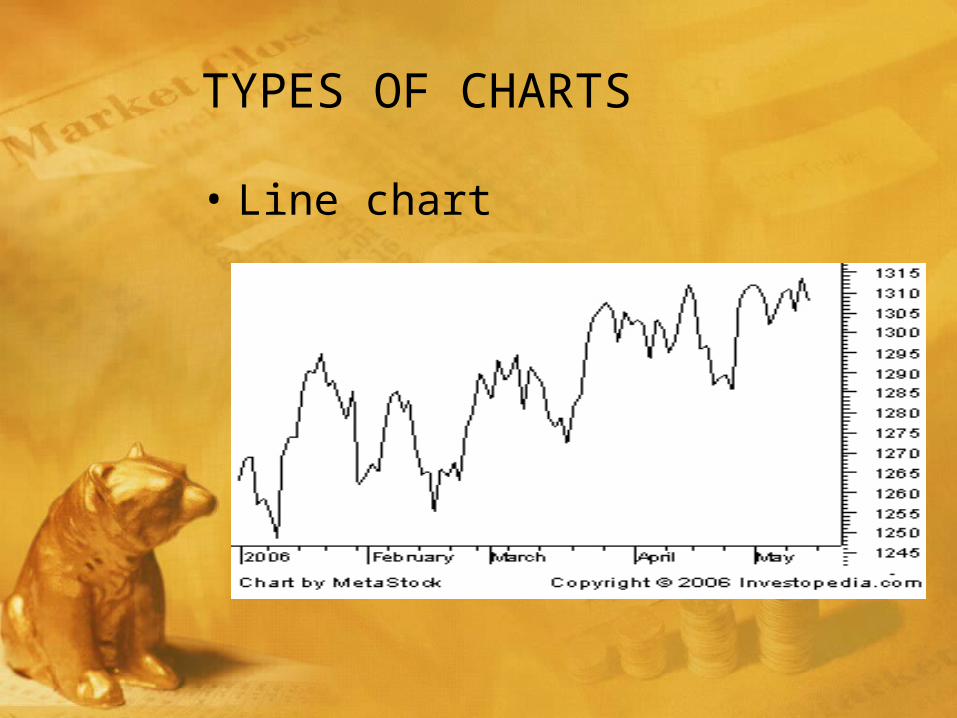
TYPES OF CHARTS
• Line chart

Bar charts

A candlestick chart
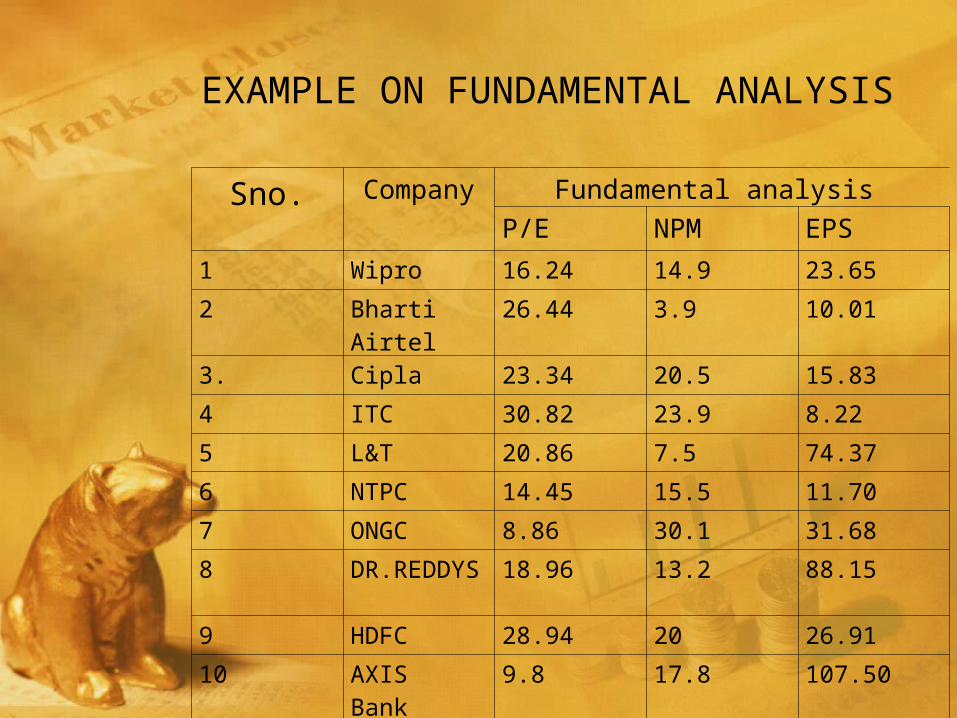
EXAMPLE ON FUNDAMENTAL ANALYSIS
Sno. Company Fundamental analysis
P/E NPM EPS
1 Wipro 16.24 14.9 23.65
2 Bharti Airtel 26.44 3.9 10.01
3. Cipla 23.34 20.5 15.83
4 ITC 30.82 23.9 8.22
5 L&T 20.86 7.5 74.37
6 NTPC 14.45 15.5 11.70
7 ONGC 8.86 30.1 31.68
8 DR.REDDYS
18.96 13.2 88.15
9 HDFC 28.94 20 26.91
10 AXIS Bank 9.8 17.8 107.50

• Profit volume ratio (P/E ratio):-
Market price /Earnings per share(EPS)
• Earnings per share(EPS):-
Net Profit Available To Equity Shareholders/ Number Of Shareholders

EXAMPLE ON TECHNICAL ANALYSIS
Date Open Price High Price Low Price Close Price
14-Aug-12 356 357.55 352.4 355.5
16-Aug-12 354.2 354.7 347 349.4
17-Aug-12 349.4 354.5 346.5 353.5
21-Aug-12 350.65 358.5 350.65 355.75
22-Aug-12 355 357.45 350.25 354.5
23-Aug-12 355.65 366.75 355.65 363.1
24-Aug-12 362.95 366.5 360.25 365.1
27-Aug-12 366.5 366.85 360.05 361.25
28-Aug-12 360.5 365 359 363.65
29-Aug-12 364 369 361.5 364.15
30-Aug-12 364 370 362.1 369
31-Aug-12 369 372.5 360.55 362.6

3-Sep-12 362.9 372.5 361.65 364.2
4-Sep-12 363 366 360.4 363.05
5-Sep-12 361 364 357.7 362.1
6-Sep-12 362.5 379 360.7 377.45
7-Sep-12 381.5 384.8 376.9 377.8
8-Sep-12 378.5 382.6 378.5 380.75
10-Sep-12 380 382.3 375 376.45
11-Sep-12 373.5 377 372.1 374.85
12-Sep-12 377.25 386 375.3 384.55
13-Sep-12 387.1 389.35 385.5 387.9
14-Sep-12 395.95 395.95 387.55 391.55

CONCLUSION
• Both analysis are very essential to analysis the securities. Fundamental analysis gives good results comparatively technical analysis.
• If investor wants to invest his amount on long term bases he got for fundamental analysis.
• Then investor may get good amount of return.